Synaptotagmin 7 is targeted to the axonal plasma membrane through γ-secretase processing to promote synaptic vesicle docking in mouse hippocampal neurons
- Department of Neuroscience, University of Wisconsin-Madison, United States
- Howard Hughes Medical Institute, United States
- Department of Cell Biology, Johns Hopkins University, School of Medicine, United States
- Biochemistry, Cellular and Molecular Biology Graduate Program, Johns Hopkins University, School of Medicine, United States
- Solomon H. Snyder Department of Neuroscience, Johns Hopkins University, School of Medicine, United States
Figures
Figure 1 with 1 supplement

SYT7 influences presynaptic neurotransmitter release during short-term synaptic plasticity.
(a) Representative super-folder iGluSnFR S72A (hereon iGluSnFR) traces from single-stimulus experiments. Lighter traces are individual regions of interest (ROIs) and dark bold traces are the average of all light traces from a full field of view (FOV); the single stimulus is denoted with an arrow. Wild-type (WT) are denoted in black and gray, and SYT7KO are represented in red and light red; same scheme applies throughout the figure. (b) Peak iGluSnFR signals between WT (0.203 [95% CI 0.154–0.244] ΔF/F0) and SYT7KO (0.245 [95% CI 0.160–0.308] ΔF/F0). Values are medians with 95% CI representing error, Mann-Whitney test, p = 0.4554, each n is a separate FOV (n = 32 (WT) and 34 (SYT7KO) from four independent experiments). (c) Fraction of synchronous release, defined as peak iGluSnFR signals arriving within 10 ms of stimulus from total release of 500 ms following the stimulus, compared between WT (0.9522 [95 % CI 0.902–0.965]) and SYT7KO (0.9808 [95% CI 0.943–0.993]). Data from the same n as in (b). Values are medians with 95% CI representing error, Mann-Whitney test, *p = 0.0326. (d) Average +/- standard deviation traces from paired-pulse ratio (PPR) experiments with four interstimulus intervals compared; n = 14 (WT 20 Hz), 14 (WT 10 Hz), 15 (WT 5 Hz), 13 (WT 2 Hz), 15 (SYT7KO 20 Hz), 13 (SYT7KO 10 Hz), 14 (SYT7KO 5 Hz), 13 (SYT7KO 2 Hz) from three independent experiments. (e) Quantification of PPR (peak iGluSnFR ΔF/F0) from WT and SYT7KO; values are means +/- SEM. ****p<0.0001, **p = 0.0012, by two-way analysis of variance (ANOVA) with Sidak’s multiple comparisons test; full statistics are provided in Figure 1—source data 1. (f) Quantification of fractional active synapses, that is, the number of synapses demonstrating peak release above baseline during the second stimulus relative to the first of a paired pulse. Values are means +/- SEM. **p = 0.0052, **p = 0.0099, and *p = 0.0289, in order from left to right, by two-way ANOVA with Sidak’s multiple comparisons test; full statistics are provided in Figure 1—source data 2. (g) Relative frequency histograms of PPR from all ROIs quantified from PPR trials, 20 Hz, 10 Hz, 5 Hz, 2 Hz, WT, and SYT7KO. Vertical dotted line delineates a PPR of 1.
-
Figure 1—source data 1
Statistic summary using two-way ANOVA with Sidak’s multiple comparisons test for quantification of PPR (peak iGluSnFR ΔF/F0) from WT and SYT7KO.
- https://cdn.elifesciences.org/articles/67261/elife-67261-fig1-data1-v1.docx
-
Figure 1—source data 2
Statistic summary using two-way ANOVA with Sidak’s multiple comparisons test for quantification of fractional active synapses, that is, the number of synapses demonstrating peak release above baseline during the second stimulus relative to the first of a paired pulse.
- https://cdn.elifesciences.org/articles/67261/elife-67261-fig1-data2-v1.docx
Figure 1—figure supplement 1
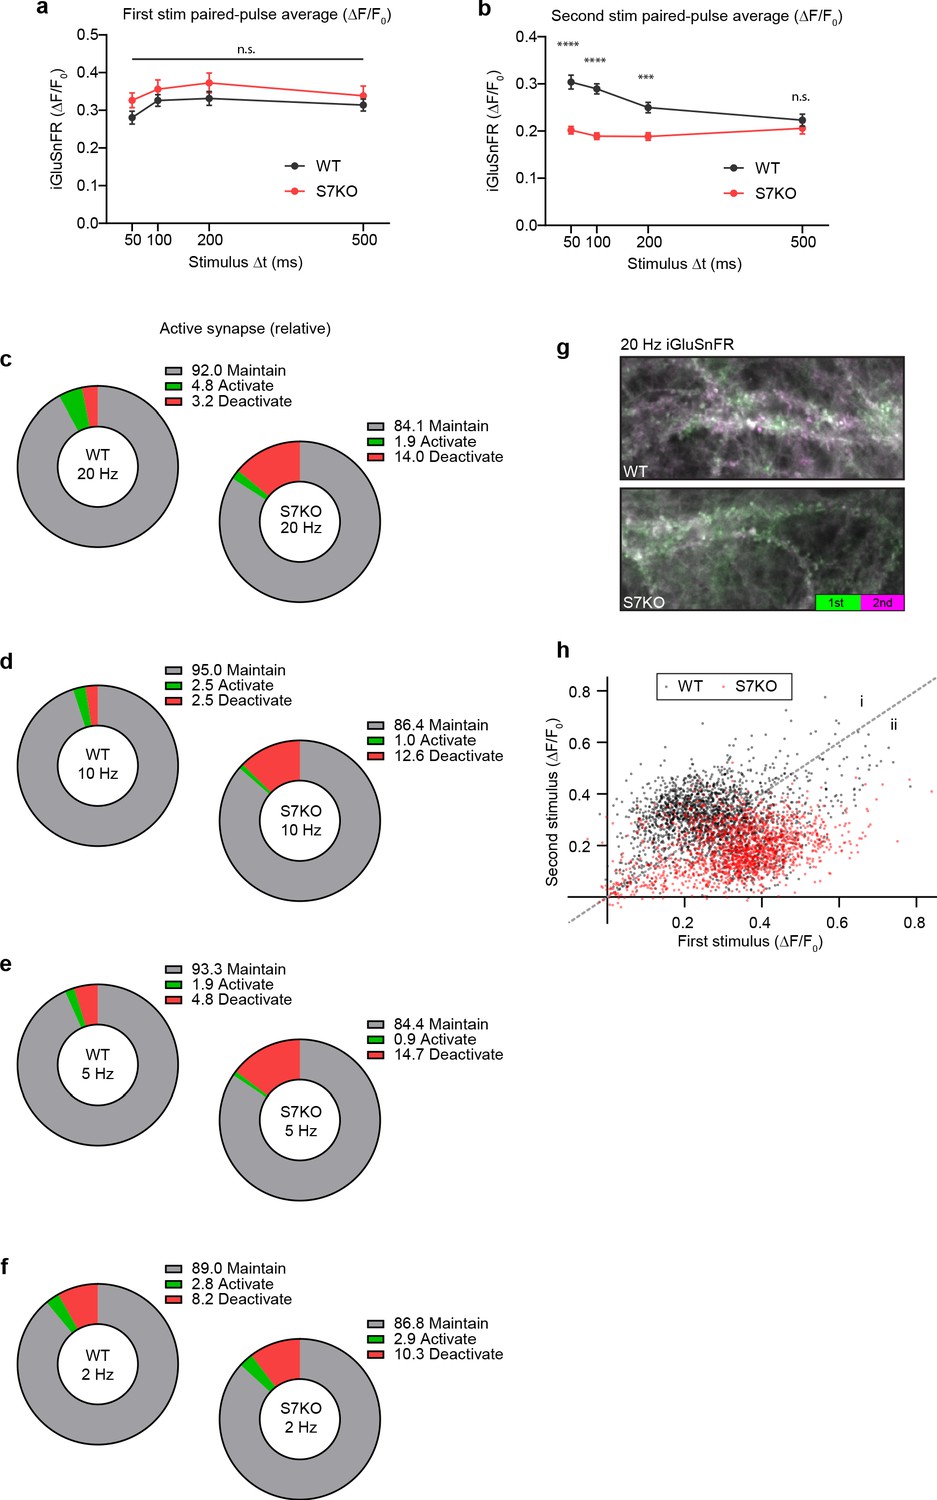
Extended analysis of paired-pulse measurements.
(a) Quantification of iGluSnFR ΔF/F0 peaks from first stimulation during paired-pulse ratio (PPR) trials. No difference in initial release between any stimulation parameter was noted. Values are means +/- SEM. (b) Quantification of iGluSnFR ΔF/F0 peaks from second stimulation during PPR trials. Values are means +/- SEM. ****p<0.0001, ***p = 0.0004, by two-way analysis of variance (ANOVA) with Sidak’s multiple comparisons test; full statistics are provided in Figure 1—figure supplement 1—source data 1. (c–f) Pie charts showing the percentage of regions of interest (ROIs) that either maintain (gray), activate (green), or deactivate (red) glutamate release in response to an initial stimulus at the labeled stimulation frequencies. Criteria for glutamate release were based on iGluSnFR ΔF/F0 peak amplitude in relation to baseline noise (>4 SD above noise). (g) Representative images of wild-type (WT) (top) and SYT7KO (bottom) iGluSnFR change in fluorescence in response to two stimuli 50 ms apart (20 Hz). Images are max t-projections of temporally color-coded timeseries. Fluorescence from the first stimulus is coded in green (0–50 ms post-stimulus) and the fluorescence from the second stimulus is coded in purple (50–100 ms post-stimulus). (h) Scatterplot from 20 Hz data of first stimulus peak (X) by second stimulus peak (Y), WT (black), and SYT7KO (red). Population scatter illustrates the difference between WT and SYT7KO ROIs where WT ROIs are grouped predominantly in area (i) because the second stimulus results in facilitation, whereas SYT7KO groups in (ii) because of loss of facilitation.
-
Figure 1—figure supplement 1—source data 1
Statistic summary using two-way ANOVA with Sidak’s multiple comparisons test for quantification of iGluSnFR ΔF/F0 peaks from second stimulation during PPR trials.
- https://cdn.elifesciences.org/articles/67261/elife-67261-fig1-figsupp1-data1-v1.docx
Figure 2 with 1 supplement
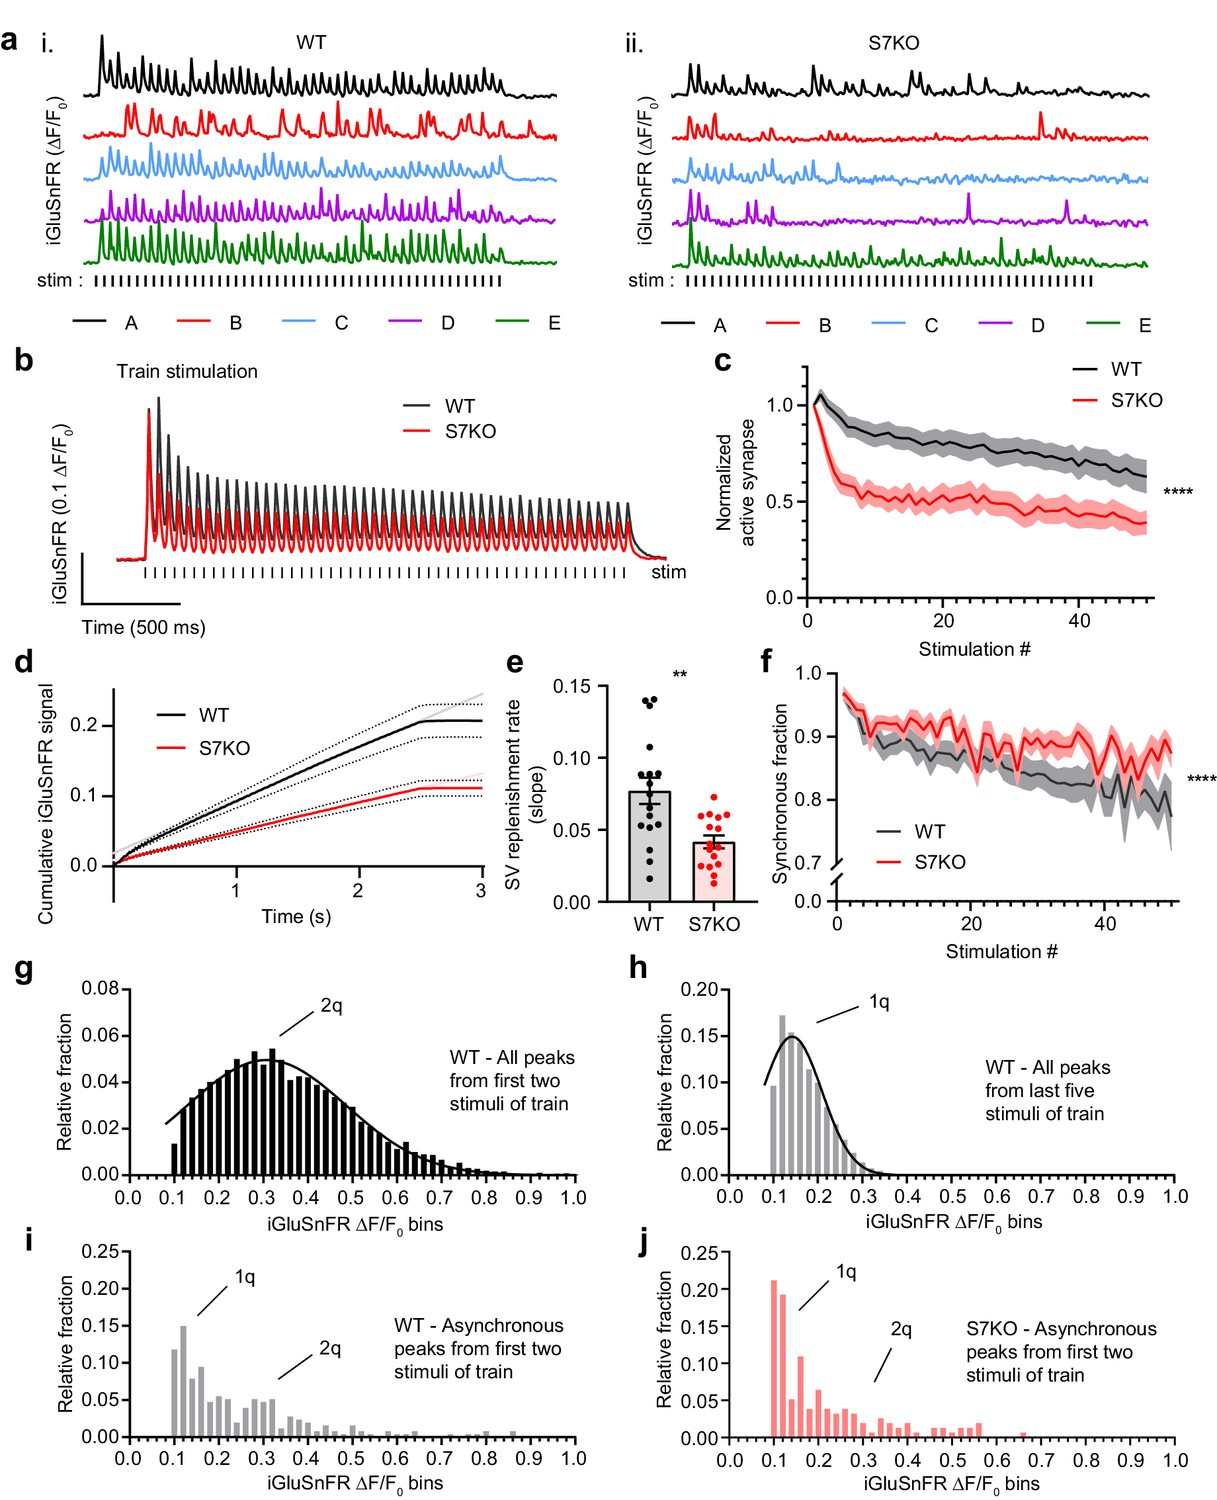
SYT7 counteracts depression and promotes asynchronous release during sustained stimulation.
(a) Representative traces of iGluSnFR ΔF/F0 signals (single regions of interest (ROIs) A-E), from one full field of view (FOV) during high-frequency stimulation (HFS) of wild-type (WT) (i) and SYT7KO (ii) neuronal preparations. Samples were field stimulated with a frequency of 20 Hz for 2.5 s (50 action potentials (APs)). (b) Average iGluSnFR ΔF/F0 traces during high-frequency stimulation (HFS) for WT (black, n = 17) and SYT7KO (red, n = 16), from three independent experiments (same source data for b–f). (c) Fraction of active synapses, defined as synapses releasing peak glutamate above baseline, >4 SD above noise, as a function of stimulation number during HFS. Values are means (lines) +/- SEM (lighter shade error), ****p<0.0001 by two-way analysis of variance (ANOVA) comparing genotypes. (d) Plot of the average cumulative iGluSnFR ΔF/F0 signal from WT (black) and SYT7KO (red) neurons vs time. Dotted lines represent SEM and gray (WT) and light red (SYT7KO) linear lines represent linear fits to the last 1.5 s of the train. (e) Synaptic vesicle (SV) replenishment rates were calculated from slopes of linear regressions from individual traces used in panel (d). Values are means +/- SEM, WT (0.077 +/- 0.009) and SYT7KO (0.042 +/- 0.004); **p = 0.0019 using unpaired two-tailed t-test. (f) Fraction of synchronous release, defined as peak iGluSnFR ΔF/F0 within 10 ms of each stimulus from the total interstimulus interval, as a function of stimulation number during HFS. Values are means (bold lines) +/- SEM (lighter shade fill); ****p<0.0001 by two-way ANOVA comparing genotypes. (g) Quantal analysis using all detected iGluSnFR peaks (n>6000) from the first two stimuli of a 20 Hz train from WT neurons binned into 0.02 ΔF/F0. (h) Quantal analysis using all detected iGluSnFR peaks (n>10,000) from the last five stimuli of a 2.5-s 20 Hz train from WT neurons. (i) Quantal analysis using asynchronous iGluSnFR peaks (n = 254) from the first two stimuli of a train from WT neurons. (j) Quantal analysis using asynchronous iGluSnFR peaks (n = 156) from the first two stimuli of a train from S7KO neurons (asynchronous is defined as iGluSnFR peaks that occur more than 10 ms after a stimulus, but before the proceeding stimulus). Gaussian distributions were generated with no restrictions in panels (g) and (h). In panels (i) and (j), 1q and 2q labels were added based on the mean values from panels (g) and (h). From panel (g), mean (2q) = 0.31 [95% CI 0.30–0.32] and from panel (h), mean (1q) = 0.14 [95% CI 0.14–0.15]. WT asynchronous vs S7KO asynchronous distributions in panels (i) and (j) are different by Kolmogorov-Smirnov test; approximate p-value = 0.005 with K-S D = 0.1760.
Figure 2—figure supplement 1
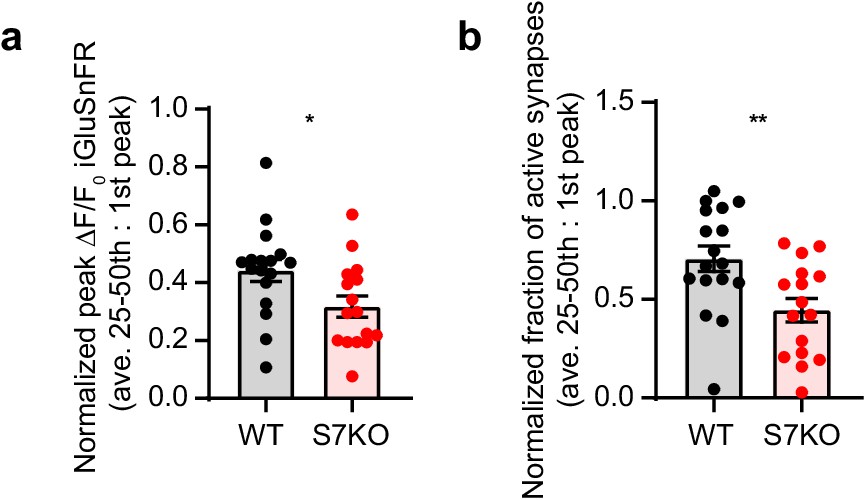
Extended analyis of HFS experiments.
(a) Quantification of depression as a measure of average active synapses from the 25th to the 50th stimulus normalized to the first stimulus. Same data set as in Figure 2b–f. Wild-type (WT) (0.71 +/- 0.06) and SYT7KO (0.45 +/- 0.06), values are mean +/- SEM and **p = 0.0058 using unpaired two-tailed t-test. (b) Quantification of depression as a measure of average peak iGluSnFR ΔF/F0 from the 25th to the 50th stimulus normalized to the first stimulus. Same data set as in Figure 2b–f. WT (0.44 +/- 0.04) and SYT7KO (0.32 +/- 0.04), values are mean +/- SEM and *p = 0.0256 using unpaired two-tailed t-test.
Figure 3

SYT7 enhances synaptic vesicle docking after stimulation.
Representative electron micrographs of high-pressure frozen (a) wild-type (WT) and (b) SYT7KO synapses from labeled conditions. Scale bar = 100 nm. (c) Quantification of docked vesicle number normalized to 300 nm of active zone at rest, after stimulation with 1 action potential (AP) or 50 APs, and then frozen at 5 ms or 5 s post-stimulus. Docked vesicles are defined in high-pressure frozen samples as being in contact with the plasma membrane at the active zone (0 nm between the plasma membrane and vesicle membrane). WT conditions are in black to gray and SYT7KO conditions are in red to pink. Values are means +/- 95% CI and are from three biological replicates and over 300 n per condition (n = individual 2D electron microscopy (EM) images). All comparisons and summary statistics are provided in Figure 3—source data 1; ****p<0.0001, ***p<0.001, **p<0.01, and *p = 0.05, by Kruskal-Wallis test with Dunn’s multiple comparison correction. (d) Quantification of vesicle number per 2D synaptic profile at rest, after stimulation with 1 AP or 50 APs, and then frozen at 5 ms post-stimulus or 5 s post-stimulus. Values are means +/- 95% CI and are from three biological replicates and over 2500 individual 2D EM images. All comparisons and summary statistics are provided in Figure 3—source data 2; ****p<0.0001, ***p<0.001, **p<0.01, and *p = 0.05, by Kruskal-Wallis test with Dunn’s multiple comparison correction. (e) Quantification of synaptic vesicle (SV) number in relation to distance from active zone (az) up to 100 nm. Inset denoted with ‘#’ sign is enlarged to show SV distribution in close proximity to az. Values are means +/- SEM.
-
Figure 3—source data 1
Statistic summary using Kruskal-Wallis test with Dunn’s multiple comparison correction for quantification of docked vesicle number normalized to 300 nm of active zone.
- https://cdn.elifesciences.org/articles/67261/elife-67261-fig3-data1-v1.docx
-
Figure 3—source data 2
Statistic summary using Kruskal-Wallis test with Dunn’s multiple comparison correction for quantification of vesicle number per 2D synaptic profile.
- https://cdn.elifesciences.org/articles/67261/elife-67261-fig3-data2-v1.docx
Figure 4 with 3 supplements
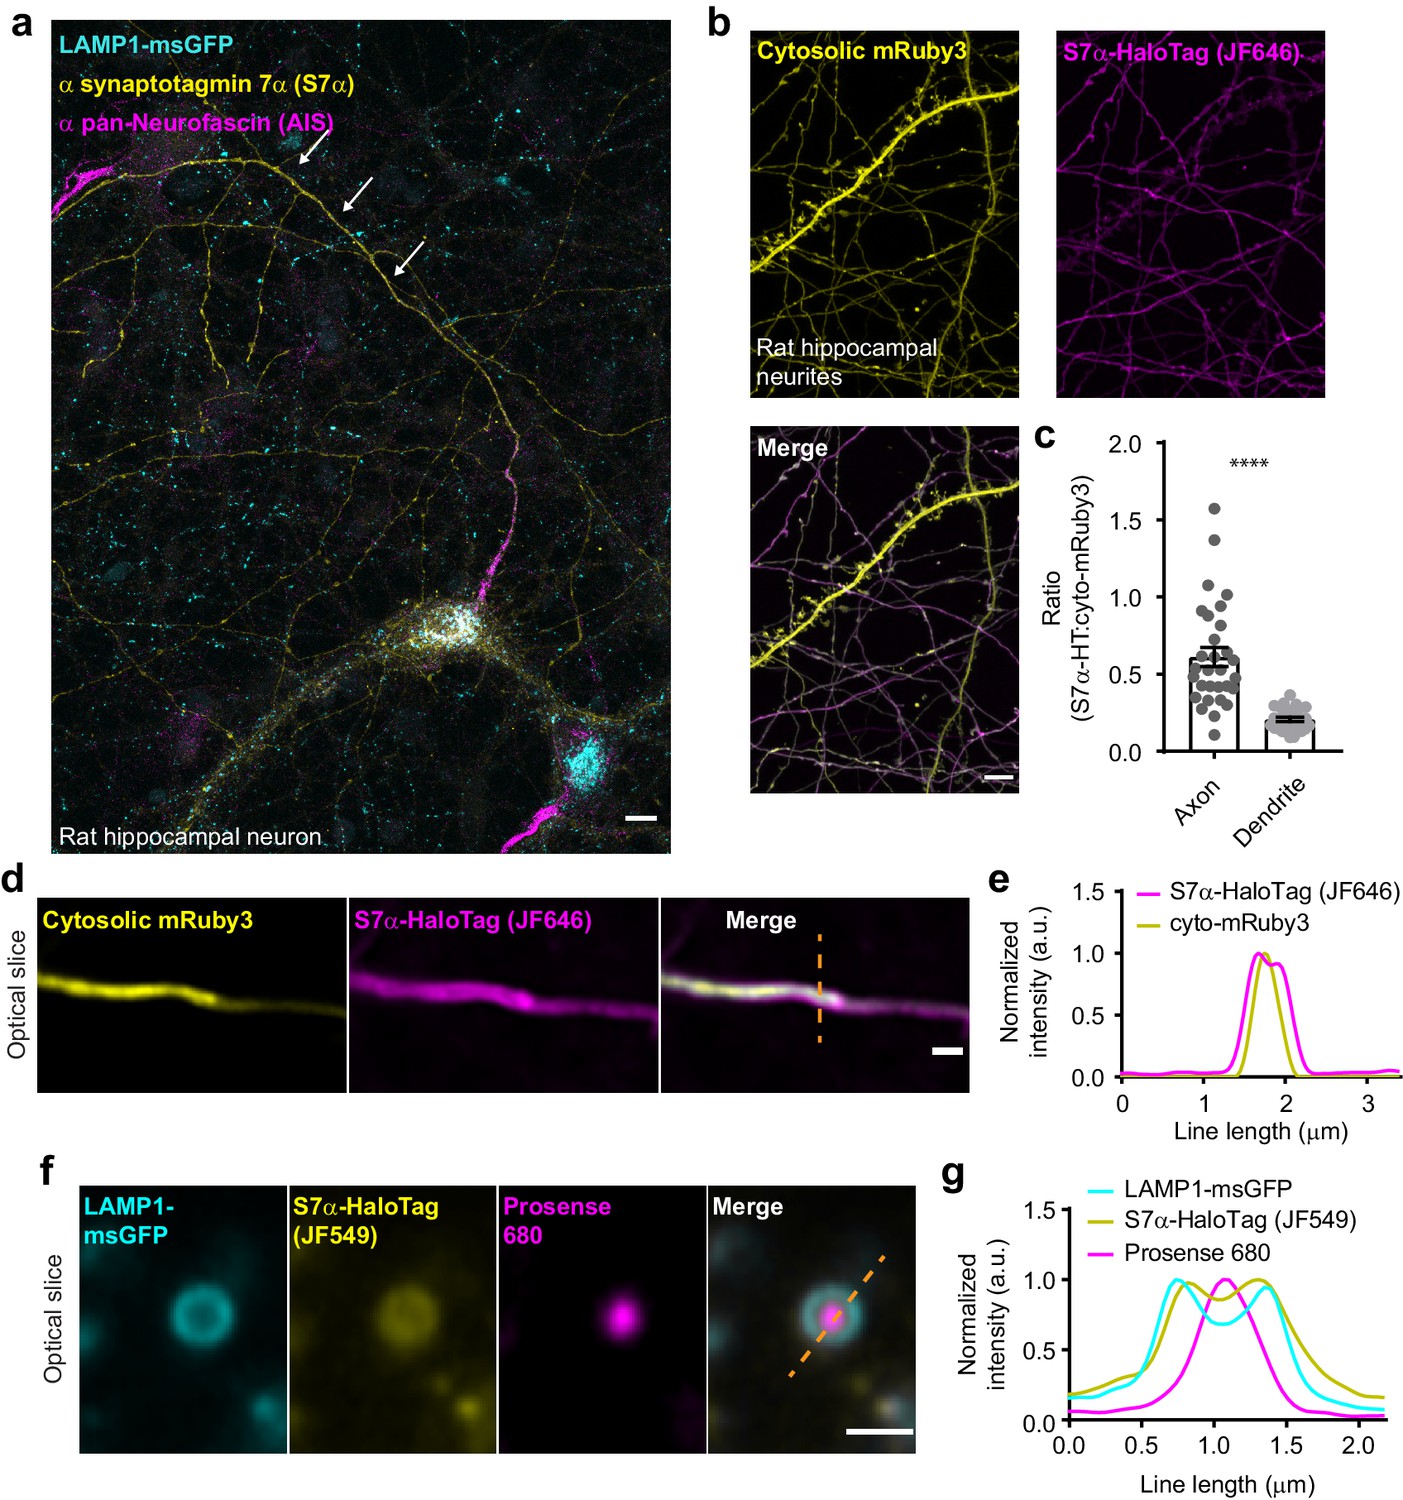
In hippocampal neurons, SYT7 is localized to both the axonal plasma membrane and LAMP1+ organelles that include active lysosomes.
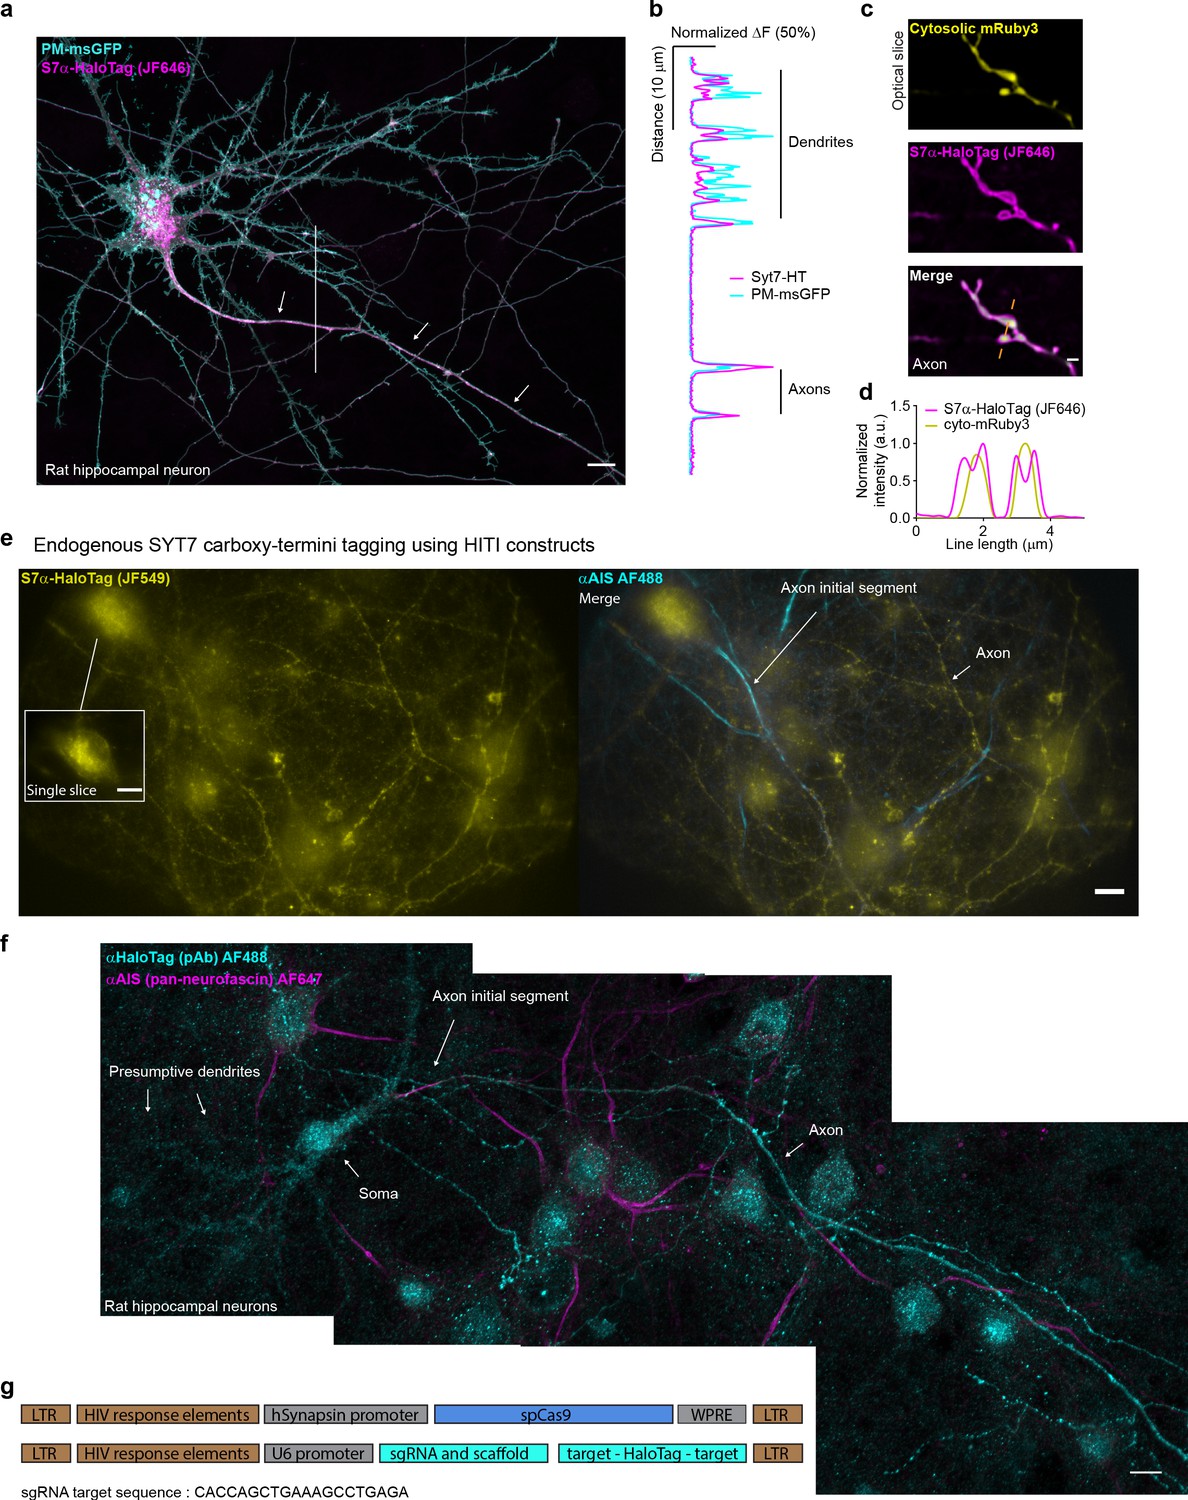
(a) Representative super-resolution fluorescent immunocytochemistry (ICC) image of rat hippocampal neurons at 15 days in vitro (DIV) expressing uniformly transduced LAMP1-msGFP and sparsely transduced, untagged SYT7α. These neurons were fixed and stained with antibodies to SYT7 (juxta-membrane region) and the axon initial segment (AIS) (anti pan-neurofascin). Scale bar = 5 μm. (b) Representative super-resolution images of cytosolically expressed mRuby3 (yellow/top left), SYT7α-HaloTag/JF646 (magenta/top right), and merged (bottom left). Scale bar = 5 μm. (c) Quantification of the ratio between fluorescent channels. Axonal ratio of SYT7-HaloTag:mRuby3 signal is 0.61 +/- 0.06, n = 30, while dendritic ratio is 0.21 +/- 0.01. Values are means +/- SEM from two independent experiments; p-value <0.0001 using unpaired two-tailed Welch’s t-test. (d) Representative super-resolution optical slice of an axon (identified via morphology) expressing cytosolic mRuby3 (yellow) and SYT7α-HaloTag/JF646 (magenta). Merged image also denotes the line used in panel (e). Scale bar = 1 μm. (e) Plot of the normalized intensity profile along the orange dashed line in panel (d). (f) Representative super-resolution optical slice of a somatic lysosome from a rat hippocampal neuron at 16 DIV expressing LAMP1-msGFP (cyan), SYT7α-HaloTag/JF549 (yellow), and incubated with 0.5 μM Prosense 680 (magenta) for 12 hr. Scale bar = 1 μm. Merged image also denotes the line used in panel (g). (g) Plot of the normalized intensity profile along the dashed orange line in panel (f).
Figure 4—figure supplement 1
SYT7 is asymetrically localized to the axon.
(a) Representative z-stack image of rat hippocampal neurons at 15 DIV transfected with a PM-msGFP P2A SYT7α-HaloTag construct, fixed and stained with HTL-JF646. As with Figure (3a), asymmetric axonal enrichment (indicated by white arrows), versus dendrites, is readily apparent. Scale bar = 10 μm. (b) Graph of the normalized intensity profile along the vertical white line drawn over dendrites and the axon in panel (a). Note: this is transient overexpression, so SYT7α-HaloTag is observable on the dendritic plasma membrane, but is still comparatively enriched in the axon. (c) Additional super-resolution optical slice of an axon (axonal varicosities) expressing cytosolic mRuby3 (yellow) and SYT7α-HaloTag (magenta). Merged image also denotes the line used in panel (d). (d) Graph of the normalized intensity profile along the line. Scale bar = 1 μm. (e) Representative max z-stack of a neuron from a coverslip exposed to SYT7 homology-independent targeted integration (HITI) lentiviruses. Neurons were incubated with HTL-JF549 (yellow) and anti-AIS (cyan), fixed, and imaged using highly inclined and laminated optical sheet (HILO) microscopy because the sample signal was very dim. Signal is present primarily in axons and irregular globular structures in the soma (left inset). (f) Representative tiled z-stacks showing neurons from coverslips exposed to SYT7 HITI lentiviruses and imaged using Airyscan confocal microscopy after conducting anti-HaloTag immunocytochemistry (ICC) to amplify the signal. Anti-HaloTag is shown in cyan and anti-AIS is shown in magenta; white arrows point to major features. (g) The constructs that were used are shown in a schematic form. Constructs were based on the pORANGE vector. pORANGE vectors were designed and tested but the HITI site available for carboxy-terminal tagging of SYT7 with HaloTag has a low frequency of recombination; so this construct was split into two different pFUGW-based lentivirus constructs, made into lentivirus, and applied to neuronal cultures to achieve total coverage.
Figure 4—figure supplement 2
SYT7 is not a SV protein.
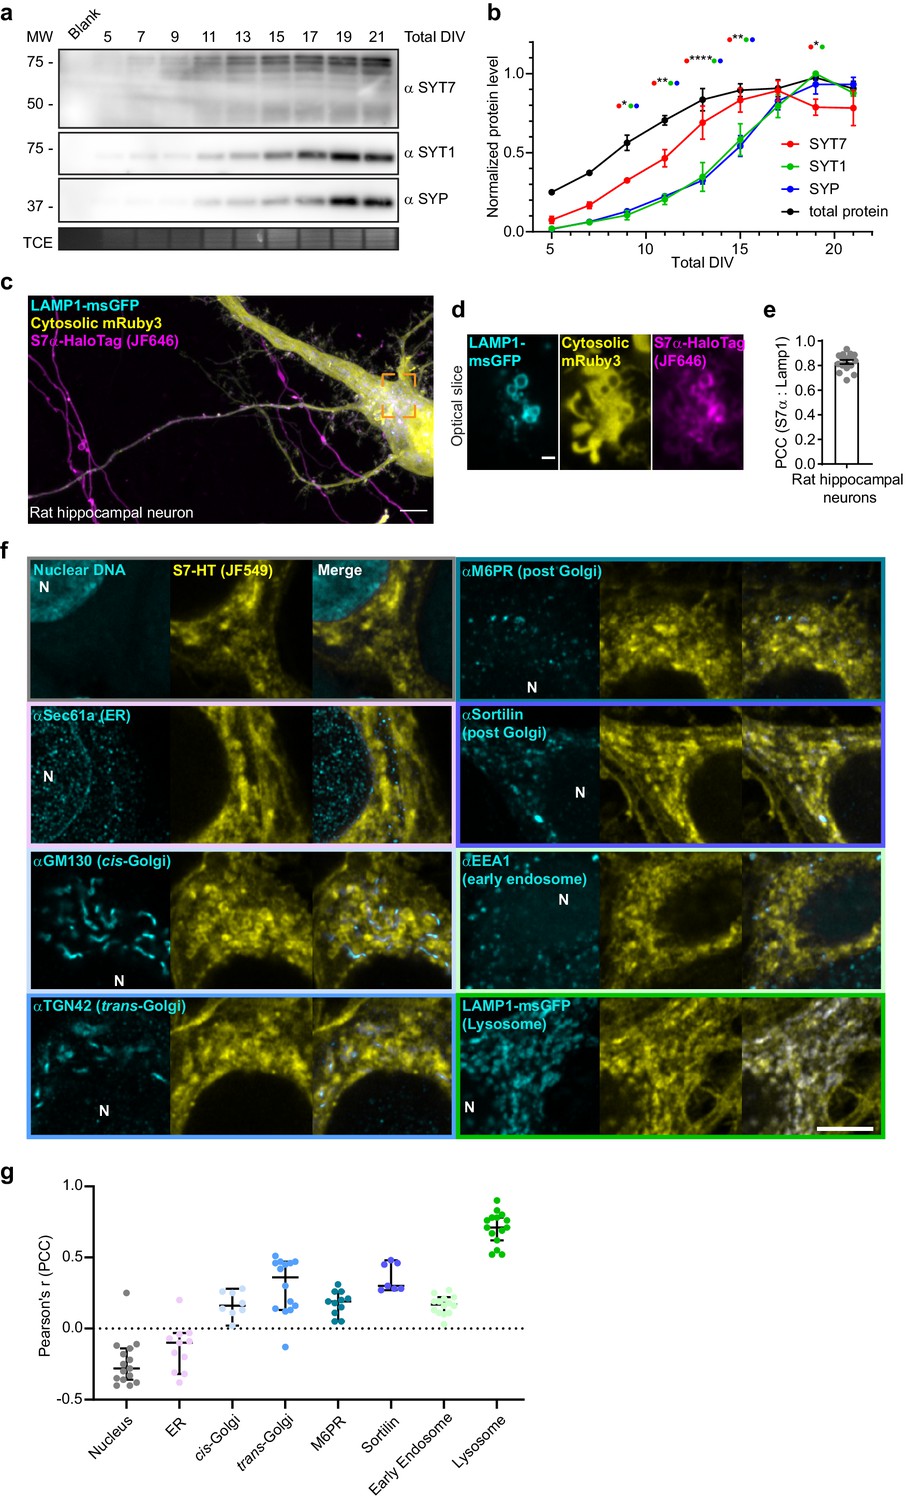
(a) Representative anti-SYT7, anti-SYT1, and anti-synaptophysin (SYP) immunoblots of developing wild-type (WT) rat cortical neurons at the indicated DIV. Trichloroethanol (TCE) staining was used to visualize the total protein and serves as a loading control. (b) Quantification of normalized protein levels (αSYT7, αSYT1, αSYP, and TCE stain) from panel (a). Values are mean +/- SEM from four independent trials. Significant p-values between SYT7 and SYT1/SYP are labeled ****p<0.0001, **p = 0.001<x<0.01, and *p = 0.01<x<0.05, using two-way analysis of variance (ANOVA) with Tukey’s correction. (c) Additional maximum z-projection of an image of rat hippocampal neurons at 14 DIV expressing transfected LAMP1-msGFP (cyan), cytosolic mRuby3 (yellow), and SYT7α-HaloTag (magenta). Scale bar = 5 μm. (d) A super-resolution optical slice from the dashed orange box in panel (b) showing colocalization of LAMP1-msGFP and SYT7α-HaloTag. Scale bar = 1 μm. (e) Bar graph of Pearson correlation coefficient (PCC) between SYT7α-HaloTag/JF646 signal and LAMP1-msGFP signal. (f) Representative single optical slice images of 14–21 DIV rat hippocampal neurons transduced with SYT7α-HaloTag (yellow), fixed and stained with HTL-JF549 and various antibodies directed against proteins in the secretory pathway (cyan); Hoechst nuclear stain (cyan) was included as a negative colocalization control. White ‘N’ labels the nucleus; scale bar = 5 μm. (g) Quantification of colocalization using PCC between S7-HT/JF549 with Hoescht nuclear stain (−0.28 [95% CI −0.36 to −0.14]) and various secretory markers including Sec61α/ER (−0.1 [95% CI −0.32 to −0.03]), GM130/cis-Golgi (0.16 [95% CI 0.02–0.28]), TGN42/trans-Golgi (0.36 [95% CI 0.13–0.47]), mannose-6-phosphate receptor/post-Golgi (0.19 [95% CI 0.05–0.26]), sortilin/post-Golgi (0.30 [95% CI 0.27–0.48]), EEA1/early endosome (0.17 [95% CI 0.11–0.22]), and LAMP1-msGFP/lysosome (0.71 [95% CI 0.62–0.78]). Values are median PCC + 95% CI from three independent trials. Note – this quantification has the same data as that of the control group in Figure 6d.
Figure 4—figure supplement 3
SYT7 does not influence steady-state cholesterol metabolism in neurons.
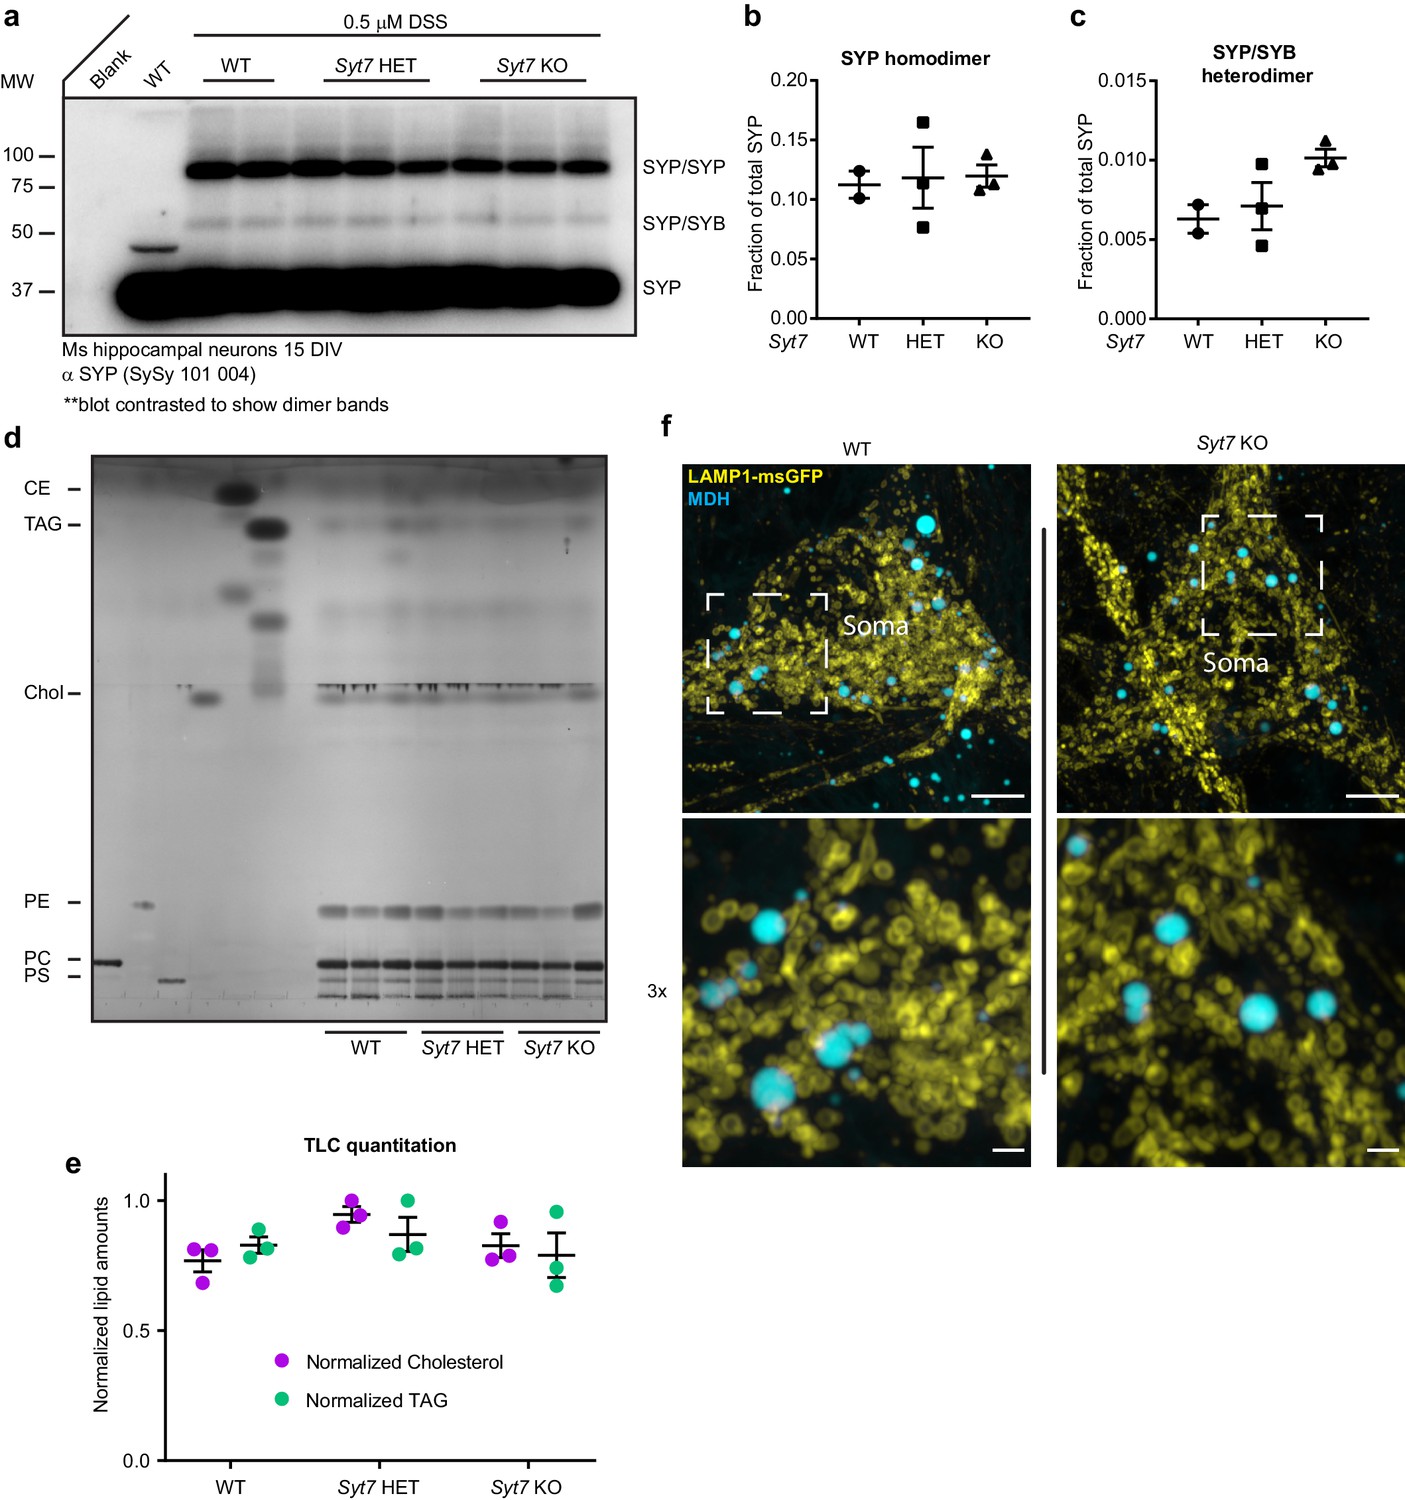
(a) Chemical crosslinking experiment probing the interaction between synaptophysin (SYP) and synaptobrevin (SYB). Anti-SYP immunoblot with wild-type (WT), Syt7 HET, and Syt7 KO mouse hippocampal neurons. All samples used in the analysis are shown in this blot (2x WT, 3x HET, and 3x KO); a WT sample without disuccinimidyl suberate (DSS) treatment is shown as a control. All other samples were incubated in 0.5 mM DSS for 45 min to link physically interacting proteins. (b) SYP homodimer quantification using densitometry. (c) SYP/SYB heterodimer quantification using densitometry. (d) Thin layer chromatography (TLC) examining total lipid levels from mature neurons, phosphatidylserine (PS), phosphatidylcholine (PC), phosphatidylethanolamine (PE), cholesterol (chol), triacylglycerol (TAG), and cholesterol ester (CE). (e) Quantification of chol and TAG using densitometry. (f) Representative super-resolution fluorescent images of WT and SYT7KO mouse hippocampal neurons at 15 DIV expressing uniformly transduced LAMP1-msGFP (yellow) and incubated with 50 μM monodansylpentane (MDH) (cyan) for 30 min. MDH is a solvochromatic dye that fluoresces in the blue spectrum when it is in a nonpolar environment and is a sensitive dye for lipid droplet labeling (Vevea et al., 2015). Scale bar = 5 μm for top image row and 1 μm for bottom (3x) image row.
Figure 5 with 1 supplement
Synaptotagmin 7 is cleaved by the intramembrane aspartyl protease presenilin.
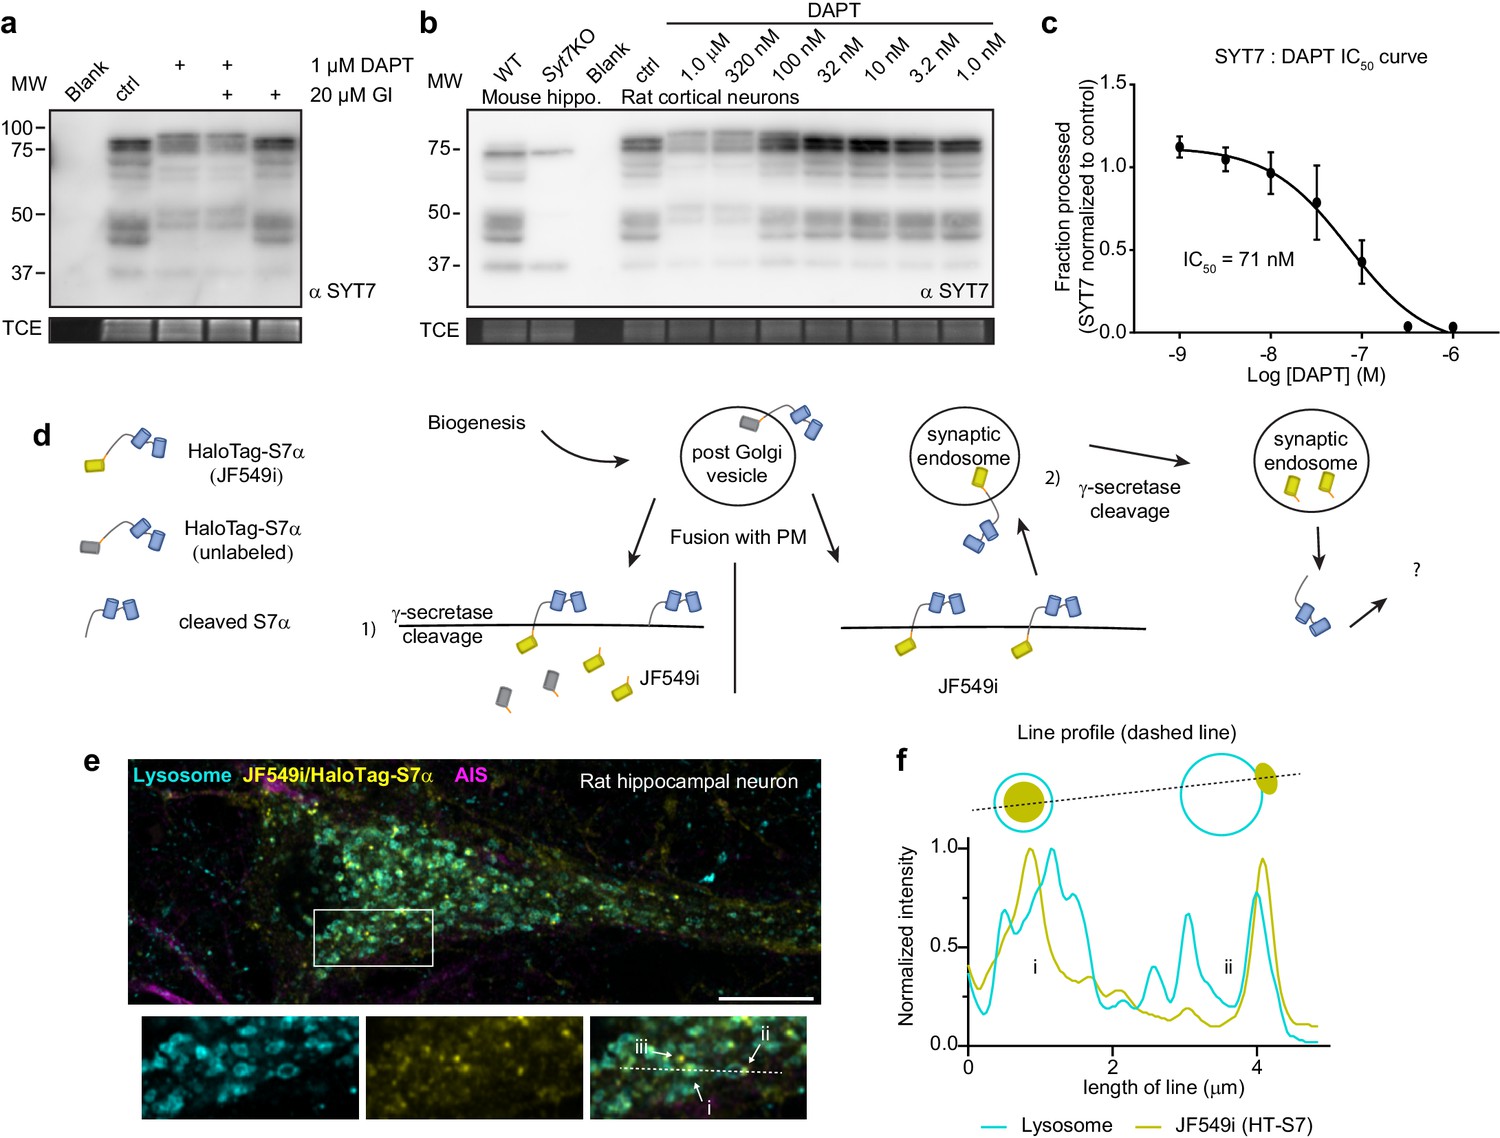
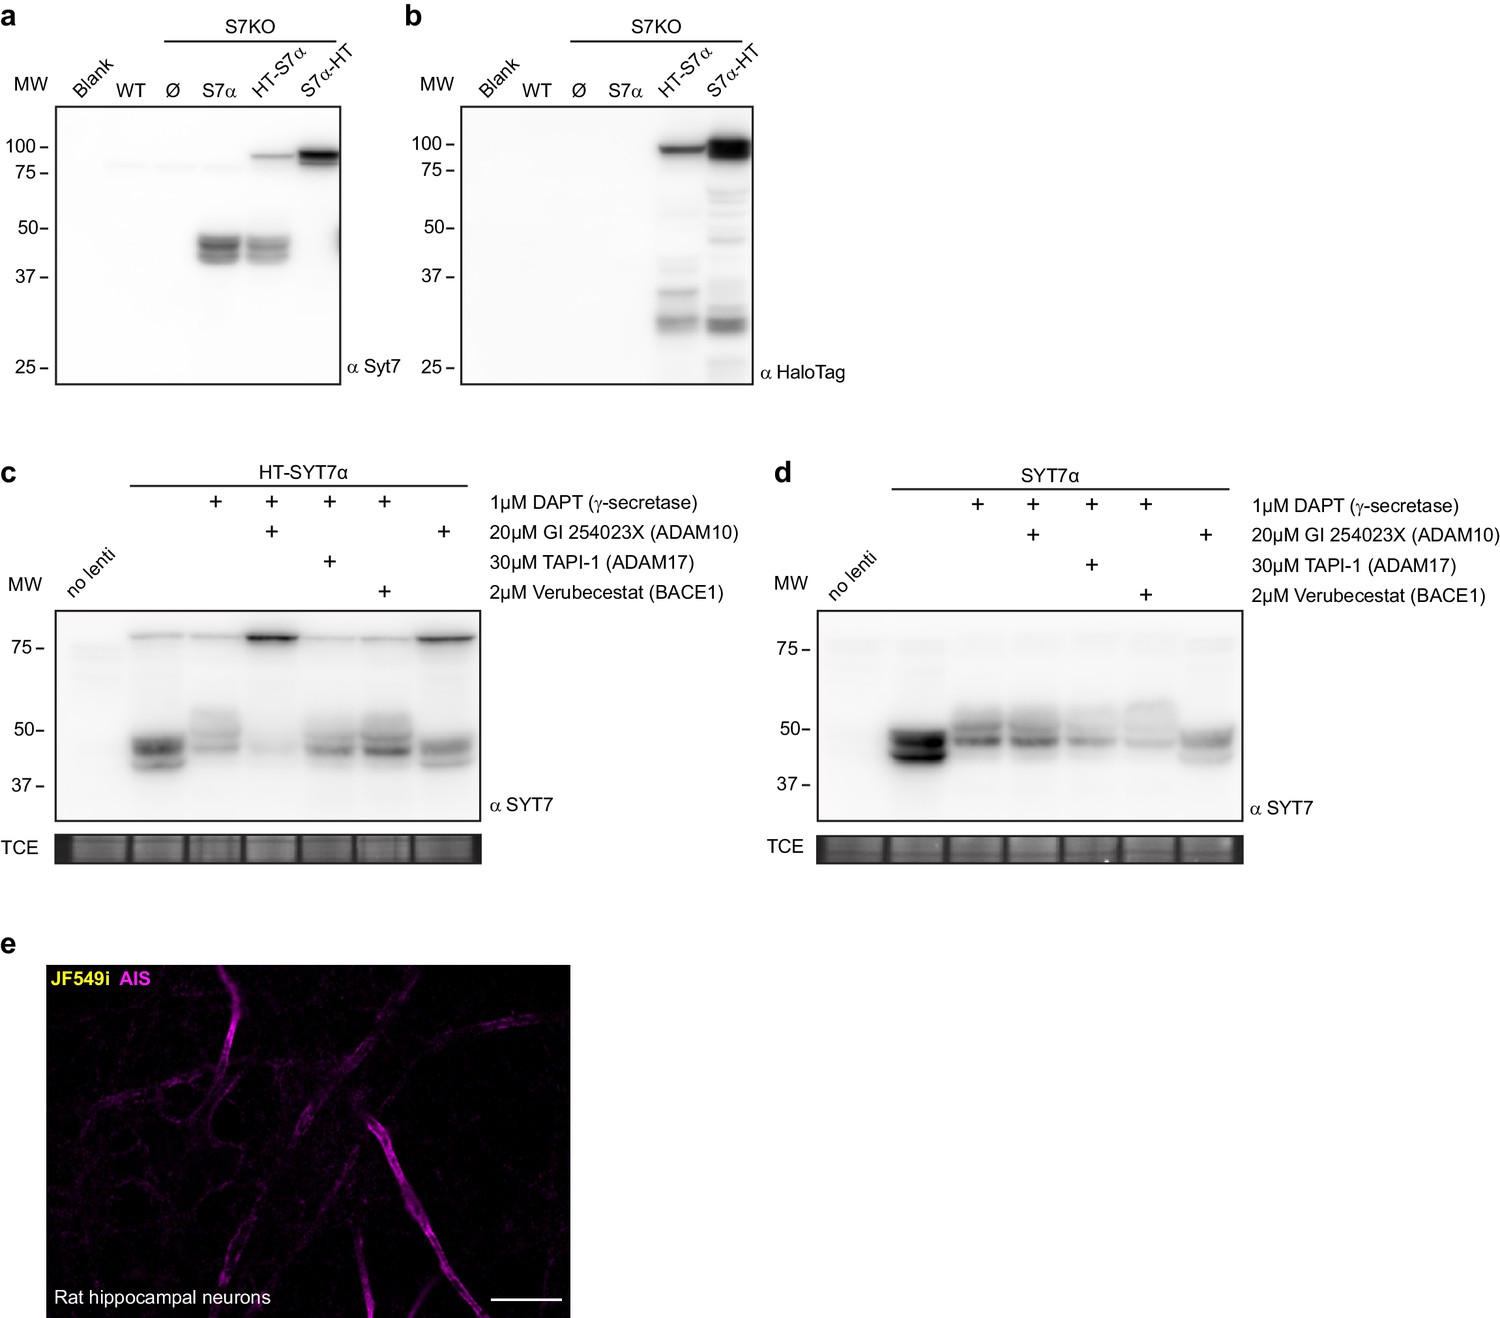
(a) Representative anti-SYT7 immunoblot from rat hippocampal neurons with trichloroethanol (TCE) staining as a loading control. Conditions from left to right are blank/no protein, control conditions, neurons ttreated with 1 μM DAPT (N-[N-(3,5-difluorophenacetyl)-L-alanyl]-S-phenylglycine t-butyl ester) (presenilin competitive inhibitor), DAPT and 20 μM GI 254023X (ADAM10 selective inhibitor), or treated with GI 254023X only, all from DIV 5 onward. (b) Representative anti-SYT7 immunoblot using mouse hippocampal neurons for wild-type (WT) and SYT7KO antibody controls along with rat cortical neurons grown in various concentrations of DAPT to assay half maximal inhibitory concentration (IC50), with TCE staining as a loading control. (c) Graph of the fraction of processed synaptotagmin 7 (SYT7) when grown in various DAPT concentrations in relation to control conditions (IC50 curve) results in an IC50 of 71 nM. The lowest specific SYT7 band was used for quantitating cleavage and IC50 of DAPT. Values are means +/- SD after log transformation from three independent experiments. (d) Cartoon illustrating the logic and methodological approach to determine whether full-length SYT7 protein transits through the plasma membrane (PM) prior to amino-terminal cleavage by γ-secretase. JF549i is a membrane-impermeant version of JF549 (JF549 and JF549i are nonfluorogenic). In (1), cleavage can take place in the post-Golgi vesicle, prior to axonal PM localization or cleavage happens at the PM. No fluorescent HaloTag is observable in this scenario. In (2), SYT7 transits through the PM before being cleaved in a synaptic endosome. Only in this scenario will fluorescent HaloTag be observable in neurons. (e) Representative super-resolution optical slice of a rat hippocampal neuron transduced with LAMP1-msGFP (cyan) and HaloTag-SYT7α (yellow). Before fixing neurons, they were incubated with 1 nM HTL-JF549i for 2 days. Fixed neurons were decorated with anti-pan-neurofascin (magenta) antibodies to mark the axon initial segment (AIS). White box indicates the area that is enlarged to show the detail below the image. The labels (i), (ii), and (iii) indicate areas where HTL-JF549i appears inside lysosomes, clustered on the edge of lysosomes, or completely independent of lysosomes, respectively. (f) Line profile from the dashed line in panel (e) with normalized intensity of LAMP1-msGFP (cyan) and JF549i (yellow). The labels (i) and (ii) are labeled on the line profile as well and correspond to the same labels as in panel (e). Cartoon schematic of the analyzed signal is above the graph.
Figure 5—figure supplement 1
SYT7 is cleaved at its amino-terminus.
(a) Representative anti-SYT7 immunoblot from wild-type (WT) and SYT7KO-dissociated mouse hippocampal neurons transduced with various constructs. WT (endogenous synaptotagmin (SYT)7 is expressed at very low levels in neurons obtained from P0 mice) and SYT7KO conditions are shown as controls. SYT7α represents an overexpressed untagged SYT7 alpha isoform, while HT- SYT7α and SYT7α-HT represent amino- and carboxy-terminal-tagged SYT7 with the HaloTag enzyme. (b) The same blot as in (a) but stripped and probed with anti-HaloTag. (c) Representative anti-SYT7 immunoblot of rat cortical neurons expressing transduced HT-SYT7α with various combinations of a competitive γ-secretase inhibitor (DAPT (N-[N-(3,5-difluorophenacetyl)-L-alanyl]-S-phenylglycine t-butyl ester)) and metalloprotease inhibitors GI 254023X for ADAM10, TAPI-1 for ADAM17, and Verubecestat for BACE1, with TCE staining as a load control. (d) The same setup as in panel (c) but with neurons transduced with untagged SYT7α, with TCE staining used as a load control. (e) Representative super-resolution optical slice of an untransduced rat hippocampal neuron. Before fixing neurons, they were incubated with 1 nM JF549i for 2 days to reveal any nonspecific labeling from the JF549i dye. Fixed neurons were decorated with anti-pan-neurofascin antibodies to mark axon initial segments.
Figure 6 with 1 supplement
SYT7 is mislocalized and destabilized when amino-terminal cleavage is blocked.
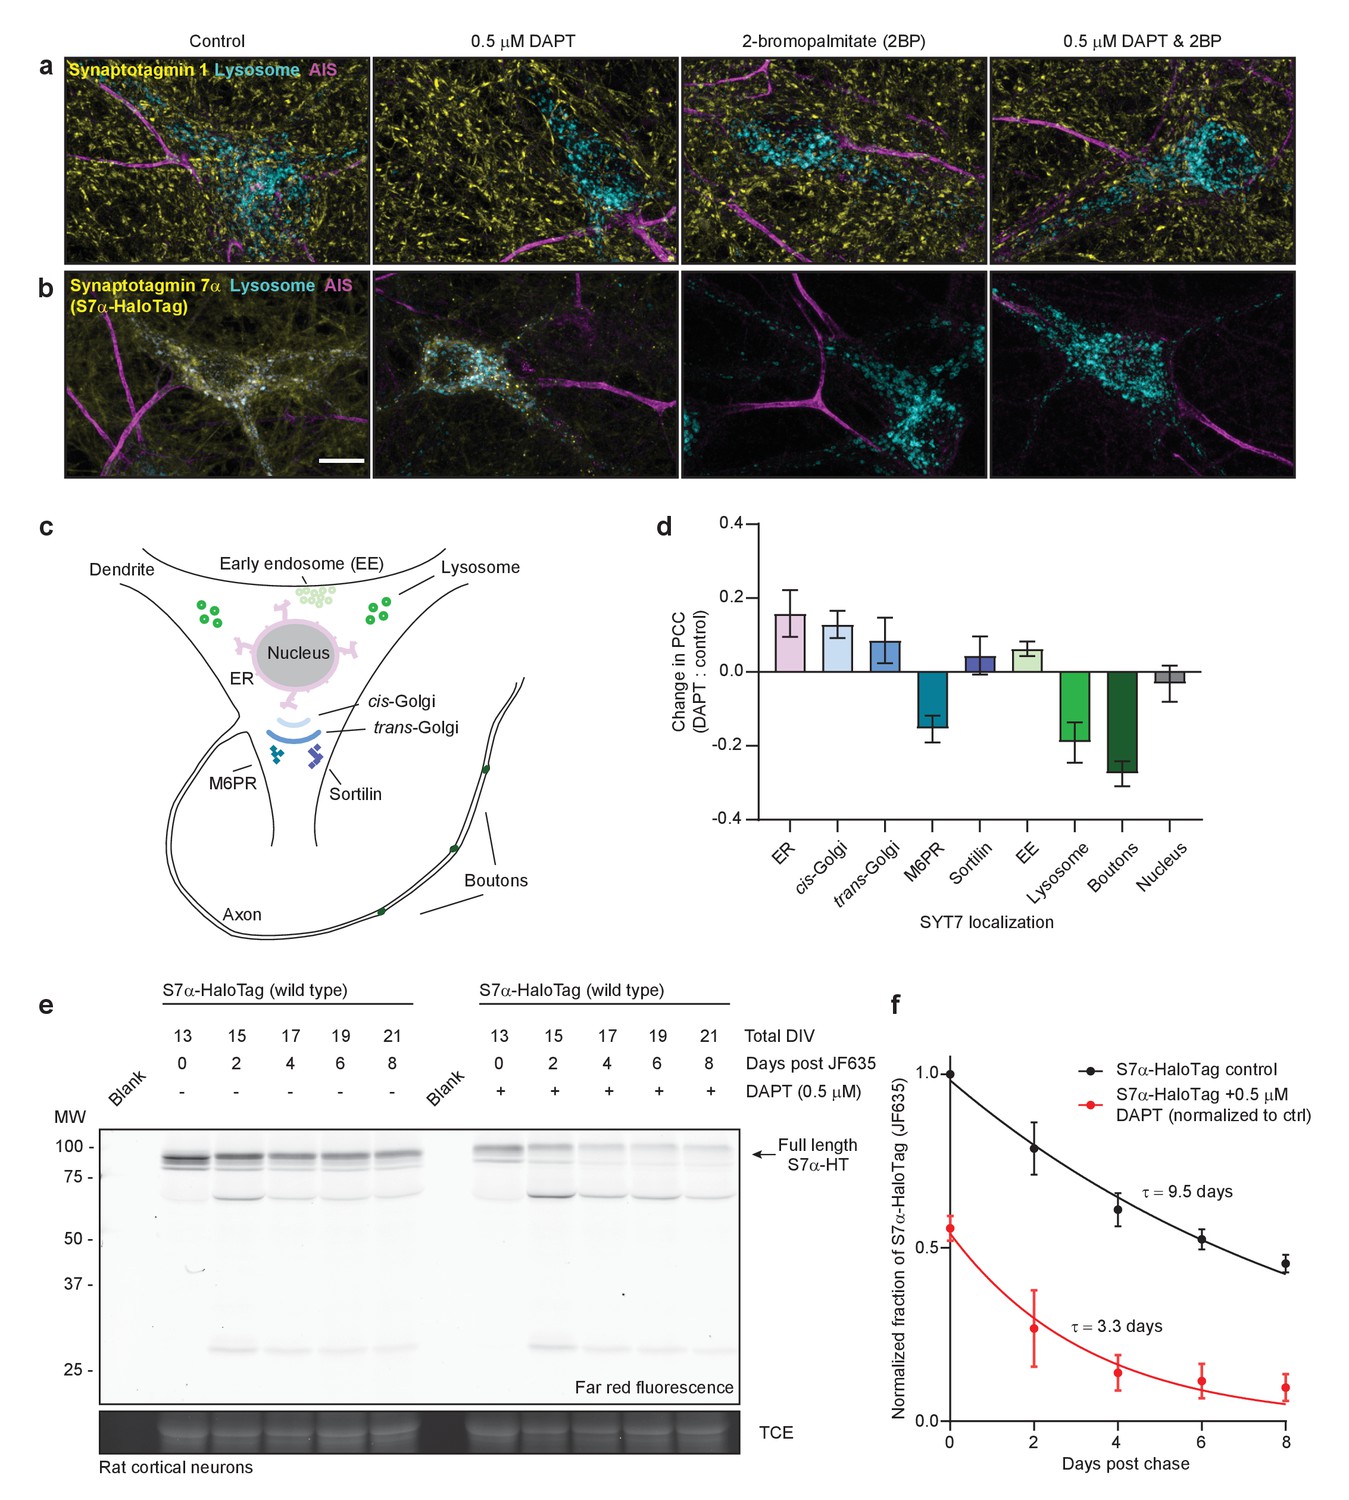
(a) Representative super-resolution maximum z-projections of rat hippocampal neurons transduced with LAMP1-msGFP (cyan), fixed for immunocytochemistry (ICC), and stained for synaptotagmin 1 (SYT1) (yellow) and the axon initial segment (AIS) (magenta). Four separate conditions were imaged: control neurons, neurons grown for 10–12 days in 0.5 μM DAPT (N-[N-(3,5-difluorophenacetyl)-L-alanyl]-S-phenylglycine t-butyl ester), neurons exposed to 2-bromopalmitate (2-BP) for 3 hr before imaging, and neurons exposed to a combination treatment of DAPT and 2-BP. (b) Same as in panel (a), but instead of anti-SYT1 staining, neurons were transduced with SYT7α-HaloTag and reacted with JF549 during overnight primary antibody incubation to monitor SYT7α localization. Scale bar = 10 μm. (c) Illustration of the model neuron and compartments assayed for SYT7α-HaloTag colocalization. (d) Bar graph showing changes in colocalization of SYT7α-HaloTag/JF549 and labeled organelles (M6PR and sortilin label post-Golgi vesicles). Quantified by taking the difference of the PCC between DAPT-treated and control neurons in each condition. Values are means +/- error propagated SEM from at least three separate experiments for each condition. (e) Representative in-gel fluorescence of the protein extracted from rat cortical neurons transduced with SYT7α-HaloTag and pulse-chased with JF635 at 13 DIV under control conditions and when grown in 0.5 μM DAPT. Cultures were labeled with JF635 at 13 DIV and then robustly washed with conditioned media. The disappearance of labeled SYT7α-HaloTag/JF635 from the gel can be used to calculate protein half-life. Control SYT7α-HaloTag/JF635 runs between 75 and 100 kDa, while DAPT-treated SYT7α-HaloTag/JF635 runs slightly higher because cleavage of the amino-terminus is blocked. Trichloroethanol (TCE) staining was used as a loading control. (f) Normalized intensity of SYT7α-HaloTag/JF635 plotted as the fraction of total control SYT7α-HaloTag/JF635 against days post-wash. Values are means +/- SEM from three independent experiments. Single exponential functions were fitted to control (black) and DAPT (red) conditions. The tau for control SYT7α-HaloTag/JF635 is 9.5 days, while the tau for DAPT-treated SYT7α-HaloTag/JF635 is 3.3 days.
Figure 6—figure supplement 1
Treatment with DAPT does not recapitulate SYT7KO synaptic phenotypes in vitro.
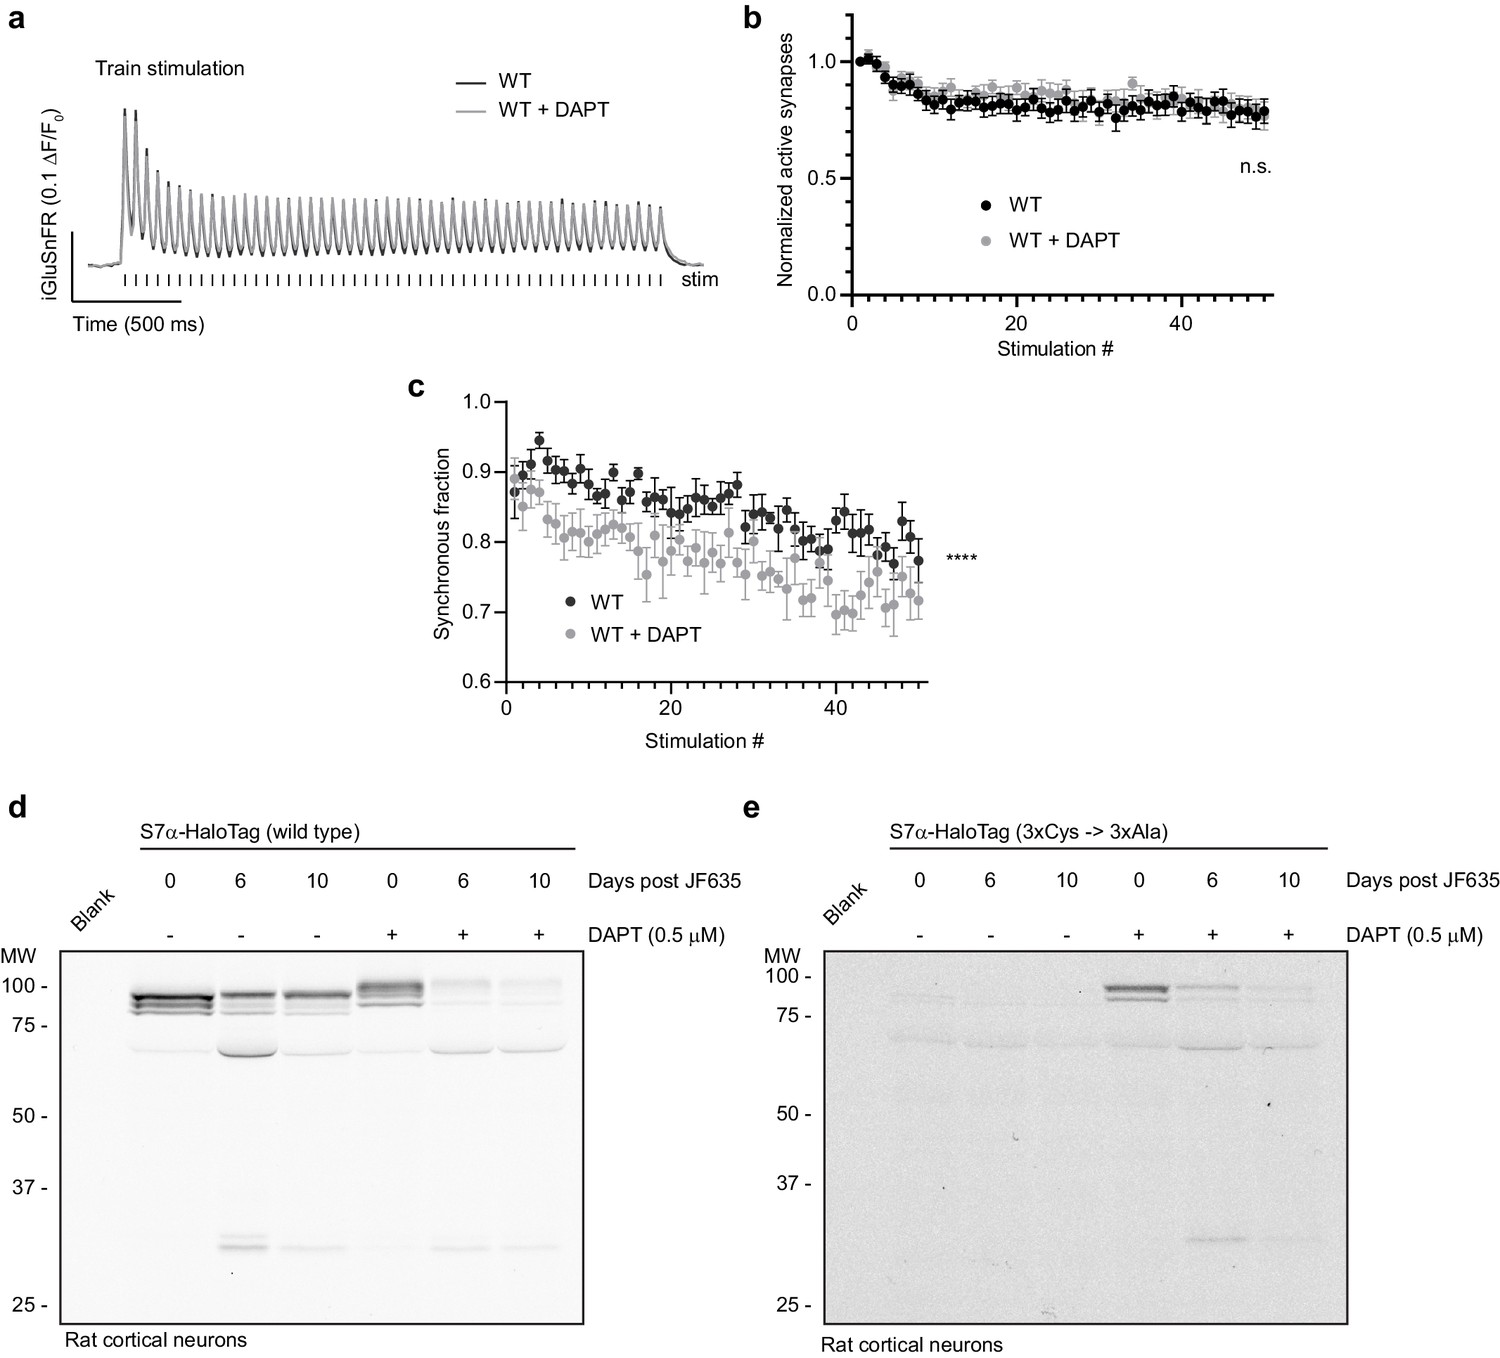
(a) Average iGluSnFR ΔF/F0 traces from high-frequency stimulation (HFS) of wild-type (WT) (black, n = 9) and WT + 0.5 μM DAPT (N-[N-(3,5-difluorophenacetyl)-L-alanyl]-S-phenylglycine t-butyl ester) (gray, n = 11)-treated mouse hippocampal neurons, from two independent experiments. Samples were field stimulated at 20 Hz for 2.5 s (50 action potentials (APs)). (b) Fraction of active synapses (synapses releasing peak glutamate above baseline, >4 SD above noise) as a function of stimulation number during HFS. Values are means +/- SEM, p = ns by two-way analysis of variance (ANOVA) comparing genotypes. (c) Synchronous fraction of iGluSnFR ΔF/F0 peaks (synchronous peaks within 10 ms of stimulus) as a function of stimulation number during HFS. Values are means +/- SEM, ****p<0.0001 by two-way ANOVA comparing genotypes. (d) Representative in-gel fluorescence of the protein extracted from rat cortical neurons transduced with SYT7α-HaloTag and pulse-chased with JF635 at 13 DIV under control conditions and when grown in 0.5 μM DAPT. (e) Representative in-gel fluorescence of the protein extracted from rat cortical neurons transduced with palmitoylation site mutant (3x Cys -> 3x Ala) SYT7α-HaloTag and pulse-chased with JF635 at 13 DIV under control conditions and then grown in 0.5 μM DAPT. Palmitoylation mutants are not stable in control conditions, presumably because they are cleaved by γ-secretase and degraded.
Figure 7 with 1 supplement
Dissociating discrete SYT7 functions via protein retargeting.
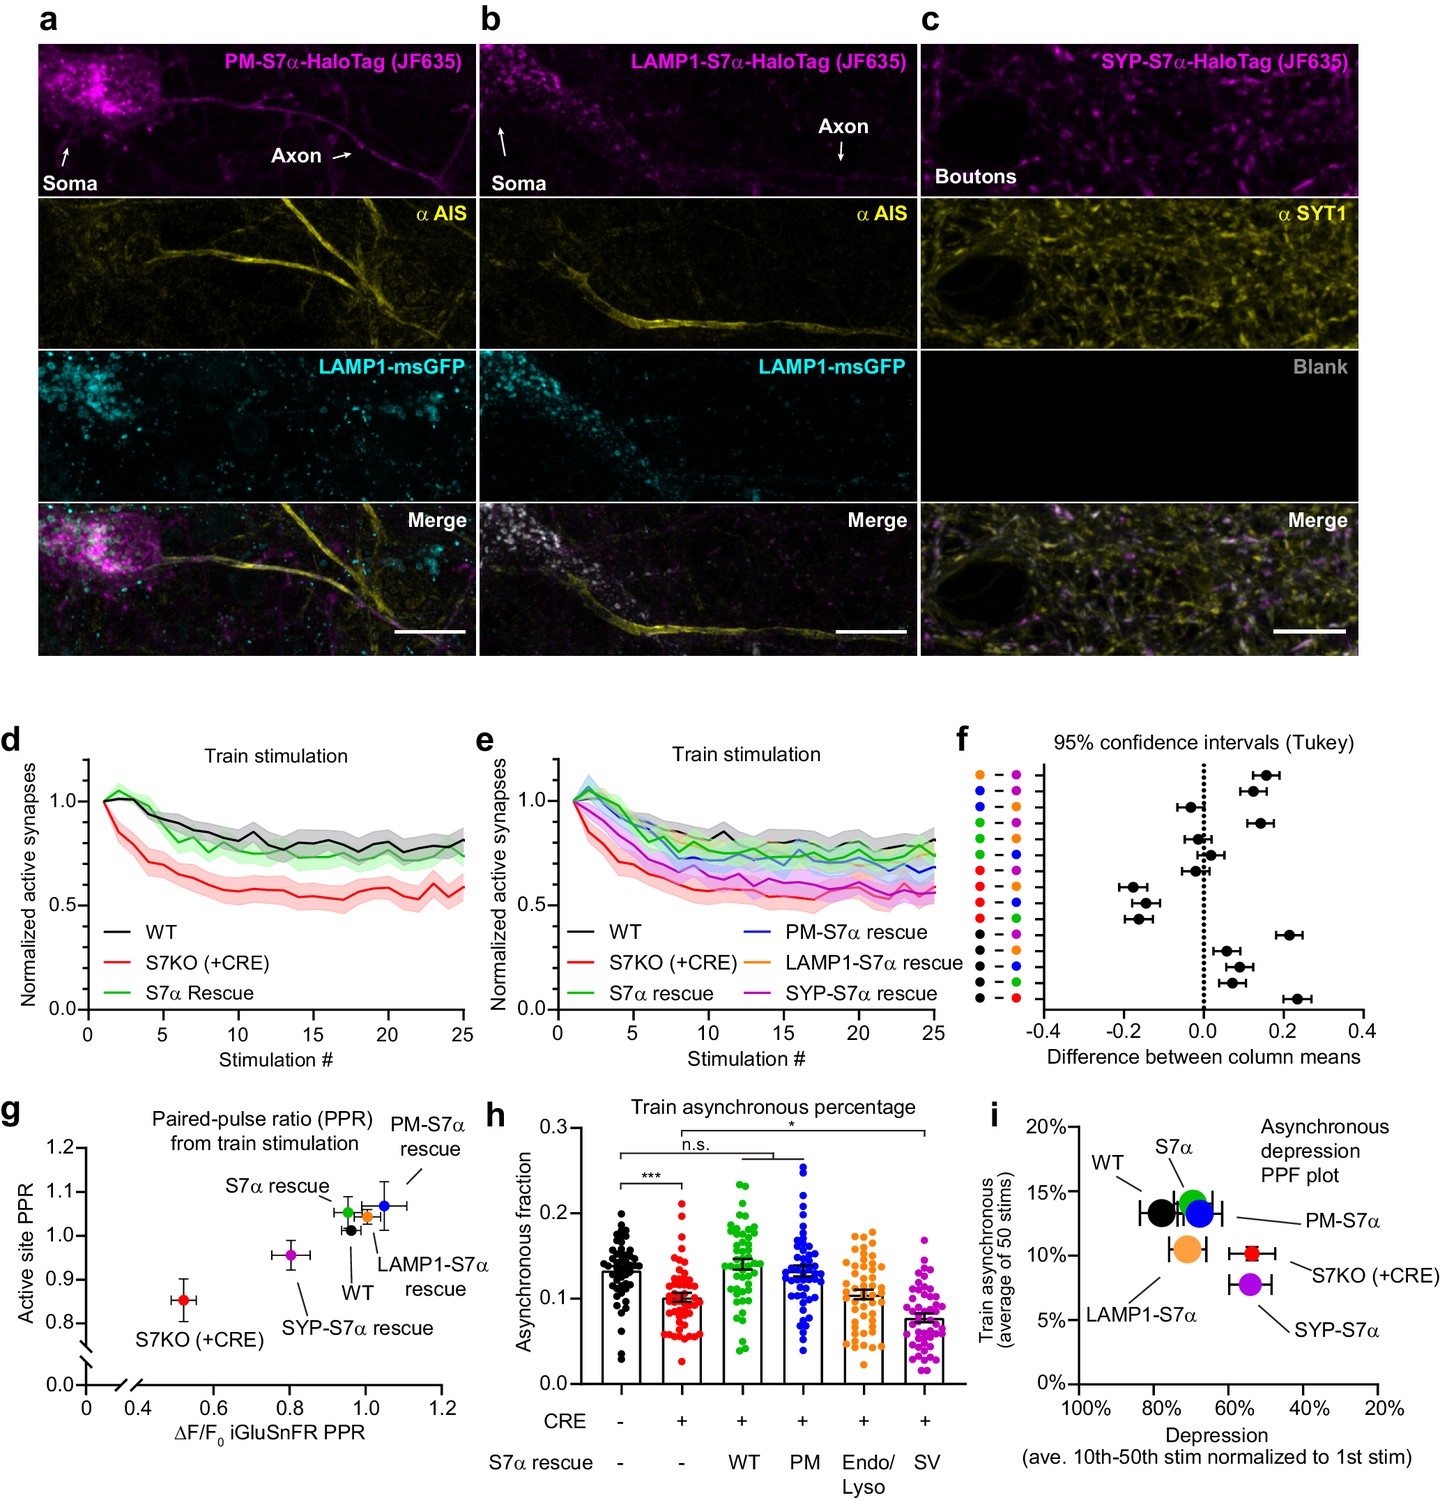
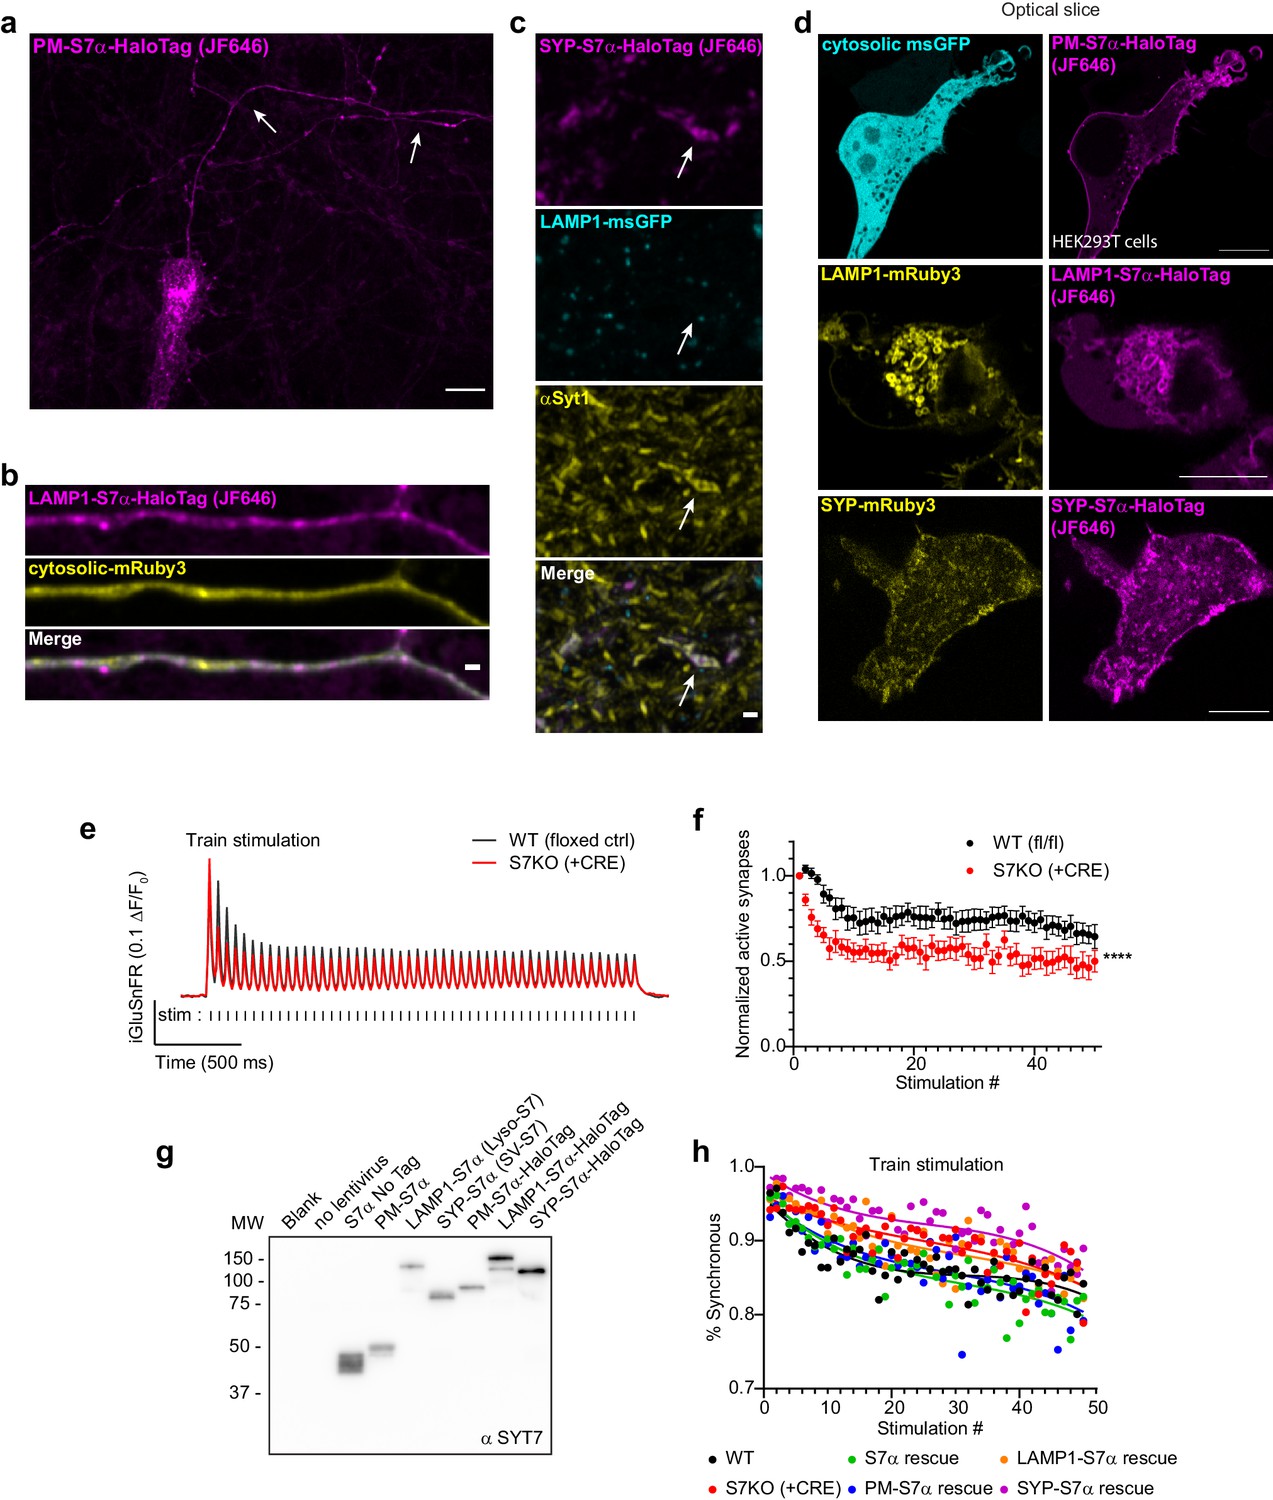
(a–c) Representative super-resolution maximum z-projection of rat hippocampal neurons transduced with (a) a plasma membrane-targeted synaptotagmin (SYT)7α, [PM-SYT7α-HaloTag (magenta)], plus LAMP1-msGFP (cyan), (b) a lysosome-targeted SYT7α, [LAMP1-SYT7α-HaloTag (magenta)], plus LAMP1-msGFP (cyan), and (c) a synaptic vesicle-targeted SYT7α, [SYP-SYT7α-HaloTag (magenta)]. Neurons were fixed and stained with HTL-JF635 (a–c), anti-pan-neurofascin (yellow, a, b), and anti-SYT1 (yellow, c) antibodies. For panel (c), a blank image is included to preserve the layout. For panels (a) and (b), SYT7α constructs were sparsely transduced to better examine localization. Scale bars = 10 μm. (d) Depression plot, showing the fraction of active synapses (synapses releasing peak glutamate above baseline, >4 SD above noise) as a function of stimulation number during high-frequency stimulation (HFS). Values are means (solid line) +/- SEM (shaded error), WT (black, n = 15), SYT7KO (red, n = 13), and SYT7α rescue (green, n = 15) from three independent experiments; SYT7KO vs SYT7α rescue is ****p<0.0001 by two-way analysis of variance (ANOVA) comparing genotypes. (e) Depression plot from panel (d) but with SYT7α rescue constructs included. Values are means (solid line) +/- SEM (shaded error), PM-SYT7α rescue (blue, n = 15), LAMP1-SYT7α rescue (orange, n = 15), and SYP-SYT7α rescue (purple, n = 15) from three independent experiments. (f) Multiple comparison confidence interval (95% CI) plot from data in panel (e). Plot was generated from two-way ANOVA comparing the predicted mean difference between genotypes of normalized active synapses. Comparisons with errors including zero are not statistically different. Total summary statistics are included in Figure 7—source data 1. (g) An X-Y plot of paired-pulse ratio (PPR) generated at 20 Hz (from first two pulses of HFS). Values are means +/- SEM, where X values are the ratio of the change in glutamate release (ΔF/F0 iGluSnFR peaks) and Y values are the fraction of regions of interest (ROIs) releasing glutamate (active sites) from wild-type (WT) (black), SYT7KO (red), and SYT7α rescue (green), PM-SYT7α rescue (blue), LAMP1-SYT7α rescue (orange), and SYP-SYT7α rescue (purple). (h) Train asynchronous release (peak release recorded between 10 ms and 50 ms post-stimulus) of WT and SYT7KO vs the labeled rescue constructs. Values are means +/- SEM and are the average asynchronous values from each stimulus during a 50 action potential (AP) (20 Hz) HFS; so n = 50 for each group. All comparisons and summary statistics are provided in Figure 7—source data 2, and only some are labeled on the graph for presentations sake; p-values are as follows: ***p = 0.001, *p = 0.0147, by one-way ANOVA with Holm-Sidak’s multiple comparisons test. (i) Summary X-Y plot illustrating different magnitudes of rescue for three of the proposed functions of SYT7. Values are means +/- SEM, where X values represent depression percentage (release from 10th to 50th stimulation normalized to first) and Y values are the average asynchronous percentage of each genotype during the HFS train. The size of each dot reflects the relative magnitude of each PPR, normalized on a scale from the largest, 10 au (most paired-pulse facilitation (PPF)), to the smallest, 1 au (least PPF).
-
Figure 7—source data 1
Total summary statistics from multiple comparison confidence interval (95% CI) plot from data in panel (e).
- https://cdn.elifesciences.org/articles/67261/elife-67261-fig7-data1-v1.docx
-
Figure 7—source data 2
Statistic summary using one-way ANOVA with Holm-Sidak’s multiple comparisons test for quantification of train asynchronous release.
- https://cdn.elifesciences.org/articles/67261/elife-67261-fig7-data2-v1.docx
Figure 7—figure supplement 1
Extended analysis of SYT7 chimeric rescue constructs.
(a) Same neuron as shown in Figure 7a but shown here with a larger field of view and only the PM-S7α-HaloTag/JF646 channel. Arrows point to the axon. Scale bar = 10 μm. (b) An example image of an axon from a neuron massively overexpressing transfected LAMP1-S7α-HaloTag (JF646) and cytosolic mRuby3. When overexpressed, this construct appears to localize to the plasma membrane, potentially confounding our analysis of this construct. (c) Representative image taken with the same imaging conditions as in Figure 7c. Neurons transduced sparsely with SYP-SYT7α-HaloTag. Arrows point to a synaptic vesicle cluster and nearby LAMP1+ structure. Scale bar = 1 μm. (d) Representative super-resolution optical slices of HEK293T cells expressing the location-specific SYT7α rescue constructs. From left to right, cytosolic msGFP (cyan) with PM-SYT7α (magenta), LAMP1-mRuby3 (yellow) with LAMP1-SYT7α (magenta), and SYP-mRuby3 (yellow) with SYP-SYT7α (magenta). Scale bar = 10 μm. (e) Average iGluSnFR ΔF/F0 traces from SYT7 floxed strain, WT (floxed/no CRE, black, n = 13), and SYT7KO (+CRE, red, n = 13), from three independent experiments. (f) Fraction of active synapses (synapses releasing peak glutamate above baseline, >4 SD above noise) as a function of stimulation number during high-frequency stimulation (HFS). Values are means +/- SEM, ****p<0.0001 by two-way analysis of variance (ANOVA) comparing genotypes. (g) Representative anti-SYT7 immunoblot from rat cortical neurons, illustrating expression of labeled SYT7α constructs used in Figure 7. (h) Average synchronous release percentage plotted by stimulation number, genotypes as labeled. As HFS continues, synchronous release decreases. Same data as in Figure 7h. Lines are third-order polynomial fits to data, for illustrative purposes only.
Figure 8
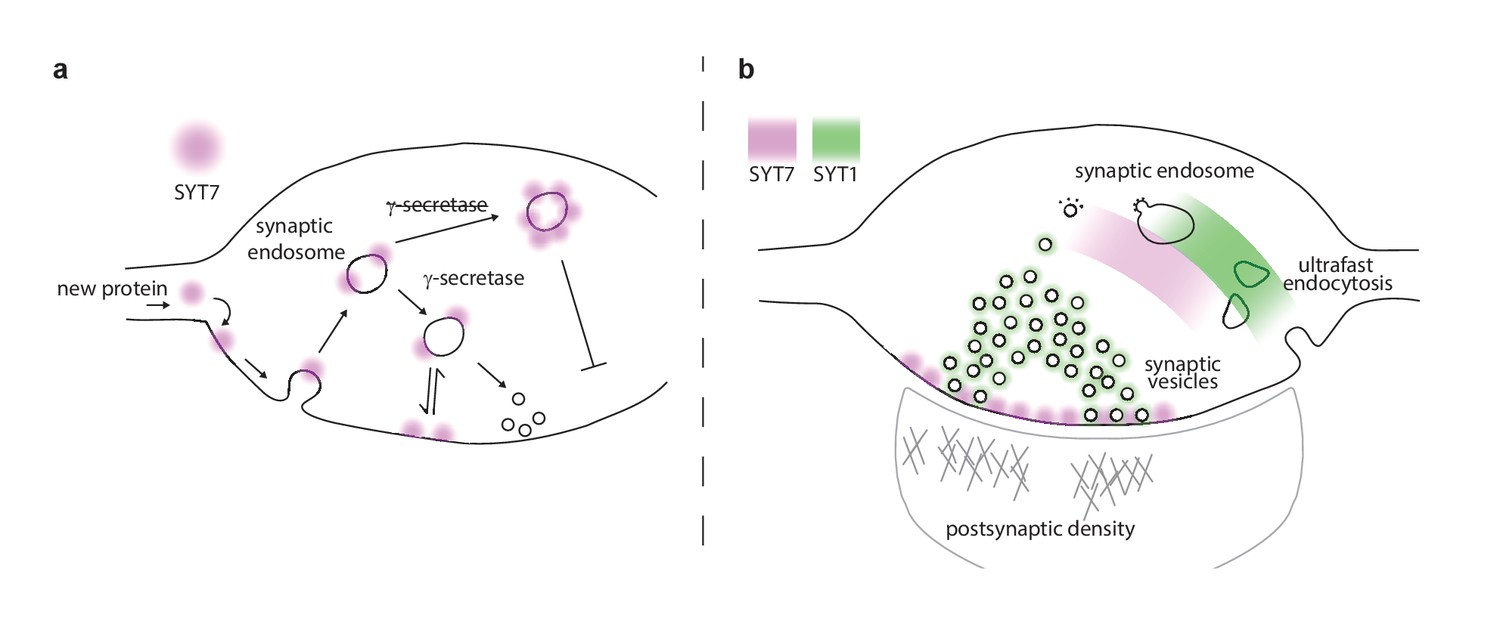
Proposed model of presynaptic SYT7.
(a) Illustration of a nerve terminal in which the location of synaptotagmin (SYT)7 (magenta) at the axonal plasma membrane is dependent on γ-secretase processing and palmitoylation near the transmembrane domain. If palmitoylation is blocked (via drugs or mutations), SYT7 is rapidly degraded. If γ-secretase processing is inhibited, SYT7 mislocalizes to endo-lysosomal intermediate structures. (b) A model synapse with the roles and locations of SYT1 and SYT7 indicated by green and magenta shading, respectively. SYT1 is localized to the synaptic vesicle (SV) membrane where it supports docking, priming, drives the formation of the readily releasable pool (RRP), clamps spontaneous release, triggers fast synchronous release, and accelerates endocytosis after exocytosis. The work in the current study revealed that SYT7 physically and functionally localizes to the plasma membrane of the axon, where it plays roles in supporting release during short-term synaptic activity and in reforming SVs. We propose that SYT7 functions, in part, by ‘reaching out’ to bind SVs to regulate docking in an activity-dependent manner, to control aspects of short-term plasticity.
Tables
Key resources table
| Reagent type (species) or resource | Designation | Source or reference | Identifiers | Additional information |
|---|---|---|---|---|
| Biological sample (Rattus norvegicus) | Primary rat hippocampal neurons | Envigo | Sprague Dawley | |
| Biological sample (Mus musculus) | Primary mouse hippocampal neurons | Jackson Labs | syt7tm1Nan | Chakrabarti et al., 2003 |
| Biological sample (Mus musculus) | Primary mouse hippocampal neurons | Codner et al., 2018 | Syt7-TM1C-EM4-B6N | |
| Cell line (Homo sapiens) | HEK293T, Kidney epithelial | ATCC | CRL-11268 | |
| Recombinant DNA reagent | FUGW (plasmid) | Addgene | Addgene plasmid # 14883;http://n2t.net/addgene:14883; RRID:Addgene_14883 | Lentivirus backbone |
| Recombinant DNA reagent | pEF-GFP (plasmid) | Addgene | Addgene plasmid # 11154;http://n2t.net/addgene:11154; RRID:Addgene_11154 | pEF backbone |
| Recombinant DNA reagent | pAAV.hSynapsin.SF-iGluSnFR.S72A (plasmid) | Addgene | Addgene plasmid # 106176;https://www.addgene.org/106176/; RRID:Addgene_106176 | Low-affinity iGluSnFR |
| Recombinant DNA reagent | pHTC HaloTag (plasmid) | Promega (G7711) | pHTC HaloTag CMV-neo Vector (Promega; G7711) | HaloTag |
| Recombinant DNA reagent | pLenti-hSynapsin-CRE-WPRE (plasmid) | Addgene | Addgene plasmid # 86641;http://n2t.net/addgene:86641; RRID:Addgene_86641 | CRE vector |
| Recombinant DNA reagent | pORANGE (plasmid) | Addgene | Addgene plasmid # 131471;http://n2t.net/addgene:131471; RRID:Addgene_131471 | pORANGE backbone |
| Recombinant DNA reagent | pF(UG) hSyn SYT7α (plasmid) | This study | Addgene | ‘Materials and methods’ section |
| Recombinant DNA reagent | pF(UG) hSyn PP-HaloTag-SYT7α (plasmid) | This study | Addgene | ‘Materials and methods’ section |
| Recombinant DNA reagent | pF(UG) hSyn SYT7α-HaloTag (plasmid) | This study | Addgene | ‘Materials and methods’ section |
| Recombinant DNA reagent | pF(UG) hSyn SYT7α-HaloTag TMD Cys- Ala (plasmid) | This study | Addgene | ‘Materials and methods’ section |
| Recombinant DNA reagent | pF(UG) hSyn SYT7α-HaloTag P2A PM-msGFP (plasmid) | This study | Addgene | ‘Materials and methods’ section |
| Recombinant DNA reagent | pF(UG) hSyn SYP-ΔTMD SYT7α (plasmid) | This study | Addgene | ‘Materials and methods’ section |
| Recombinant DNA reagent | pF(UG) hSyn SYP-ΔTMD SYT7α-HaloTag (plasmid) | This study | Addgene | ‘Materials and methods’ section |
| Recombinant DNA reagent | pF(UG) hSyn PM-SYT7αΔTMD (plasmid) | This study | Addgene | ‘Materials and methods’ section |
| Recombinant DNA reagent | pF(UG) hSyn PM-SYT7αΔTMD-HaloTag (plasmid) | This study | Addgene | ‘Materials and methods’ section |
| Recombinant DNA reagent | pF(UG) hSyn Lamp1-SYT7αΔTMD (plasmid) | This study | Addgene | ‘Materials and methods’ section |
| Recombinant DNA reagent | pF(UG) hSyn Lamp1-SYT7αΔTMD-HaloTag (plasmid) | This study | Addgene | ‘Materials and methods’ section |
| Recombinant DNA reagent | pF(UG) U6-SYT7 sgRNA 777 HaloTag (plasmid) | This study | Addgene | ‘Materials and methods’ section |
| Recombinant DNA reagent | pF(UG) hSyn spCas9 (plasmid) | This study | Addgene | ‘Materials and methods’ section |
| Recombinant DNA reagent | pF(UG) CamKII sf iGluSnFR S72A (plasmid) | This study | Addgene | ‘Materials and methods’ section |
| Recombinant DNA reagent | pF(UG) hSyn SYP-mRuby3 (plasmid) | This study | Addgene | ‘Materials and methods’ section |
| Recombinant DNA reagent | pF(UG) hSyn LAMP1-msGFP (JV012) (plasmid) | This study | Addgene | ‘Materials and methods’ section |
| Recombinant DNA reagent | pEF-GFP (plasmid) | This study | Addgene | ‘Materials and methods’ section |
| Recombinant DNA reagent | pEF-mRuby3 (plasmid) | This study | Addgene | ‘Materials and methods’ section |
| Software, algorithm | SynapsEM | https://github.com/shigekiwatanabe/SynapsEM. | ||
| Sequence-based reagent | SYT7 sgRNA 777 | This paper | sgRNA | CACCAGCTGAAAGCCTGAGA |
| Antibody | Anti-SYT1 (mouse monoclonal) | DSHB | mAB 48; RRID:AB_2199314 | IB (1:1000) ICC (1:100) |
| Antibody | Anti-SYP (guinea pig polyclonal) | SySy | 101 004; RRID:AB_1210382 | IB (1:1000) ICC (1:500) |
| Antibody | Anti-SYT7 (rabbit polyclonal) | SySy | 105 173; RRID:AB_887838 | IB (1:1000) ICC (1:100) |
| Antibody | Anti-HaloTag (mouse monoclonal) | Promega | G9211; RRID:AB_2688011 | IB (1:1000) |
| Antibody | Anti-pan-neurofascin (mouse monoclonal) | NIH NeuroMab | 75–172; RRID:AB_2282826 | ICC (1:200) |
| Antibody | Anti-SEC61A (rabbit monoclonal) | Abcam | ab183046; RRID:AB_2620158 | ICC (1:100) |
| Antibody | Anti-GM130 (mouse monoclonal) | BD Biosciences | 610822; RRID:AB_398141 | ICC (1:100) |
| Antibody | Anti-TGN38/46 (mouse monoclonal) | Abcam | ab2809; RRID:AB_2203290 | ICC (1:20) |
| Antibody | Anti-EEA1 (rabbit polyclonal) | Abcam | ab2900; RRID:AB_2262056 | ICC (1:50) |
| Antibody | Anti-M6PR (mouse monoclonal) | Abcam | ab2733; RRID:AB_2122792 | ICC (1:100) |
| Antibody | Anti-sortilin (rabbit polyclonal) | Abcam | ab16640; RRID:AB_2192606 | ICC (1:100) |
| Antibody | Anti-HaloTag (rabbit polyclonal) | Promega | G9281; RRID:AB_713650 | ICC (1:500) |
| Chemical compound, drug | HTL-JF549 | Janelia Research Campus/ HHMI | Luke Lavis Lab | |
| Chemical compound, drug | HTL-JF635 | Janelia Research Campus/ HHMI | Luke Lavis Lab | |
| Chemical compound, drug | HTL-JF646 | Janelia Research Campus/ HHMI | Luke Lavis Lab | |
| Chemical compound, drug | HTL-JF549i | Janelia Research Campus/ HHMI | Luke Lavis Lab | |
| Chemical compound, drug | Prosense 680 | PerkinElmer | NEV10003 | 0.5 mM |
Additional files
-
Source data 1
Full source data and statisitcs.
- https://cdn.elifesciences.org/articles/67261/elife-67261-data1-v1.zip
-
Transparent reporting form
- https://cdn.elifesciences.org/articles/67261/elife-67261-transrepform-v1.docx
Download links
A two-part list of links to download the article, or parts of the article, in various formats.
Downloads (link to download the article as PDF)
Open citations (links to open the citations from this article in various online reference manager services)
Cite this article (links to download the citations from this article in formats compatible with various reference manager tools)
Synaptotagmin 7 is targeted to the axonal plasma membrane through γ-secretase processing to promote synaptic vesicle docking in mouse hippocampal neurons
eLife 10:e67261.
https://doi.org/10.7554/eLife.67261


