Human monoclonal antibodies against Staphylococcus aureus surface antigens recognize in vitro and in vivo biofilm
- Department of Medical Microbiology, University Medical Centre Utrecht, Netherlands
- Department of Orthopedics, University Medical Centre Utrecht, Netherlands
- Department of Immunology and Microbiology, University of Colorado School of Medicine, United States
- Department of Radiology and Nuclear Medicine, University Medical Centre Utrecht, Netherlands
- MILabs B.V, Netherlands
- Department of Translational Neuroscience, Brain Center Rudolf Magnus, University Medical Center, Netherlands
- Department of Radiation Science and Technology, Delft University of Technology, Netherlands
- College of Pharmacy and Nutrition, University of Saskatchewan, Canada
- Department of Veterans Affairs, Eastern Colorado Health Care System, United States
- Department of Biomechanical engineering, TU Delft, Netherlands
Figures
Figure 1 with 1 supplement
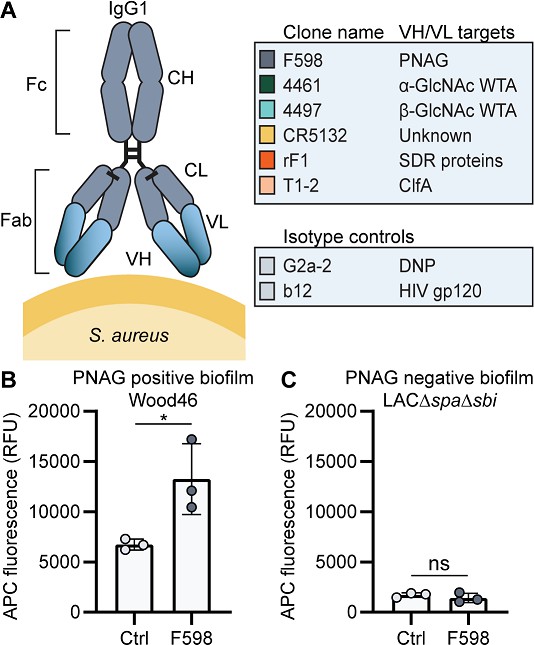
Production of monoclonal antibodies (mAbs) and validation of biofilm.
(A) Human IgG1 antibodies are large (150 kDa) proteins, consisting of two functional domains. The fragment antigen binding (Fab) region confers antigen specificity, while the crystallizable fragment (Fc) region drives interactions with the immune system. Each IgG1 is composed of two identical heavy chains and two identical light chains, which all consist of a constant (CH, CL) and a variable (VH, VL) domain. A panel of six human IgG1 mAbs that recognize polysaccharide and protein components on the cell surface of S. aureus and two nonspecific isotype controls was produced. Variable heavy (VH) and light (VL) chain sequences obtained from different scientific and patent publications were cloned in homemade expression vectors containing human heavy chain (HC) and light chain (LC) constant regions, respectively. (B, C) Biofilms of Wood46 (B) and LAC∆spa∆sbi (C) were grown for 24 hr and incubated with 66 nM F598-IgG1 or ctrl-IgG1 (G2a-2). mAb binding was detected using APC-labeled anti-human IgG antibodies and a plate reader and plotted as fluorescence intensity per well. Data represent mean + SD of three independent experiments. A ratio paired t-test was performed to test for differences in antibody binding versus control and displayed only when significant as *p≤0.05, **p≤0.01, ***p≤0.001, or ****p≤0.0001. Exact p-values are displayed in Supplementary file 2.
Figure 1—figure supplement 1
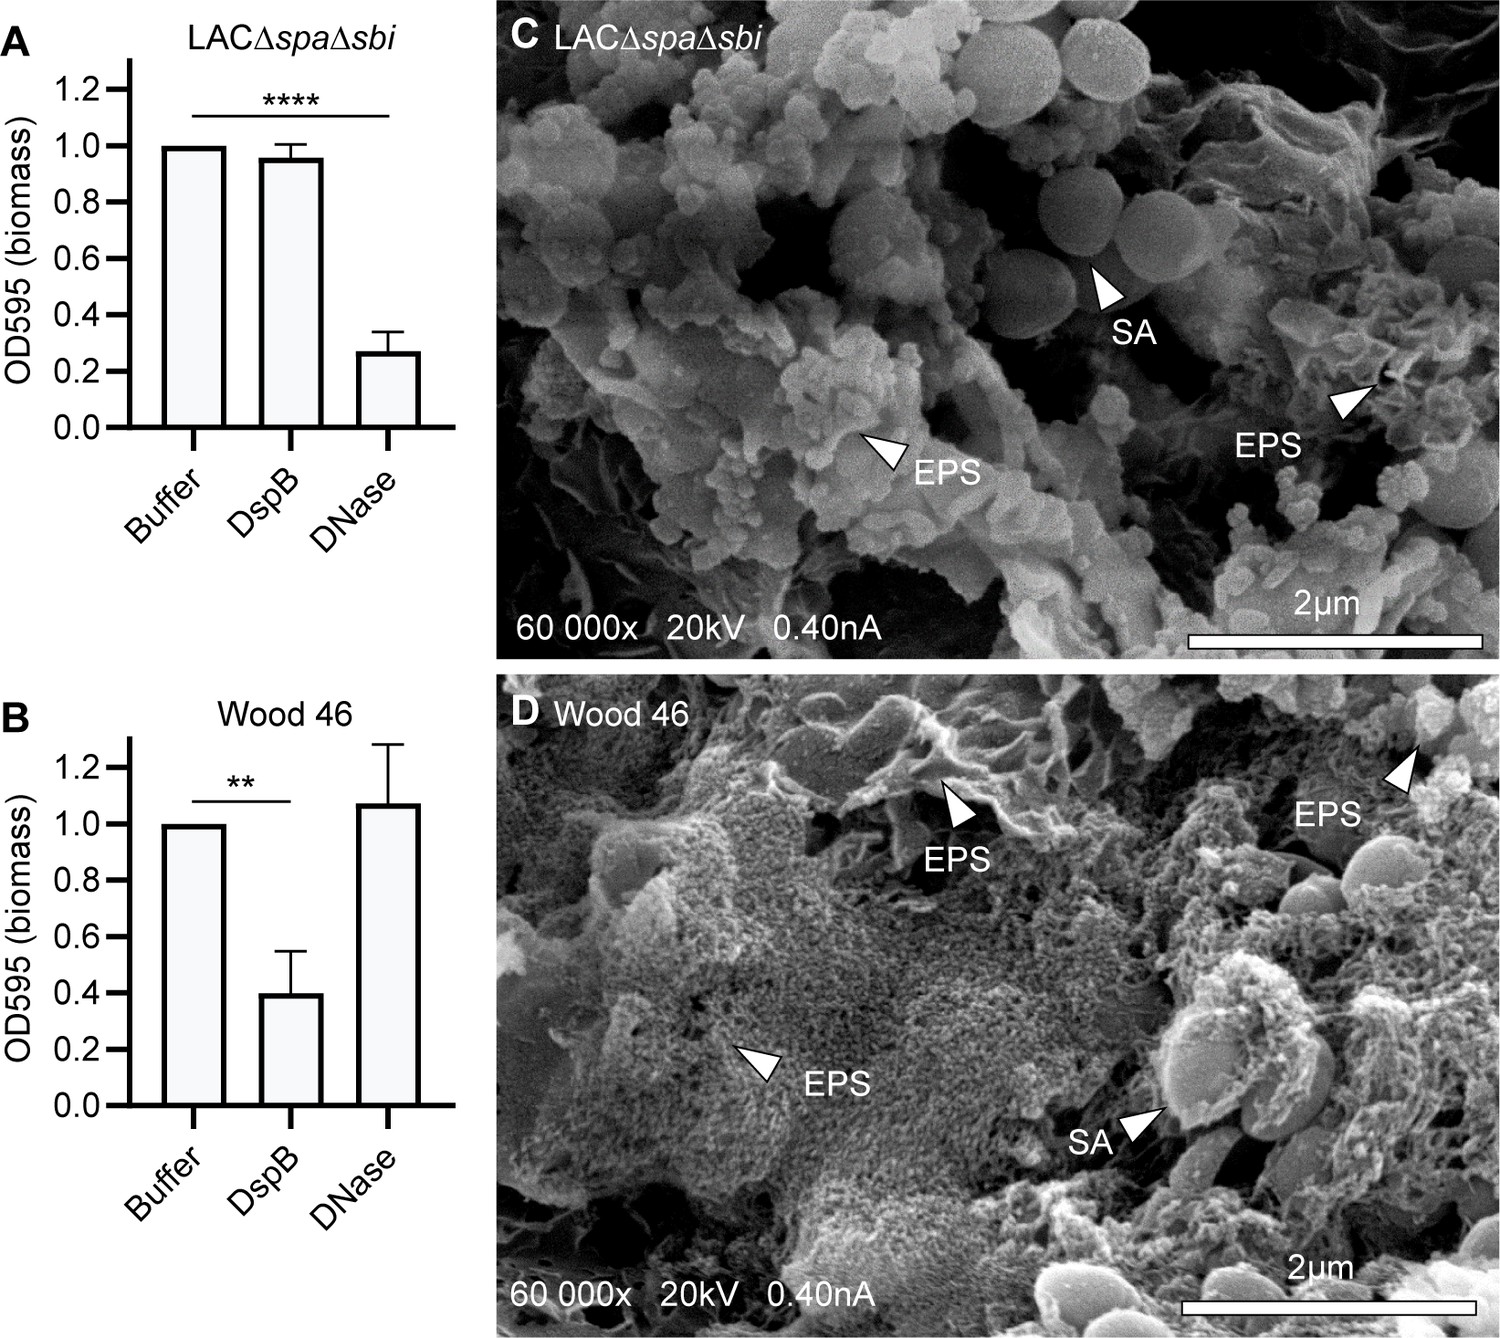
S. aureus strains LAC and Wood46 form different types of biofilm.
(A, C) Biofilm of S. aureus strain LAC∆spa∆sbi (A) and Wood46 (C) was grown for 24 hr with buffer or DNase (1 mg/mL). DspB (30 nM) was added after 24 hr of biofilm formation. Adherent biofilm biomass was measured by crystal violet staining. Data represent mean + SD of three independent experiments. Triplicates were averaged and expressed as relative biomass by dividing the OD595 of treated samples by the OD595 of control samples. One-way ANOVA followed by Dunnett test was performed to test for differences in biofilm biomass and displayed only when significant as *p≤0.05, **p≤0.01, ***p≤0.001, or ****p≤0.0001. Exact p-values are displayed in Supplementary file 2. (B, D) Representative scanning electron microscopy (SEM) images of LAC∆spa∆sbi (B) and Wood46 (D) biofilms established on glass coverslips following 24 hr incubation at 37°C. SA, S. aureus; EPS, extracellular polymeric substance structure.
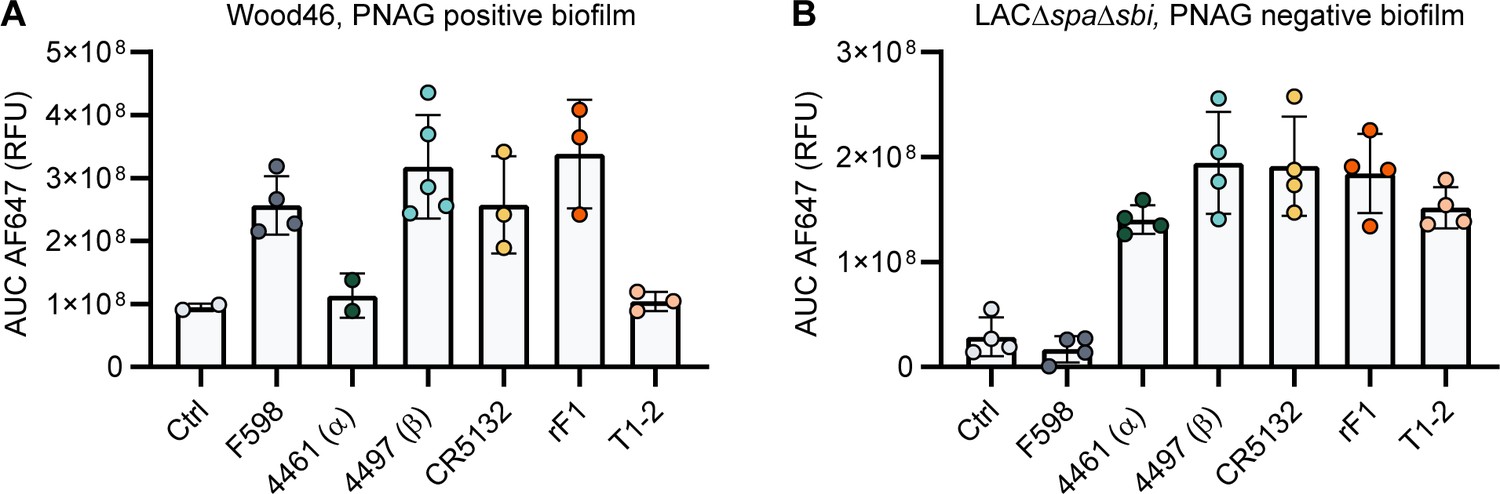
Figure 2 with 4 supplements
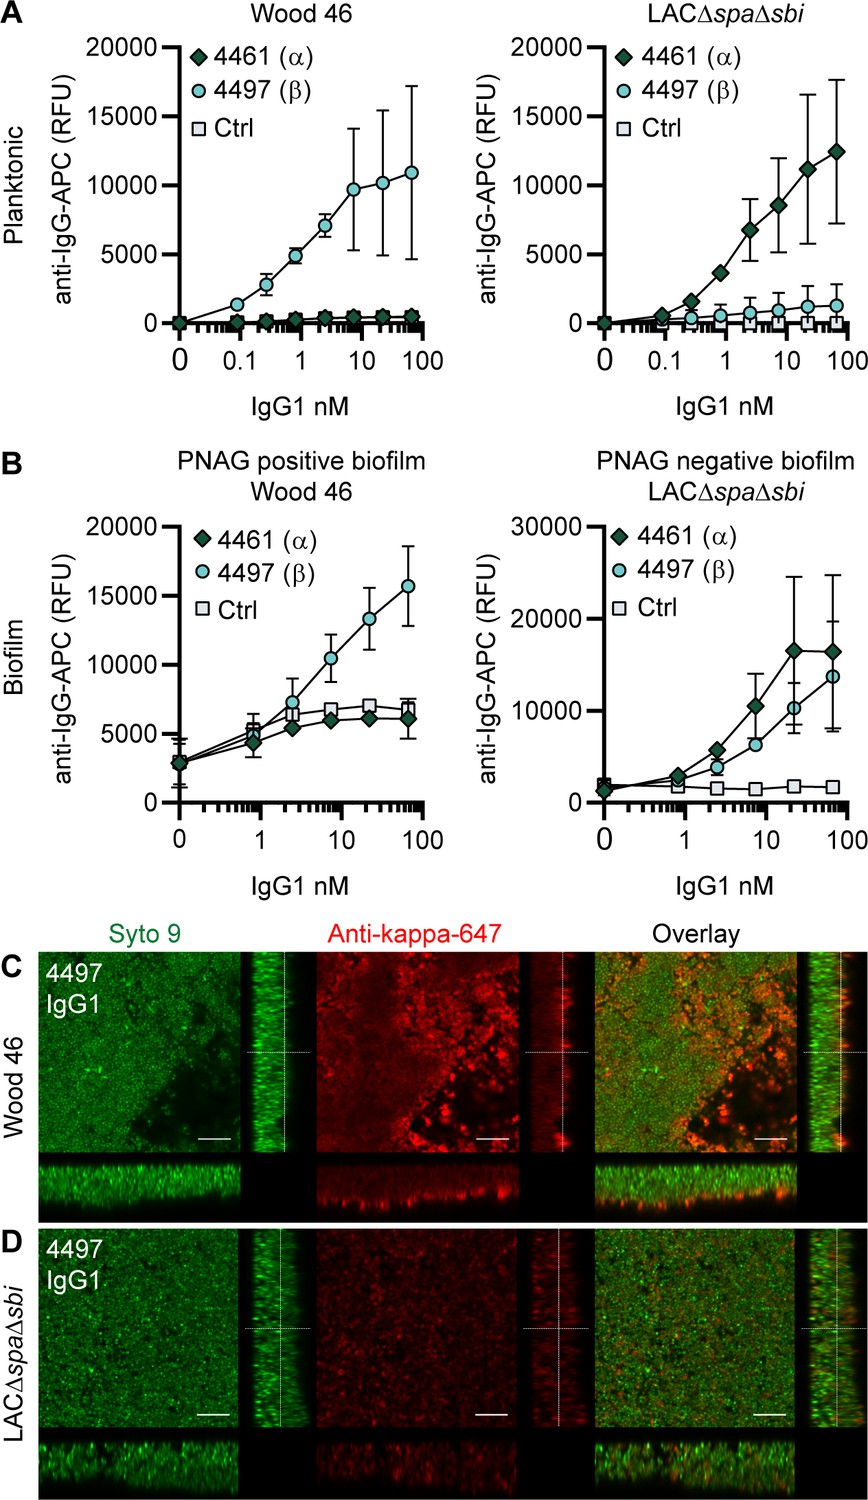
IgG1 monoclonal antibodies (mAbs) against wall teichoic acid (WTA) bind S. aureus in planktonic and biofilm mode.
(A) Planktonic bacteria of Wood46 (left) and LAC∆spa∆sbi (right) were grown to exponential phase and incubated with a concentration range of 4461-IgG1 or 4497-IgG1. mAb binding was detected using APC-labeled anti-human IgG antibodies and flow cytometry and plotted as geoMFI of the bacterial population. (B) Biofilms of Wood46 (left) and LAC∆spa∆sbi (right) were grown for 24 hr and incubated with a concentration range of 4461-IgG1 or 4497-IgG1. mAb binding was detected using APC-labeled anti-human IgG antibodies and a plate reader and plotted as fluorescence intensity per well. Data represent mean + SD of three independent experiments. (C, D) Biofilm was grown for 24 hr and incubated with 66 nM IgG1 mAb. Bacteria were visualized by Syto9 (green), and mAb binding was detected by staining with Alexa Fluor 647-conjugated goat-anti-human-kappa F(ab′)2 antibody (red). Orthogonal views are representative for a total of three Z-stacks per condition and at least two independent experiments. Scale bars: 10 μm.
Figure 2—figure supplement 1
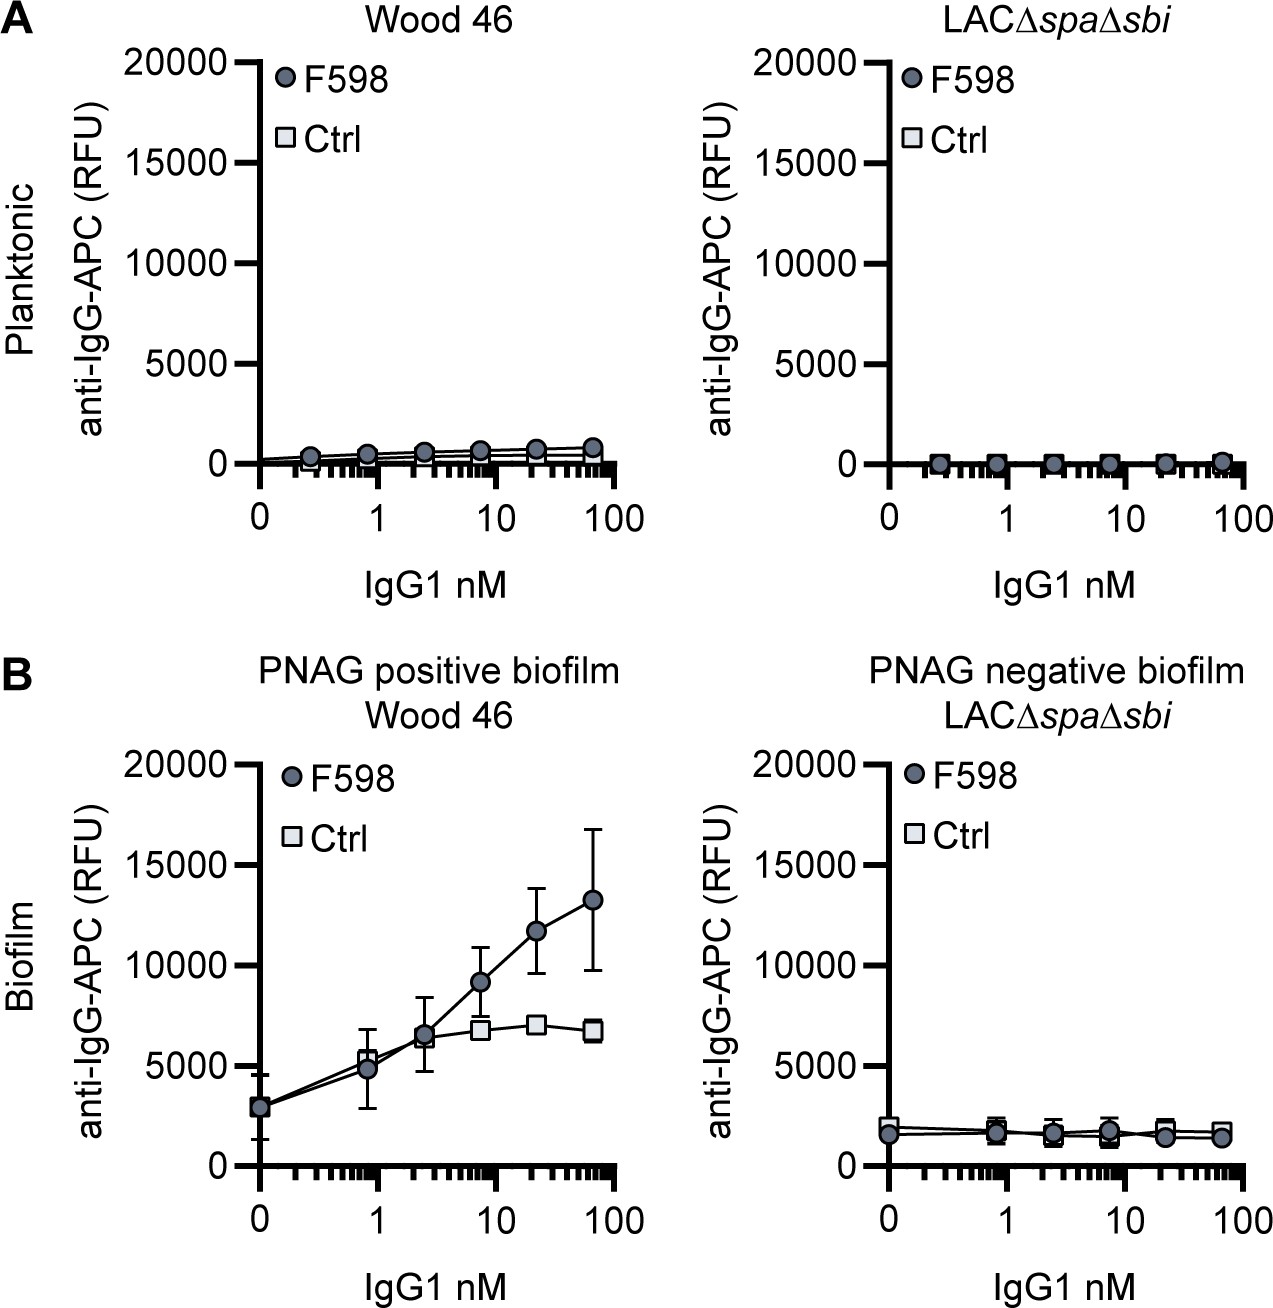
F598-IgG1 binds poly-N-acetyl glucosamine (PNAG)-dependent biofilms specifically.
(A) Planktonic bacteria of LAC∆spa∆sbi (left) and Wood46 (right) were grown to exponential phase and incubated with a concentration range of F598-IgG1. MAb binding was detected using APC-labeled anti-human IgG antibodies and flow cytometry and plotted as geoMFI of the bacterial population. (B) Biofilm of Wood46 and LAC∆spa∆sbi were grown for 24 h and incubated with a concentration range of F598-IgG1. MAb binding was detected using APC-labeled anti-human IgG antibodies and a plate reader and plotted as fluorescence intensity per well. Data represent mean + SD of three independent experiments.
Figure 2—figure supplement 2
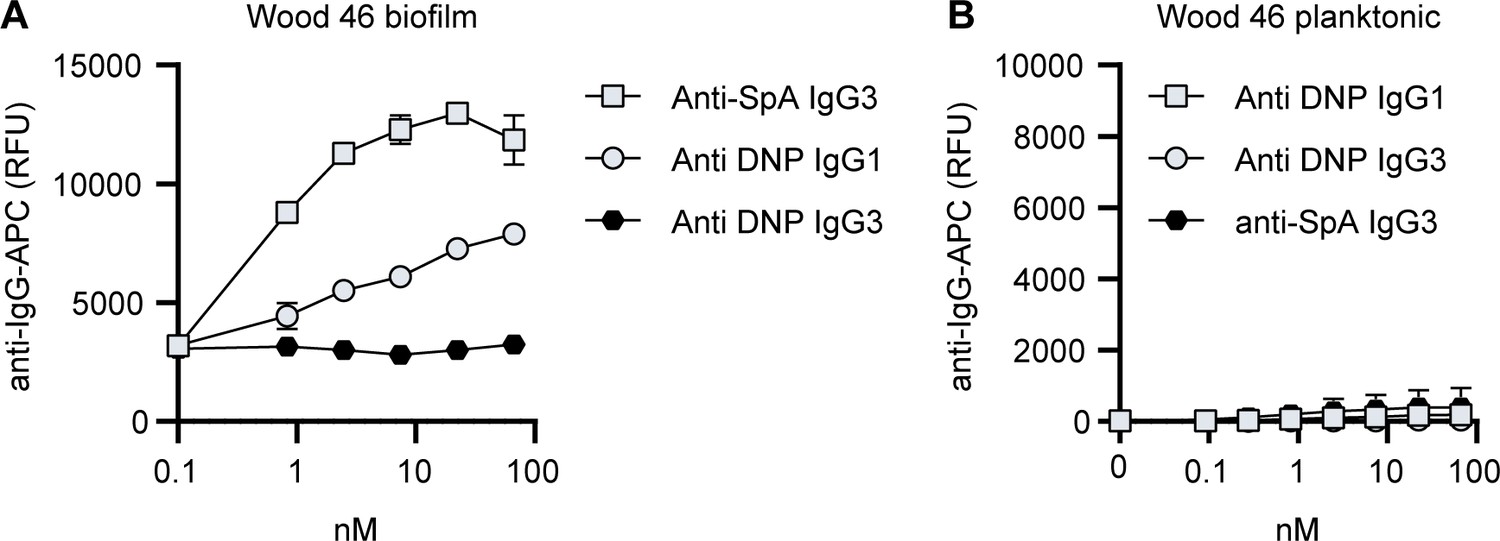
Background control monoclonal antibody (mAb) binding to Wood46 biofilm due to incorporation of secreted SpA in biofilm.
(A) Wood46 biofilm was grown for 24 h and incubated with control IgG1, IgG3 and anti-SpA IgG3. Mab binding was detected using anti-human-kappa-AF647 antibodies and a plate reader. (B) Planktonic exponential Wood46 bacteria were incubated with control IgG1, IgG3 and anti-SpA IgG3. Mab binding was detected using anti-human-kappa-AF647 antibodies and flow cytometry. Data represent mean + SD of three independent experiments.
Figure 2—figure supplement 3
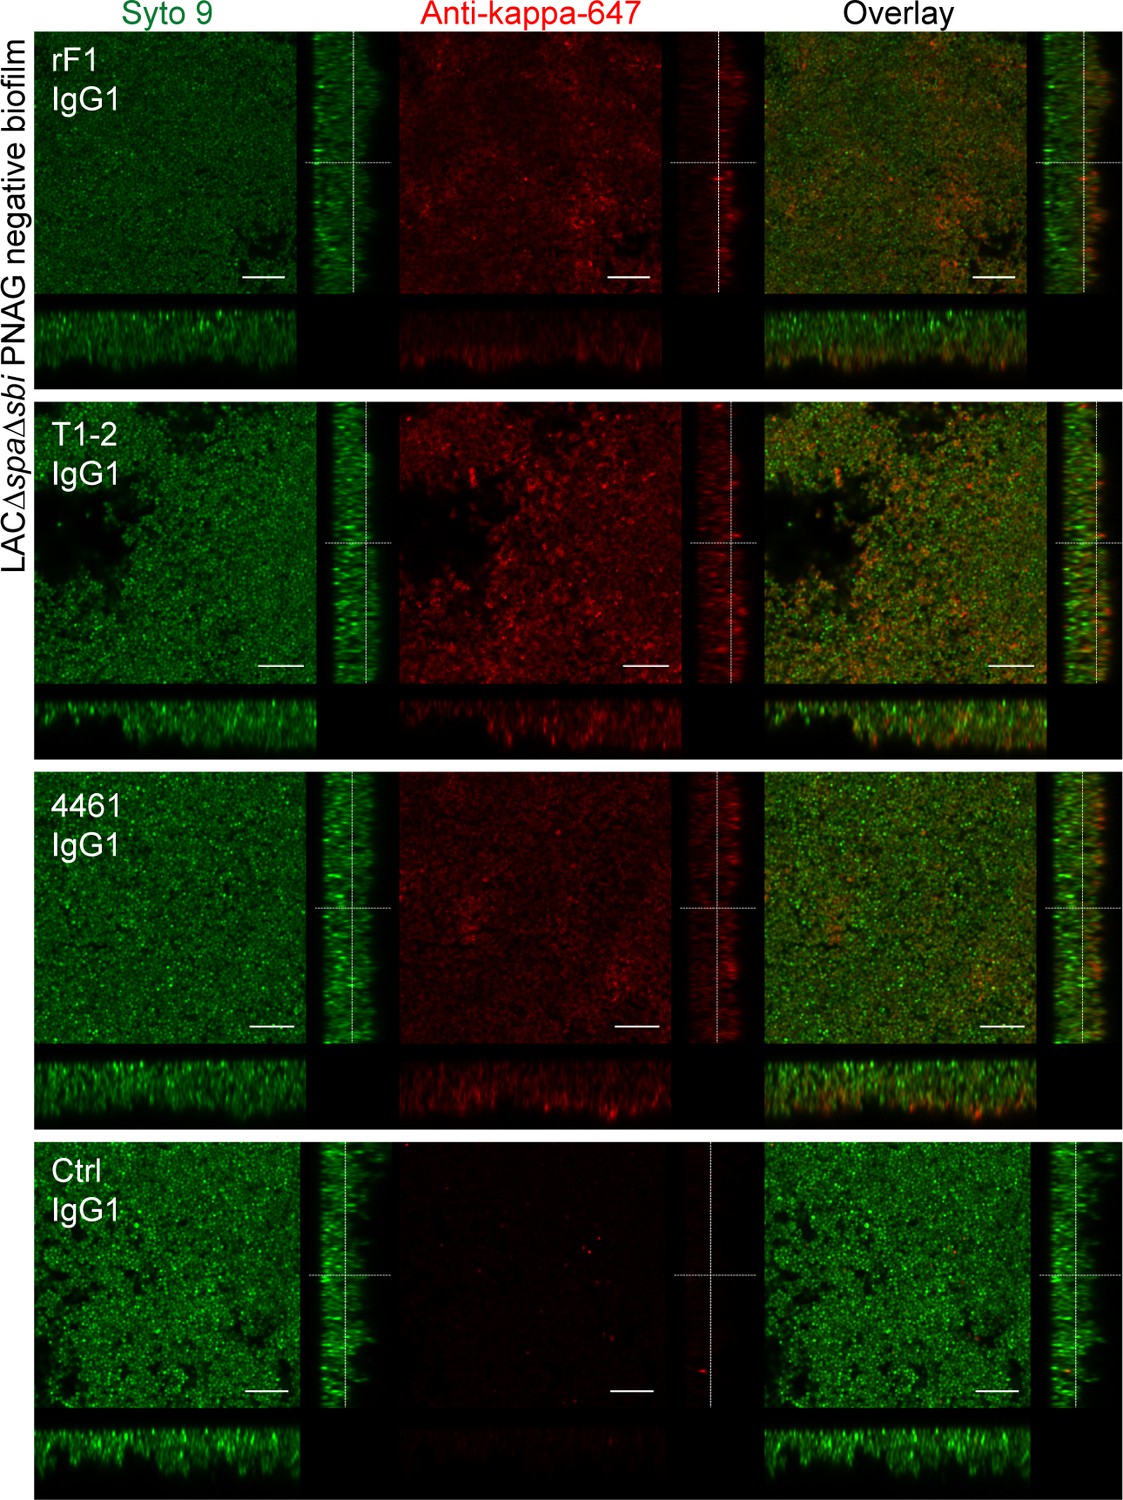
Orthogonal views of poly-N-acetyl glucosamine (PNAG)-negative biofilm incubated with IgG1 monoclonal antibodies (mAbs).
Biofilm was grown for 24 h and incubated with 66 nM IgG1 mAbs or isotype controls. Bacteria were visualized by Syto 9 (green) and mAb binding was detected by staining with Alexa Fluor 647 conjugated goat-anti-human-kappa F(ab’)2 antibody (red). Syto 9 and AF647 were imaged using 488 and 633 nm lasers. Images are representative for a total of three Z-stacks per condition and two independent experiments. Scale bars: 10 μm.
Figure 2—figure supplement 4
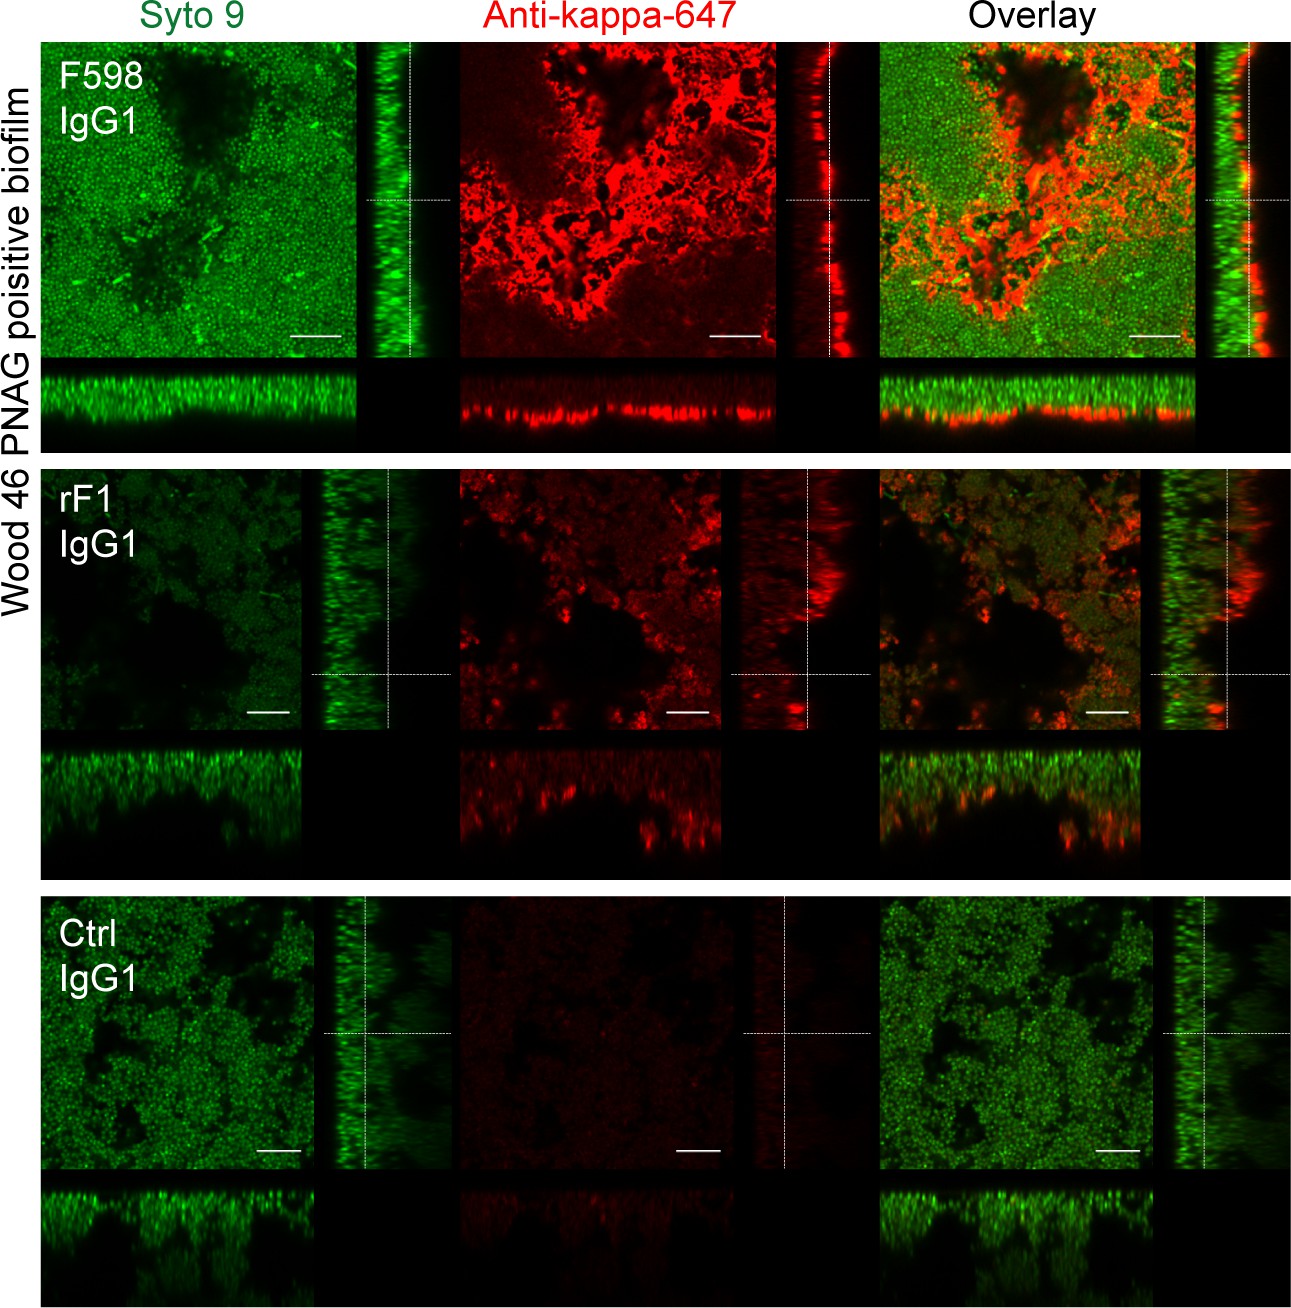
Orthogonal views of poly-N-acetyl glucosamine (PNAG)-positive biofilm incubated with IgG1 monoclonal antibodies (mAbs).
Biofilm was grown for 24 h and incubated with 66 nM IgG1 mAbs or isotype controls. Bacteria were visualized by Syto 9 (green) and mAb binding was detected by staining with Alexa Fluor 647 conjugated goat-anti-human-kappa F(ab’)2 antibody (red). Syto 9 and AF647 were imaged using 488 and 633 nm lasers. Images are representative for a total of three Z-stacks per condition and two independent experiments. Scale bars: 10 μm.
Figure 3 with 1 supplement
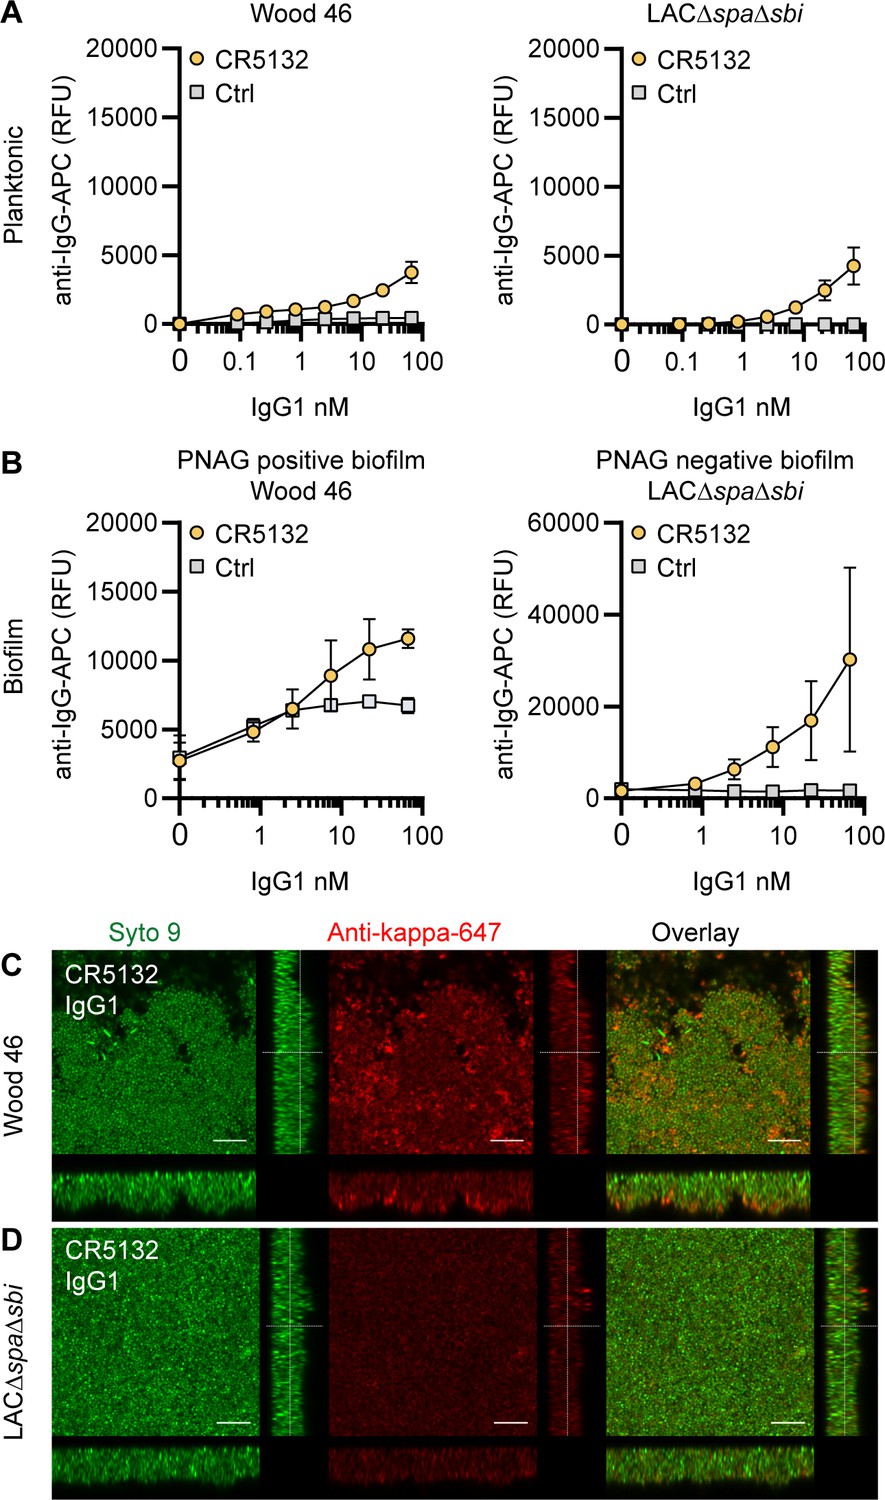
CR5132-IgG1 discriminates between planktonic bacteria and biofilm.
(A) Planktonic bacteria of Wood46 (left) and LAC∆spa∆sbi (right) were grown to exponential phase and incubated with a concentration range of CR5132-IgG1. Monoclonal antibody (mAb) binding was detected using APC-labeled anti-human IgG antibodies and flow cytometry and plotted as geoMFI of the bacterial population. (B) Biofilms of Wood46 (left) and LAC∆spa∆sbi (right) were grown for 24 hr and incubated with a concentration range of CR5132-IgG1. mAb binding was detected using APC-labeled anti-human IgG antibodies and a plate reader and plotted as fluorescence intensity per well. Data represent mean + SD of at least three independent experiments. (C, D) Biofilm was grown for 24hr and incubated with 66 nM IgG1 mAb. Bacteria were visualized by Syto9 (green), and mAb binding was detected by staining with Alexa Fluor 647-conjugated goat-anti-human-kappa F(ab′)2 antibody (red). Orthogonal views are representative for a total of three Z-stacks per condition and at least two independent experiments. Scale bars: 10 μm.
Figure 3—figure supplement 1
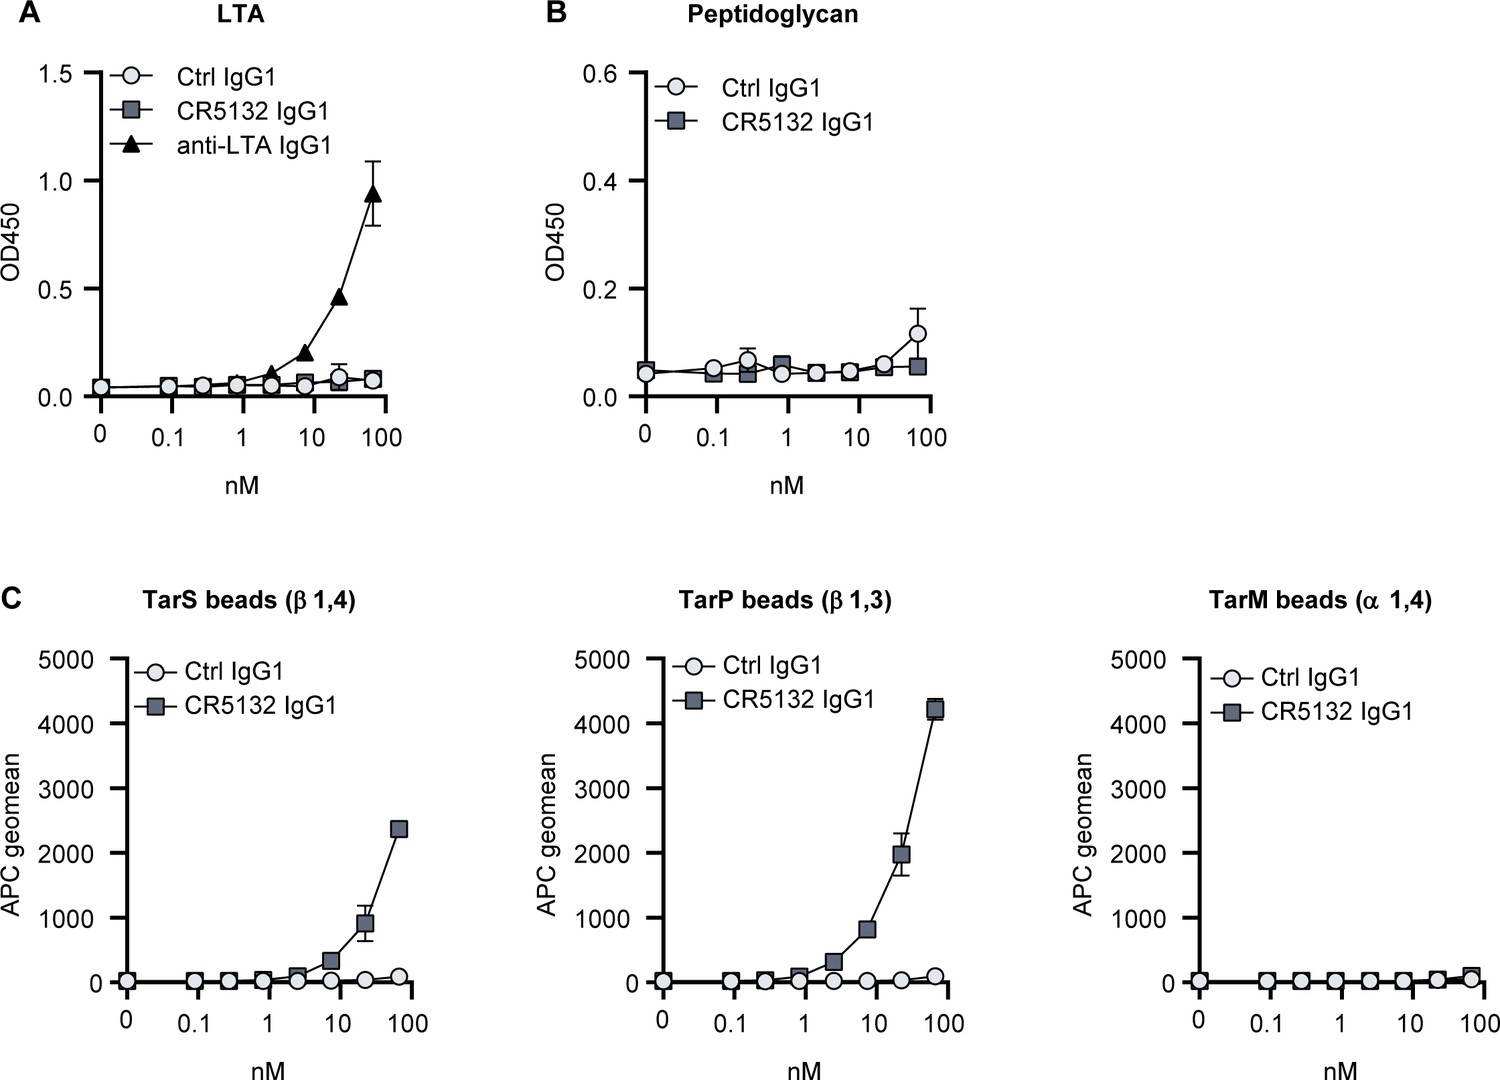
Target identification of CR5132.
(A, B) ELISA plates were coated with purified peptidoglycan (A) and LTA (B). Plates were incubated with a concentration range of monoclonal antibodies (mAbs), and mAb binding was detected using anti-human kappa-HRP antibodies. (C) Wall teichoic acid (WTA)-coated beads were incubated with a concentration range of mAbs. mAb binding was detected using APC-labeled anti-human IgG antibodies and flow cytometry and plotted as geoMFI + SD of duplicates in one independent experiment (B, C).
Figure 4 with 1 supplement
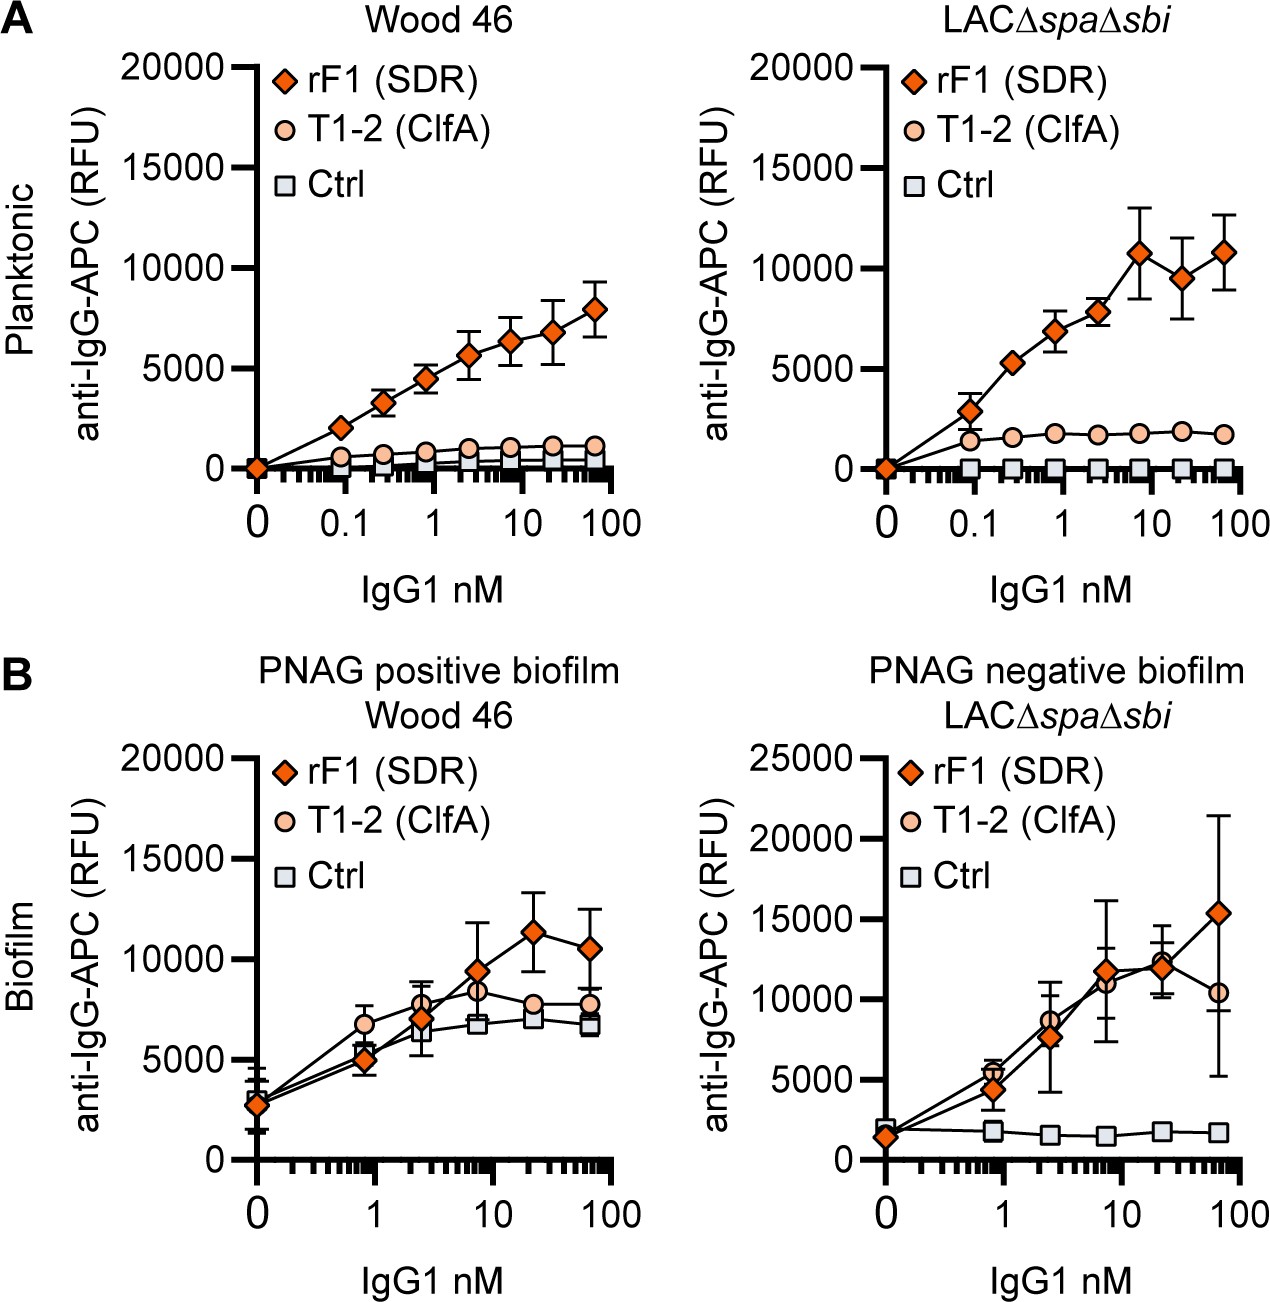
IgG1 monoclonal antibodies (mAbs) against protein components bind planktonic bacteria as well as biofilm.
(A) Planktonic bacteria of Wood46 (left) and LAC∆spa∆sbi (right) were grown to exponential phase and incubated with a concentration range of rF1-IgG1 or T1-2-IgG1. mAb binding was detected using APC-labeled anti-human IgG antibodies and flow cytometry and plotted as geoMFI of the bacterial population. (B) Biofilms of Wood46 (left) and LAC∆spa∆sbi (right) were grown for 24 hr and incubated with a concentration range of rF1-IgG1 or T1-2-IgG1. mAb binding was detected using APC-labeled anti-human IgG antibodies and a plate reader and plotted as fluorescence intensity per well. Data represent mean + SD of three independent experiments.
Figure 4—figure supplement 1
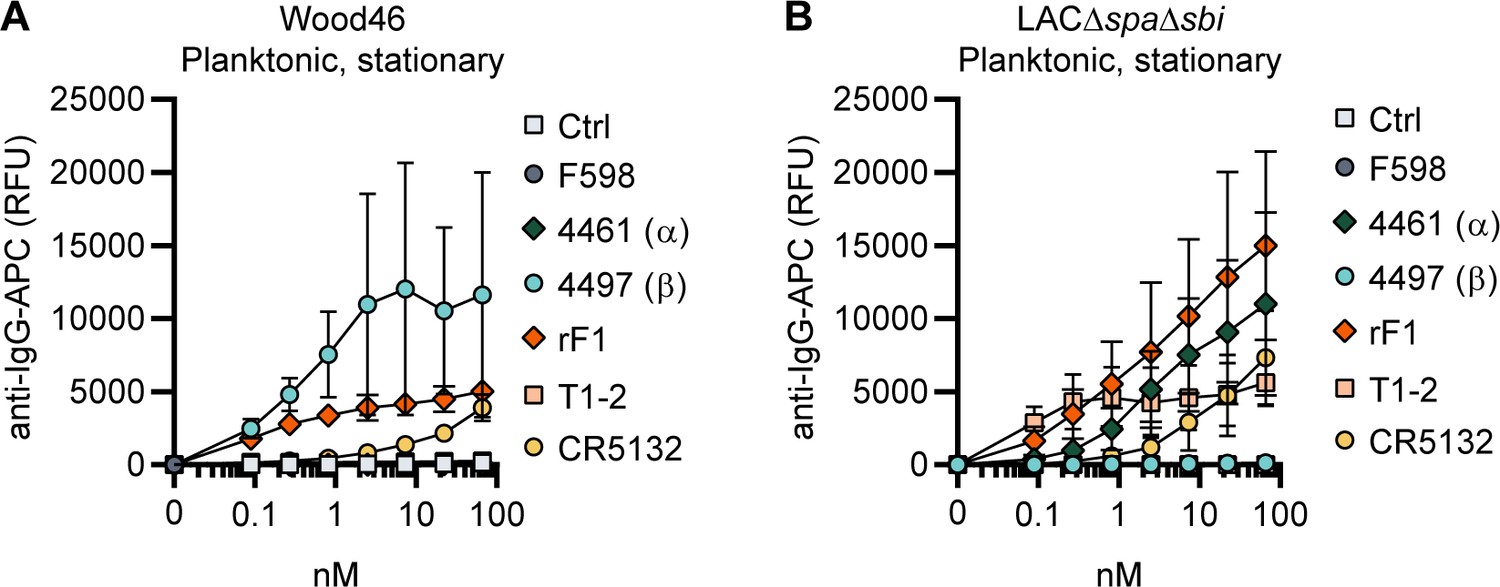
Binding of the monoclonal antibody (mAb) panel to stationary phase planktonic cultures.
Planktonic bacteria of Wood46 (A) LAC∆spa∆sbi (B) were grown to stationary phase and incubated with a concentration range of mAbs. mAb binding was detected using APC-labeled anti-human IgG antibodies and flow cytometry and plotted as geoMFI of the bacterial population. Data represent mean + SD of three independent experiments.
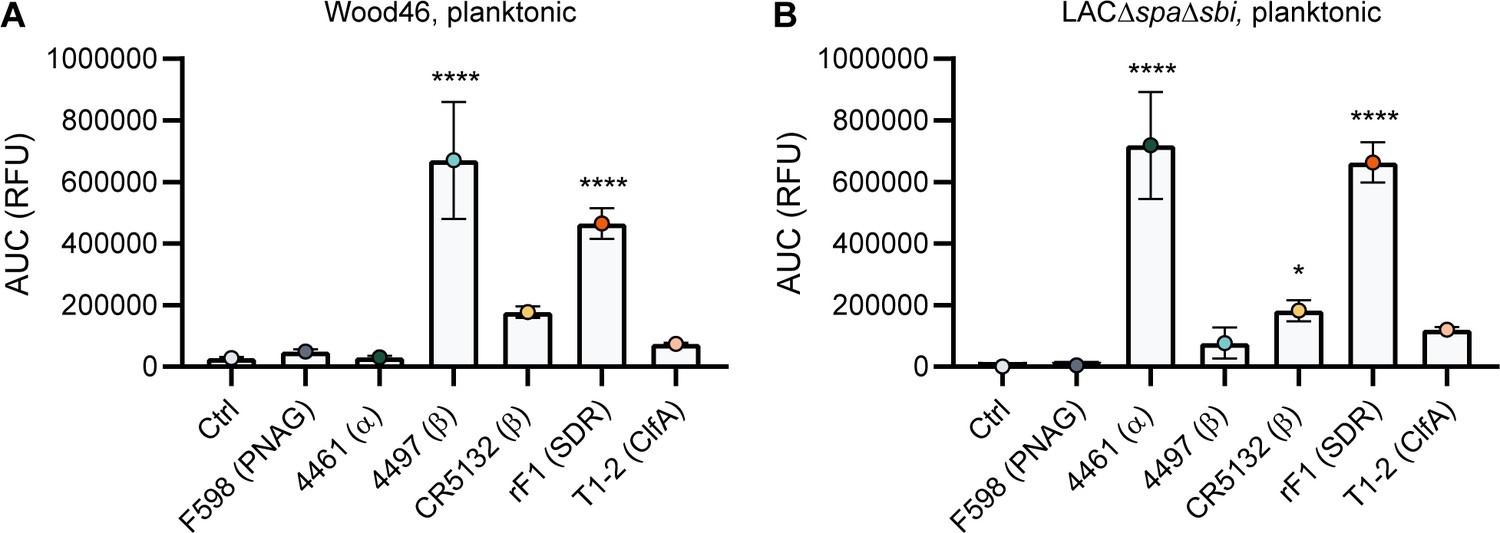
Figure 5 with 4 supplements
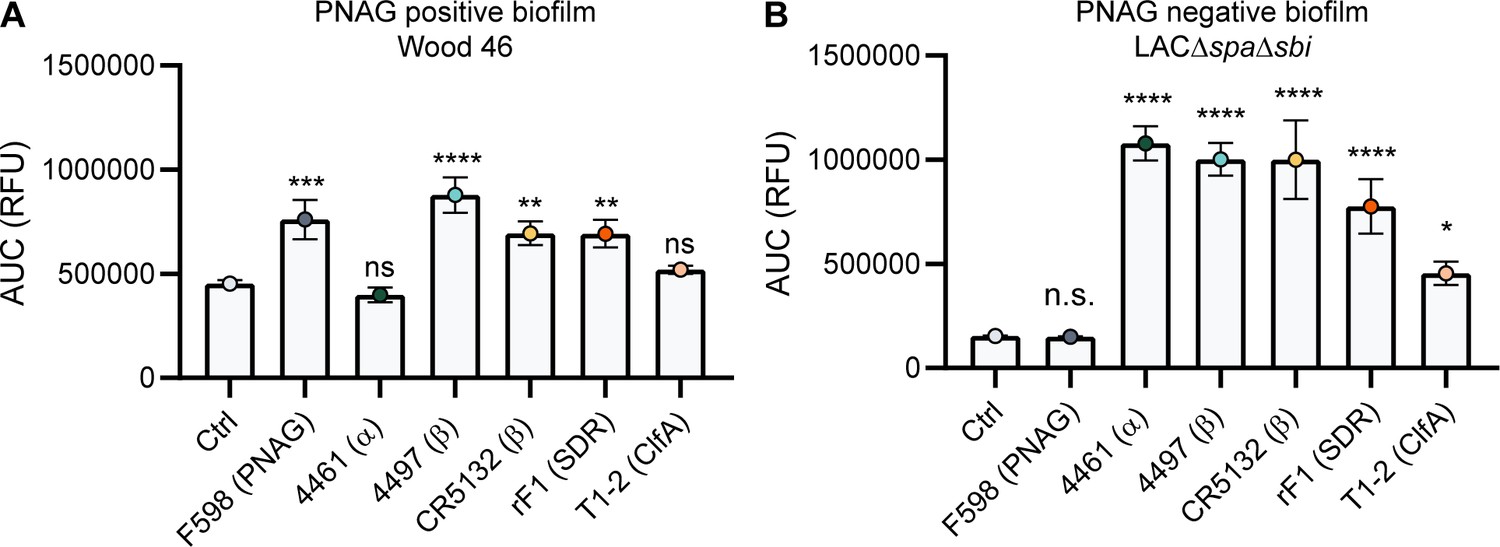
Comparative binding of IgG1 monoclonal antibodies (mAbs) to S. aureus biofilm.
Biofilms of Wood46 (A) and LAC∆spa∆sbi (B) were grown for 24 hr and incubated with a concentration range of IgG1 mAbs. mAb binding was detected using APC-labeled anti-human IgG antibodies and a plate reader. Data are expressed as area under the curve (AUC) of the binding curve (mean + SD) of three independent experiments. One-way ANOVA followed by Dunnett test was performed to test for differences in antibody binding versus control and displayed only when significant as *p≤0.05, **p≤0.01, ***p≤0.001, or ****p≤0.0001. Exact p-values are displayed in Supplementary file 2.
Figure 5—figure supplement 1
Comparative binding of IgG1 monoclonal antibodies (mAbs) to planktonic bacteria.
Planktonic bacteria of Wood46 (A) and LAC∆spa∆sbi (B) were grown to exponential phase and incubated with a concentration range of IgG1 mAbs. mAb binding was detected using APC-labeled anti-human IgG antibodies and flow cytometry. Data are expressed as area under the curve (AUC) of the binding curve (mean + SD) of three independent experiments. One-way ANOVA followed by Dunnett test was performed to test for differences in antibody binding versus control and displayed only when significant as *p≤0.05, **p≤0.01, ***p≤0.001, or ****p≤0.0001. Exact p-values are displayed in Supplementary file 2.
Figure 5—figure supplement 2
Mean total fluorescence per Z-stack corresponds to plate reader data.
The total AF647 signal of obtained Z-stack profiles of biofilms Wood46 (A) and LAC∆spa∆sbi (B) was calculated using Leica LAS AF imaging software. Data are representative for two independent experiments.
Figure 5—figure supplement 3
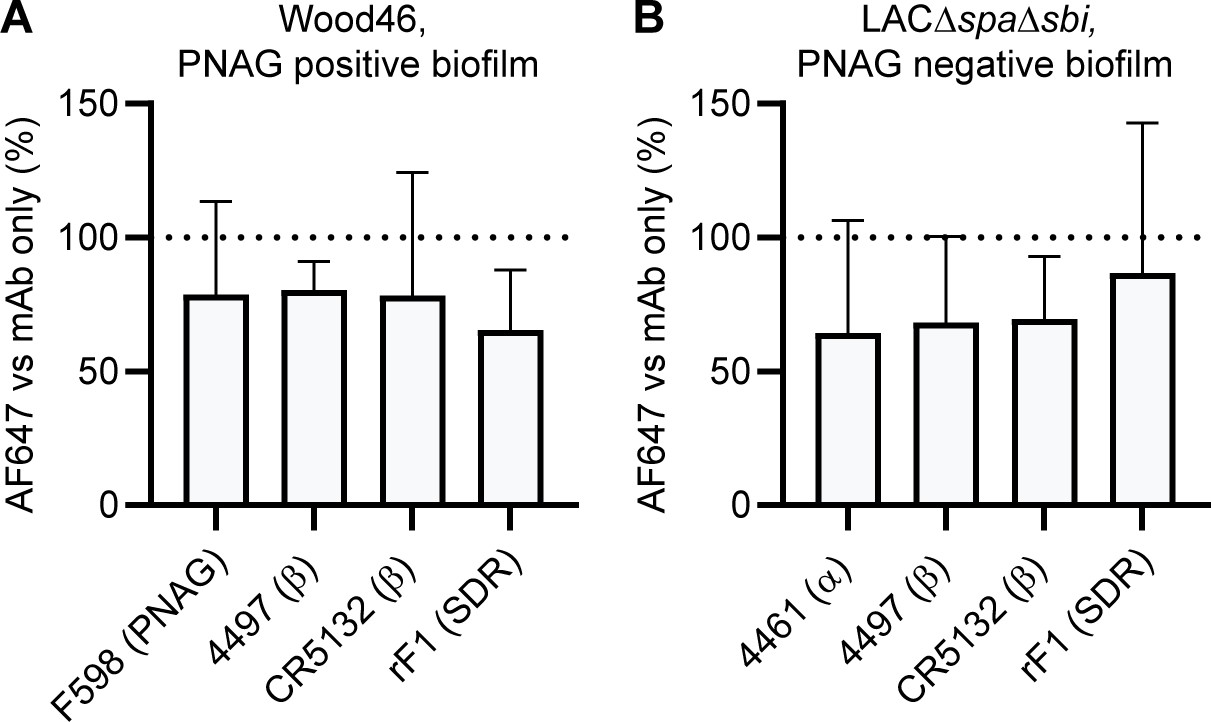
Binding in the presence of pooled serum IgG.
Biofilm cultures of Wood46 (A) and LAC∆spa∆sbi (B) were incubated with 10 µg/mL AF647-conjugated IgG1 monoclonal antibodies (mAbs) in buffer or buffer containing 250 µg/mL pooled IgG. Data are expressed as % relative to mAb binding in buffer of three independent experiments performed in duplicate.
Figure 5—figure supplement 4
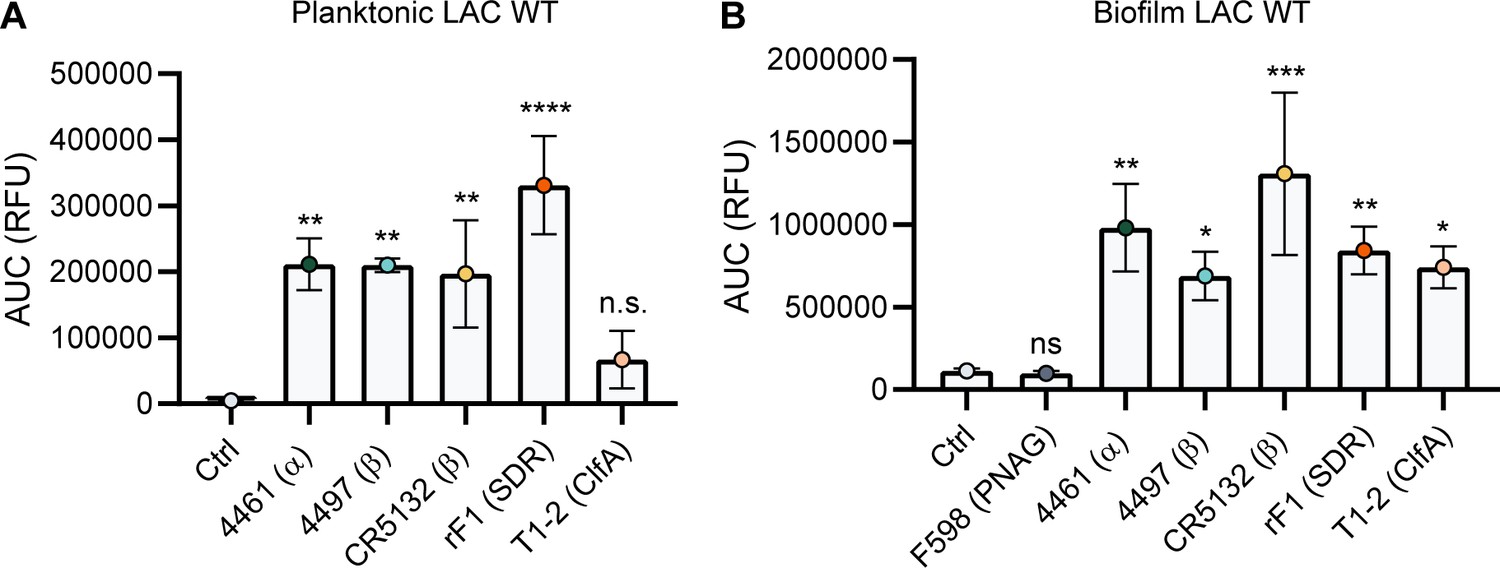
Binding of IgG3 monoclonal antibodies (mAbs) to planktonic and biofilm LAC wild type.
(A) Planktonic bacteria of LAC WT (AH1263) were grown to exponential phase and incubated with a concentration range of IgG3 mAbs. mAb binding was detected using APC-labeled anti-human IgG antibodies and flow cytometry and plotted as geoMFI of the bacterial population. (B) LAC WT (AH1263) biofilm was grown for 24 hr and incubated with a concentration range of IgG3 mAbs. mAb binding was detected using APC-labeled anti-human IgG antibodies and a plate reader. Data represent mean + SD of three independent experiments. One-way ANOVA followed by Dunnett test was performed to test for differences in antibody binding versus control and displayed only when significant as *p≤0.05, **p≤0.01, ***p≤0.001, or ****p≤0.0001. Exact p-values are displayed in Supplementary file 2.
Figure 6
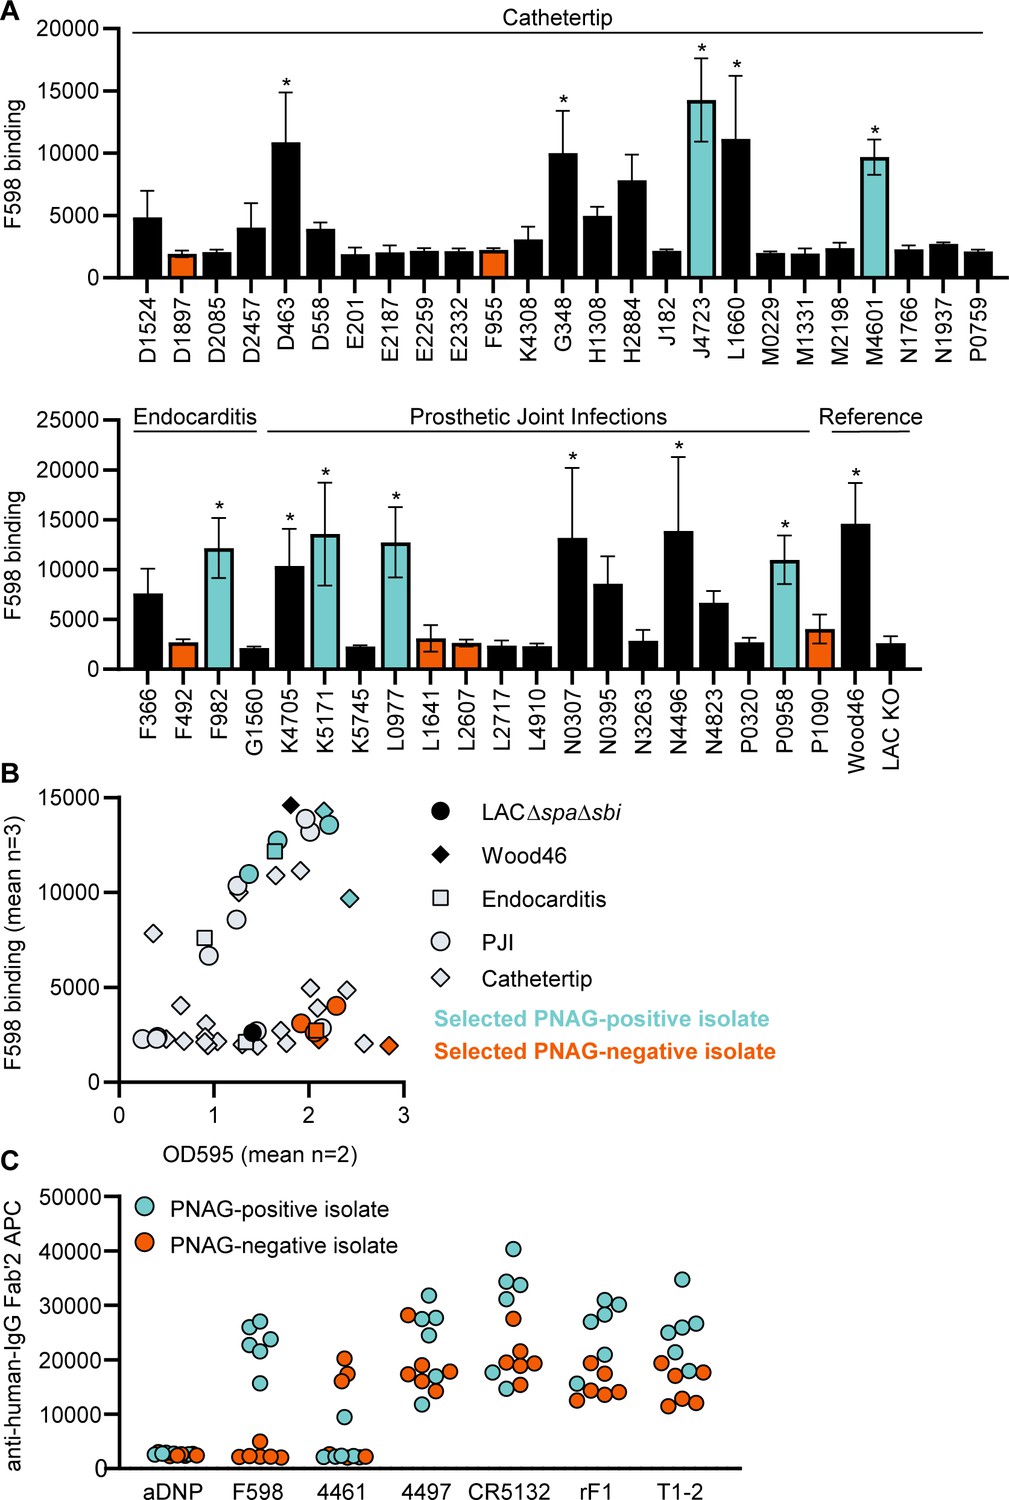
Binding of monoclonal antibodies (mAbs) to S. aureus clinical isolate biofilm.
(A) Biofilm of clinical isolates derived from catheter tip, endocarditis, and prosthetic joint infections (PJIs) was grown for 24 hr and incubated with 33 nM F598-IgG3. mAb binding was detected using APC-labeled anti-human IgG antibodies and a plate reader. (B) Scatter plot of F598-IgG3 binding to isolates and biofilm adherent biomass measured by crystal violet staining after mAb binding assay. Isolates selected for (C) are indicated. (C) Biofilms of clinical isolates was grown for 24 hr and incubated with 33 nM IgG3 mAbs. mAb binding was detected using APC-labeled anti-human IgG antibodies and a plate reader. Data (A) represent mean + SD of three independent experiments. One-way ANOVA followed by Dunnett test was performed to test for differences in antibody binding versus LAC KO and displayed only when significant as *. Exact p-values are displayed in Supplementary file 2. Data (B) represent mean two independent experiments.
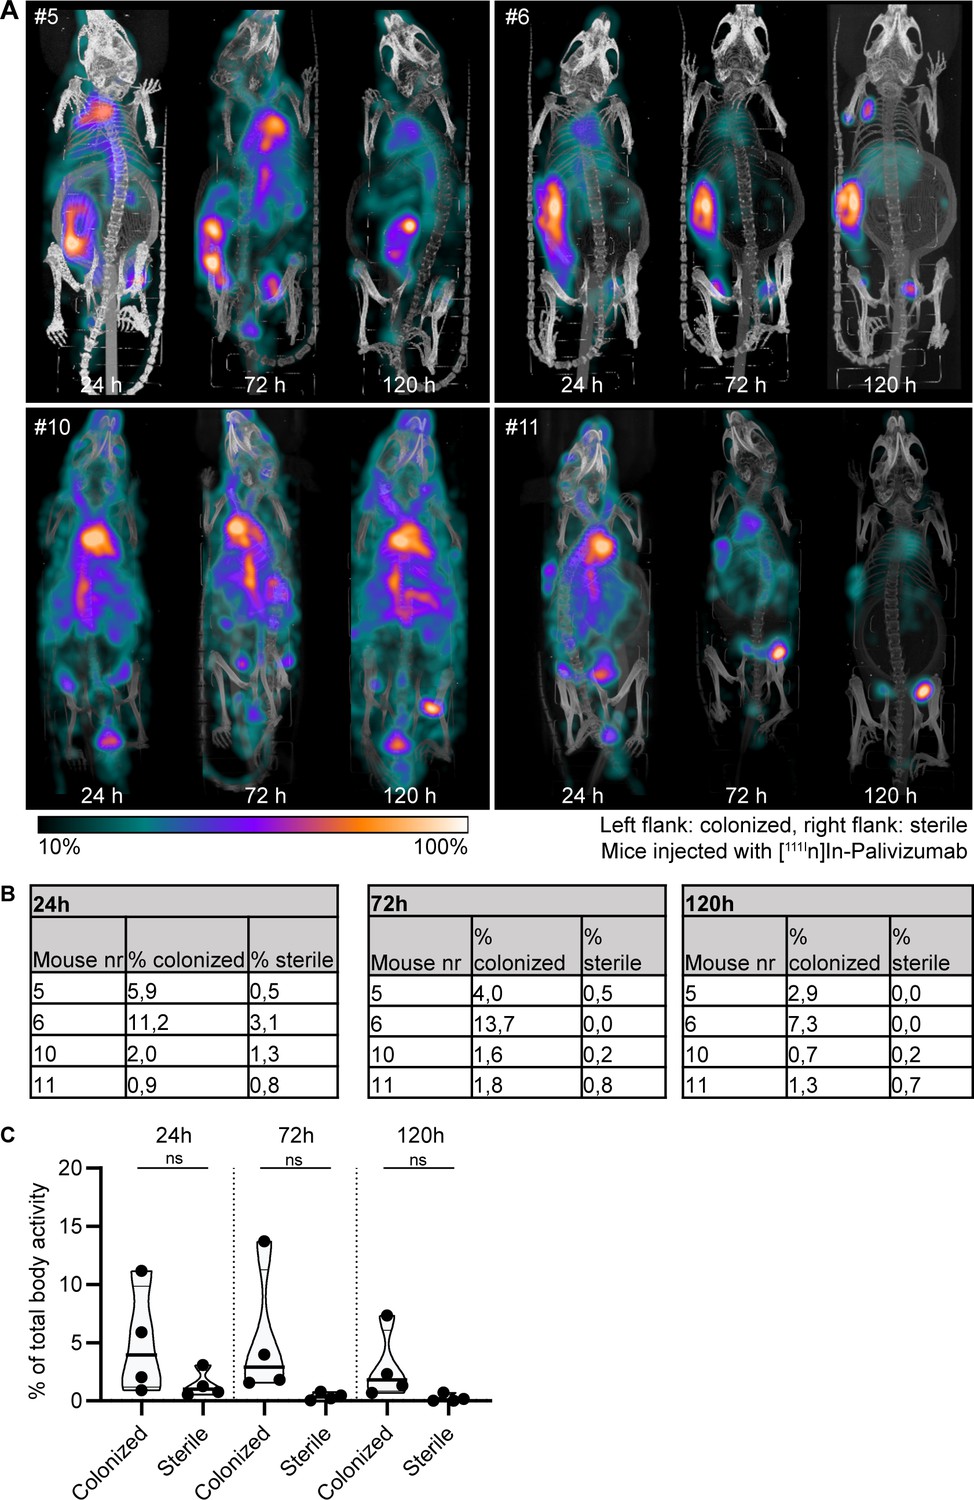
Figure 7 with 6 supplements
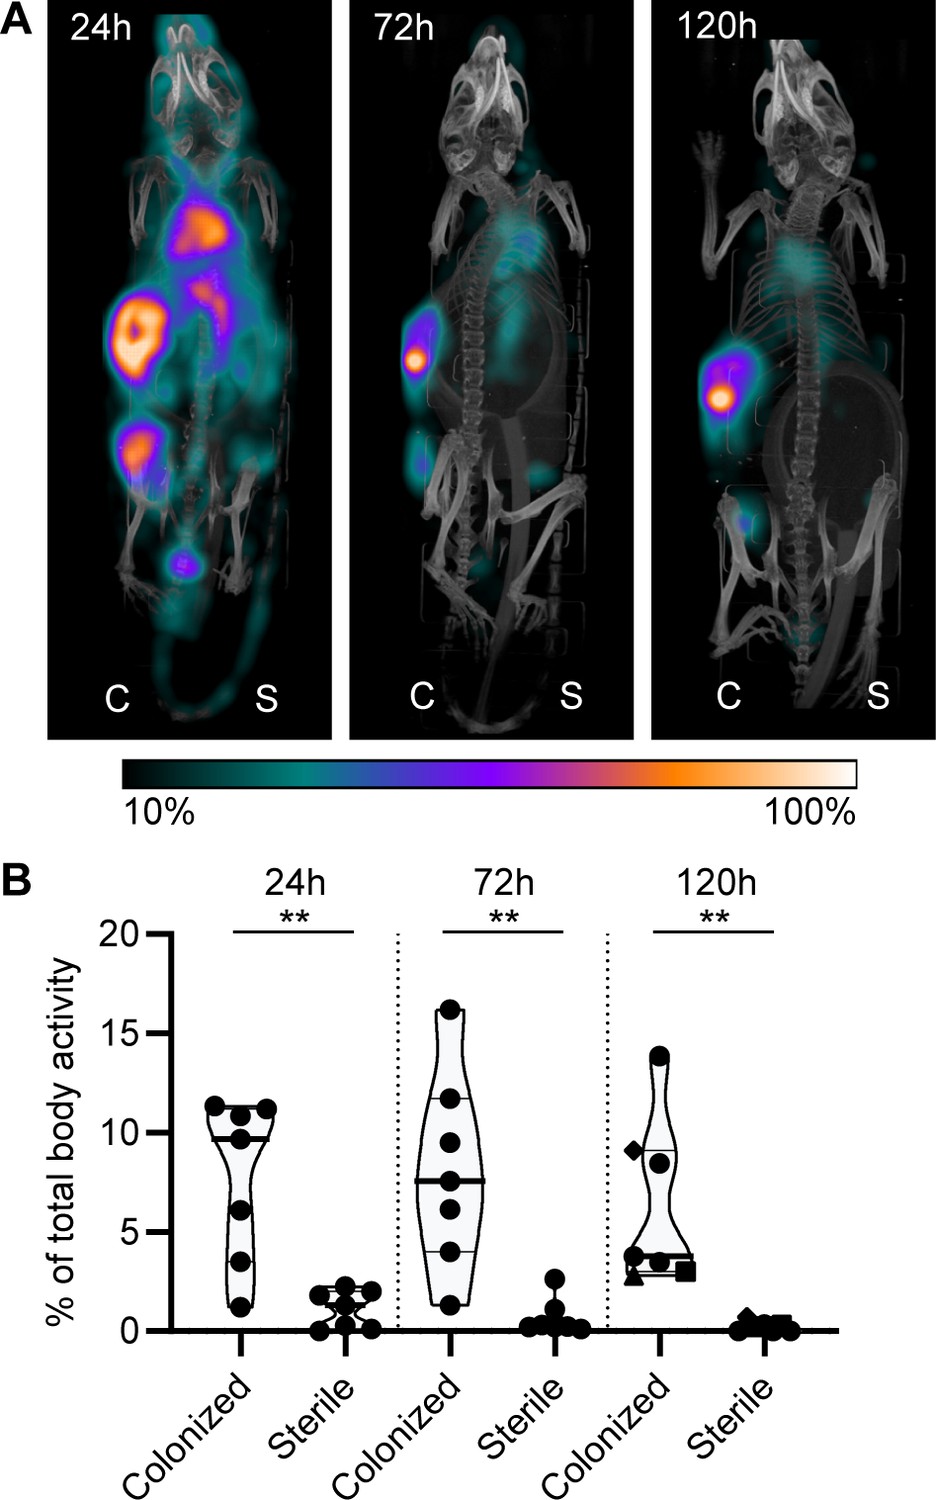
Localization of [111In]In-4497-IgG1 to a subcutaneous implant pre-colonized with biofilm.
Two days after implantation, mice were injected with 7.5 MBq [111In]In-4497-IgG1 (n = 7) and imaged at 24 hr, 72 hr, and 120 hr after injection. (A) Maximum intensity projection (corrected for decay) of a mouse subcutaneously bearing pre-colonized (C; left flank) and sterile (S; right flank) catheter. Additional scans can be seen in the supplementary information (Figure 7—figure supplement 2). (B) The activity detected in regions of interests was expressed as a percentage of total body activity. Each data point represents one mouse. A two-tailed paired t-test was performed to test for differences in activity in sterile versus colonized implants displayed as *p≤0.05, **p≤0.01, ***p≤0.001, or ****p≤0.0001. Exact p-values are displayed in Supplementary file 2.
Figure 7—figure supplement 1
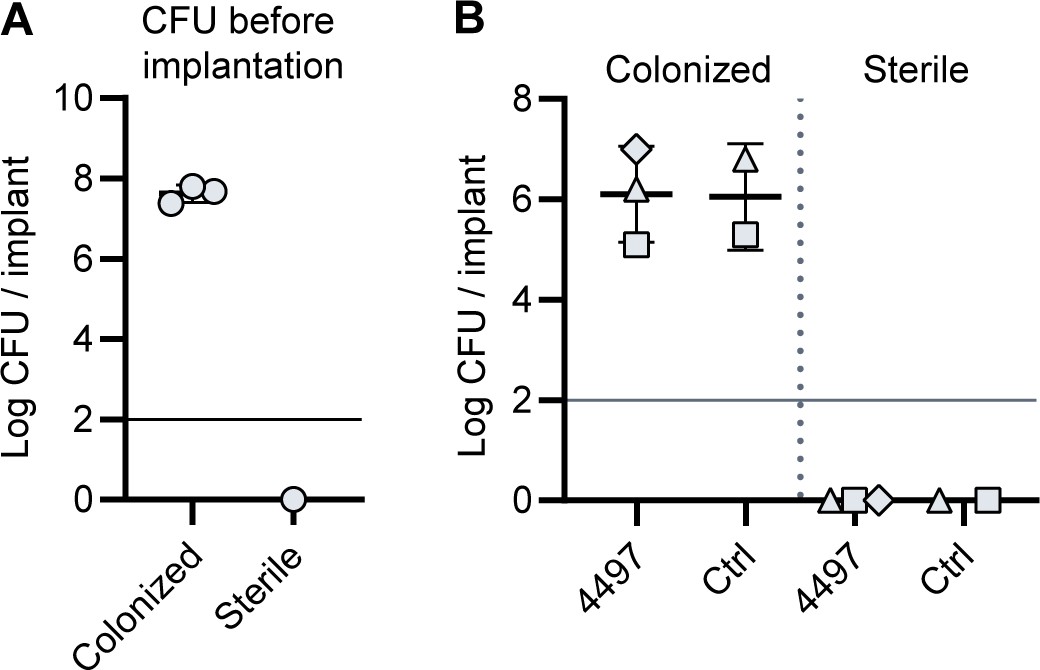
CFU count before implantation and after implantation.
(A) 5 mm PU catheter segments were inoculated with S. aureus LAC. After 48 hr of incubation, catheters were washed and sonicated and viable CFU counts recovered were determined. Each data point represents an independent experiment. (B) Mice received subcutaneous pre-colonized and sterile catheters and 2 days later were injected with [111In]In-4497-IgG1 (n = 3) or [111In]In-palivizumab (n = 2). At time point 120 hr, mice were sacrificed and catheters were removed to determine CFU counts. Horizontal lines indicate detection limit.
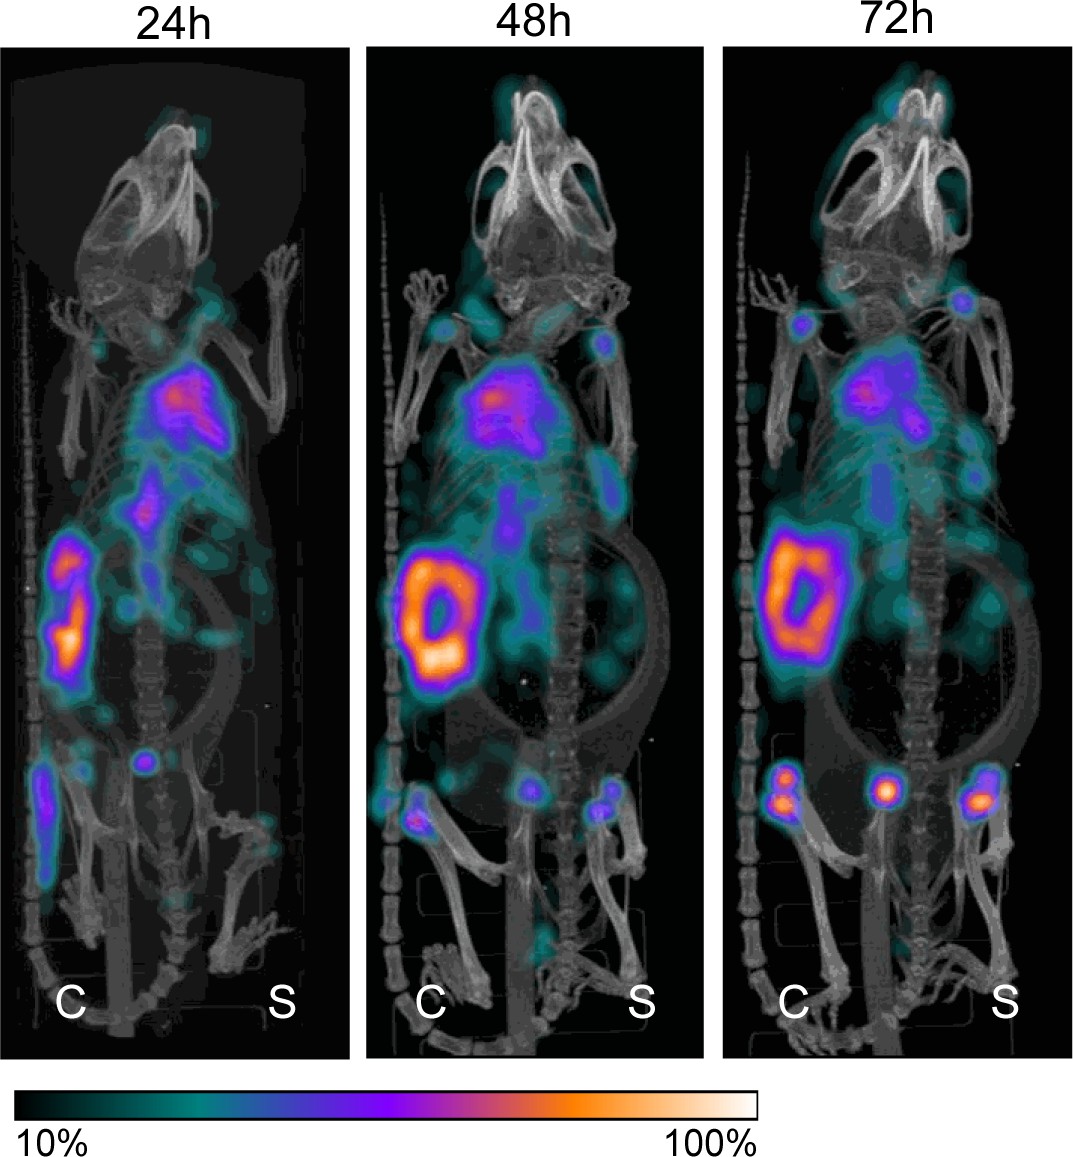
Figure 7—figure supplement 2
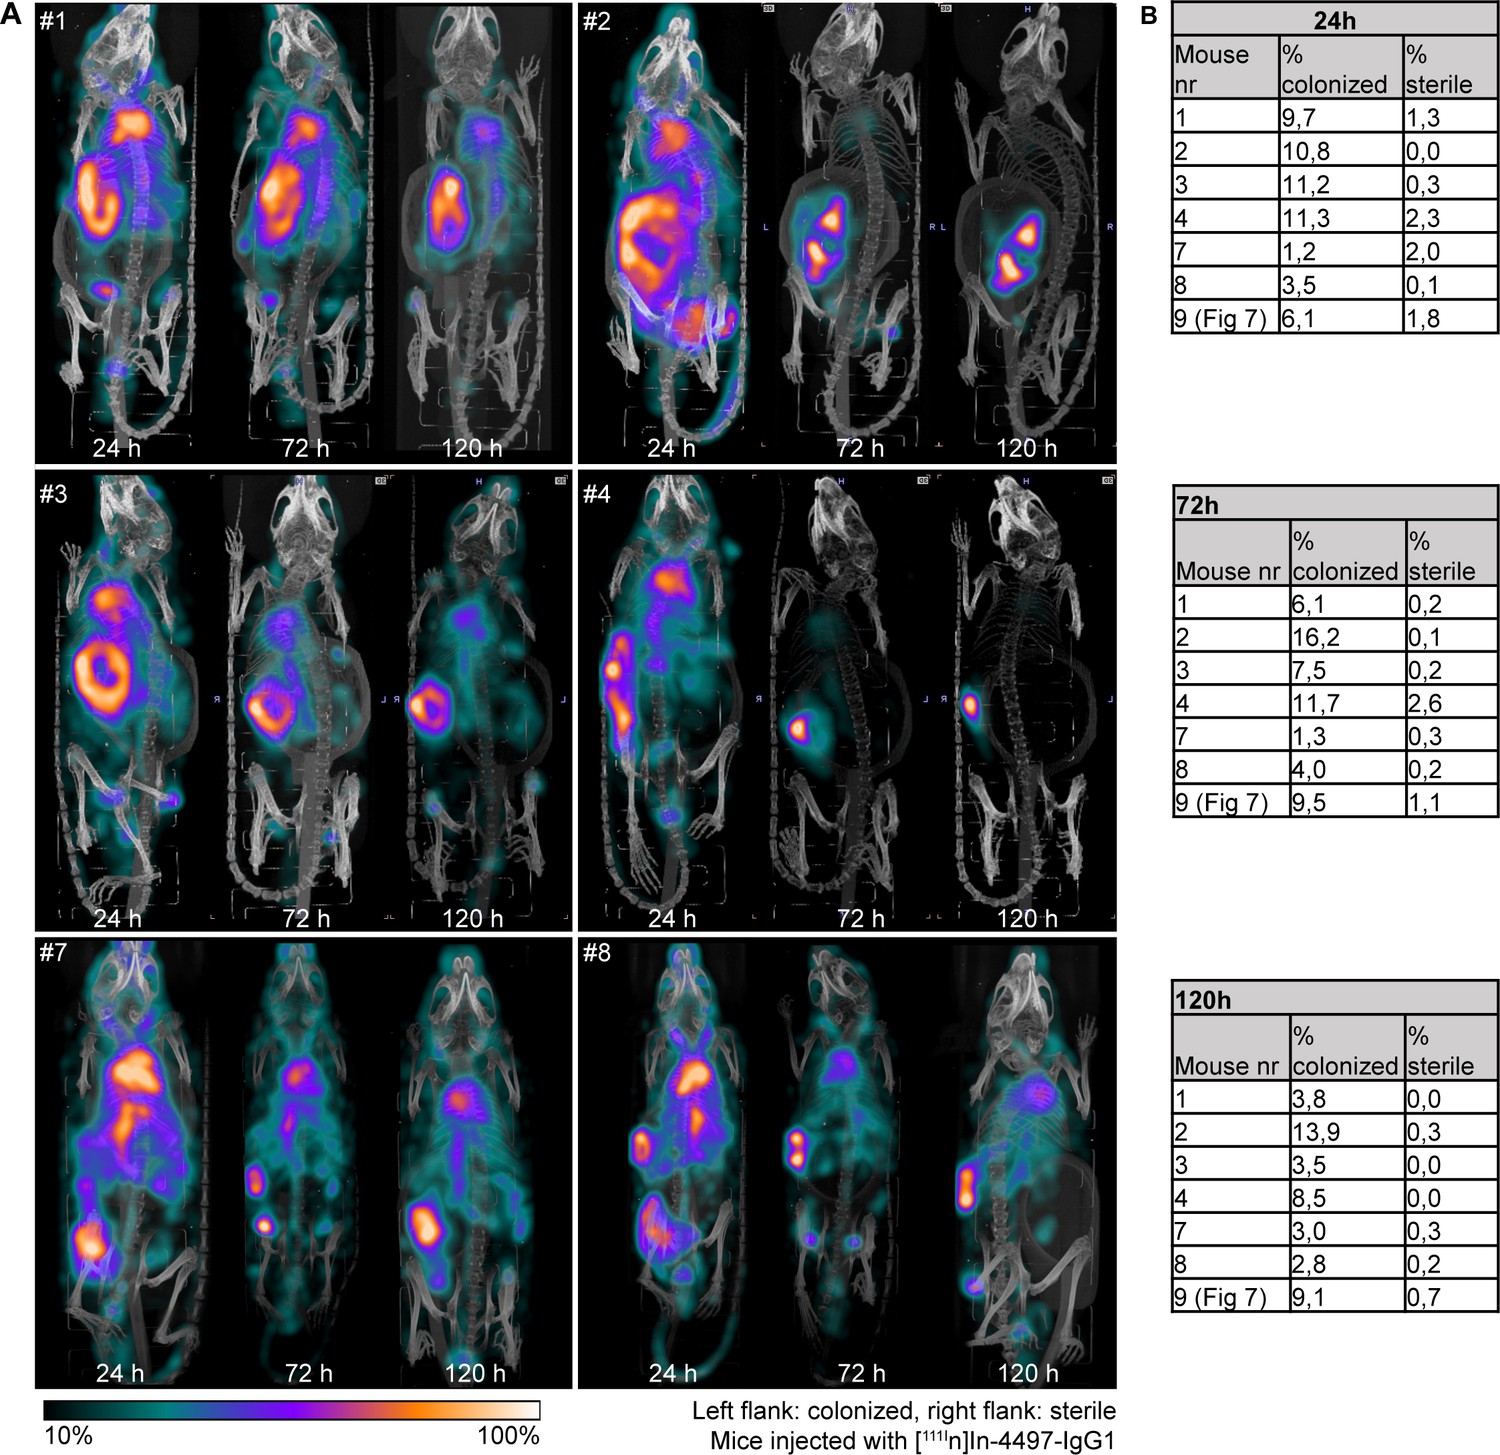
Localization of [111In]In-4497-IgG1 to subcutaneous implant pre-colonized with biofilm in a mouse model.
(A) Maximum intensity projections of [111In]In-4497-IgG1 injected in mice subcutaneously bearing pre-colonized (left flank) and sterile (right flank) catheters. Implantation of colonized and sterile implants was randomized; however, for clarity, we here display all colonized implants on the left. (B) Corresponding percentages in regions of interest (ROIs) per mouse.
Figure 7—figure supplement 3
Localization of [111In]In-palivizumab to a subcutaneous implant pre-colonized with biofilm.
(A) Maximum intensity projections (corrected for decay) of mice subcutaneously bearing pre-colonized (left flank) and sterile (right flank) catheters. Two days after implantation, mice were injected with 7.5 MBq [111In]In-palivizumab (n = 4) and imaged at 24 hr, 72 hr, and 120 hr after injection. Implantation of colonized and sterile implants was randomized, but for display all colonized implants are shown at the left flank. (B) Corresponding percentages in regions of interest (ROIs) per mouse. (C) The activity detected in regions of interests was expressed as a percentage of total body activity. Each data point represents one mouse. A two-tailed paired t-test was performed to test for differences in activity in sterile versus colonized implants. Exact p-values are displayed in Supplementary file 2.
Figure 7—figure supplement 4
Pilot study for localization of [111In]In-4497-IgG1 to subcutaneous implant-associated biofilm in a mouse model.
One mouse received subcutaneous pre-colonized and sterile catheters and 2 days later was injected with 4 MBq [111In]In-4497-IgG1. The same mouse was imaged at 24 hr, 48 hr, and 72 hr. Maximum intensity projections of [111In]In-4497-IgG1 injected in mice subcutaneously pre-colonized (left flank) and sterile (right flank) catheters.
Figure 7—animation 1
Localization of [111In]In-4497-IgG1 to subcutaneous implant pre-colonized with biofilm in a mouse model.
3D projections of [111In]In-4497-IgG1 injected in mice subcutaneously bearing pre-colonized and sterile catheters. The same mouse was imaged at 24 hr, 72 hr, and 120 hr.
Figure 7—animation 2
3D projections of [111In]In-palivizumab injected in mice subcutaneously bearing pre-colonized and sterile catheters.
The same mouse was imaged at 24 hr, 72 hr, and 120 hr.
Tables
Table 1
Monoclonal antibody (mAb) binding to biofilm and planktonic bacteria.
Significant binding (p<0.05) of IgG1 mAbs compared to control IgG1 s indicated with ‘+,’ weak binding (p<0.05, p<0.99) is indicated with ‘+/-,’ and no significant binding (p>0.99) is indicated with ‘–.’.
| Clone | Target | Biofilm | Planktonic | ||
|---|---|---|---|---|---|
| PNAG (+) | PNAG (-) | Wood46 | LAC ∆spa∆sbi | ||
| F598 | PNAG | + | – | +/- | – |
| 4461 | WTA(α) | +/- | + | – | + |
| 4497 | WTA(β) | + | + | + | +/- |
| CR5132 | WTA(β) | + | + | +/- | + |
| rF1 | SDR proteins | + | + | + | + |
| T1-2 | ClfA | +/- | + | +/- | +/- |
-
PNAG, poly-N-acetyl glucosamine; WTA, wall teichoic acid; SDR, serine-aspartate dipeptide repeats; ClfA, clumping factor B.
Key resources table
| Reagent type (species) or resource | Designation | Source or reference | Identifiers | Additional information |
|---|---|---|---|---|
| Strain, strain background (Staphylococcus aureus) | Wood46 | PMID:28360163 | ATCC 10832 | |
| Strain, strain background(S. aureus) | USA300 LAC; LAC WT (AH1263) | PMID:20418950 | AH1263 | |
| Strain, strain background(S. aureus) | USA300 LAC ∆spa, sbi::Tn; LAC∆spa∆sbi (AH4116) | This paper(Ibberson et al., 2014) | AH4116 | sbi::Tn in USA300 LAC ∆spa (AH3052) |
| Strain, strain background(S. aureus) | USA300 LAC AH4802 | PMID:31723175 | AH4802 | |
| Antibody | (Goat polyclonal) anti-human IgG F(ab′)2- APC | Jackson ImmunoResearch | Cat # 109-136-088;RRID:AB_2337691 | (1:500) |
| Antibody | (Goat polyclonal) anti-human-kappa F(ab′)2-A647 | Southern Biotech | Cat # 2062-31;RRID:AB_2795742 | (1:500) |
| Antibody | (Humanized monoclonal)palivizumab | MedImmune | SYNAGIS | |
| Cell line | EXPI293F cell | Life Technologies | RRID:CVCL_D615 | |
| Recombinant DNA reagent | pcDNA3.4(plasmid) | Thermo Fisher Scientific | Cat # A14697 | |
| Recombinant DNA reagent | pFUSE-CLIg- hk(plasmid) | Invivogen | Cat # pfuse2-hclk | |
| Recombinant DNA reagent | pFUSE-CHIg-hG1(plasmid) | Invivogen | Cat # pfuse-hchg1 | |
| Recombinant DNA reagent | pFUSE-CHIg-hG3(plasmid) | Invivogen | Cat # pfuse-hchg301 | |
| Chemical compound, drug | Bifunctional CHXA″ | Macrocyclics | ||
| Chemical compound, drug | [111In]InCl3 | Curium Pharma | ||
| Software, algorithm | FlowJo version 10 | BD Biosciences | RRID:SCR_008520 | |
| Software, algorithm | PMOD software | PMOD Technologies | RRID:SCR_016547 | |
| Other | Syto9 stain | Invitrogen | Live/Dead BacLight Bacterial Viability Kit | (6 µM) |
Additional files
-
Supplementary file 1
Protein sequences used for human monoclonal antibody production.
- https://cdn.elifesciences.org/articles/67301/elife-67301-supp1-v1.docx
-
Supplementary file 2
Exact p-values and statistical analysis performed per figure.
- https://cdn.elifesciences.org/articles/67301/elife-67301-supp2-v1.docx
-
Transparent reporting form
- https://cdn.elifesciences.org/articles/67301/elife-67301-transrepform1-v1.docx
Download links
A two-part list of links to download the article, or parts of the article, in various formats.
Downloads (link to download the article as PDF)
Open citations (links to open the citations from this article in various online reference manager services)
Cite this article (links to download the citations from this article in formats compatible with various reference manager tools)
Human monoclonal antibodies against Staphylococcus aureus surface antigens recognize in vitro and in vivo biofilm
eLife 11:e67301.
https://doi.org/10.7554/eLife.67301


