Full assembly of HIV-1 particles requires assistance of the membrane curvature factor IRSp53
- Infectious disease Research Institute of Montpellier (IRIM), CNRS UMR 9004, University of Montpellier, France
- Institut Curie, Université PSL, Sorbonne Université, CNRS UMR168, Laboratoire Physico Chimie Curie, France
- CEMIPAI, CNRS UAR3725, University of Montpellier, France
- Institute of Biotechnology, University of Helsinki, Finland
- MAVIVH UMR Inserm U1259, University of Tours, France
- Institute for Glycomics, Griffith University, Australia
Figures
Figure 1 with 3 supplements
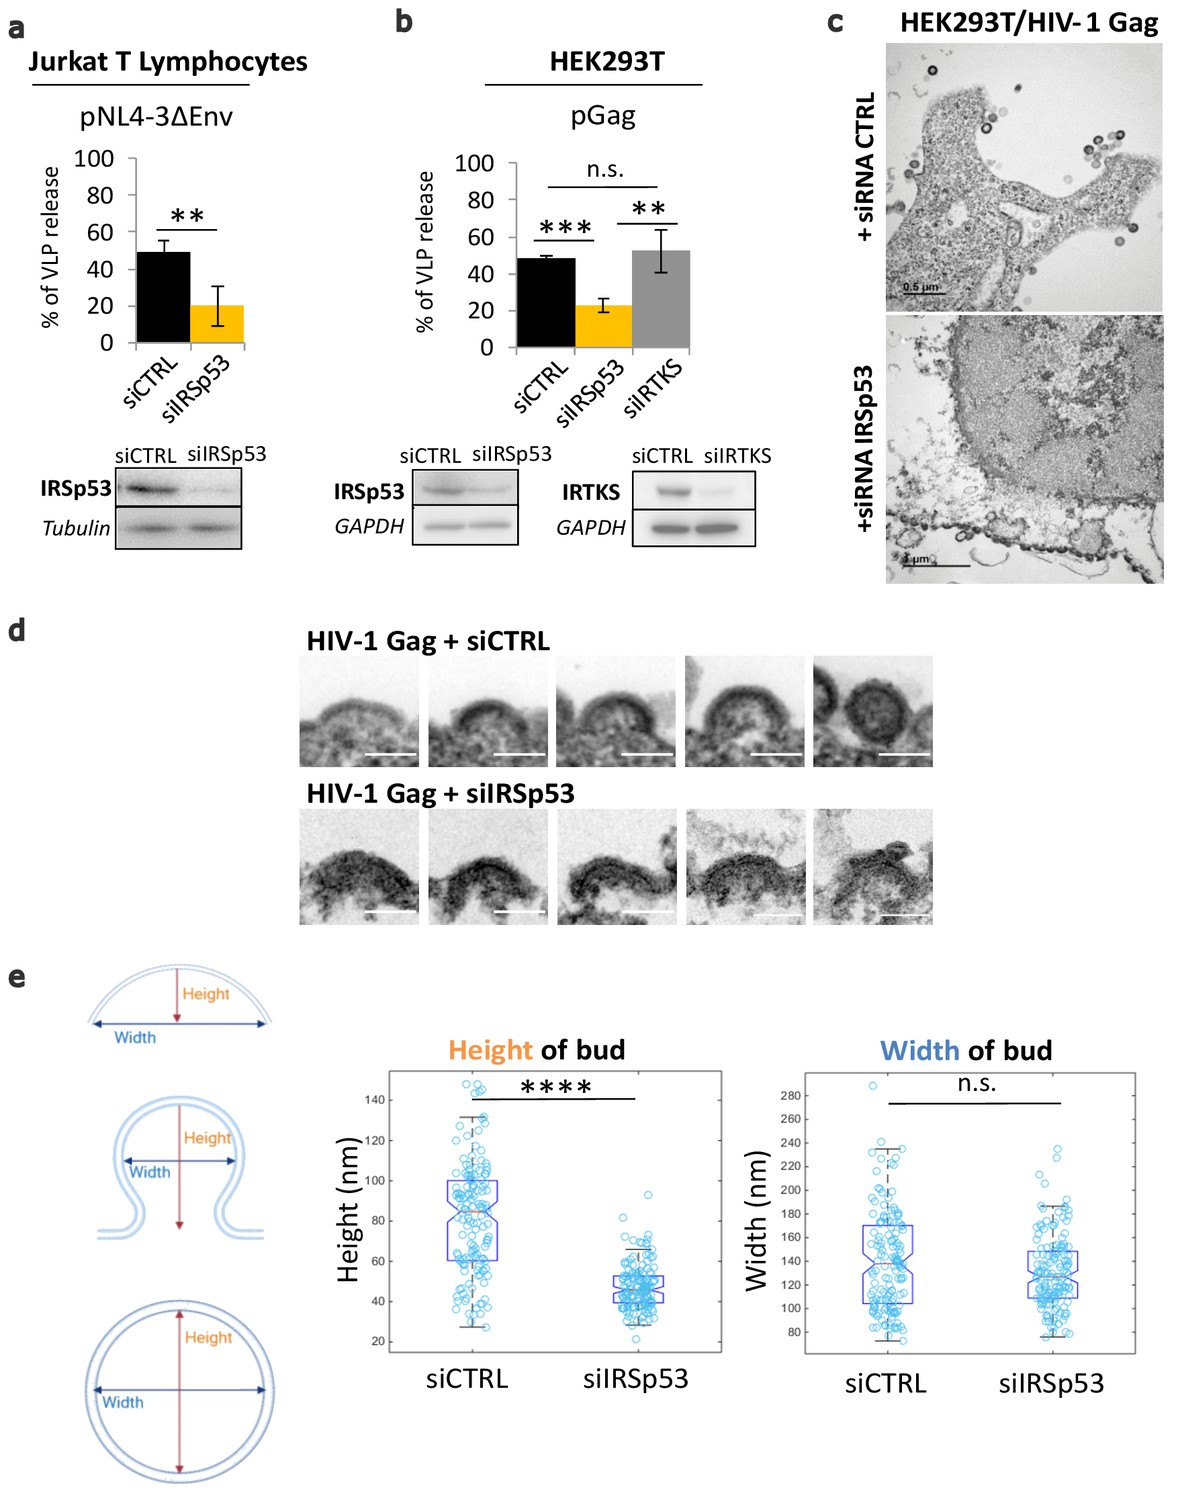
Partial knockdown of IRSp53 decreases HIV-1 Gag particle release by arresting assembly at the cell plasma membrane.
(a) siRNA knockdown of IRSp53 expression in Jurkat T lymphocytes leads to a significant decrease in pNL4-3ΔEnv Gag particle release (see graph and immunoblots for IRSp53, p = 0.00265, Student’s t-test, and loading controls beneath the graph). (b) Similarly, knockdown of IRSp53 expression in Gag expressing HEK293T cells led to a significant decrease in HIV-1 Gag particle release (p = 0.00487, Student’s t-test), as compared to siRNA IRTKS (p = 0.0116, Student’s t-test). On the other hand, knockdown of IRTKS expression (a closely related I-BAR protein) did not have a significant effect on particle release (p = 0.0924, Student’s t-test, upper graph, immunoblots for IRSp53, IRTKS, and loading controls beneath the graph) (n = 3 independent experiments). Another multiple comparisons statistical test ANOVA was applied to compare the three siRNA conditions showing a significative difference with a p value = 0.0089. (c) Transmission electron microscopy images of HEK293T cells expressing HIV-1 Gag with siRNA control (upper panel) and siRNA IRSp53 (lower panel). Scale bar is 0.5 µm (upper image) and is 1 µm (lower image). (d) Transmission electron microscopy zoomed images of viral buds from HIV-1 Gag expressing cells treated with siRNA-mediated knocked down of IRSp53 (lower panel) showing arrested buds at the plasma membrane as compared to the siRNA control cells (upper panel) which display a normal range of buds in different stages of assembly and budding (scale bar = 100 nm). (e) Measurement of the bud dimensions (height and width median with interquartile) in the control siRNA and siRNA IRSp53 conditions (n = 145 buds from 14 different cells for each condition, n = 2 independent experiments). The knocked down cells exhibit a narrow range of heights corresponding to the arrested buds visible in the images, while the control cells display a wider range of heights corresponding to assembly progression (left graph, ‘Height of bud’). Distribution of the height values in the two conditions is significantly different (p = 1.05 × 10⁻²⁸, Kolmogorov-Smirnov test). On the opposite, the widths of the buds in both conditions did not display significant differences in distributions (p = 0.0609, Kolmogorov-Smirnov test).
-
Figure 1—source data 1
Immunoblot Quantification using Fiji for Figure 1B graph.
- https://cdn.elifesciences.org/articles/67321/elife-67321-fig1-data1-v2.xlsx
-
Figure 1—source data 2
Heights and Widths of HIV-1 Gag bud measurements for Figure 1E graph.
- https://cdn.elifesciences.org/articles/67321/elife-67321-fig1-data2-v2.xlsx
Figure 1—figure supplement 1
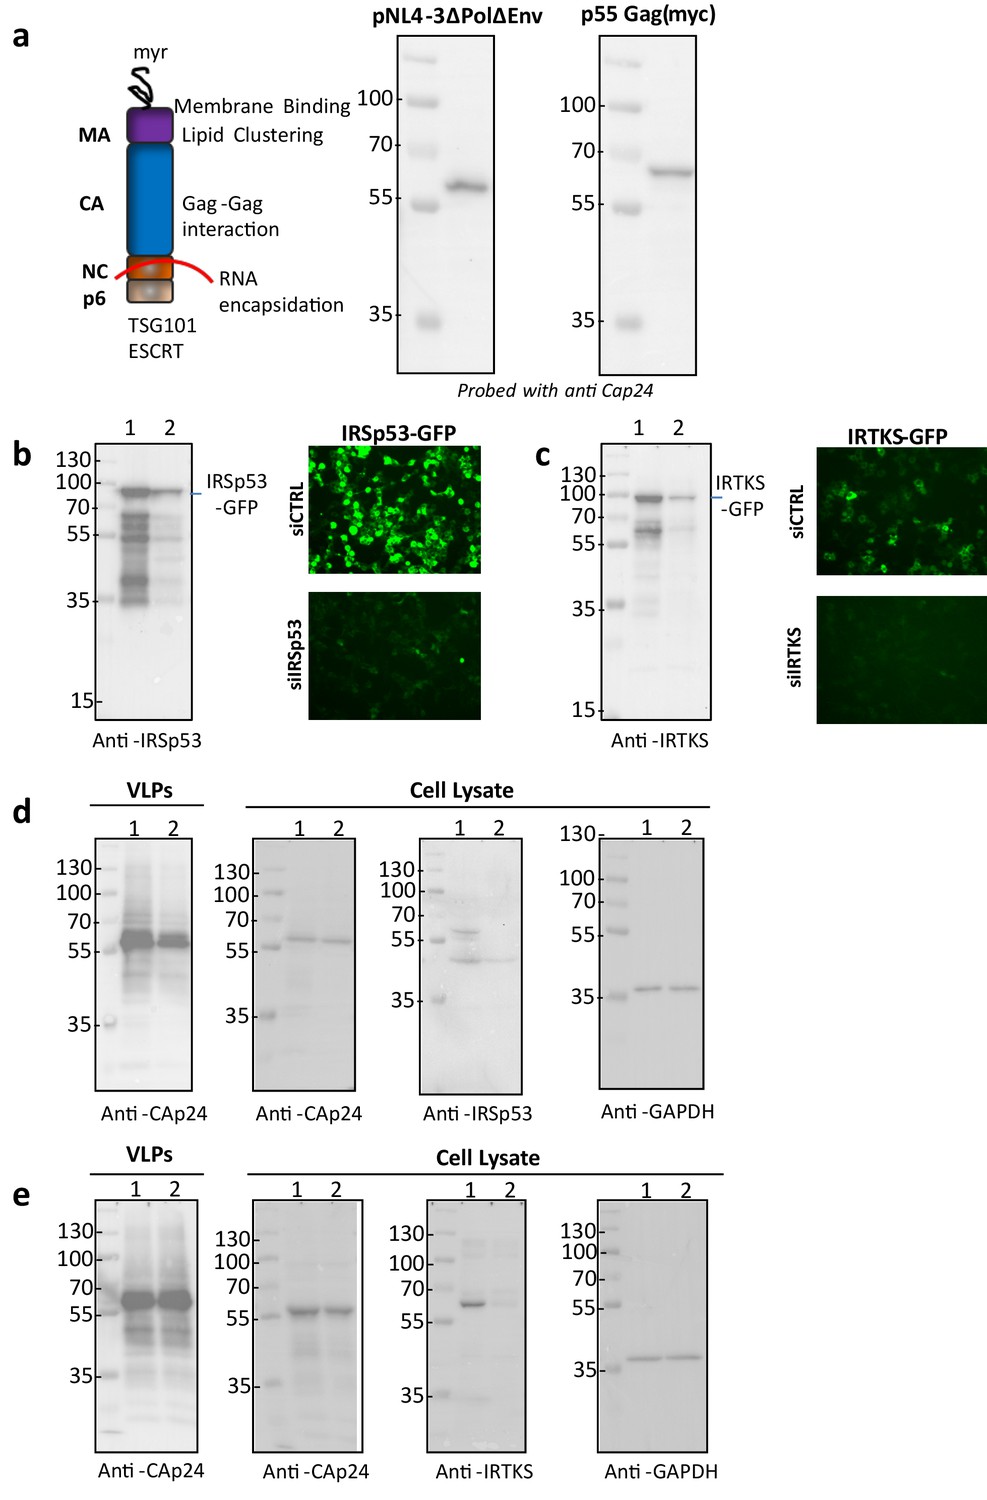
Effect of siRNA-based knockdown of IRSp53 and IRTKS gene expression on HIV-1 Gag particle release.
(a) Expression of HIV-1 Gag in HEK293T cells (from molecular clones pNL43ΔPolΔEnv or pGag – optimized HIV-1 Gag) and a schematic representation of the viral Gag polyprotein. The HIV-1 Gag Pr55 polyprotein is known to have four main domains, the matrix MA interacting with cell membrane thanks to its lipid-binding site and myristate (myr), the capsid CA for Gag-Gag oligomerization, the nucleocapsid NC interacting with the viral genomic RNA, and p6 recruiting Tsg101 (ESCRT protein) for particle budding. (b) Validation of siRNA targeting IRSp53 gene expression. siRNA targeting IRSp53 diminishes the expression of IRSp53-GFP as seen by immunoblots (left panel, lane 1: siCTRL; lane 2: siIRSp53) and fluorescence imaging of transfected HEK293T cells expressing ectopic IRSp53-GFP with the corresponding siRNA (right panel). (c) Validation of siRNA targeting ectopic IRTKS. siRNA targeting IRTKS diminishes expression of IRTKS-GFP as seen by immunoblots (left panel, lane 1: siCTRL; lane 3: siIRTKS) and fluorescence imaging of transfected HEK293T cells expressing IRTKS-GFP with siRNA, as indicated (right panel). (d) Reduced viral release is seen in cells knockdown for endogenous IRSp53 expression (representative immunoblots, lane 1: siCTRL; lane 2: siIRSp53). (e) Endogenous IRTKS knockdown has no significant effect on HIV-1 Gag particle release (representative immunoblots, lane 1: siCTRL; lane 3: siIRTKS). Arrows (<) show the corresponding proteins of interest.
Figure 1—figure supplement 2
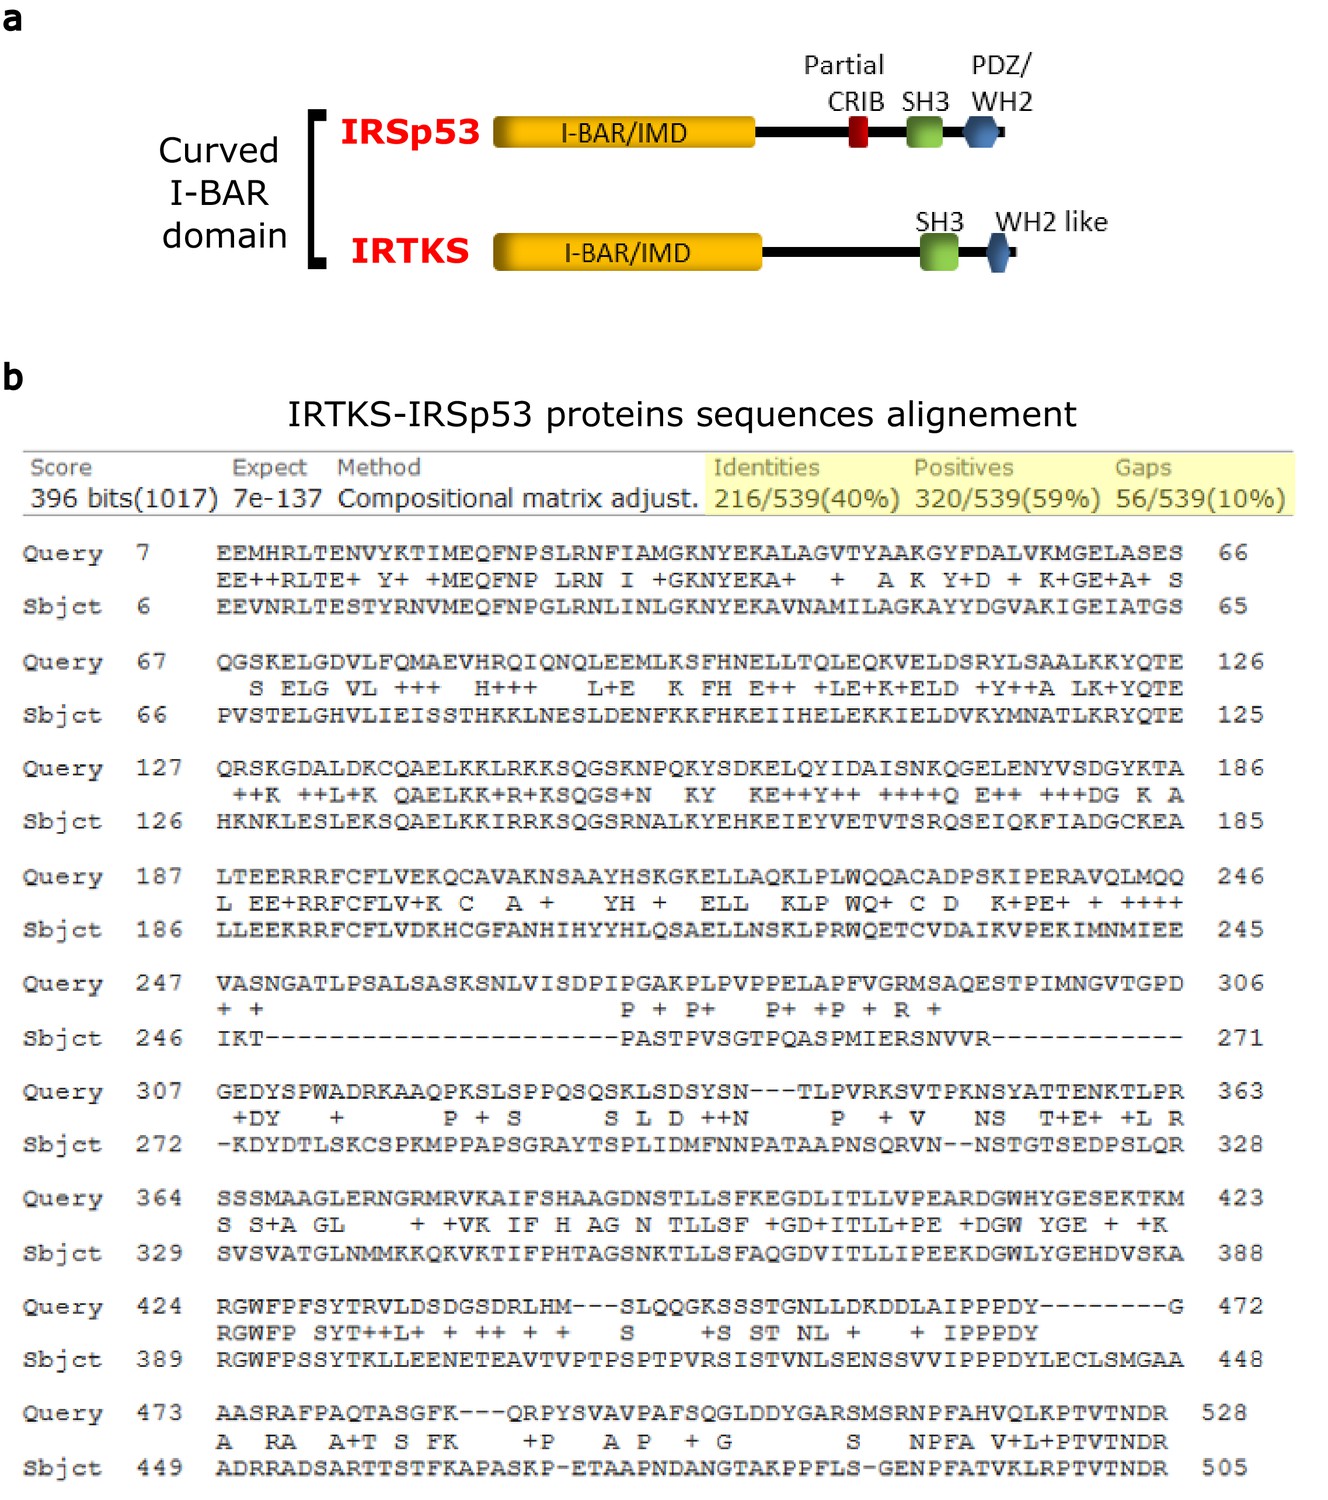
Protein sequence comparison of IRSp53 and IRTKS.
(a) IRSp53 and IRTKS are membrane curving I-BAR proteins. (b) IRSp53 (Query, accession Q9QB8) shares a 40% sequence homology with IRTKS (Subject, accession Q9UHR4) sequence alignment performed with NCBI Protein BLAST. Most of this homology is centered in the I-BAR/IMD domain of the three proteins and the C-terminal SRC homology 3 (SH3) domain common to the two proteins.
Figure 1—figure supplement 3
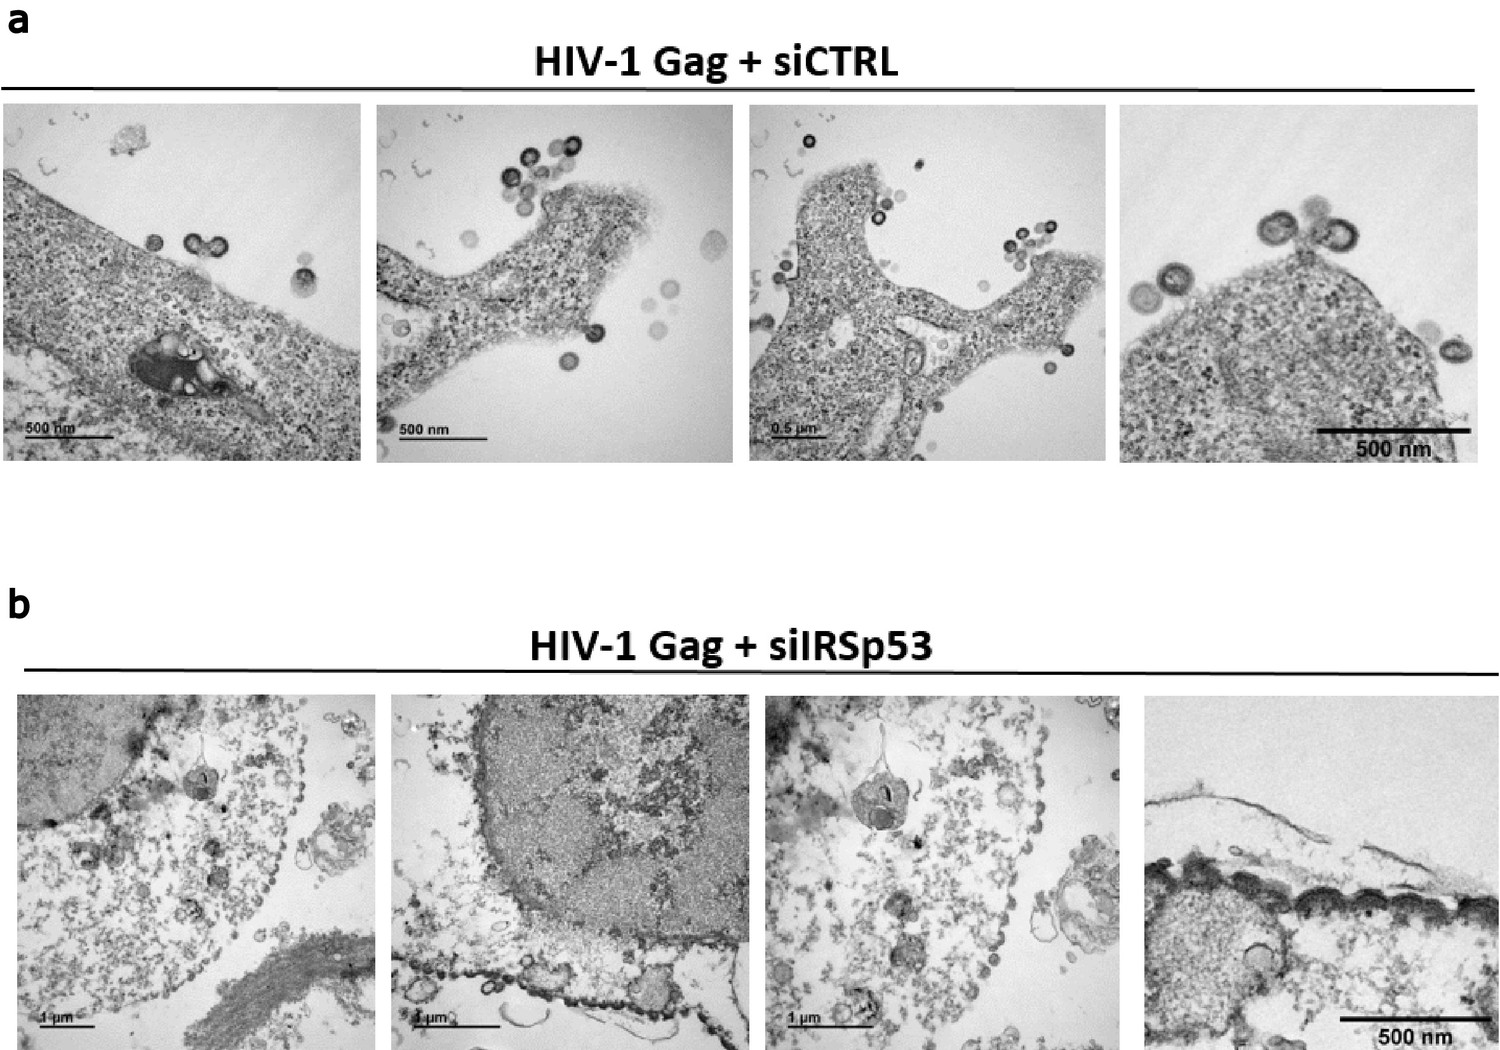
Transmission electron microscopy of siRNA treated HEK293T cells expressing HIV-1 Gag.
siRNA control (a) or siRNA IRSp53 (b) treated cells reveal that IRSp53 protein depletion in cells display HIV-1 Gag arrested assembly at the cell plasma membrane as shown by transmission electron microscopy. Scale bar is 0.5 µm or 1 µm, as indicated in the images.
Figure 2 with 1 supplement
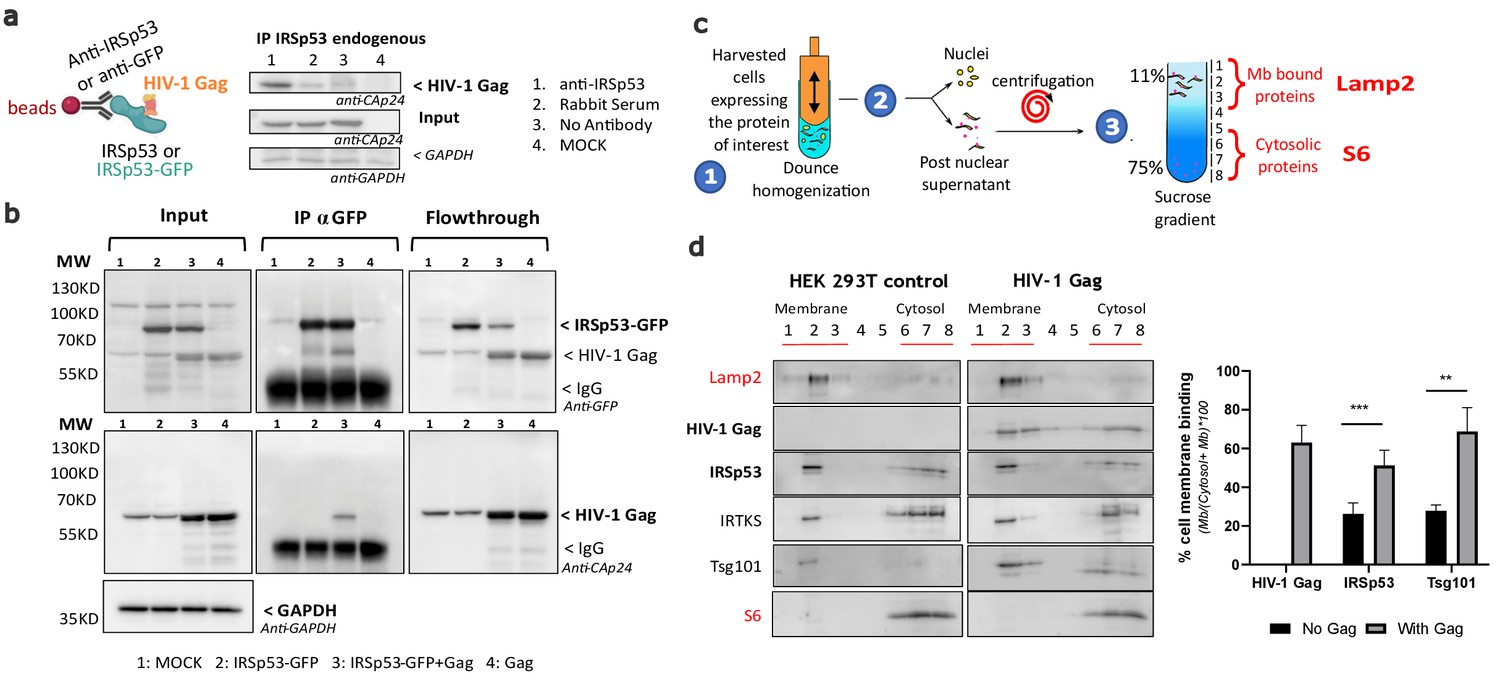
Intracellular HIV-1 Gag and IRSp53 complexation and cell membrane binding.
(a) Co-immunoprecipitation of HIV-1 Gag/IRSp53 with an anti-IRSp53 antibody. HIV-1 Gag is enriched in the anti-IRSp53 pulldown (lane 1), as compared to the controls (lane 2: IP with an anti-rabbit serum; lane 3: no antibody; lane 4: mock, i.e., without Gag). (b) Co-Immunoprecipitation of HIV-1 Gag/ectopic IRSp53-GFP with an anti-GFP antibody upon overexpression of HIV-1 Gag and ectopic IRSp53-GFP in transfected HEK293 T cells. HIV-1 Gag is enriched in the anti-IRSp53-GFP pulldown (lane 3: transfected HEK293T cell lysate containing IRSp53-GFP and HIV-1 Gag), as compared to the controls (lane 1: mock without Gag or IRSp53-GFP; lane 2: IRSp53 alone; lane 4: Gag alone). Input, IP anti-GFP and flowthrough after IP are shown. (c) Membrane flotation assay protocol: (1) 293T cells were dounced, (2) the post-nuclear supernatant was loaded on a discontinuous sucrose gradient, and (3) following ultracentrifugation, cell membranes (lysosomal associated membrane protein, Lamp2 biomarker, fractions 1–3) were separated from the cytosolic fraction (ribosomal S6 protein biomarker, fractions 6–8). (d) Immunoblots of the indicated proteins (on the left) and quantification of the % of protein membrane binding in the graph below show that upon HIV-1 Gag expression in cells, IRSp53 is significantly enriched by twofold in the cell membrane fraction (p value = 0.000129; ***Student’s t-test) (n = 5 independent experiments). A similar increase is observed for Tsg-101, a known interactor of the p6 domain of Gag (p value = 0.00517; **, Student’s t-test).
-
Figure 2—source data 1
Membrane flotation Quantification using Fiji for Figure 2D graph.
- https://cdn.elifesciences.org/articles/67321/elife-67321-fig2-data1-v2.xlsx
Figure 2—figure supplement 1
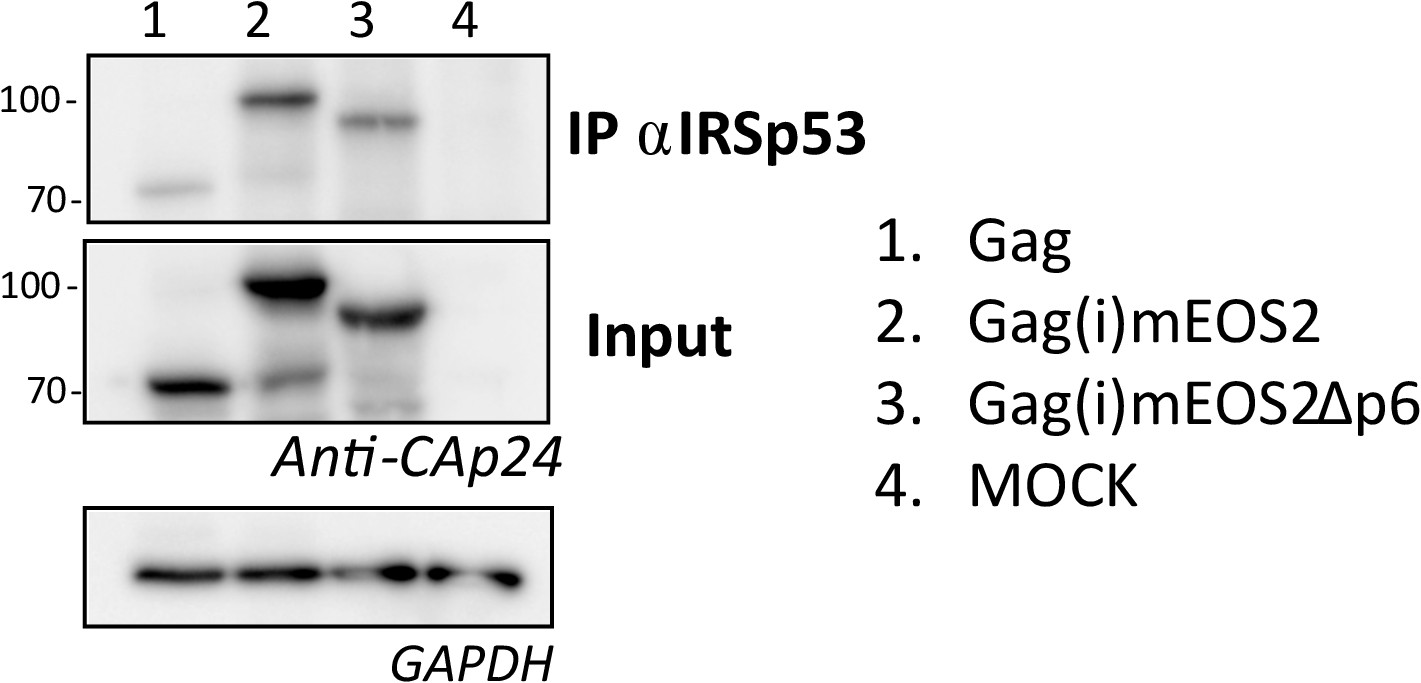
Complexation of IRSp53 with Gag(i)mEOS2 is independent of Gag-p6 domain.
Addition of an internal mEos2 tag within the Gag protein does not affect its complexation with IRSp53 (compare lanes 1 and 2). Gag(i)mEos2Δp6, a mutant of Gag deficient in p6 dependent-ESCRT recruitment, is also immuno-precipitated (IP) with an IRSp53 antibody (lane 3), indicating that the loss of p6, and most probably most of Tsg101 recruitment, is not a limiting factor for Gag-IRSp53 complexation. Lane 4 is an IP control (Mock = no Gag).
Figure 3 with 4 supplements
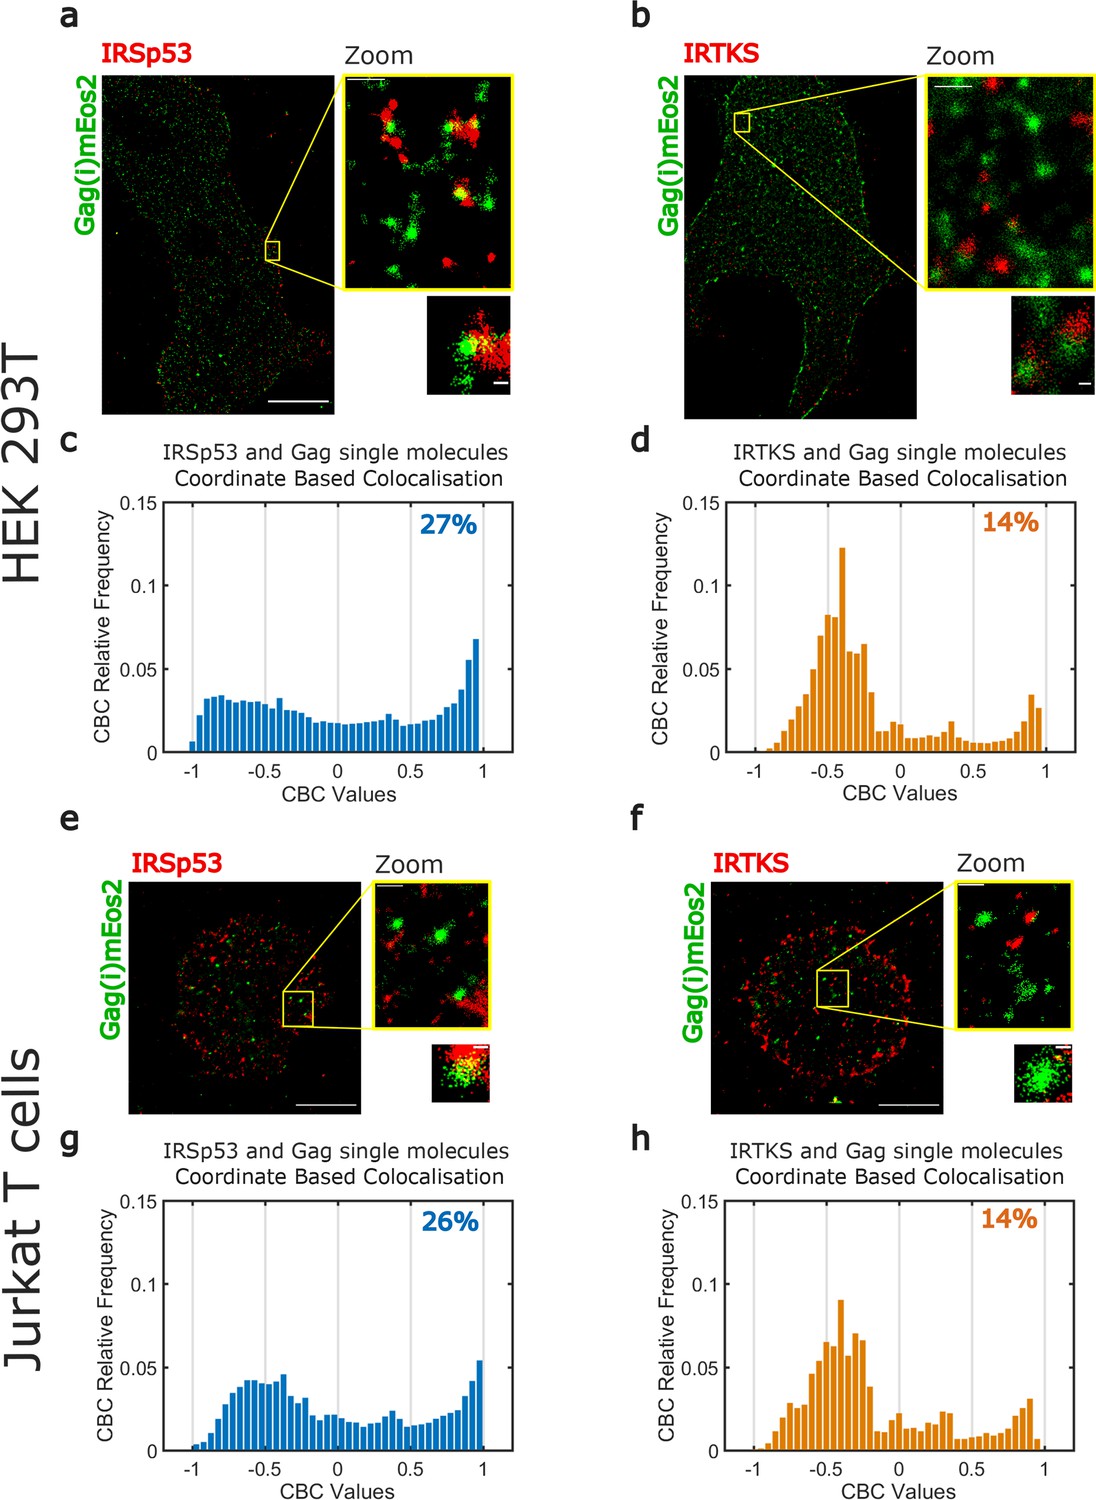
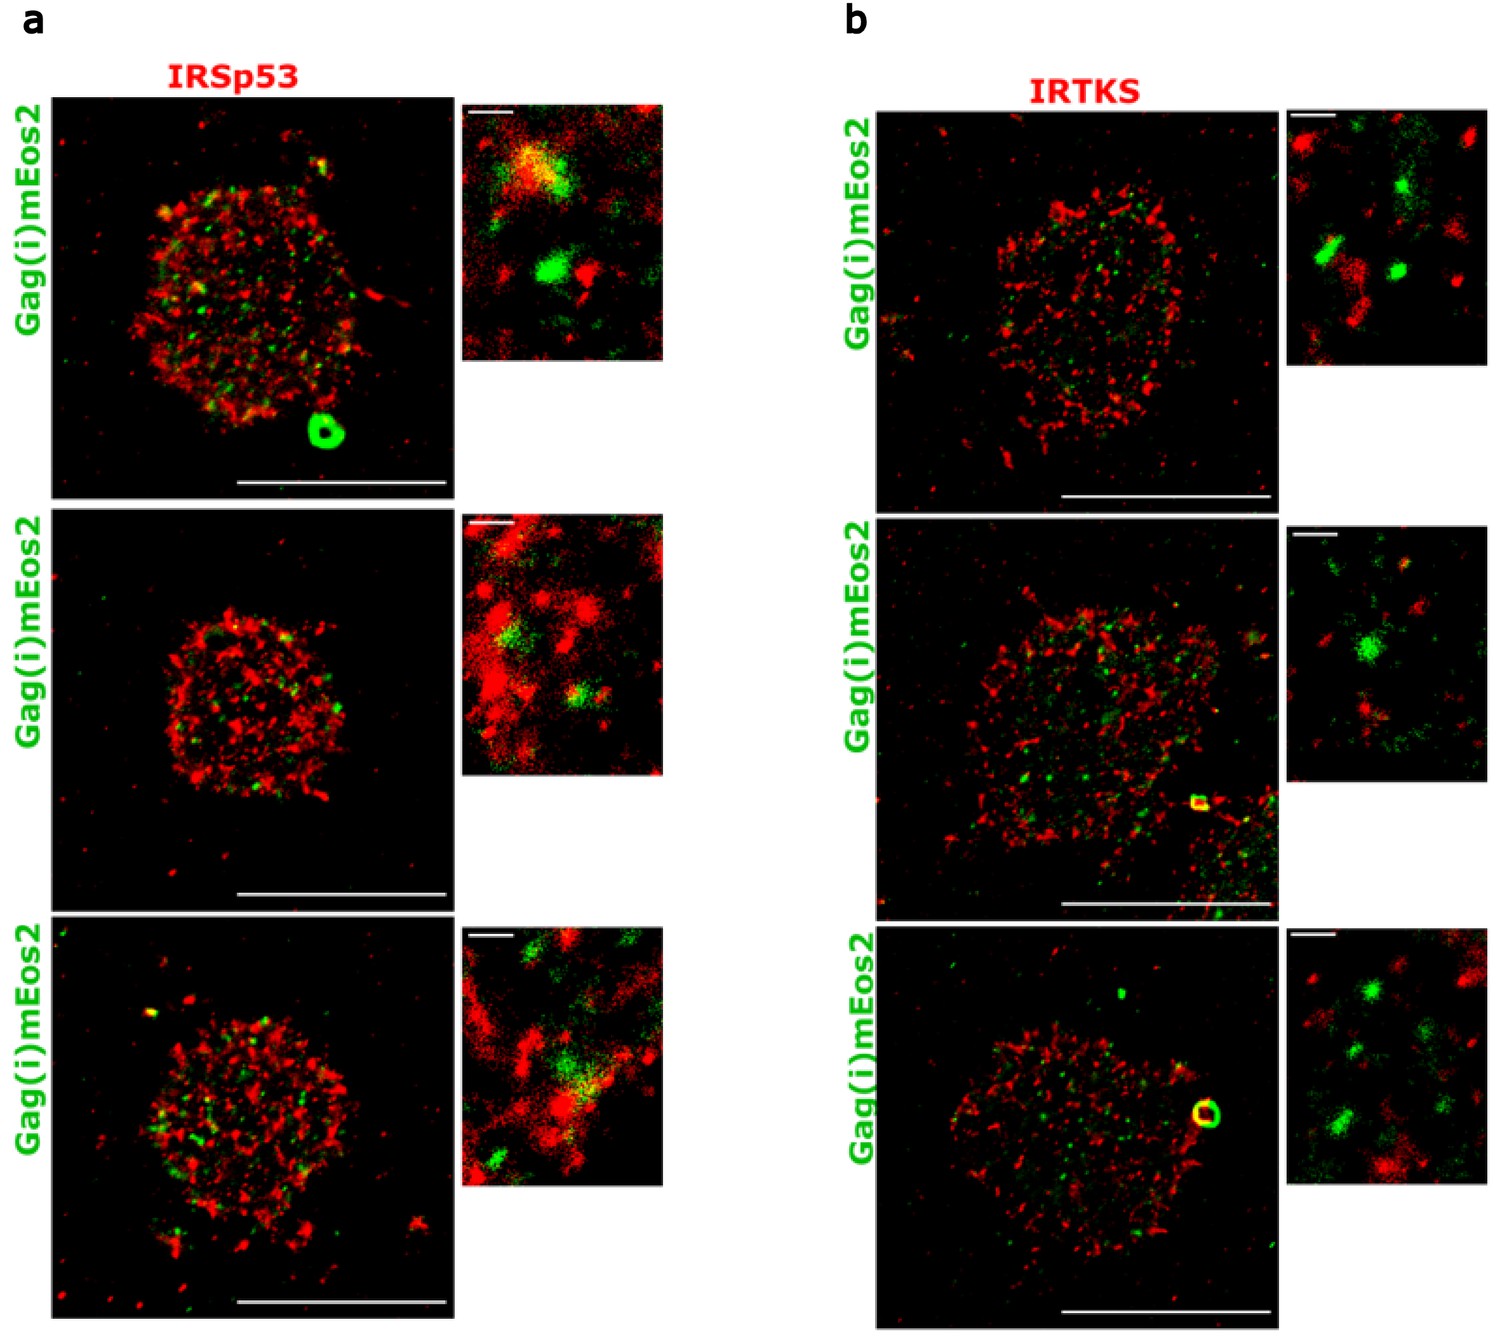
Super-resolution microscopy imaging reveals preferential IRSp53 localization at HIV-1 Gag budding sites.
(a, b) Super-resolved PALM/STORM dual-color images of HEK293T cells expressing Gag(i)mEos2 (green) and immunolabeled for IRSp53 (red, a) or IRTKS (red, b) (scale bar = 10 µm) with a magnified view (scale bar = 500 nm) and selected zoom-in images of single Gag(i)mEos2 clusters (scale bar = 100 nm). (c, d) Quantification of coordinate-based colocalization (as in Malkusch et al., 2012) at Gag assembly sites: CBC values for IRSp53 (c) and IRTKS (d) were plotted as relative frequencies. IRSp53 CBC distribution (c) shows that 27% of all IRSp53 localizations are highly correlated with Gag(i)mEos2 localizations (>0.5). On the other hand, only 14% of IRTKS localizations (d) are highly correlated, while IRTKS CBC distribution exhibits a peak of anti-correlated/non-correlated (−0.5 to 0) localization. (e, f) Super-resolved dual-color PALM/STORM images of Jurkat T cells expressing Gag(i)mEos2 (green) and immunolabeled for IRSp53 (red, e) or IRTKS (red, f) with a magnified view (scale bar = 500 nm) and single Gag(i)mEos2 cluster zoom (scale bar = 100 nm). (g, h) Relative frequency distribution plot of the CBC values for IRSp53 (g) and IRTKS (h). (g) shows that 26% of IRSp53 localizations are highly correlated with Gag(i)mEos2 localizations (>0.5) while (h) shows that IRTKS localisations are mainly anti-correlated to non-correlated (−0.5 to 0) with Gag(i)mEos2 localizations.
-
Figure 3—source data 1
Experimental data CBC for IRSp53.
- https://cdn.elifesciences.org/articles/67321/elife-67321-fig3-data1-v2.xlsx
-
Figure 3—source data 2
Experimental data CBC for IRTKS.
- https://cdn.elifesciences.org/articles/67321/elife-67321-fig3-data2-v2.xlsx
-
Figure 3—source data 3
cluster sizes for IRSp53.
- https://cdn.elifesciences.org/articles/67321/elife-67321-fig3-data3-v2.xlsx
-
Figure 3—source data 4
cluster sizes for IRTKS.
- https://cdn.elifesciences.org/articles/67321/elife-67321-fig3-data4-v2.xlsx
Figure 3—figure supplement 1
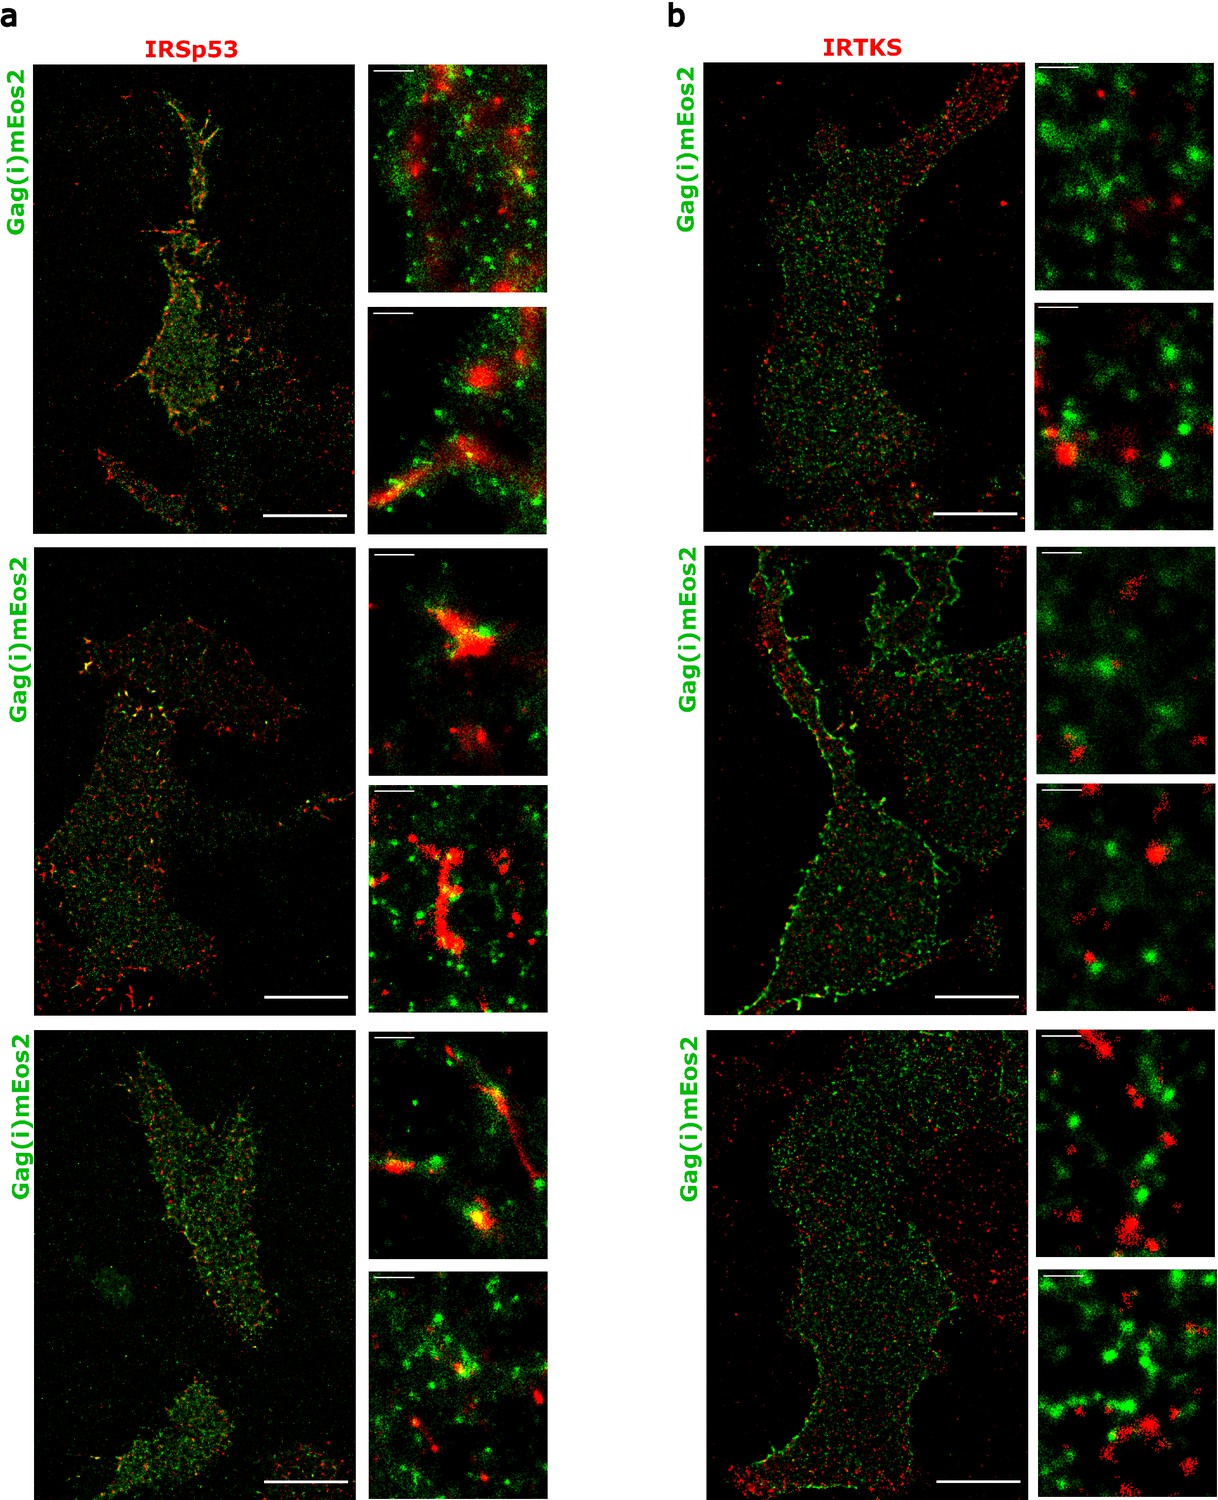
Super-resolution PALM/STORM images of HEK293T cells expressing HIV-1 Gag(i)mEos2 (in green) and immunolabeled for (a) IRSp53 (Atto647N, in red) and (b) IRTKS (Atto647N, in red), with magnified images adjacent to the main image.
Scale bar is 10 µm for the large images and 500 nm for the zoomed-in images.
Figure 3—figure supplement 2
Super-resolution PALM/STORM images of Jurkat T cells expressing HIV-1 Gag(i)mEos2 (in green) and immunolabelled for (a) IRSp53 (Atto647N, in red) and (b) IRTKS (Atto647N, in red), with magnified images adjacent to the main image.
Scale bar is 10 µm for the large images and 500 nm for the zoomed-in images.
Figure 3—figure supplement 3
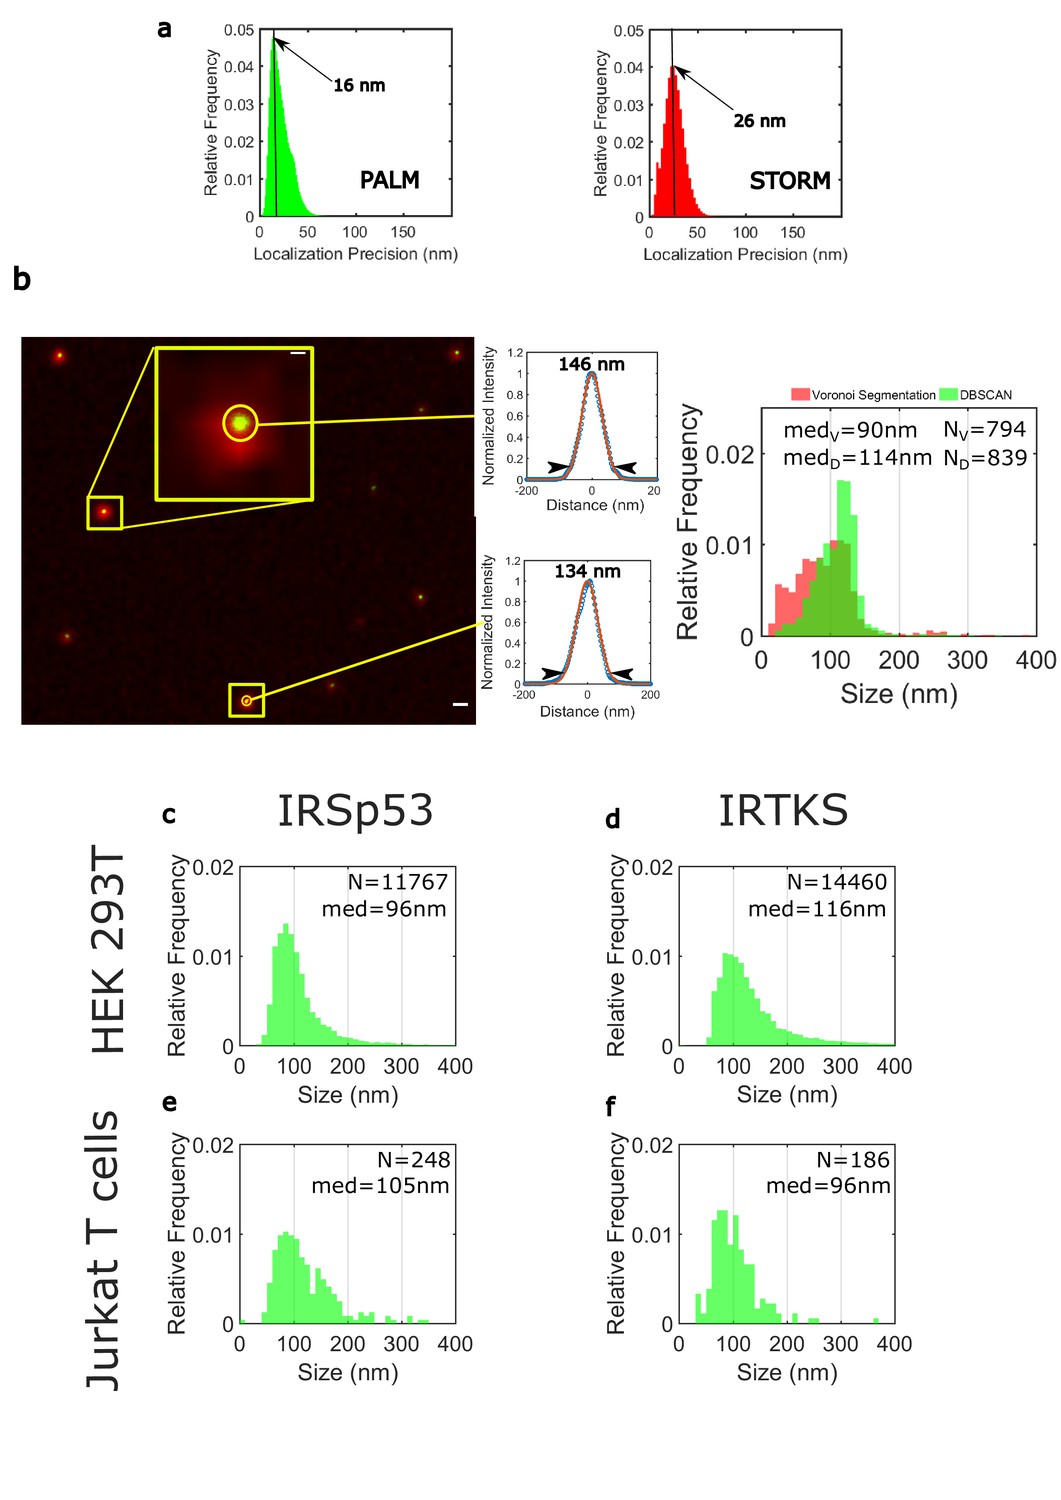
Localization precision and size determination of HIV-Gag clusters.
(a) Distribution of localisztion precisions for PALM (in green) or STORM (in red) as given by ThunderSTORM analysis in Fiji. Localization precision distribution exhibits maxima at 16 nm for PALM, corresponding to a mean value of 20 ± 5 nm and 26 nm for STORM. The localization precision is obtained by eq. 17 of (1). (b) Calibration of clusters size using HIV-1 Gag(i)m-Eos2 virus-like particles (VLPs). Left: Superimposition of classical TIRF image (in red) and its PALM image equivalence (in green) for HIV-1 Gag(i)m-Eos2 VLPs (scale bar = 500 nm). The inset is a zoom of a VLP (scale bar = 100 nm). Middle: PALM image normalized pixel intensity as a function of the distance from the center of the VLP (blue dots). Red is a Gaussian fit of this pixel intensity. The size of the particle is estimated as the waist of the Gaussian at 10% of the maximum as in (2). Right: Comparison of VLP size distribution obtained by Voronoi-based segmentation and DBSCAN clusterization methods using SR-Tesseler (3). The two methods are parametrized to identify all the clusters containing more than 50 localizations in the different VLP images (n = 7). DBSCAN exhibits a more relevant median value (med = 114 nm) than Voronoi-based segmentation clusters distribution (med = 90 nm) does. Moreover, from the DBSCAN distribution, it can be seen maxima at 120–130 nm, corresponding to the VLP size obtained by Gaussian fitting as in (2). (c, d, e, f) DBSCAN size distribution of the HIV-1 Gag(i)-mEos2 clusters found in the different cells studied here (HEK, total n = 10 cells, n = 5 for IRSP53 and n = 5 for IRTKS, Jurkat T cells, total n = 9 cells, n = 5 for IRSp53, n = 4 for IRTKS). All the distribution exhibit median values around 100 nm (see main text for exact values with IQR error), below or equivalent to the size of VLP.
Figure 3—figure supplement 4
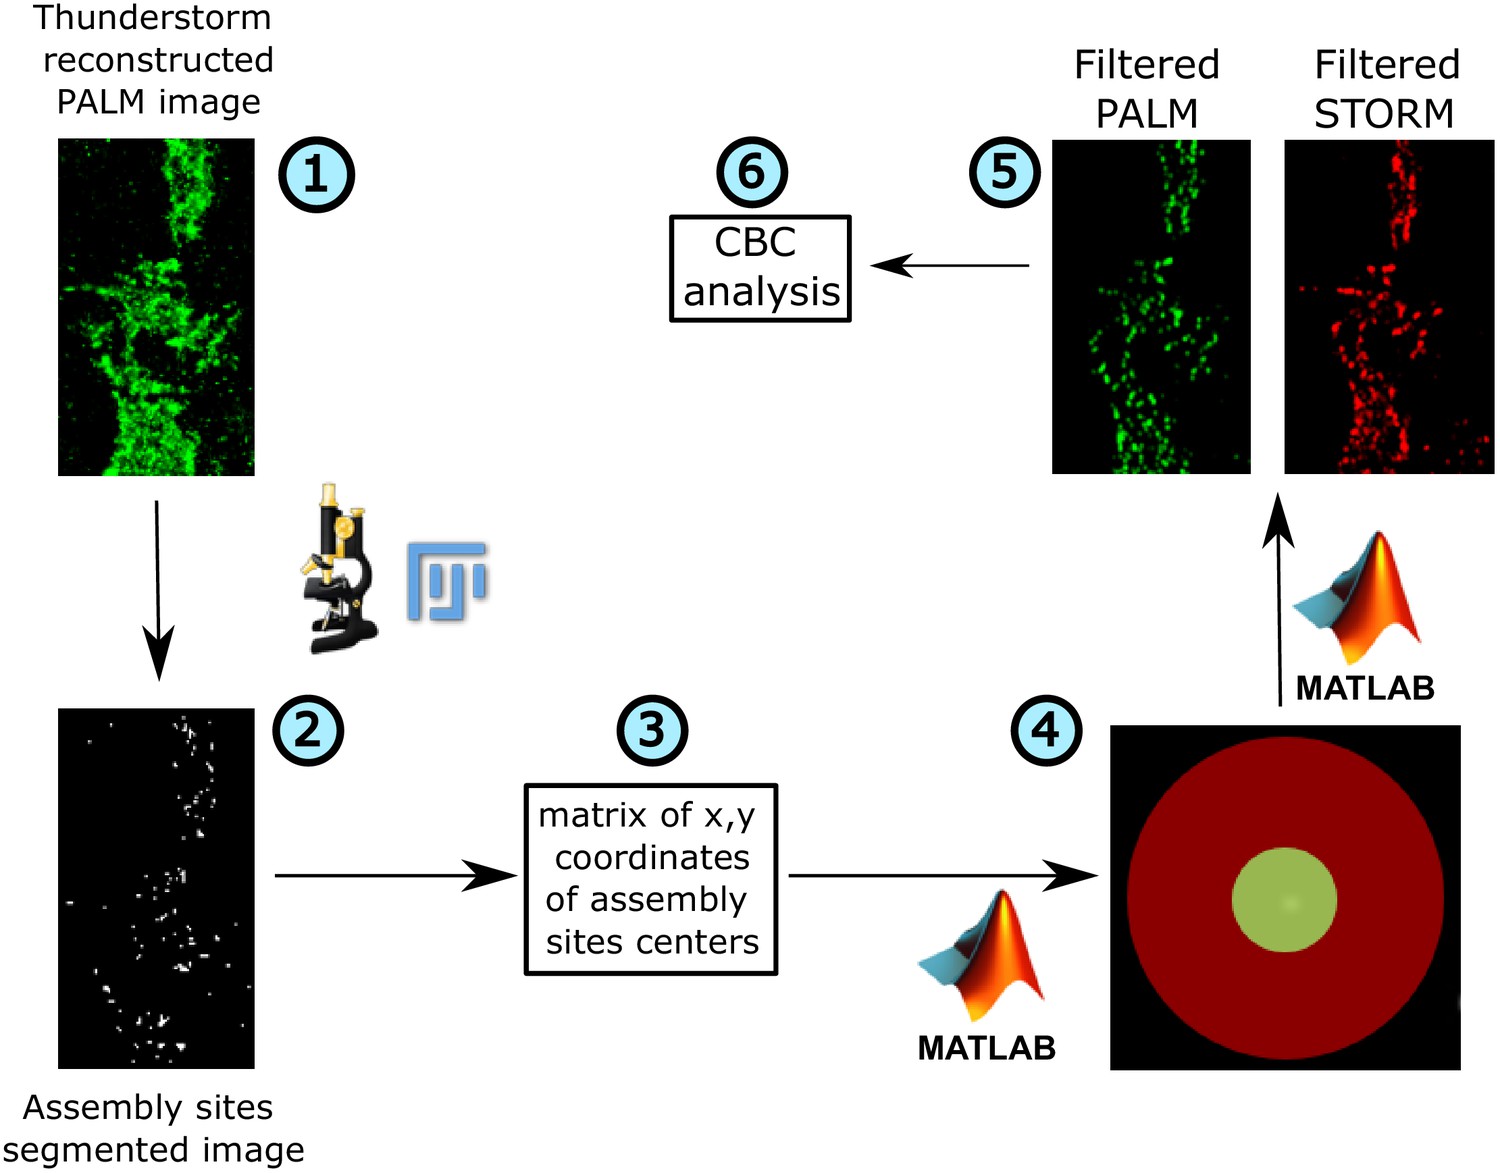
Workflow of image analysis for PALM/STORM images.
(1) Reconstructed PALM images. (2) The PALM images were thresholded in ImageJ to obtain a mask of the assembly sites of Gag. (3) The coordinates of centers of these assembly sites were then obtained using the Analyze Particles feature of ImageJ. (4) These coordinates were then used to analyze the original PALM and STORM single-molecule localizations, and extract PALM coordinates from an area corresponding to the size of assembly sites (r < 80 nm from center), and STORM coordinates in a larger area around the assembly site (r < 150 nm from center). (5) Using these filters, a new set of PALM and STORM localizations were generated, which corresponded to Gag assembly sites and the area around these sites. (6) These localizations were then used to calculate the coordinate-based colocalization (CBC) for PALM (Gag) and STORM (IRSp53/IRTKS). The CBC values were then plotted as cumulative probability distributions.
Figure 4 with 1 supplement
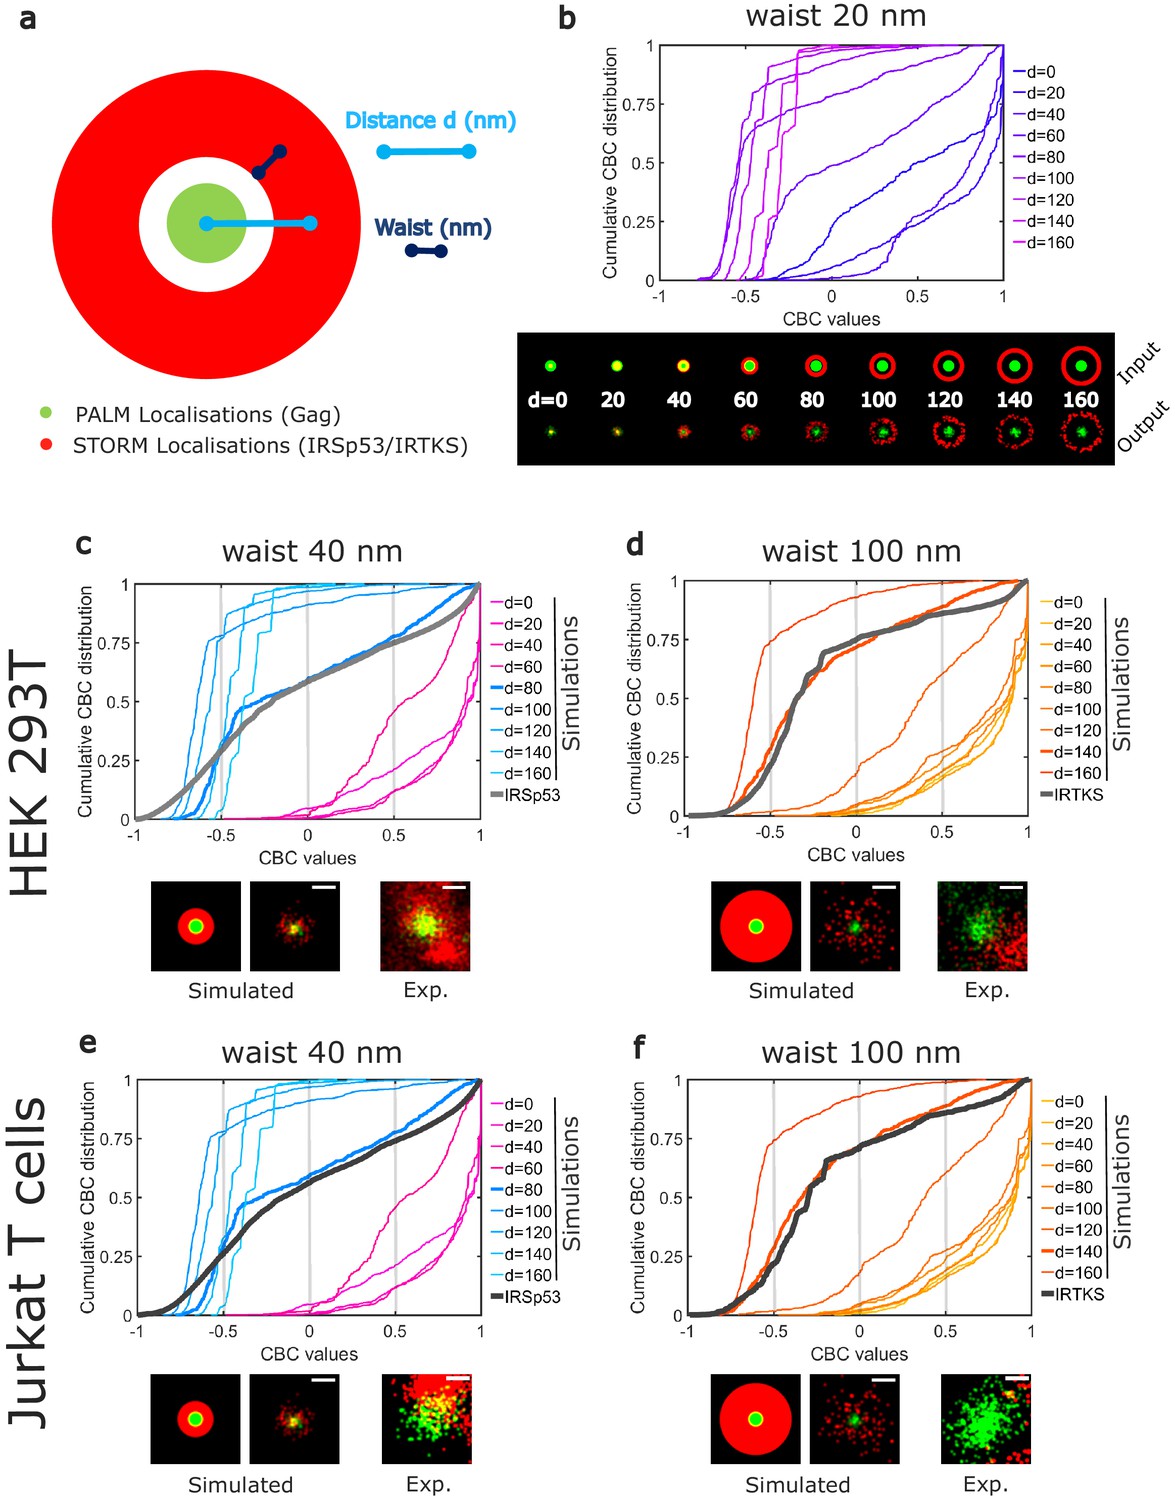
Numerical simulations confirm preferential IRSp53 localization around HIV-1 Gag budding sites.
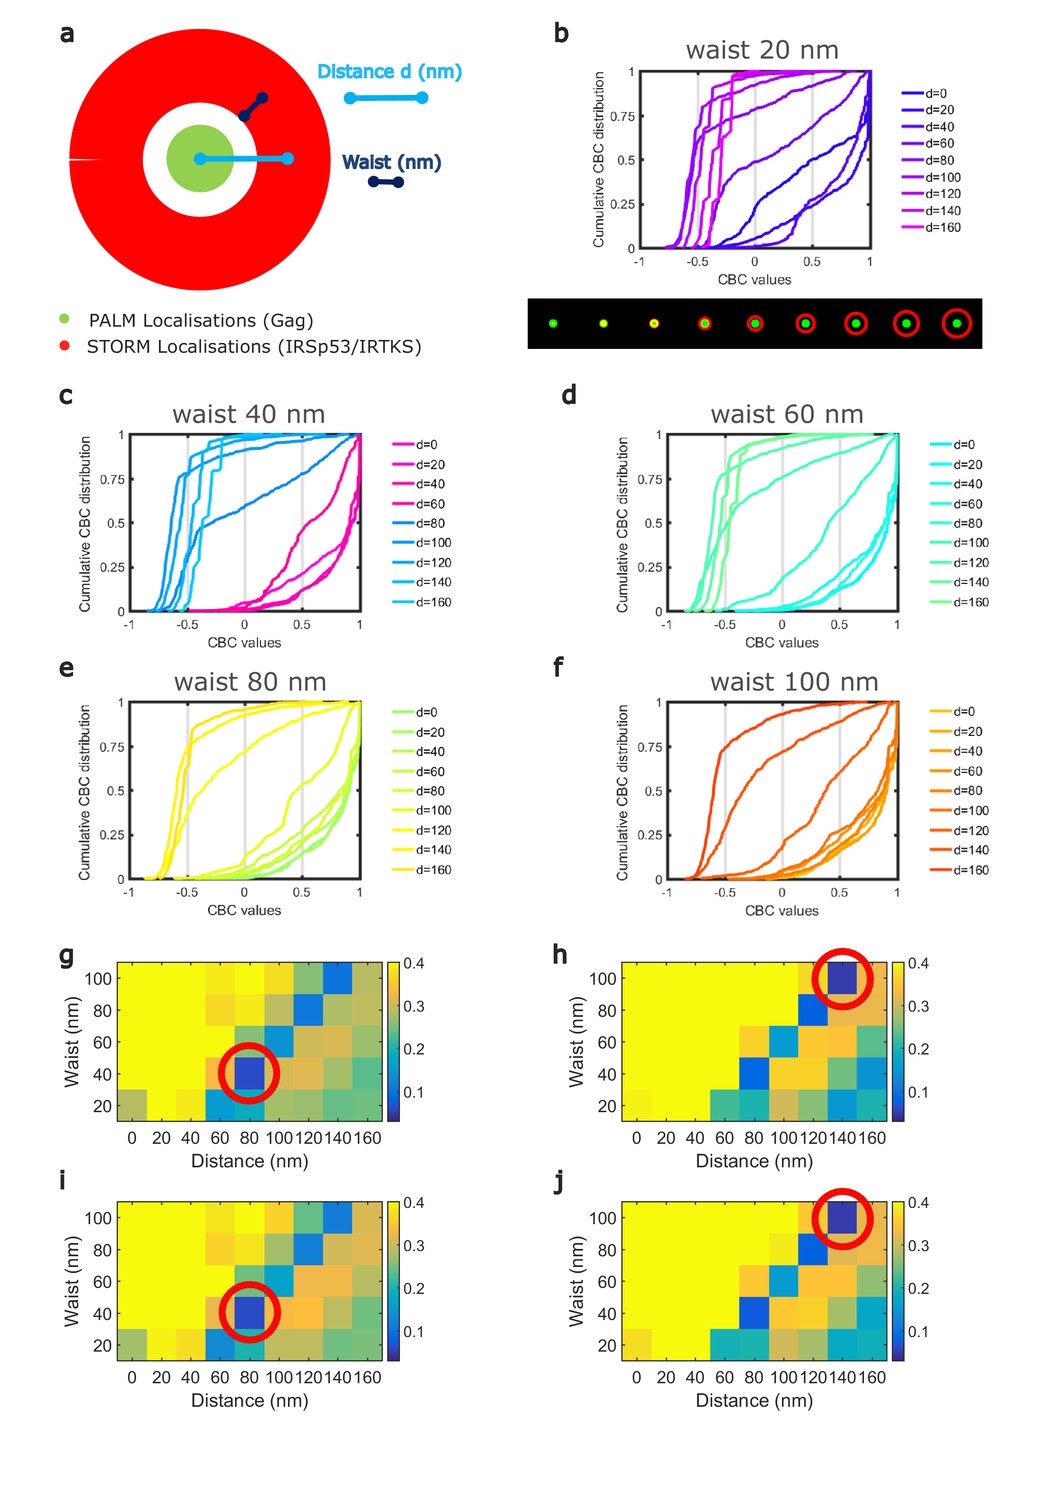
(a) Schematic representation of the different configurations used in the numerical simulation mimicking belts of given waists (w) of IRSp53 or IRTKS localizations (red) surrounding an HIV-1Gag(i)mEos2 assembly site (green) at a given distance ( d). (b) Numerically simulated cumulative distribution function of CBC values obtained for a 20 nm waist belt of IRSp53 or IRTKS at different distances from 0 to 160 nm (top). Below are found the schematic representations (upper part, input) and the ThunderSTORM reconstructed images obtained from the simulated positions (lower part, output, see 'Materials and methods' for details) for the 20 nm waist belt at different positions. (c, d, e, f) Experimental CBC values for IRSp53 in HEK (c) or Jurkat T cells (e) and IRTKS in HEK (d) and Jurkat T cells (f) were plotted as cumulative frequency distributions and compared to simulated distributions obtained at different distances and structures (see Figure 4—figure supplement 1 for the whole data sets). For both cell type, IRSp53 shows a cumulative CBC distribution corresponding to a simulation with a waist of 40 nm (width 80 nm) at a distance of 80 nm (left graph, bold gray lines correspond to the experimental data for IRSp53, bold blue lines correspond to the simulated values closest to experimental data, see Figure 4—figure supplement 1g,h,i,j for statistics). IRSp53 thus corresponds to a restricted pattern in and around a Gag assembly site (panel 1 schematic of simulated data, panel 2 simulated data, and panel 3 experimental data). On the other hand, the IRTKS experimental CBC distribution (bold gray line in the graph) is similar to simulations with a waist of 100 nm (width 200 nm) at a distance of 140 nm (bold red line). IRTKS is more diffuse and spreads out (panel 1 schematic of simulated data, panel 2 simulated data, and panel 3 experimental data). Scale bar in the panels = 100 nm.
-
Figure 4—source data 1
simulation-CBC-dataset-1 for IRSp53.
- https://cdn.elifesciences.org/articles/67321/elife-67321-fig4-data1-v2.xlsx
-
Figure 4—source data 2
simulation-CBC-dataset-2 for IRTKS.
- https://cdn.elifesciences.org/articles/67321/elife-67321-fig4-data2-v2.xlsx
Figure 4—figure supplement 1
Cumulative frequency distributions of CBCs for simulated PALM/STORM data.
Simulations corresponding to different patterns of STORM localizations around PALM clusters were performed using a homemade macro in Fiji. (a) Each molecule position was randomly distributed within a fixed size disk of 100 nm diameter for the PALM localizations (which represent 70–80% of all the experimental Gag clusters size found) or within a belt surrounding this disk for the STORM localization. The STORM belt size ranged from a waist of 20 nm (width 40 nm) to a waist of 100 nm (width 200 nm), with distances from center of the simulated viral bud (PALM disk) to the center of the surrounding belt ranging from 0 nm to 160 nm for each waist size. Each simulated localization was then convoluted by a 2D spatial Gaussian function with a waist of 200 nm in x and y direction to simulate the point spread function of the microscope. The number of photons emitted by each simulated position was randomly distributed according to a Gaussian distribution centered to a value equivalent to the maxima of the distribution of the one experimentally observed, this in order to obtain a localization precision equivalent to the experimental ones (see Fig S5 for the experimental localization precision). Each set of simulated images was then analyzed using the ThunderSTORM plugin of Fiji with the same parameter as the one used for experimental data. Single-molecule localizations obtained from this analysis were then used for CBC analysis using the CBC plugin of ThunderSTORM as it was done for experimental data sets (b–f). (g, h, i, j) Map of the root mean square error (RMSE) obtained when comparing the experimental cumulative CBC distribution to the simulated CBC distributions for the different conditions tested here. The bluest dot of the map corresponds to the minimal value of the RMSE test, that is, the best fit. These minimal values (red circles) correspond to a belt of 40 nm waist centered at a distance of 80 nm from the HIV-1 Gag cluster center in the case of IRSp53 and to a belt of 100 nm waist centered at a distance of 140 nm from the HIV-1 Gag cluster center in the case of IRTKS, this for both cell types. Direct comparison of the whole RMSE maps obtained for the two conditions independently of the cell type shows that, on average, IRTKS molecules are located further of the HIV-1 Gag(i)mEos clusters than IRSp53 molecules are.
Figure 5
IRSp53 is incorporated into HIV-1 particles in a Gag-dependent manner.
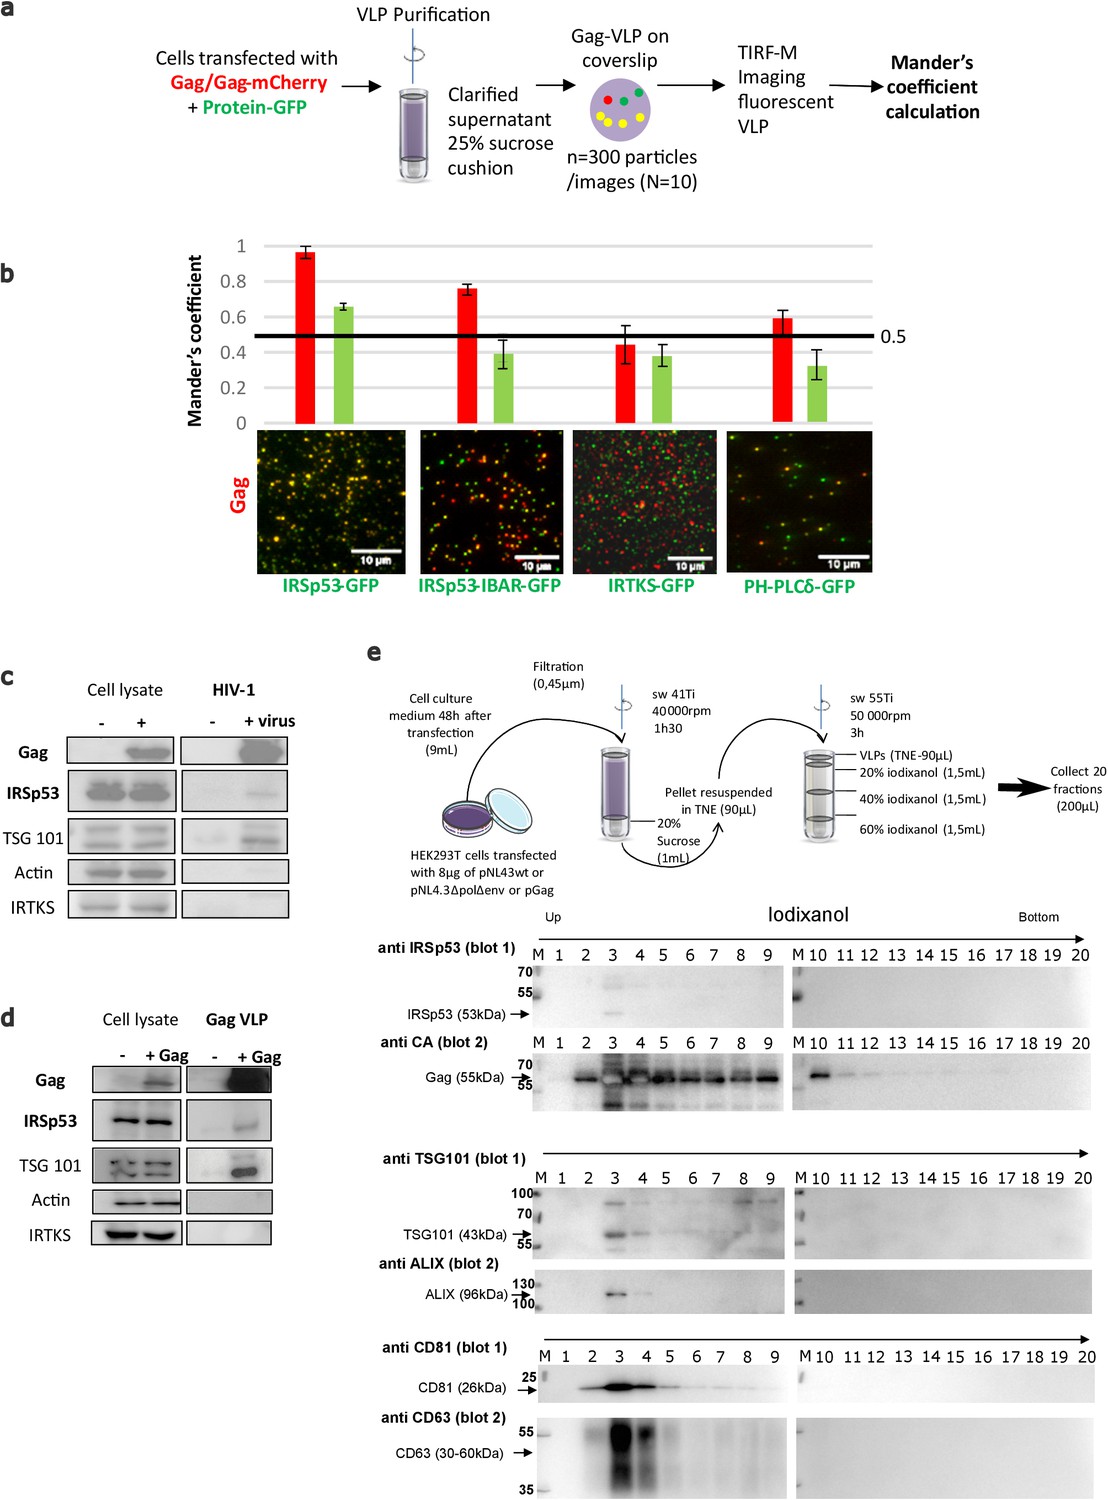
(a) Schematic for the protocol followed for imaging and analysis. HIV-1 Gag VLPs were purified from HEK293T cells expressing HIV-1 Gag/Gag-mCherry and IRSp53-GFP, or other GFP tagged proteins binding PI(4,5)P2 (IRSp53-IBAR-GFP, IRTKS-GFP, and PH-PLCδ-GFP). Purified Gag VLPs were then spotted over a poly-lysine treated glass slide and imaged by TIRF-Microscopy (particles were imaged in the red, and IRSp53 in the green channel). For each condition, 3000 particles (~300 particles/image, 10 images) were counted. Fluorescence correlation (Mander’s coefficient, see Materials and Methods for details) was determined for Gag-mCherry and for IRSp53-GFP, IRTKS-GFP, and PH-PLCδ-GFP and reported in the graphs. (b) The 0.5 value indicates a random incorporation level (indicated by black line across the graph). IRSp53-GFP and IRSp53-IBAR show high correlation values (0.95–1 and 0.8, respectively). The other I-BAR domain proteins were not significantly correlated with Gag-mCherry particles (0.4–0.5). PH-PLCδ-GFP, a known marker of the phospholipid PI(4,5)P2, shows a slightly higher correlation (0.6), since HIV-1 Gag is known to associated with this phospholipid. (c) Incorporation of IRSp53 into wild-type pNL4-3 HIV-1 or (d) Gag VLPs revealed by immunoblots against Gag(p24), IRSp53, IRTKS, Tsg101, or actin, as indicated. Following a 25% sucrose cushion purification, IRSp53 was found to be associated with released wild-type HIV-1 (left panel) and Gag VLPs (right panel). Tsg101, known to be incorporated into released particles, was also associated with viral particles. IRTKS, a closely related I-BAR protein to IRSp53, was not incorporated in purified HIV-1 viral particles or Gag-VLPs. (e) Protocol of VLPs purification using sucrose cushions and an iodixanol gradient. Briefly, pellets obtained after ultracentrifugation of cell culture medium of HEK293T transfected with pNL4.3HIV-1 or pGag were deposed on an iodixanol gradient (20%, 30%, and 60%). 20 fractions of 200 µL were collected from the top of the tube. Fractions collected following an iodixanol gradient purification of NL4-3ΔPolΔEnv Gag VLPs were analyzed using Western blots for IRSp53 and Gag, TSG101 and ALIX, CD81 and CD63 revealed respectively on the same membrane (blots 1 and 2) revealing IRSp53 association with Gag viral particles and known cofactors.
Figure 6 with 2 supplements

IRSp53 I-BAR domain enhances Gag recruitment to GUV-membranes and at the tip of I-BAR domain-induced tubes.
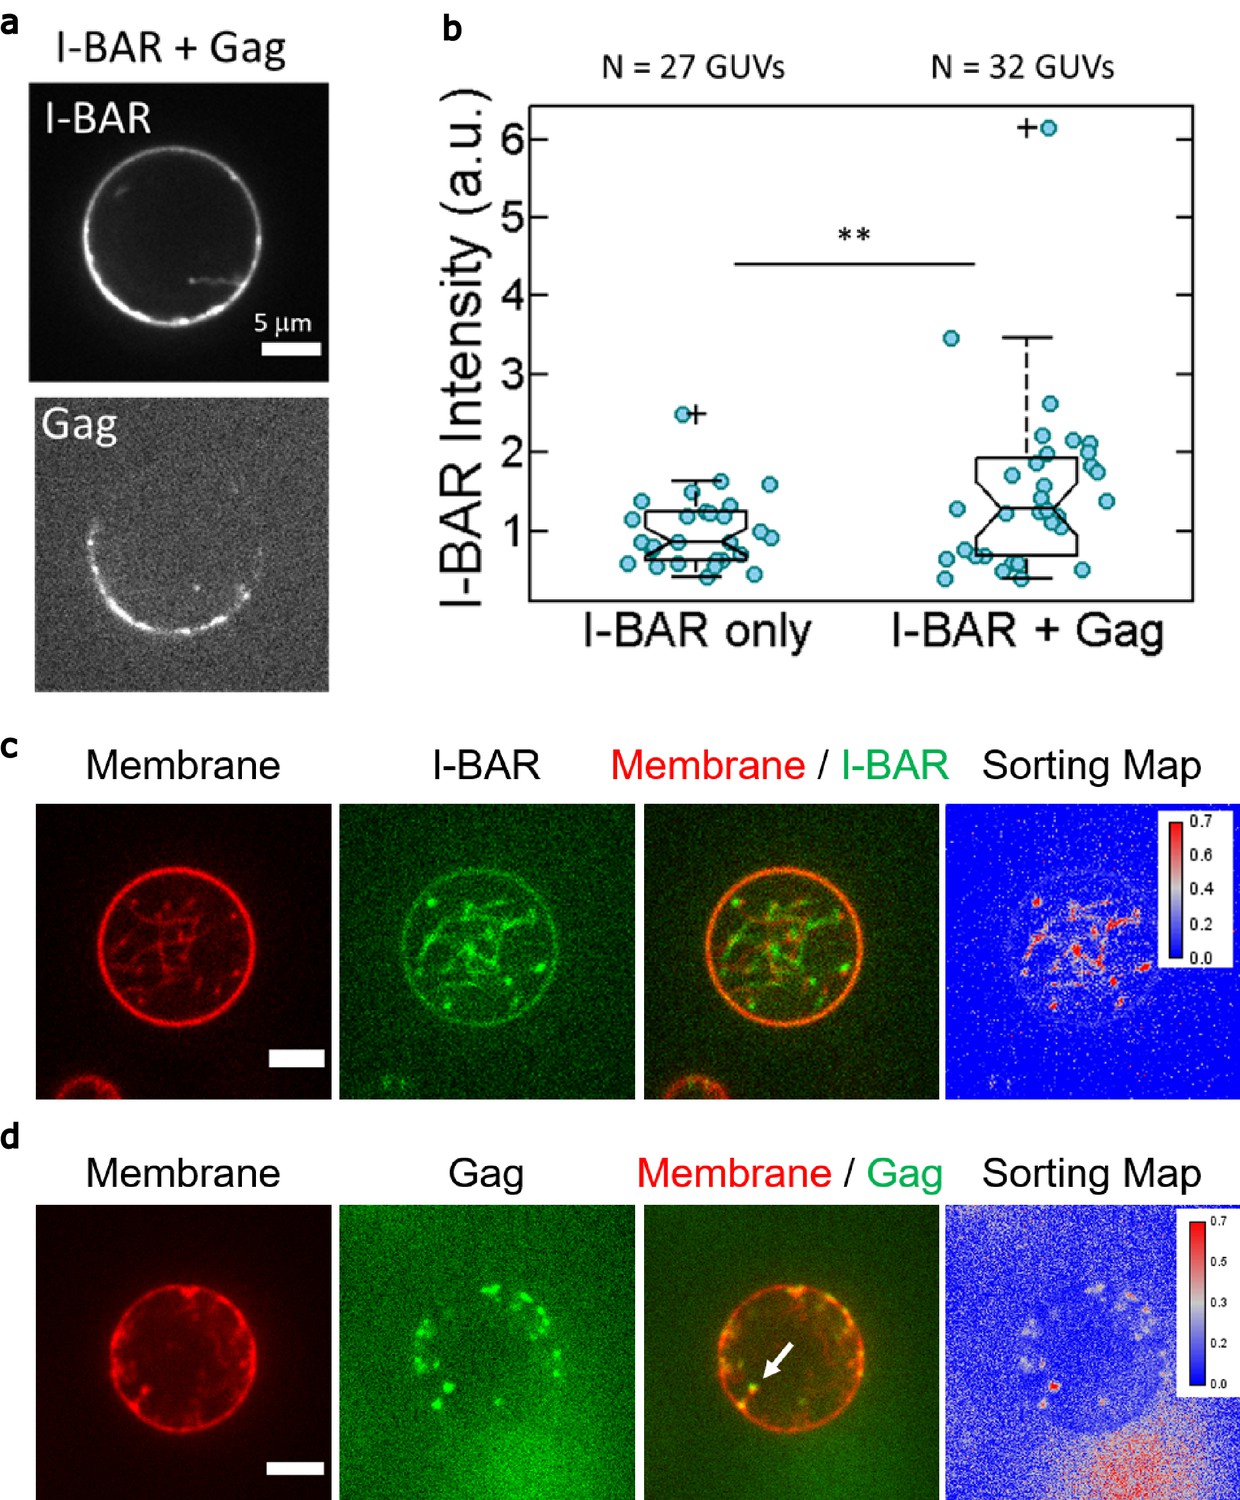
(a) (Left) AX488 Gag fluorescence intensity on membranes in the absence of I-BAR domain (named ‘Gag only’), in the presence of I-BAR domain where GUVs were first incubated with I-BAR domain and then Gag (named ‘I-BAR + Gag’) and GUVs were first incubated with Gag and then I-BAR domain (named ‘Gag + I-BAR’). Each circle presents one GUV analysis. N = 82 GUVs, n = 4 sample preparations for ‘Gag only,’, N = 67 GUVs, n = 4 sample preparations for ‘I-BAR + Gag,’ and N = 104 GUVs, n = 4 sample preparations for ‘Gag + I-BAR’. To pool all data points from the four sample preparations, in each preparation for all three conditions, Gag intensities were normalized by the mean Gag intensity in the ‘Gag only’ condition. Protein bulk concentrations: 0.3 µM for AX488 Gag and 0.5 µM for I-BAR domain (not fluorescently labeled). (Right) Representative confocal images of AX488 Gag on GUV membranes in ‘I-BAR + Gag’ condition. To visualize GUV membranes, 0.5 mol% of BODIPY-TR-C5-ceramide was incorporated in the membranes. (b) Representative confocal images of AX594 Gag in I-BAR domain-induced tubules. Inverted grayscale images are shown for I-BAR domain and Gag. Protein bulk concentrations: 0.3 μM for AX594 Gag and 0.05 µM for I-BAR domain (70% unlabeled and 30% AX488 labeled I-BAR domain). Cyan arrowheads point out I-BAR domain-induced tubules and white arrows indicate the colocalization of Gag and I-BAR domain at the tips of the tubules. (c and d) Representative confocal images of AX488 Gag (green) in I-BAR domain-induced tubules. Protein bulk concentrations: in (c) 0.1 µM for AX488 Gag and 0.05 µM for I-BAR domain (not fluorescently labeled); in (d) 0.3 µM for AX488 Gag and 0.05 µM for I-BAR domain (not fluorescently labeled). To visualize GUV membranes, 0.5 mol% of BODIPY-TR-C5-ceramide (magenta) was incorporated in the membranes. In (c), inverted grayscale images were shown for membranes and Gag. The cyan arrowhead points out an I-BAR domain-induced tubule and white arrow indicates Gag signals at the tip of the tubule. Sorting map was obtained by calculating the fluorescence intensity ratio of Gag and membranes (see Material and Methods for more details). In (d), dashed white lines indicate I-BAR domain-induced tubules. Scale bars, (a–c) 5 µm and (d) 2 μm. GUV, giant unilamellar vesicle.
Figure 6—figure supplement 1
In vitro interplay between IRSp53 I-BAR and HIV-1 Gag binding to GUV.
(a, b) In vitro GUV experiments showing an increase of IRSp53 I-BAR binding on GUV upon HIV-1 Gag addition. (a) Representative confocal images of AX488 labeled IRSp53 I-BAR and AX546 labeled Gag on GUV membranes in ‘I-BAR + Gag’ condition. (b) Measurement of AX488 IRSp53 I-BAR fluorescence intensity on membranes in the absence of Gag (named ‘I-BAR only’), in the presence of Gag where GUVs were first incubated with IRSp53 I-BAR domain and then with HIV-1 Gag (named ‘I-BAR + Gag’). Each circle presents one GUV analysis. N = 27 GUVs, n = 2 sample preparations for ‘I-BAR only,’ N = 32 GUVs, n = 2 sample preparations for ‘I-BAR + Gag.’ To pool all data points from the two sample preparations, I-BAR intensities were normalized by the mean I-BAR intensity in the ‘I-BAR only’ condition. Protein bulk concentrations: 0.05 µM for I-BAR domain and 0.3 µM for Gag. **p=0.01133, Student’s t-test. (c, d) In vitro GUV experiments. (c) Representative confocal images of a GUV (the membrane contains 0.5 mol% of BODIPY-TR-C5-ceramide, red) incubating with a low concentration of IRSp53-I-BAR domain (0.05 μM, composed of 70% of unlabeled I-BAR domain and 30% of AX488 labeled I-BAR domain, green). The I-BAR domain induces membrane tubulation toward the interior of the GUV. (d) Representative confocal images of a GUV first incubated with IRSp53 I-BAR domain (0.05 μM, unlabeled), followed by addition of HIV-1 Gag (0.3 μM, AX488 labeled, green). GUV membranes contained 0.5 mol% of BODIPY-TR-C5-ceramide (red). The white arrow points to the accumulation of AX488 Gag singles at the tip of an I-BAR induced tube. Scale bars, = 5 µm. GUV, giant unilamellar vesicle.
Figure 6—figure supplement 2
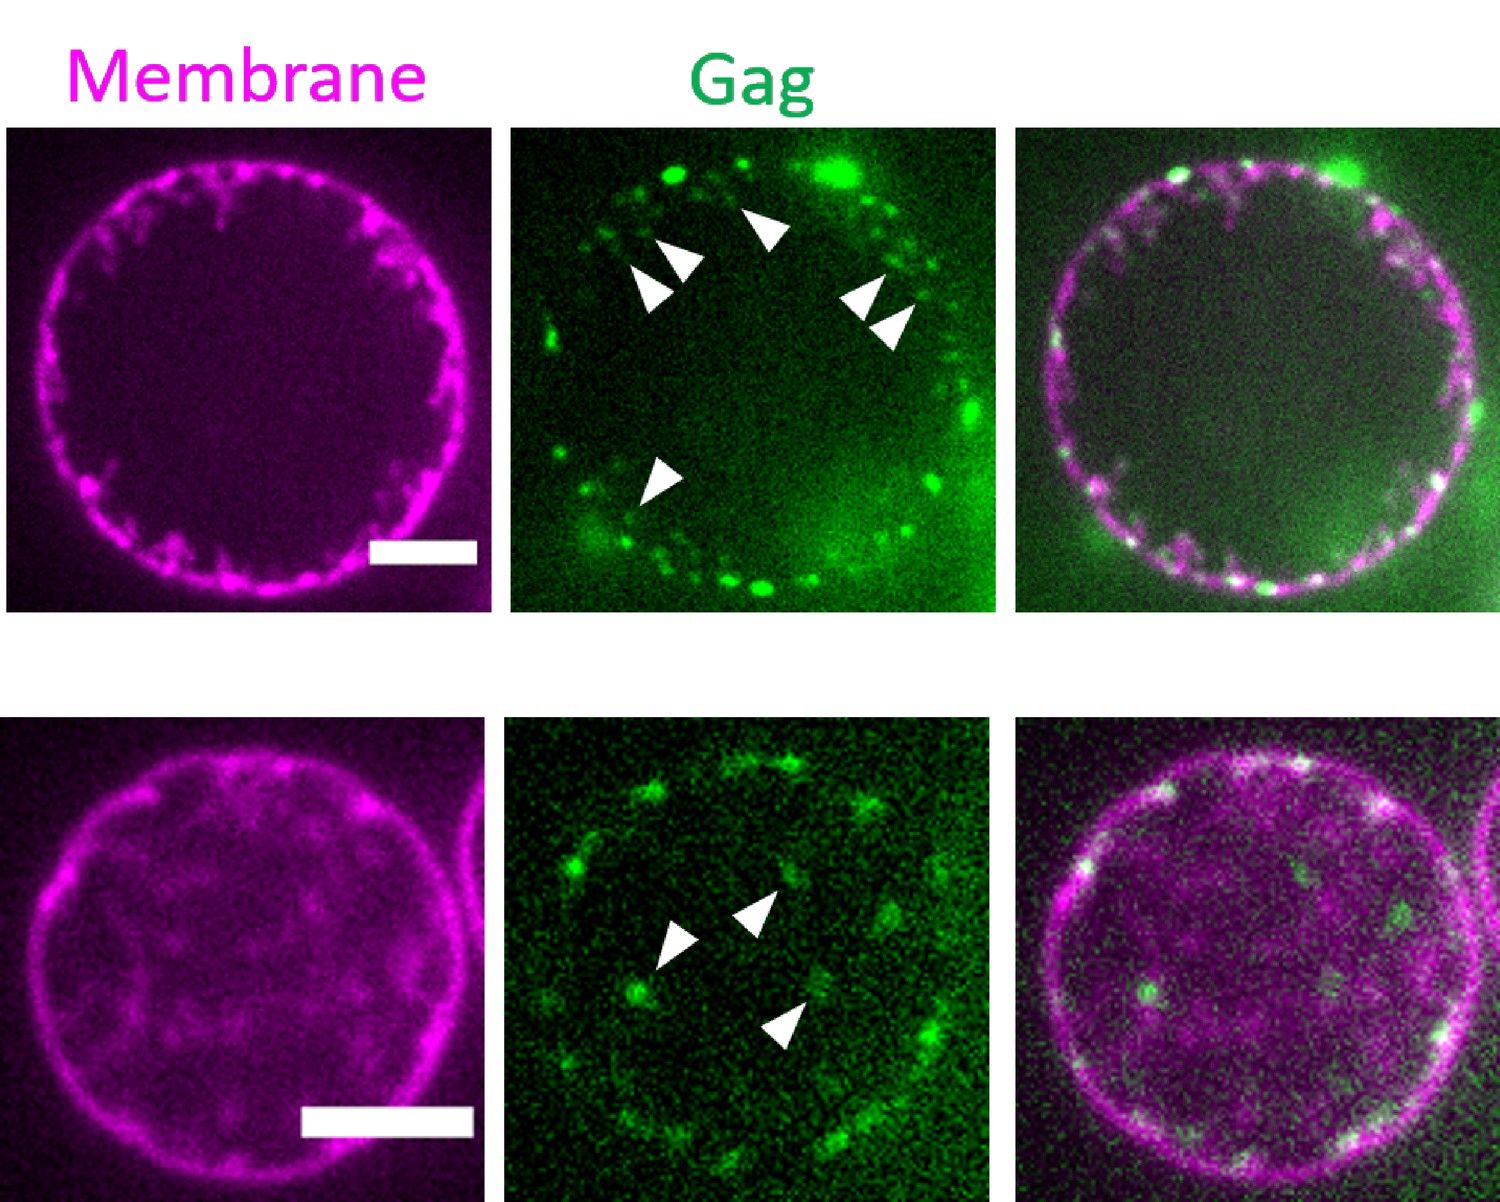
Dotty signals of Gag in GUVs with I-BAR induced tubules.
Representative confocal images of GUVs first incubated with IRSp53 I-BAR domain (0.05 μM, unlabeled), followed by addition of HIV-1 Gag (0.3 μM, AX488 labeled, green). GUV membranes contained 0.5 mol% of BODIPY-TR-C5-ceramide (magenta). White arrows point to the accumulation of AX488 Gag singles at the tip of I-BAR induced tubes. Scale bars = 5 µm. GUV, giant unilamellar vesicle.
Author response image 1
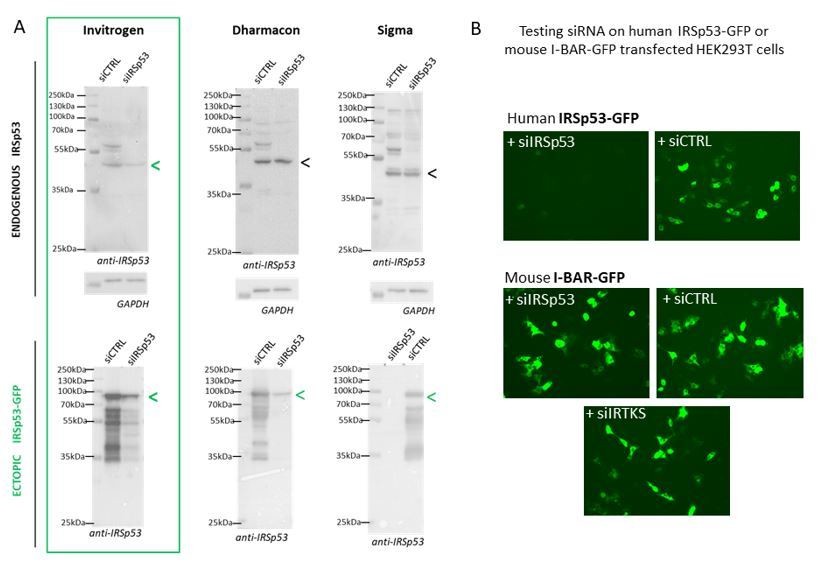
Specificity of siRNA-mediated knockdowns.
(A) Western blots of HEK293T cells lysates probed with anti-IRSp53 antibody (and house-keeping gene GAPDH) showing a series of different siRNA IRSp53 (and siRNA Control, CTRL from Invitrogen, Dharmacon or Σ) on endogenous and ectopic IRp53 genes in human HEK293T cells and their efficacy in specifically down regulating IRSp53. (B) siRNA IRSp53 from Invitrogen was tested for its specificity in extinguishing human IRSp53-GFP protein expressed in transfected HEK293T cells, but not mouse I-BAR-GFP, and as compare to siRNA control and IRTKS, revealed by fluorescence imaging (GFP).
Author response image 2

Rescue of siRNA IRSp53 knock-down with overexpression of IRSp53-GFP.
293T cell were transfected with pGag, pIRSp53 and siRNA control (siCTRL, lane 1) or siRNA IRSp53 (lane 2); cell lysat and VLP wre loaded on SDS-PAGE gels and immunoblots were revealed with anti-GFP (for IRSp53-GFP) and anti-CAp24 (for HIV-1 Gag). One graph on the left shows the percentage of IRSp53-GFP expression upon siRNA IRSp53 cell treatment (lane 2) as compare to the siRNA CTRL (lane 1). The graph on the right shows the resulting gel quantification for the % of Gag-VLP release upon siRNA IRSp53 cell treatment (lane 2) as compare to the siRNA CTRL (lane 1) in the presence of IRSp53-GFP over-expression, or without (lane 3 and 4, as in Figure 1b). N=1 rescue experiment.
Videos
Video 1
Imaging of an I-BAR domain-induced tubule having Gag signal at its tip.
Time-lapse imaging of an I-BAR domain-induced tubule. GUVs were first incubated with IRSp53 I-BAR domain (0.05 μM, unlabeled), followed by addition of HIV-1 Gag (0.3 μM, AX488 labeled, green). GUV membranes contained 0.5 mol% of BODIPY-TR-C5-ceramide (magenta). Frame interval = 0.6 s. Time in mm:ss. Scale bar = 2 μm. GUV, giant unilamellar vesicle.
Video 2
Imaging of a GUV having I-BAR domain-induced tubules.
GUVs were first incubated with IRSp53 I-BAR domain (0.05 μM, unlabeled), followed by addition of HIV-1 Gag (0.3 μM, AX488 labeled, green). GUV membranes contained 0.5 mol% of BODIPY-TR-C5-ceramide (magenta). Frame interval = 0.6 s. Time in mm:ss. Scale bar = 5 μm. GUV, giant unilamellar vesicle.
Video 3
Imaging of a GUV having I-BAR domain-induced tubules.
GUVs were first incubated with IRSp53 I-BAR domain (0.05 μM, unlabeled), followed by addition of HIV-1 Gag (0.3 μM, AX488 labeled, green). GUV membranes contained 0.5 mol% of BODIPY-TR-C5-ceramide (magenta). Frame interval = 0.6 s. Time in mm:ss. Scale bar = 5 μm. GUV, giant unilamellar vesicle.
Tables
Author response table 1
| I-BAR concentration | Percentage of GUVs with tubes (%) | Total number of GUVs |
|---|---|---|
| 0.005 uM | 24 | 78 |
| 0.02 uM | 90 | 260 |
| 0.06 uM | 87 | 189 |
| 0.1 uM | 22 | 159 |
| 0.2 uM | 22 | 120 |
| 0.5 uM | 19 | 123 |
| 1 uM | 8 | 77 |
Additional files
-
Supplementary file 1
Key Resources Table 1.
- https://cdn.elifesciences.org/articles/67321/elife-67321-supp1-v2.xlsx
-
Transparent reporting form
- https://cdn.elifesciences.org/articles/67321/elife-67321-transrepform-v2.docx
Download links
A two-part list of links to download the article, or parts of the article, in various formats.
Downloads (link to download the article as PDF)
Open citations (links to open the citations from this article in various online reference manager services)
Cite this article (links to download the citations from this article in formats compatible with various reference manager tools)
Full assembly of HIV-1 particles requires assistance of the membrane curvature factor IRSp53
eLife 10:e67321.
https://doi.org/10.7554/eLife.67321


