Sulforaphane reduces obesity by reversing leptin resistance
- Life Sciences Institute, University of Michigan, United States
- Department of Molecular Physiology & Biophysics, Vanderbilt University, United States
- College of Literature, Science, and the Arts, University of Michigan, United States
- Biomedical Sciences Department, College of Health Sciences, Qu- Health, Qatar University, Qatar
- Biomedical Research Center, Qatar University, Qatar
- Warren Center for Neuroscience Drug Discovery, Department of Pharmacology, Vanderbilt University, United States
Figures
Figure 1 with 1 supplement
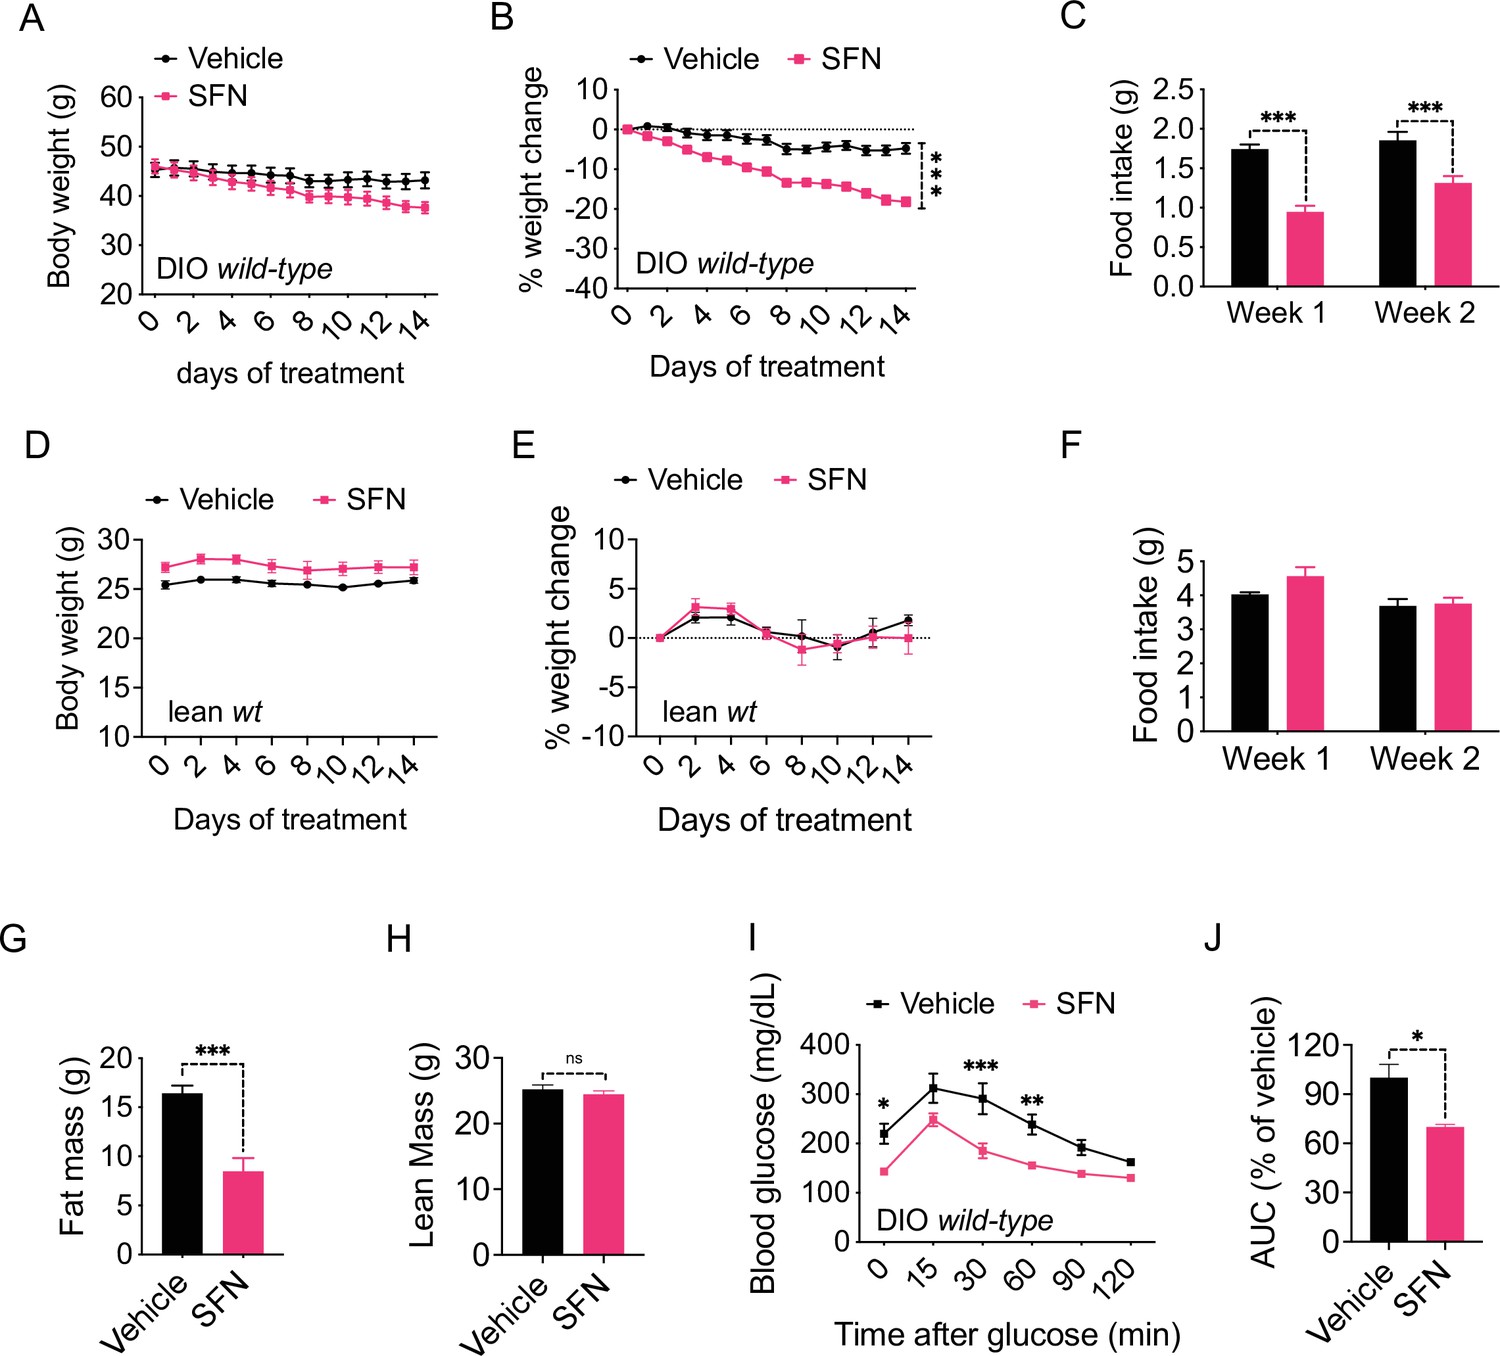
Sulforaphane (SFN) reduces diet-induced obesity.
(A–C) Diet-induced obese (DIO) (n = 7–8) or (D–F) lean wild-type mice (n = 4) were treated by daily i.p. vehicle or SFN (5 mg/kg) administrations. (A, D) Body weight, (B, E) percent change in body weight, and (C, F) average daily food intake of the mice measured at indicated times. (G, H) Fat mass (G) and lean mass (H) of the DIO mice (n = 6–7) after SFN treatment. (I, J) Glucose tolerance test (GTT) (I) and the area under the curve (AUC) of the GTT (J) performed on DIO mice (n = 4) following 2 weeks of vehicle or SFN treatment. GTT was conducted after an overnight fast. *p<0.05, **p<0.01, ***p<0.001 by two-way ANOVA with Sidak correction (A–F, I), or Student’s t-test (G, H, J).
Figure 1—figure supplement 1
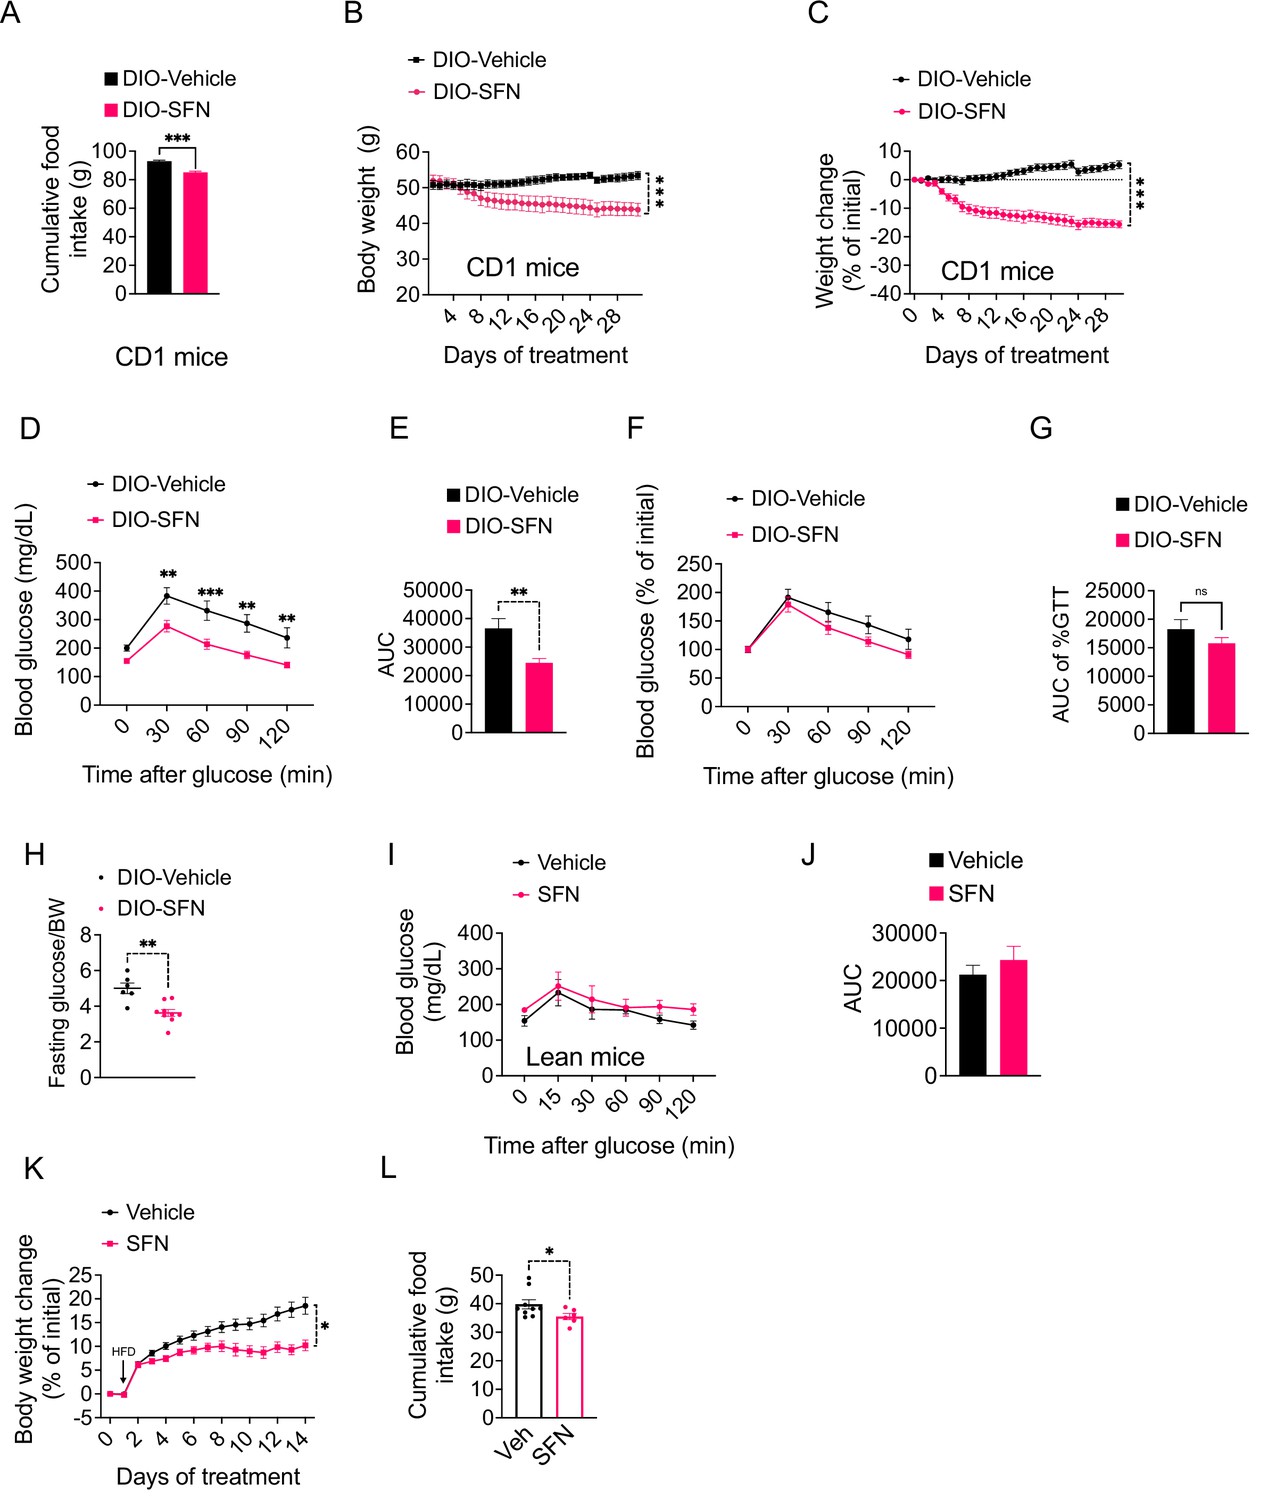
Sulforaphane (SFN) induces weight loss in obese CD1 mice.
(A) Food intake and (B) body weights, and (C) percent change in body weight of diet-induced obese CD1 mice (n = 6 mice per group) treated daily with vehicle or 5 mg/kg SFN. (D–H) Post 6 hr daytime fast glucose tolerance test (GTT) (D) and the area under the curve (AUC) of the GTT (E) performed on diet-induced obese (DIO) mice (n = 4) following 2 weeks of vehicle or SFN treatment. (F, G) Percent change of the initial blood glucose registered during the GTT (F) and the AUC of the normalized GTT (G) performed on DIO mice (n = 4) following 2 weeks of vehicle or SFN treatment. (H) Their fasting blood glucose normalized to their body weight. (I, J) Lean male C57BL/6J mice were treated with vehicle or SFN for 3 weeks. GTT was performed after 6 hr daytime fasting. ***p<0.001 by Student’s t-test (A) or two-way ANOVA with Sidak correction (B, C). (K, L) Lean male wild-type mice received daily i.p. injections of vehicle or SFN (15 mg/kg) and placed on high-fat diet (HFD). Body weight change (K) and cumulative food intakes (L) were recorded.
Figure 2
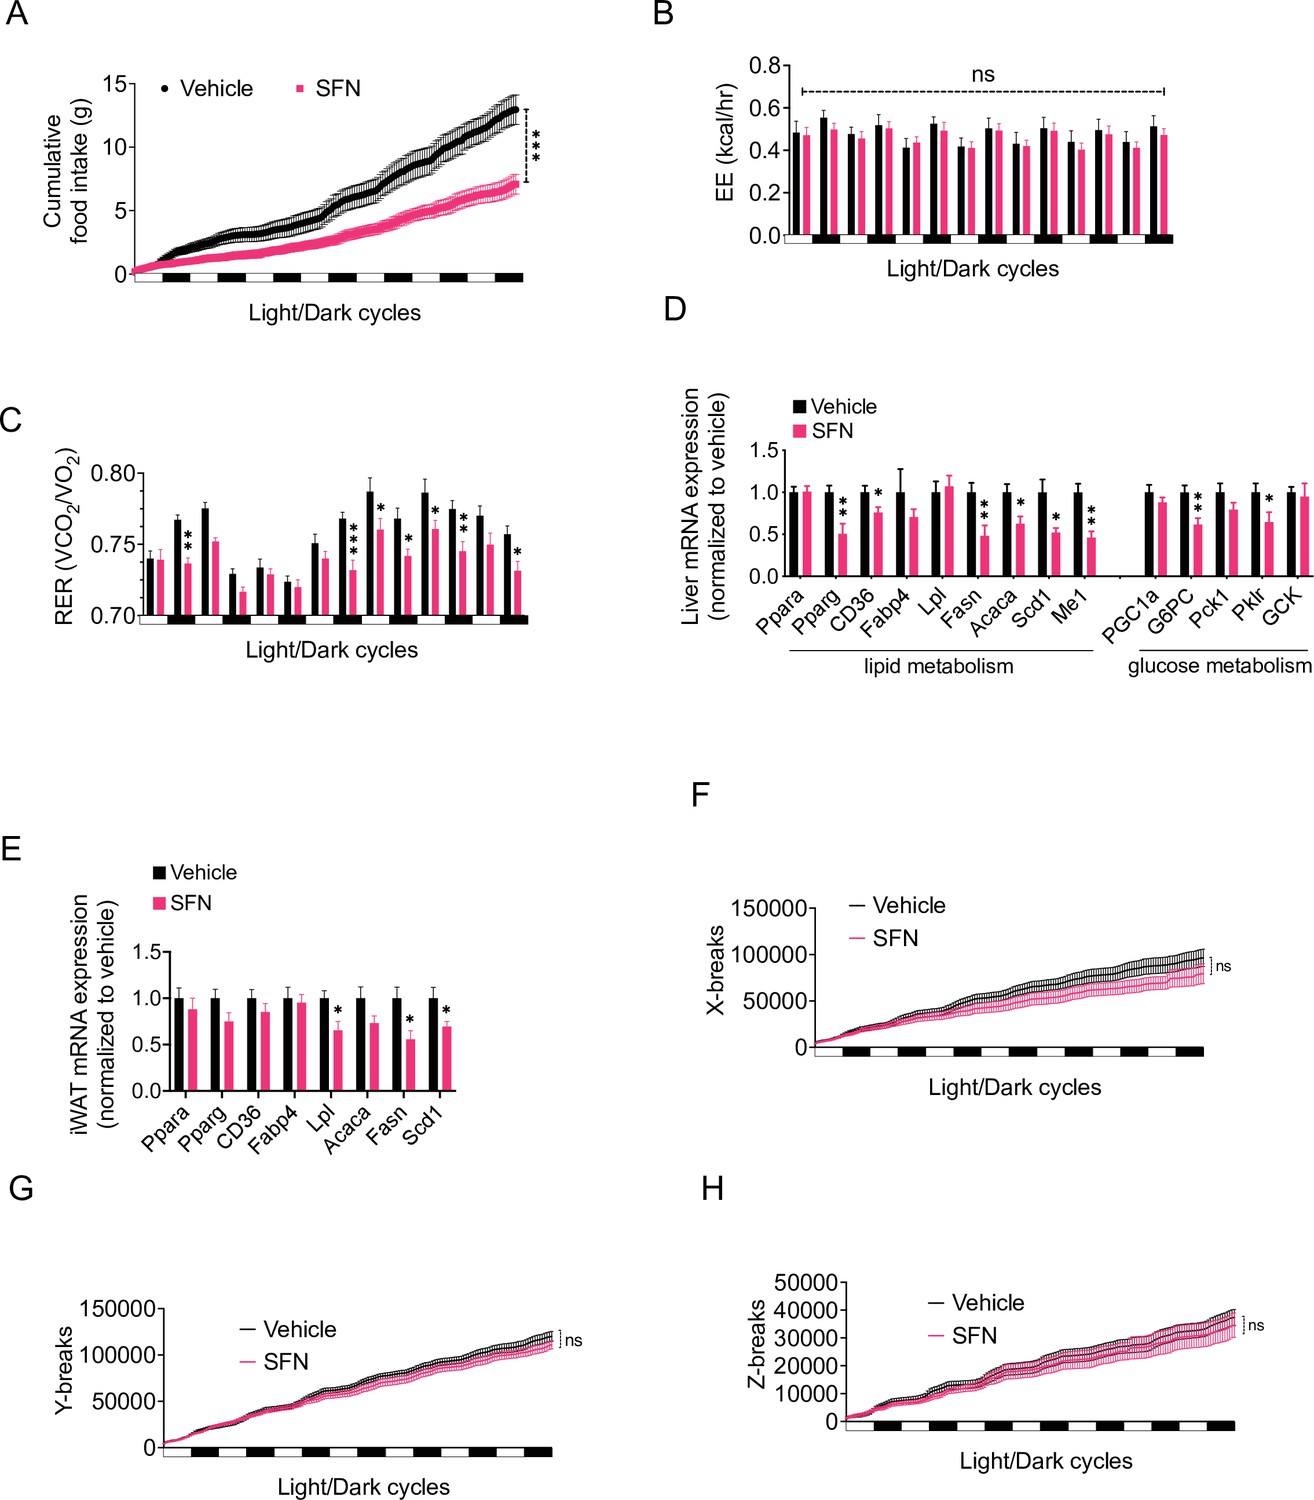
Sulforaphane (SFN) improves metabolic function in diet-induced obese (DIO) mice.
(A–C, F–H) SFN’s effect on the parameters of metabolism in wild-type DIO mice. Mice were acclimated to single housing and daily handling for 1 week, and i.p. injections of saline for 3 days prior to being placed in metabolic cages. After acclimation, DIO wild-type mice (n = 6–8) were placed into Promethion systems, SABLE, metabolic chambers and started receiving vehicle or 5 mg/kg SFN injections daily after being in the chambers. Cumulative food intake (A), energy expenditure (EE) (B), respiratory exchange ratio (RER) (C), and physical activity on the three axes (F–H) were recorded for light and dark cycles. (D, E) Analysis of gene expression by qPCR in liver (D) and inguinal white adipose tissue (WAT) (E) of DIO mice (n = 7) following treatment with vehicle or SFN. *p<0.05, **p<0.01, ***p<0.001 by two-way ANOVA with Sidak correction (A–C, F–H), or Student’s t-test (D, E).
Figure 3

Sulforaphane (SFN) prevents the development of diet-induced obesity.
Lean wild-type mice (n = 6–7 per group) were treated with vehicle on standard chow (Chow) or placed on high-fat diet (HFD) and treated daily with either vehicle or SFN (i.p., 10 mg/kg) for eight consecutive weeks. (A) Body weight and (B) percent change in body weight of the animals during the treatment period. (C) Body composition of the mice at the end of the treatment period. (D) Cumulative food intake during the treatment period. (E, F) Plasma leptin (n = 6–10) (E) and blood glucose levels (n = 6–14) (F) measured at the end of 8-week study. *p<0.05, **p<0.01, ***p<0.001 by two-way ANOVA with Tukey’s post-hoc test (A, B, D), one-way ANOVA (C, E, F).
Figure 4 with 2 supplements

The antiobesity effect of sulforaphane (SFN) is NRF2-dependent and HDAC6-independent.
(A–H) NRF2 KO mice were placed on high-fat diet (HFD) to induce obesity. Mice were then treated daily by i.p. vehicle or SFN injections. SFN dose was 5 mg/kg for the first three weeks and increased to 10 mg/kg thereafter. Wild-type diet-induced obese (DIO) mice were treated with vehicle or SFN for the same period for comparison. (A, B) Body weight (A) and percent change in body weight (B) of the NRF2 KO mice throughout the vehicle or SFN treatments. (C) Body weight of NRF2 KO (the same cohort graphed in A) and wild-type DIO mice receiving treatments with vehicle or SFN for the same period for comparison. (D) Percent change in body weight of NRF2 KO and wild-type DIO mice at the end of the treatments shown in panel (C). (E, F) Daily food intake (E) and cumulative food intake (F) of the DIO NRF2 KO mice (n = 6 per group) during the treatment period. (G, H) Glucose tolerance test (GTT) (G) and the area under the curve (AUC) of the GTT (H) performed on NRF2 KO DIO mice (n = 6, 8) during the 3 weeks of vehicle or 5 mg/kg SFN treatment shown in (A). (I–K) HDAC6 KO or wild-type mice were fed HFD to induce obesity. The mice were then treated with vehicle or 5 mg/kg SFN by daily i.p. injections. Body weights (I), percent change in body weight (J), and daily food intakes (K) were recorded (n = 4–6 mice per group). *p<0.05, **p<0.01, ***p<0.001 by two-way ANOVA with Sidak correction (A–I).
Figure 4—figure supplement 1
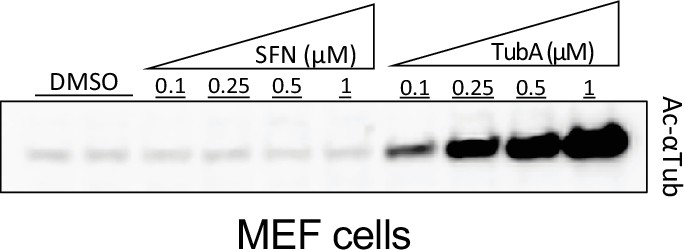
Effect of sulforaphane (SFN) on tubulin acetylation in mouse embryonic fibroblasts (MEFs).
MEFs treated with DMSO as vehicle, SFN or the HDAC6-specific inhibitor Tubastatin A HCl (TubA) at the indicated doses for 24 hr. Tubulin acetylation (K40) was analyzed by Western blotting.
Figure 4—figure supplement 2
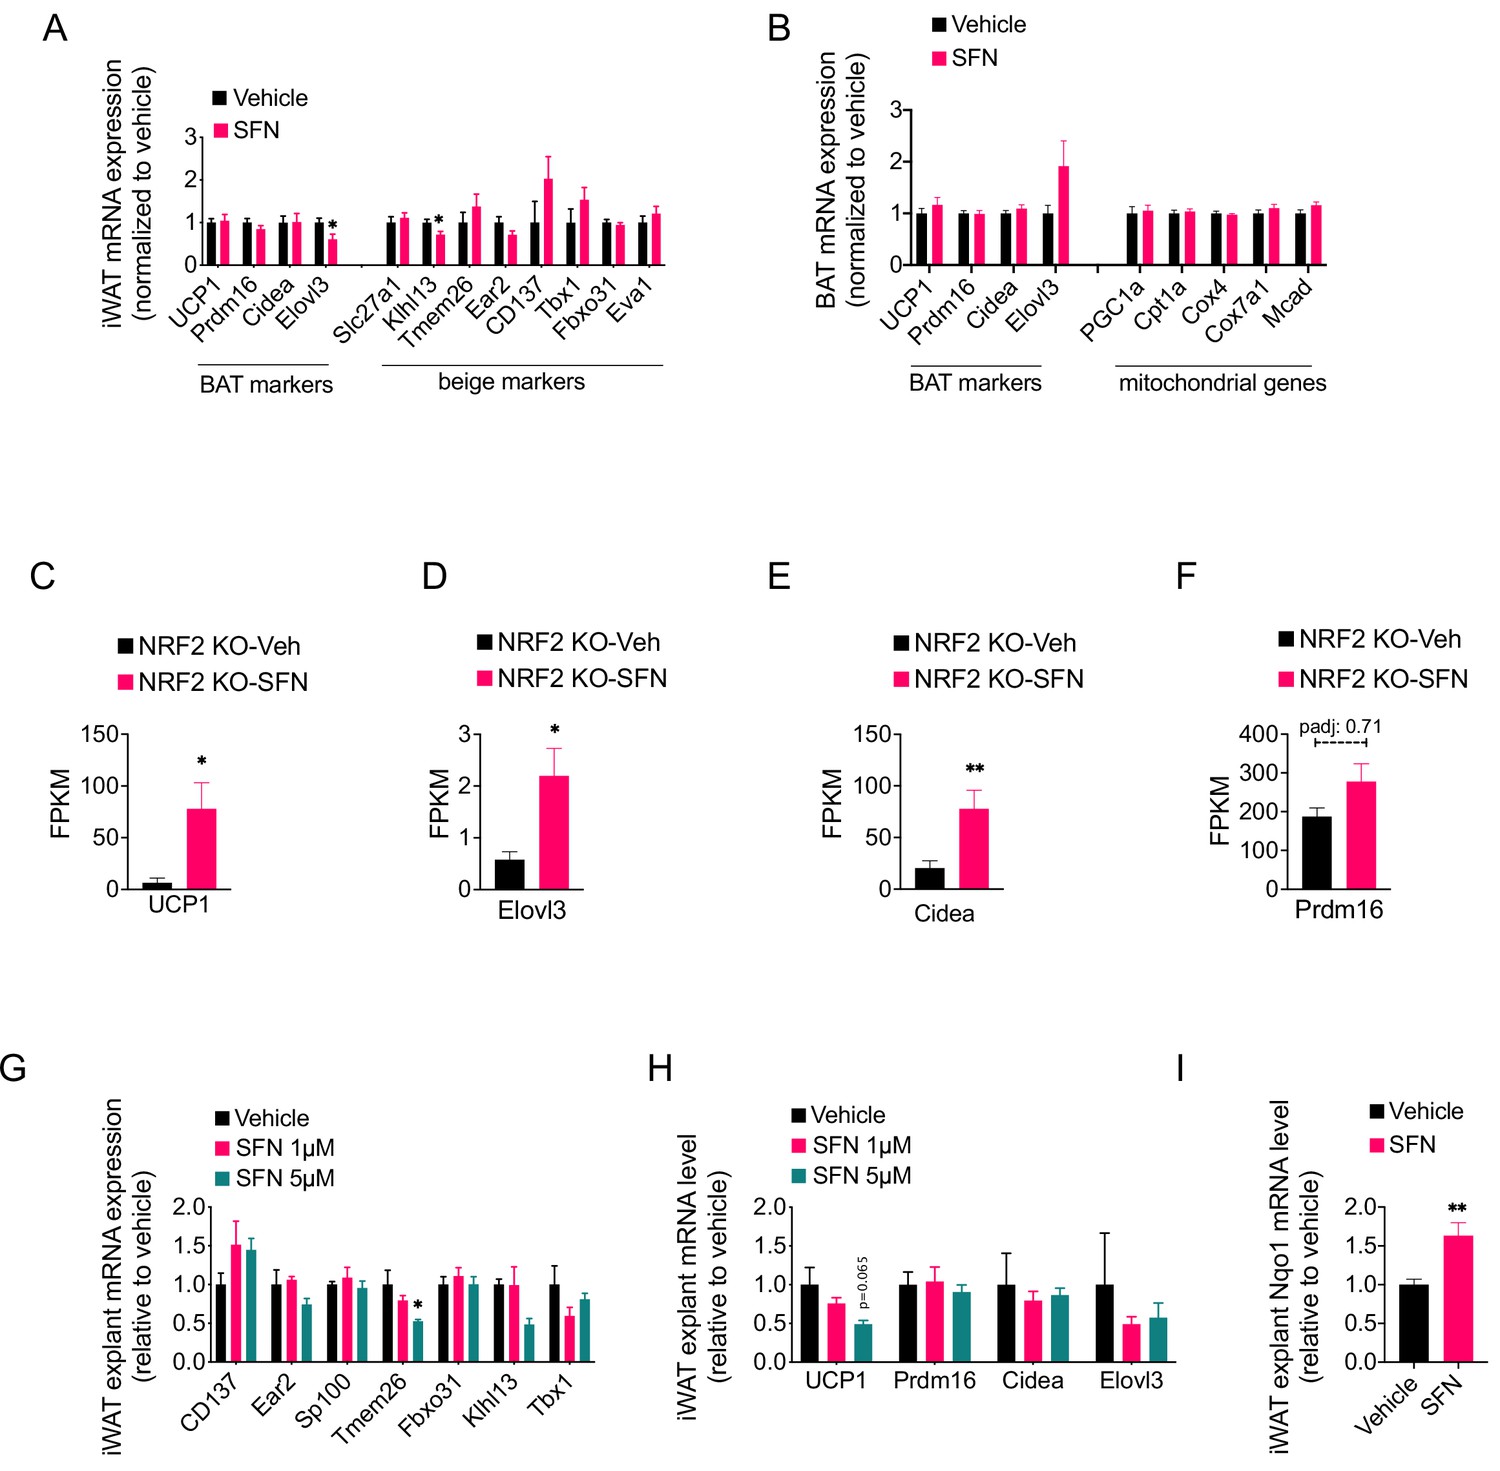
Sulforaphane (SFN) does not induce a beige or brown adipose-specific gene expression profile.
(A, B) Diet-induced obese (DIO) wild-type mice were treated with vehicle or 5 mg/kg SFN for 1 week (n = 6–7 per group). The expression of brown adipose, beige adipose, and mitochondrial genes in inguinal white adipose tissue (iWAT) (A) and brown adipose tissue (BAT) (B) were analyzed by qPCR. (C–F) The fragments per kilobase of transcript per million mapped reads (FKPM) values of the BAT marker genes in iWAT of vehicle or SFN-treated DIO NRF2 KO mice. p-adjusted values (false discovery rate [FDR]) are indicated over the bar graphs. *padj<0.05, **padj<0.01 (See also Supplementary file 2). (G–I) The expression of beige-specific (G) and brown-related genes (H) and of Nqo1 (I) in iWAT explants (n = 4–6 per group) from DIO wild-type mice were treated with vehicle or indicated doses of SFN for 24 hr. Gene expression was analyzed by qPCR. *p<0.05, **p<0.01, ***p<0.001 by Student’s t-test.
Figure 5 with 3 supplements
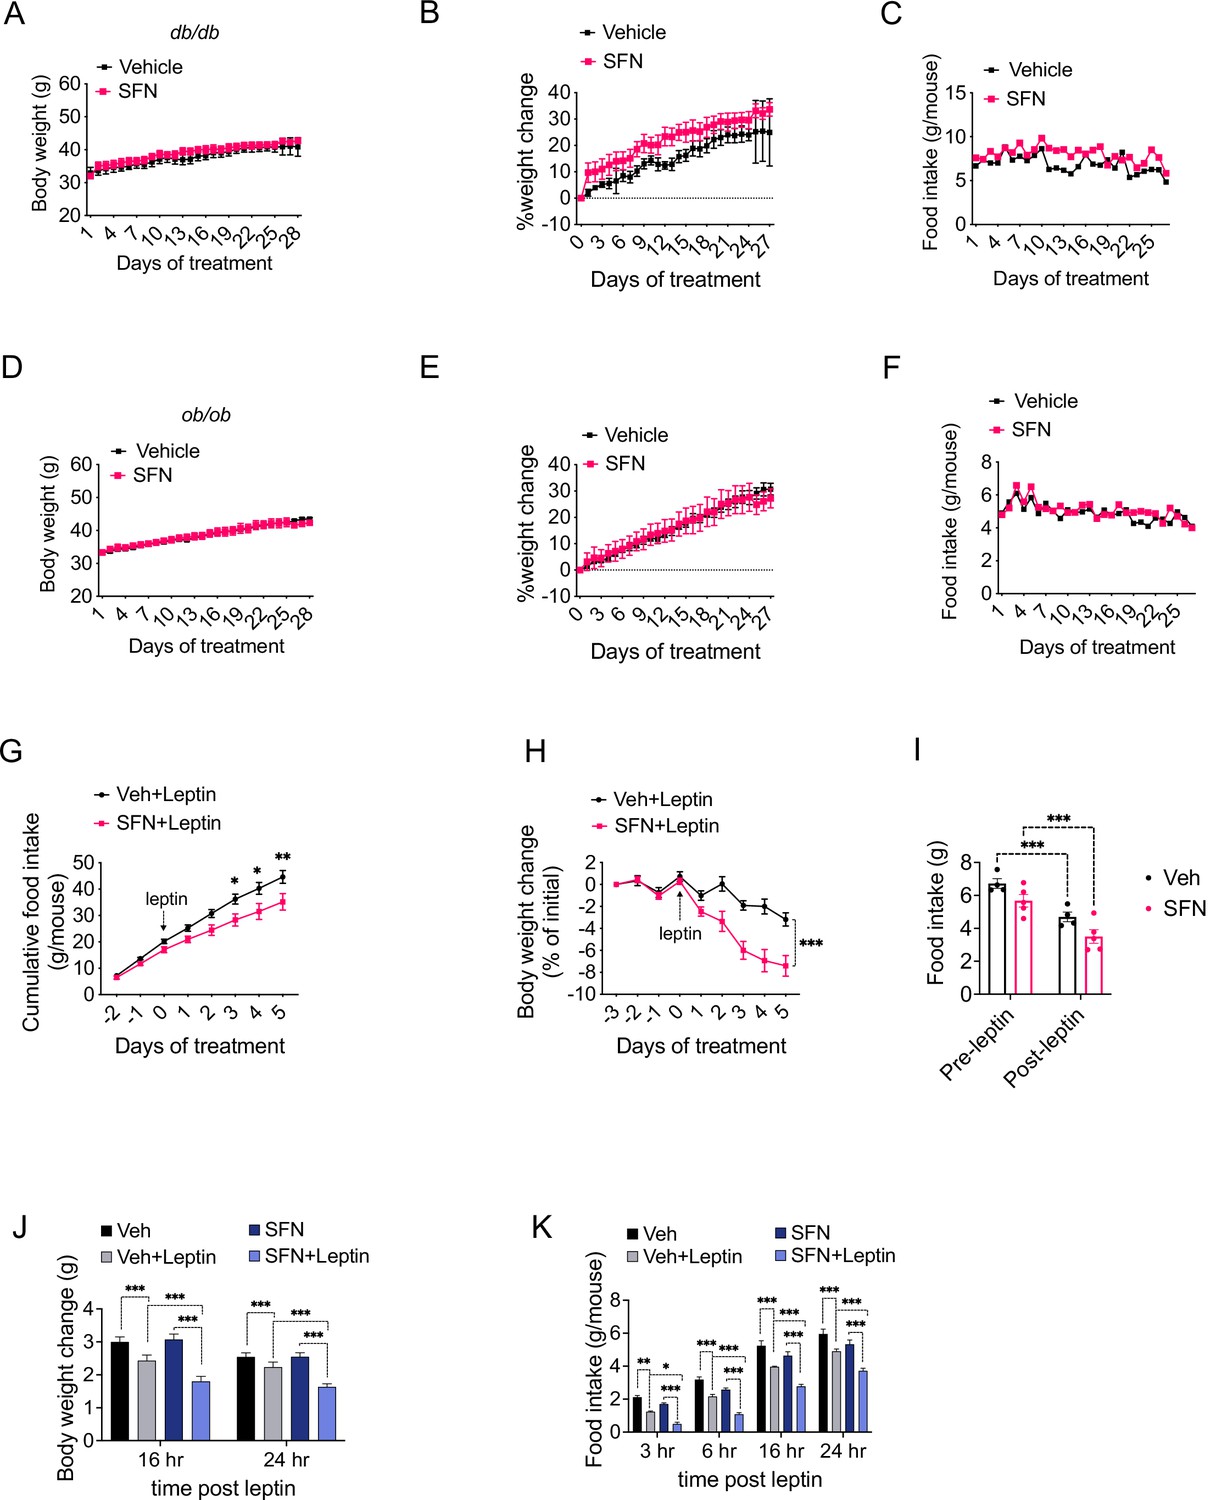
Sulforaphane (SFN) reduces obesity by improving leptin action.
(A–F) Leptin signaling is required for SFN’s action. Leprdb/db mice (n = 3 per group) (A–C) and Lepob/ob mice (n = 3 per group) (D–F) fed with normal chow diet were treated with vehicle or 5 mg/kg SFN for 4 weeks by daily i.p. injections. Body weight (A, D), percent change in body weights (B, E), and food intake (C, F) of the animals. (G–I) Cumulative food intake (G), body weight change (percent of initial) (H), and average daily food intakes (before and after leptin injections, I) of Lepob/ob mice (n = 6 mice per group) pretreated for 3 days with vehicle or 5 mg/kg SFN, then started receiving daily i.p. injections of leptin (0.2 mg/kg). (J, K) Post 24 hr fast-refeeding kinetics in normal chow-fed lean wild-type mice (n = 15–16 mice per group) show the body weight change (J) and food intake (K) of mice that received single dose of vehicle, saline, 5 mg/kg SFN and/or 0.2 mg/kg leptin 1 hr before refeeding begins. *p<0.05, **p<0.01, ***p<0.001 by two-way ANOVA with Sidak correction (A, B, D, E, G–I), or Tukey’s post-hoc test (J, K).
Figure 5—figure supplement 1
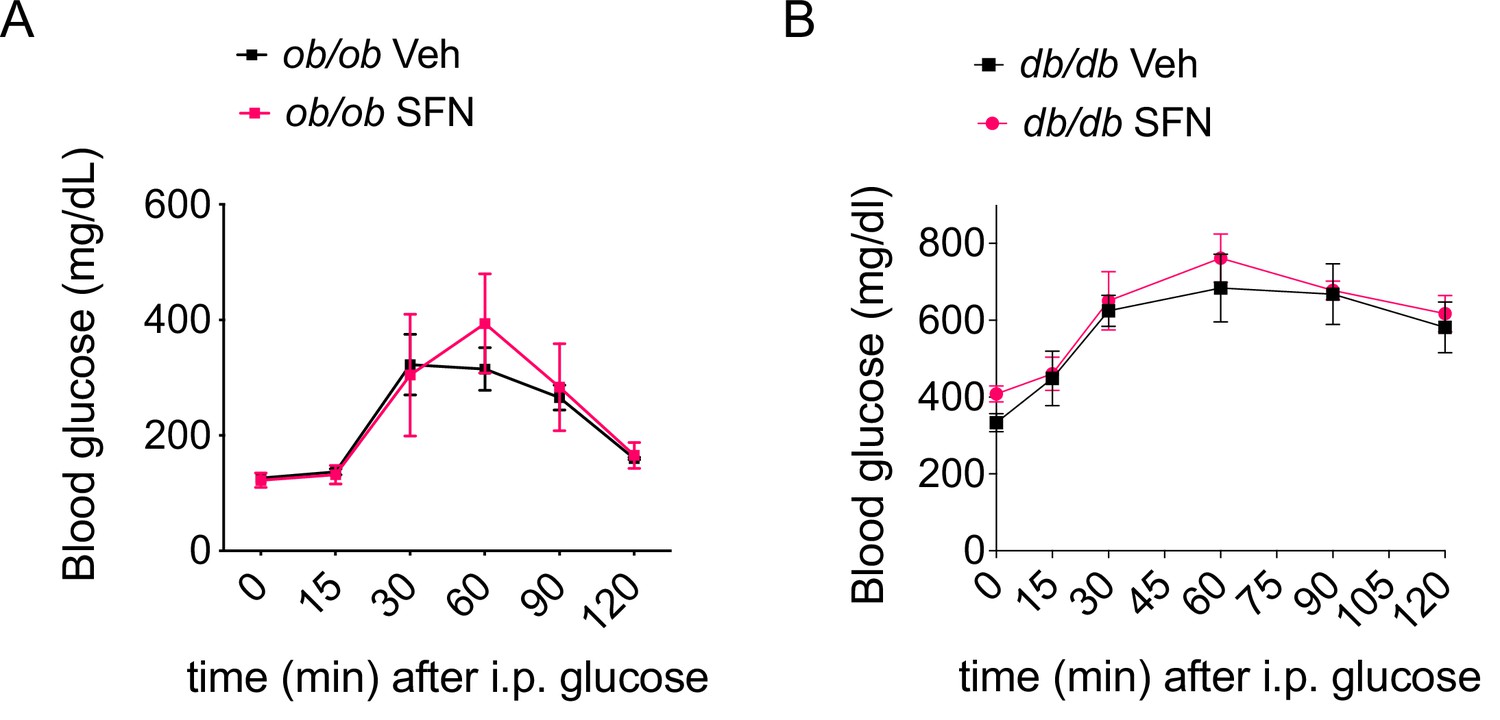
Sulforaphane (SFN) requires leptin action for improved glucose homeostasis.
(A, B) Glucose tolerance test (GTT) conducted on 6 hr daytime fasted Lepob/ob (A) or Leprdb/db (n = 4 mice per group) (B) mice fed with normal chow and treated with 3-week i.p. vehicle or 5 mg/kg SFN.
Figure 5—figure supplement 2
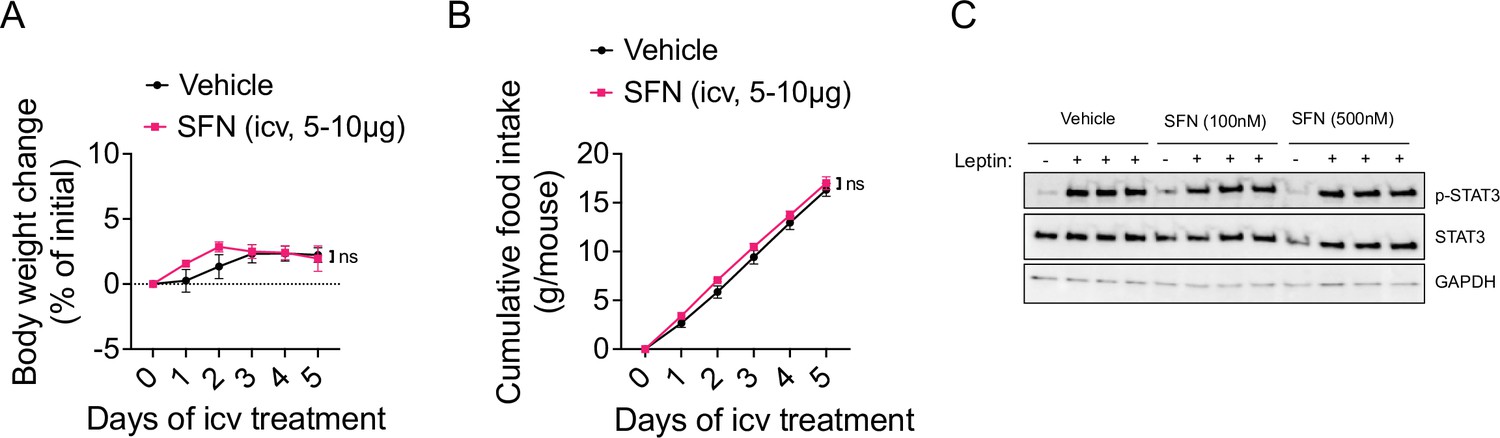
The antiobesity effect of sulforaphane (SFN) is not centrally mediated.
(A, B) Diet-induced obese (DIO) wild-type mice were implanted a guide cannula into the lateral ventricle. Graphs show the body weight change (A) and food intakes (B) of the animals (n = 6–7 mice per group) that were infused with vehicle or SFN 5 µg for 3 days, then 10 µg for 2 days into the lateral ventricle. Statistics conducted by mixed effect analysis with Sidak correction. (C) Immortalized hypothalamic N1 cells were transfected with FLAG-tagged LepRb expression plasmids. Cells were treated with vehicle or SFN (100–500 nM) for 24 hr. Cells were then treated with 10, 33, 100 ng/mL leptin for 15 min, and the STAT3 phosphorylation at Y705 was analyzed by immunoblots.
Figure 5—figure supplement 3
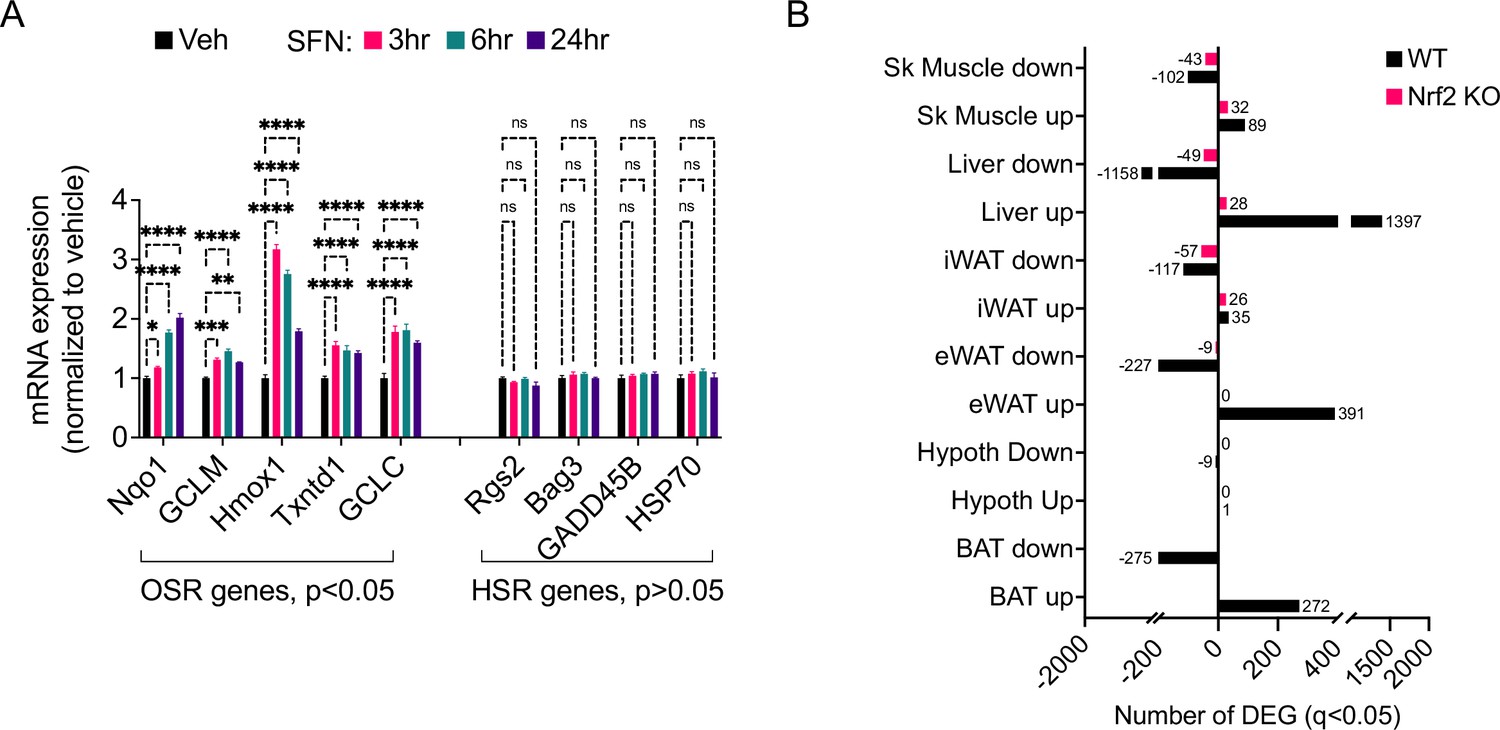
Sulforaphane (SFN) acts primarily in the periphery.
(A) Analysis of expression of oxidative stress response (OSR) and heat shock response (HSR) genes following SFN (1 µM) treatment of mouse embryonic fibroblasts (MEFs) (n = 3 per group). *p<0.05, by one-way ANOVA with Dunnett correction. (B) RNAseq results from wild-type and NRF2 KO diet-induced obese (DIO) mice after SFN or vehicle indicate the number of differentially expressed genes (DEGs) in various tissues.
Figure 6 with 37 supplements
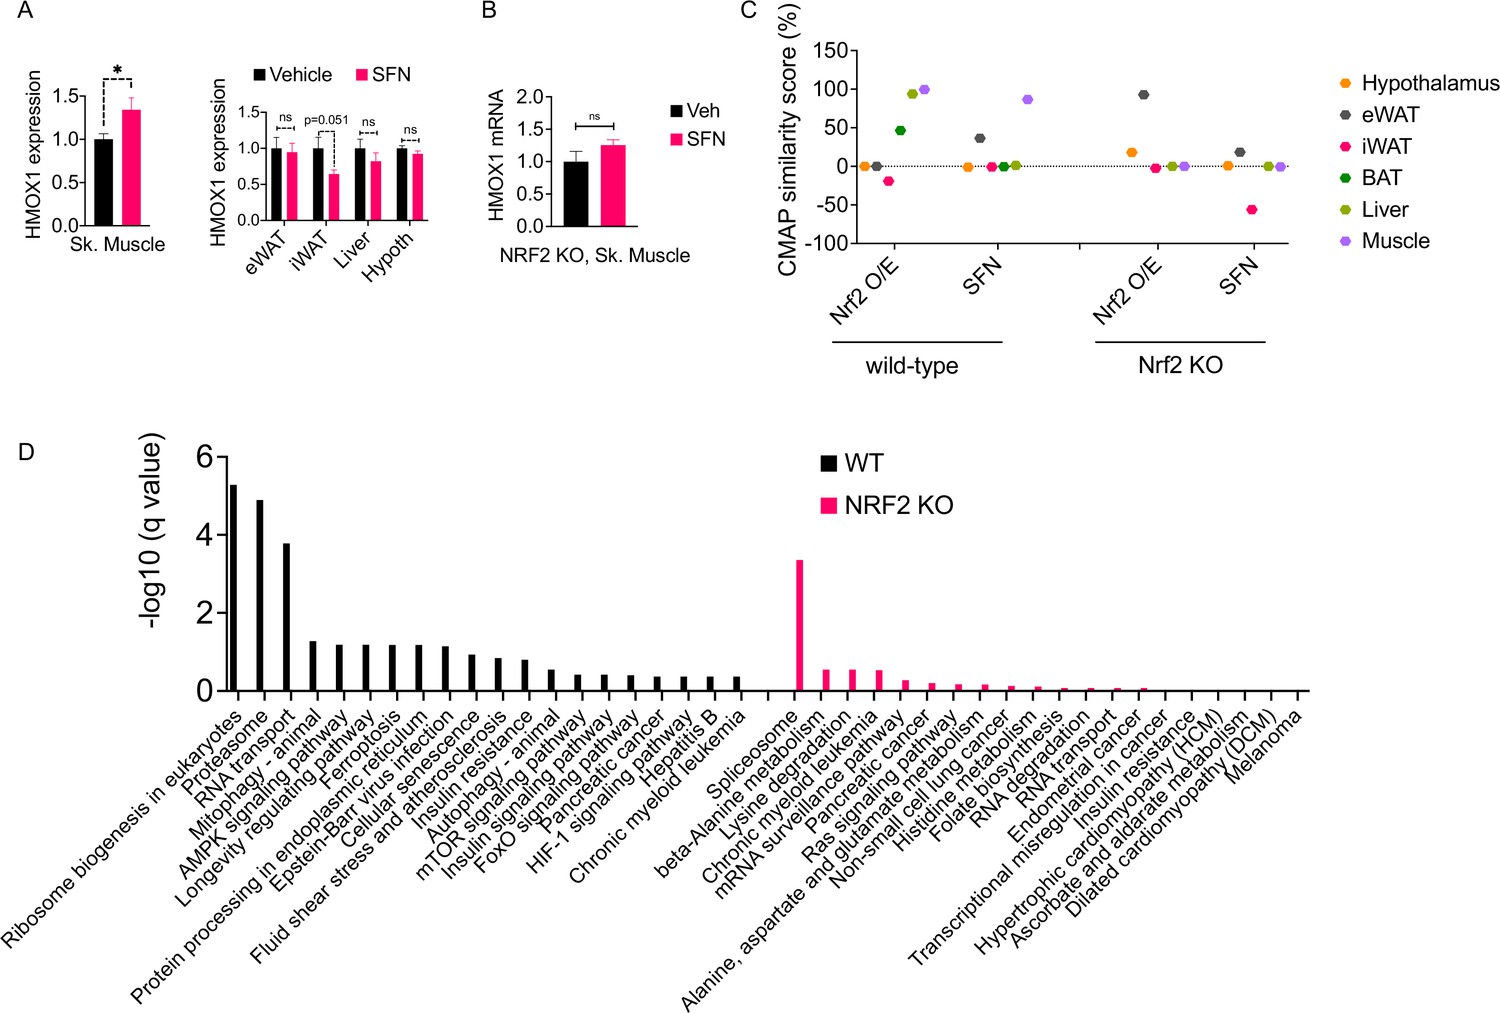
The molecular signature of sulforaphane (SFN) action in the obese mice.
(A) The expression of NRF2-target gene Hmox1 in the gastrocnemius skeletal muscle (left panel), and eWAT, inguinal white adipose tissue (iWAT), liver, the hypothalamus (right panel) measured by qPCR of diet-induced obese (DIO) wild-type mice (n = 7 per group) following 1 week of vehicle or 5 mg/kg SFN treatments. *p<0.05, calculated by Student’s t-test. (B) Hmox1 mRNA expression measured by qPCR in the skeletal muscle of DIO NRF2 KO mice (n = 8 per group) following i.p. vehicle or 5 mg/kg SFN treatments. (C, D) RNAseq was conducted on DIO wild-type NRF2 KO mouse tissues following vehicle or SFN treatment (n = 5 per tissue, per treatment). (C) Connectivity Map (CMap) correlation score of the SFN gene expression signature from each tissue. (D) KEGG enrichment pathway analysis of skeletal muscle based on the RNAseq results from WT DIO (left panel) and NRF2 KO DIO (right panel) mice.
Figure 6—figure supplement 1
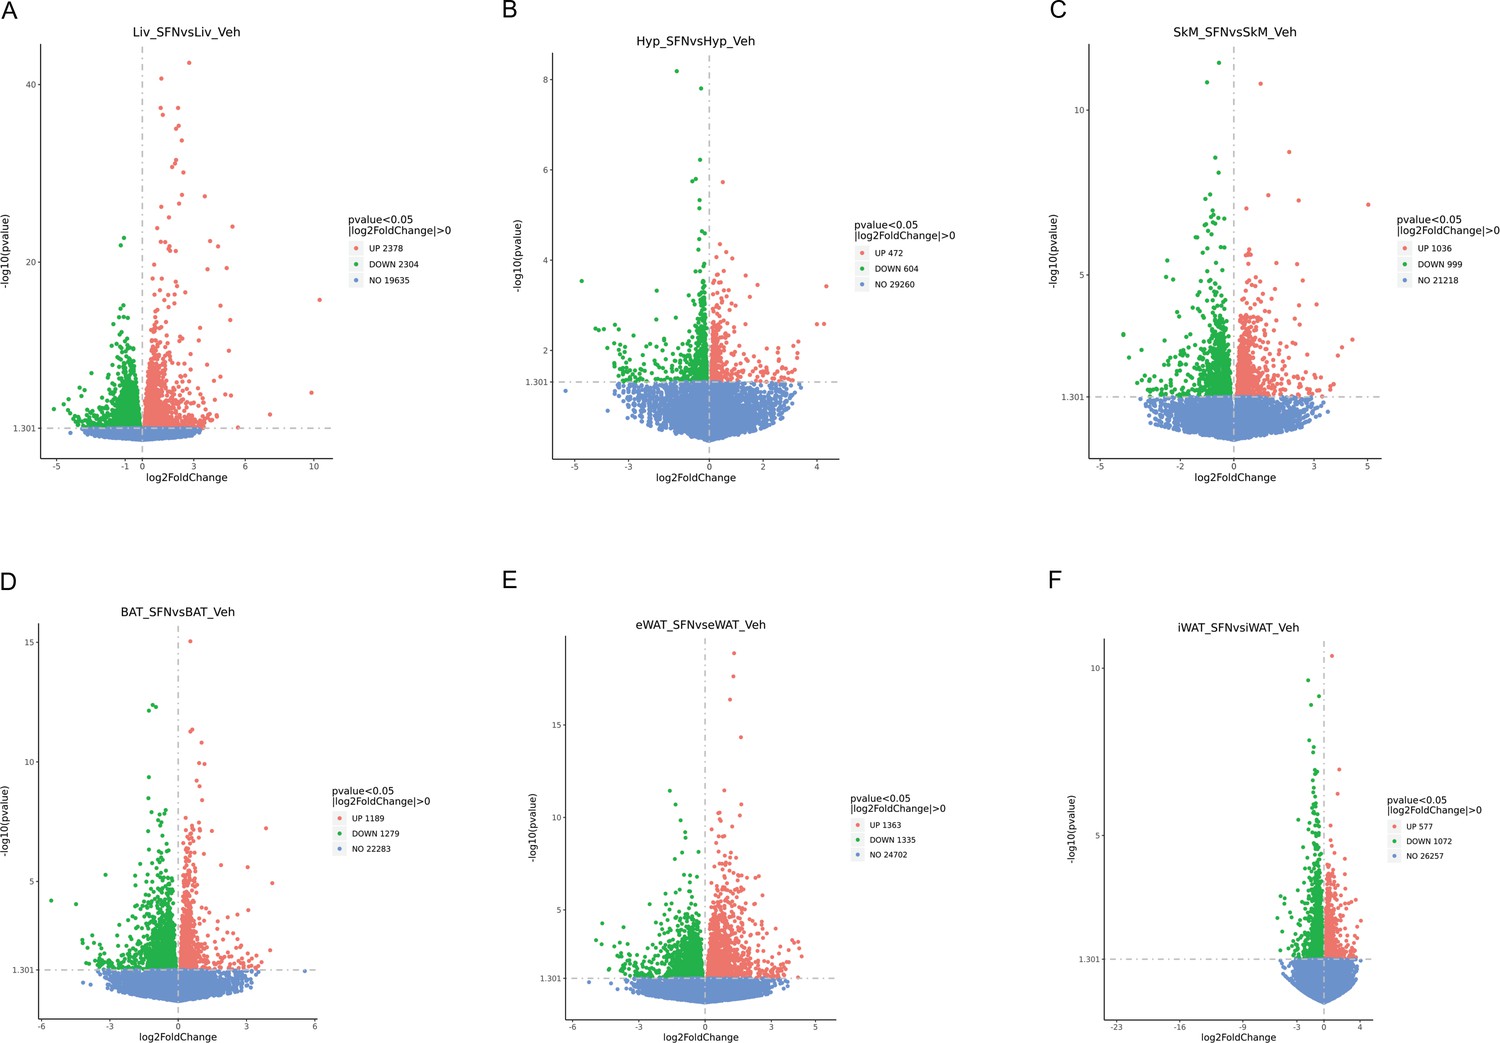
RNAseq results of the vehicle vs. sulforaphane (SFN)-treated wild-type diet-induced obese (DIO) mice.
(A) Volcano plots for genes at p<0.05 from the RNAseq of liver (Liv, A), the hypothalamus (Hyp, B), skeletal muscle (SkM, C), brown adipose tissue (BAT, D), eWAT (E), and inguinal white adipose tissue (iWAT) (F).
Figure 6—figure supplement 2
Pathway enrichment analyses of bulk RNA sequencing results indicating significantly altered genes following SFN treatments in tissues of WT DIO and NRF2 KO DIO mice.
Dot plots of KEGG Enrichment Pathway analyses of RNA sequencing results indicating significantly up regulated genes following SFN treatments in skeletal muscle of WT DIO and NRF2 KO DIO mice. Pathways enriched in each analysis listed in Y axis. Gene Ratio represents the ratio of differentially expressed genes to all genes for each GO term. Size of dot represents number of significantly altered genes in each condition. Color of dot represents the adjusted p values (purple represents 1 and red represent 0), (Supplementary file 4).
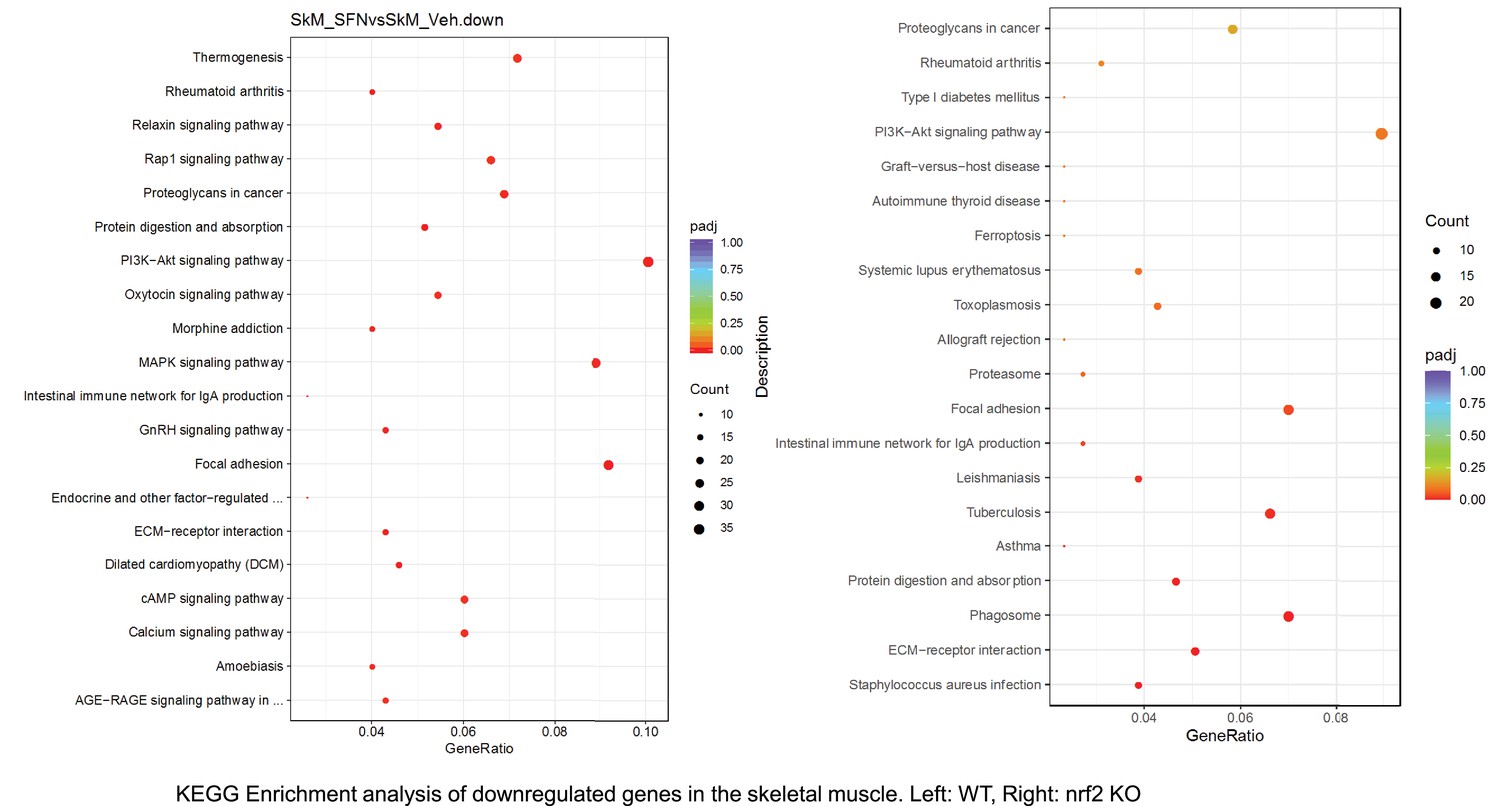
Figure 6—figure supplement 3
Pathway enrichment analyses of bulk RNA sequencing results indicating significantly altered genes following SFN treatments in tissues of WT DIO and NRF2 KO DIO mice.
. Dot plots of KEGG, Enrichment Pathway analyses of RNA sequencing results indicating significantly downregulated genes following SFN treatments in skeletal muscle of WT DIO and NRF2 KO DIO mice. Pathways enriched in each analysis listed in Y axis. Gene Ratio represents the ratio of differentially expressed genes to all genes for each GO term. Size of dot represents number of significantly altered genes in each condition. Color of dot represents the adjusted p values (purple represents 1 and red represent 0), (Supplementary file 4).
Figure 6—figure supplement 4
Pathway enrichment analyses of bulk RNA sequencing results indicating significantly altered genes following SFN treatments in tissues of WT DIO and NRF2 KO DIO mice.
Dot plots of Reactome Enrichment Pathway analyses of RNA sequencing results indicating significantly up regulated genes following SFN treatments in skeletal muscle of WT DIO and NRF2 KO DIO mice. Pathways enriched in each analysis listed in Y axis. Gene Ratio represents the ratio of differentially expressed genes to all genes for each GO term. Size of dot represents number of significantly altered genes in each condition. Color of dot represents the adjusted p values (purple represents 1 and red represent 0), (Supplementary file 4).
Figure 6—figure supplement 5
Pathway enrichment analyses of bulk RNA sequencing results indicating significantly altered genes following SFN treatments in tissues of WT DIO and NRF2 KO DIO mice.
Dot plots of Reactome Enrichment Pathway analyses of RNA sequencing results indicating significantly downregulated genes following SFN treatments in skeletal muscle of WT DIO and NRF2 KO DIO mice. Pathways enriched in each analysis listed in Y axis. Gene Ratio represents the ratio of differentially expressed genes to all genes for each GO term. Size of dot represents number of significantly altered genes in each condition. Color of dot represents the adjusted p values (purple represents 1 and red represent 0), (Supplementary file 4).
Figure 6—figure supplement 6
Pathway enrichment analyses of bulk RNA sequencing results indicating significantly altered genes following SFN treatments in tissues of WT DIO and NRF2 KO DIO mice.
Dot plots of GO Enrichment Pathway analyses of RNA sequencing results indicating significantly up regulated genes following SFN treatments in skeletal muscle of WT DIO and NRF2 KO DIO mice. Pathways enriched in each analysis listed in Y axis. Gene Ratio represents the ratio of differentially expressed genes to all genes for each GO term. Size of dot represents number of significantly altered genes in each condition. Color of dot represents the adjusted p values (purple represents 1 and red represent 0), (Supplementary file 4).
Figure 6—figure supplement 7
Pathway enrichment analyses of bulk RNA sequencing results indicating significantly altered genes following SFN treatments in tissues of WT DIO and NRF2 KO DIO mice.
Dot plots of GO Enrichment Pathway analyses of RNA sequencing results indicating significantly downregulated genes following SFN treatments in skeletal muscle of WT DIO and NRF2 KO DIO mice. Pathways enriched in each analysis listed in Y axis. Gene Ratio represents the ratio of differentially expressed genes to all genes for each GO term. Size of dot represents number of significantly altered genes in each condition. Color of dot represents the adjusted p values (purple represents 1 and red represent 0), (Supplementary file 4).
Figure 6—figure supplement 8
Pathway enrichment analyses of bulk RNA sequencing results indicating significantly altered genes following SFN treatments in tissues of WT DIO and NRF2 KO DIO mice.
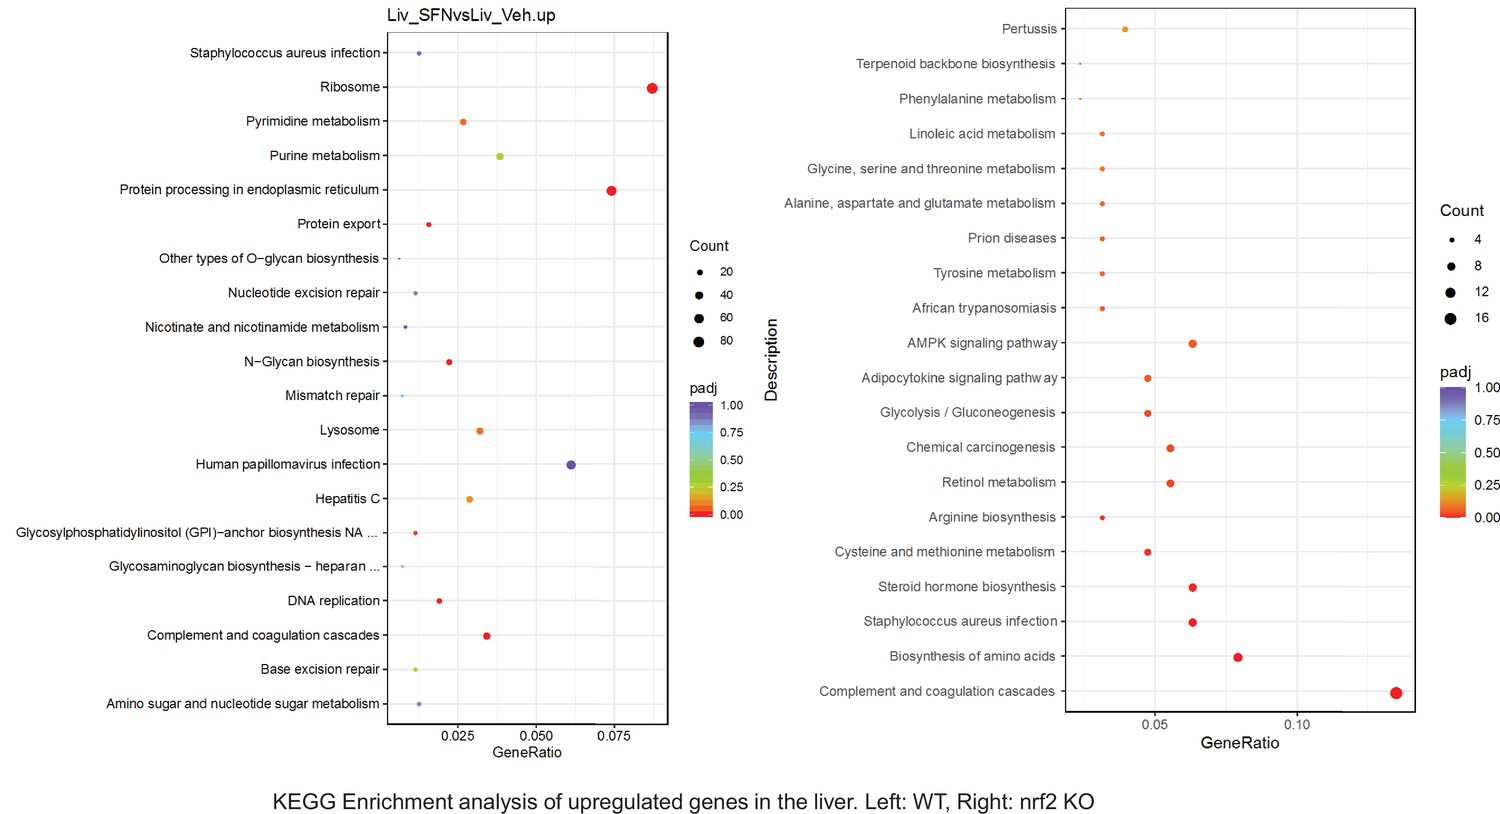
Dot plots of KEGG Enrichment Pathway analyses of RNA sequencing results indicating significantly up regulated genes following SFN treatments in liver of WT DIO and NRF2 KO DIO mice. Pathways enriched in each analysis listed in Y axis. Gene Ratio represents the ratio of differentially expressed genes to all genes for each GO term. Size of dot represents number of significantly altered genes in each condition. Color of dot represents the adjusted p values (purple represents 1 and red represent 0), (Supplementary file 4).
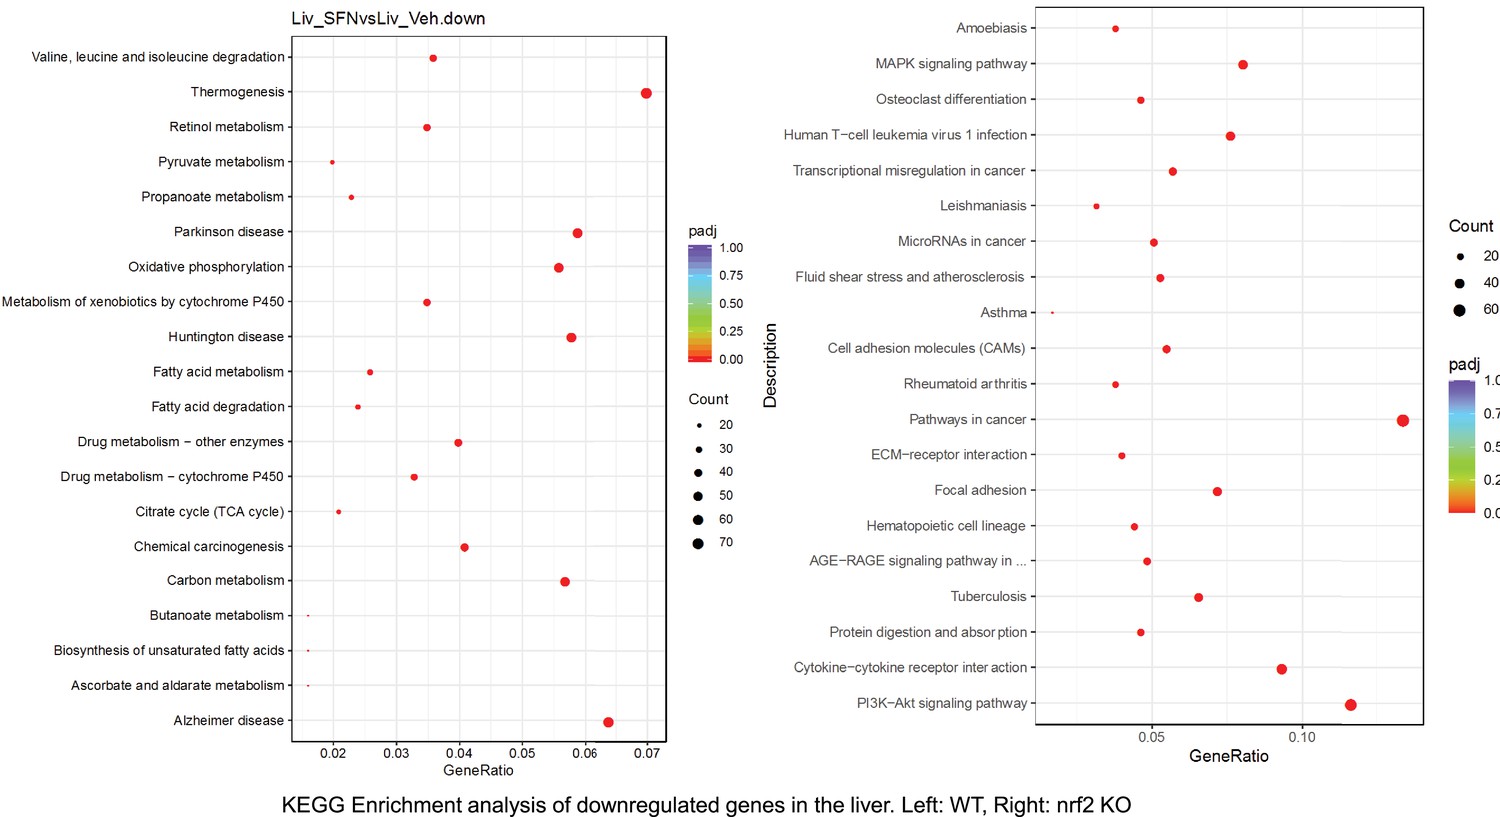
Figure 6—figure supplement 9
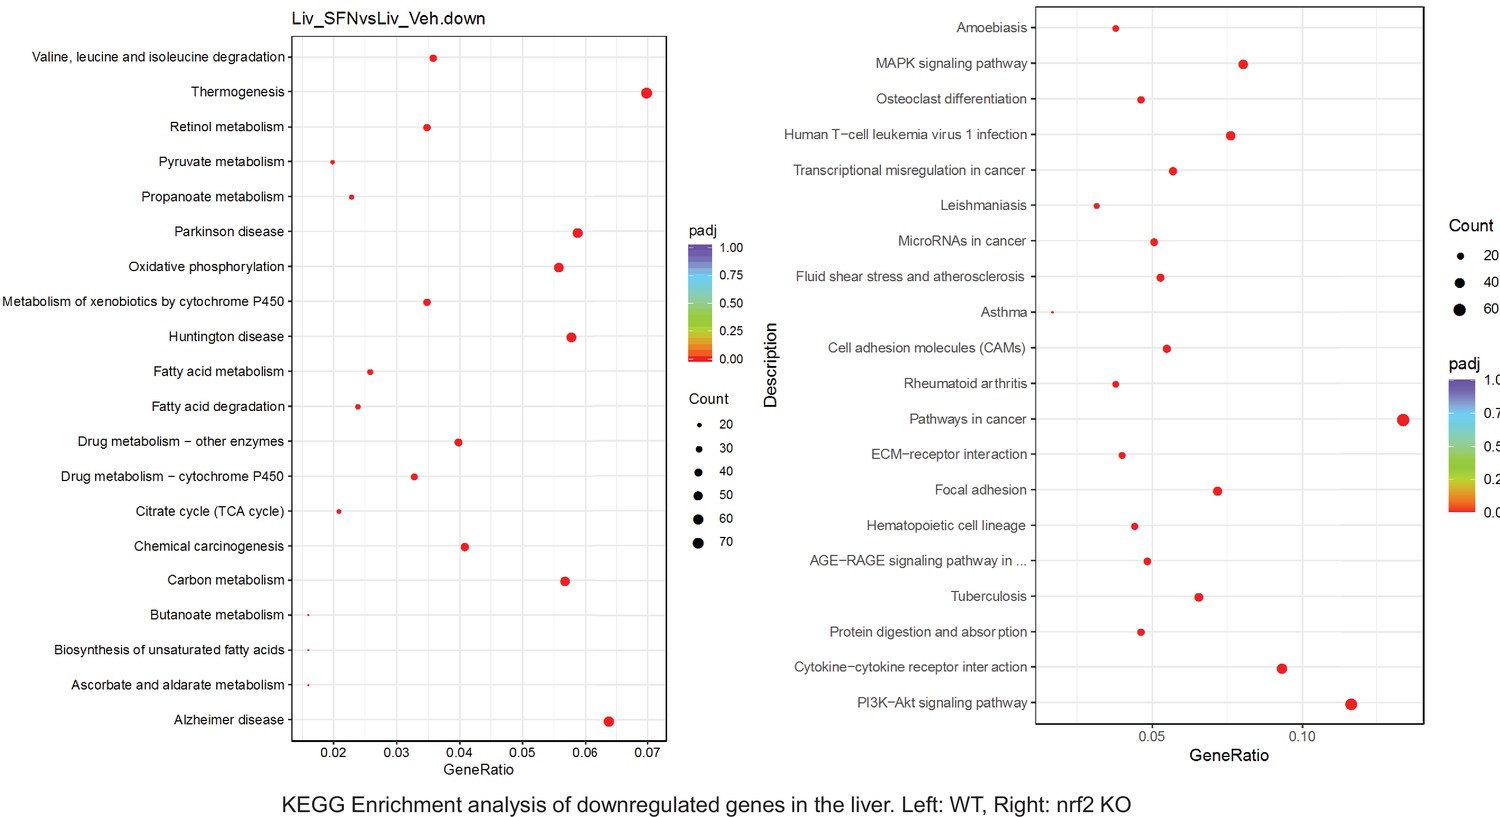
Pathway enrichment analyses of bulk RNA sequencing results indicating significantly altered genes following SFN treatments in tissues of WT DIO and NRF2 KO DIO mice.
Dot plots of KEGG, Enrichment Pathway analyses of RNA sequencing results indicating significantly downregulated genes following SFN treatments in liver of WT DIO and NRF2 KO DIO mice. Pathways enriched in each analysis listed in Y axis. Gene Ratio represents the ratio of differentially expressed genes to all genes for each GO term. Size of dot represents number of significantly altered genes in each condition. Color of dot represents the adjusted p values (purple represents 1 and red represent 0), (Supplementary file 4).
Figure 6—figure supplement 10
Pathway enrichment analyses of bulk RNA sequencing results indicating significantly altered genes following SFN treatments in tissues of WT DIO and NRF2 KO DIO mice.
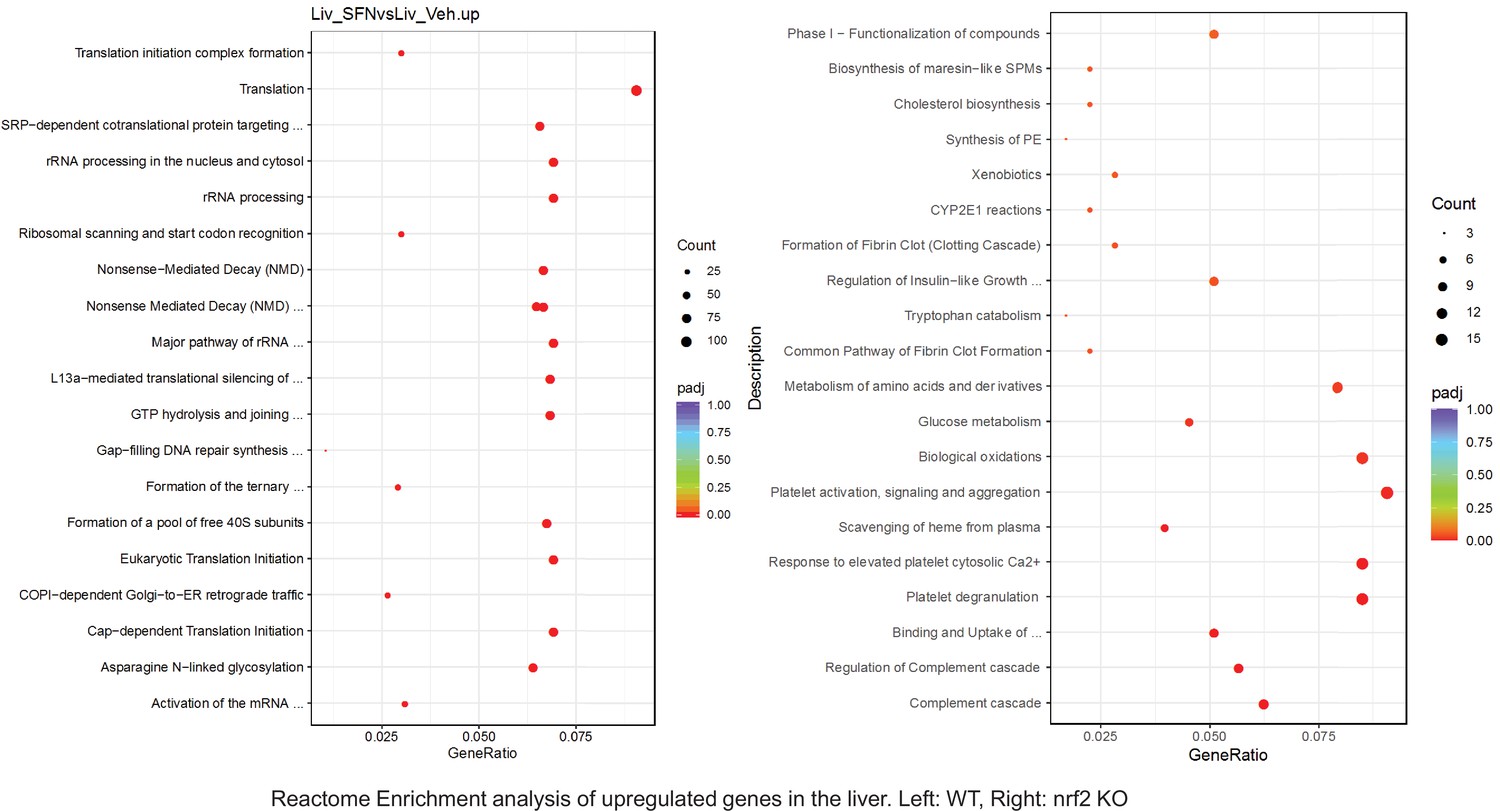
Dot plots of Reactome Enrichment Pathway analyses of RNA sequencing results indicating significantly up regulated genes following SFN treatments in liver of WT DIO and NRF2 KO DIO mice. Pathways enriched in each analysis listed in Y axis. Gene Ratio represents the ratio of differentially expressed genes to all genes for each GO term. Size of dot represents number of significantly altered genes in each condition. Color of dot represents the adjusted p values (purple represents 1 and red represent 0), (Supplementary file 4).
Figure 6—figure supplement 11
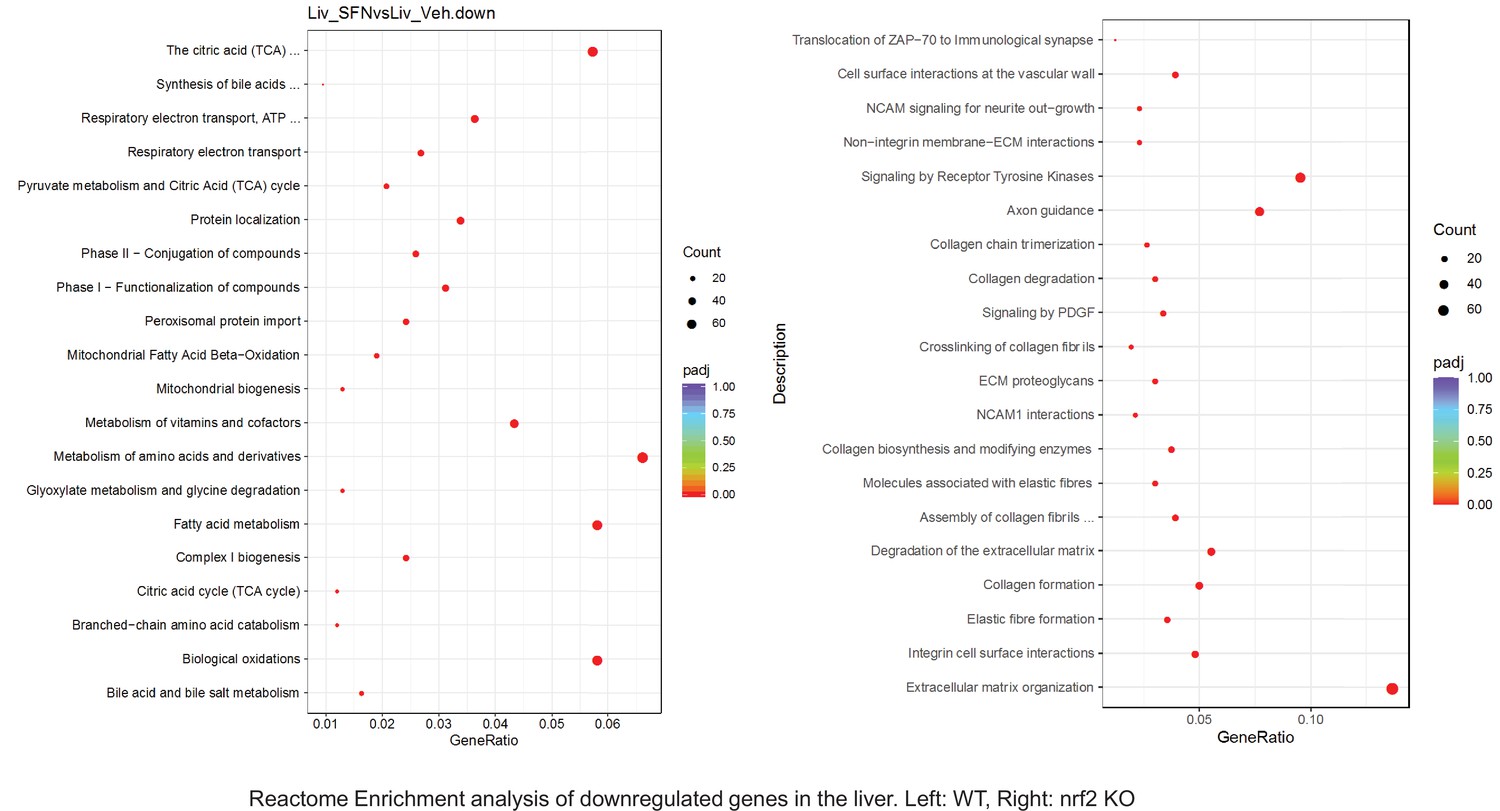
Pathway enrichment analyses of bulk RNA sequencing results indicating significantly altered genes following SFN treatments in tissues of WT DIO and NRF2 KO DIO mice.
Dot plots of Reactome Enrichment Pathway analyses of RNA sequencing results indicating significantly downregulated genes following SFN treatments in liver of WT DIO and NRF2 KO DIO mice. Pathways enriched in each analysis listed in Y axis. Gene Ratio represents the ratio of differentially expressed genes to all genes for each GO term. Size of dot represents number of significantly altered genes in each condition. Color of dot represents the adjusted p values (purple represents 1 and red represent 0), (Supplementary file 4).
Figure 6—figure supplement 12
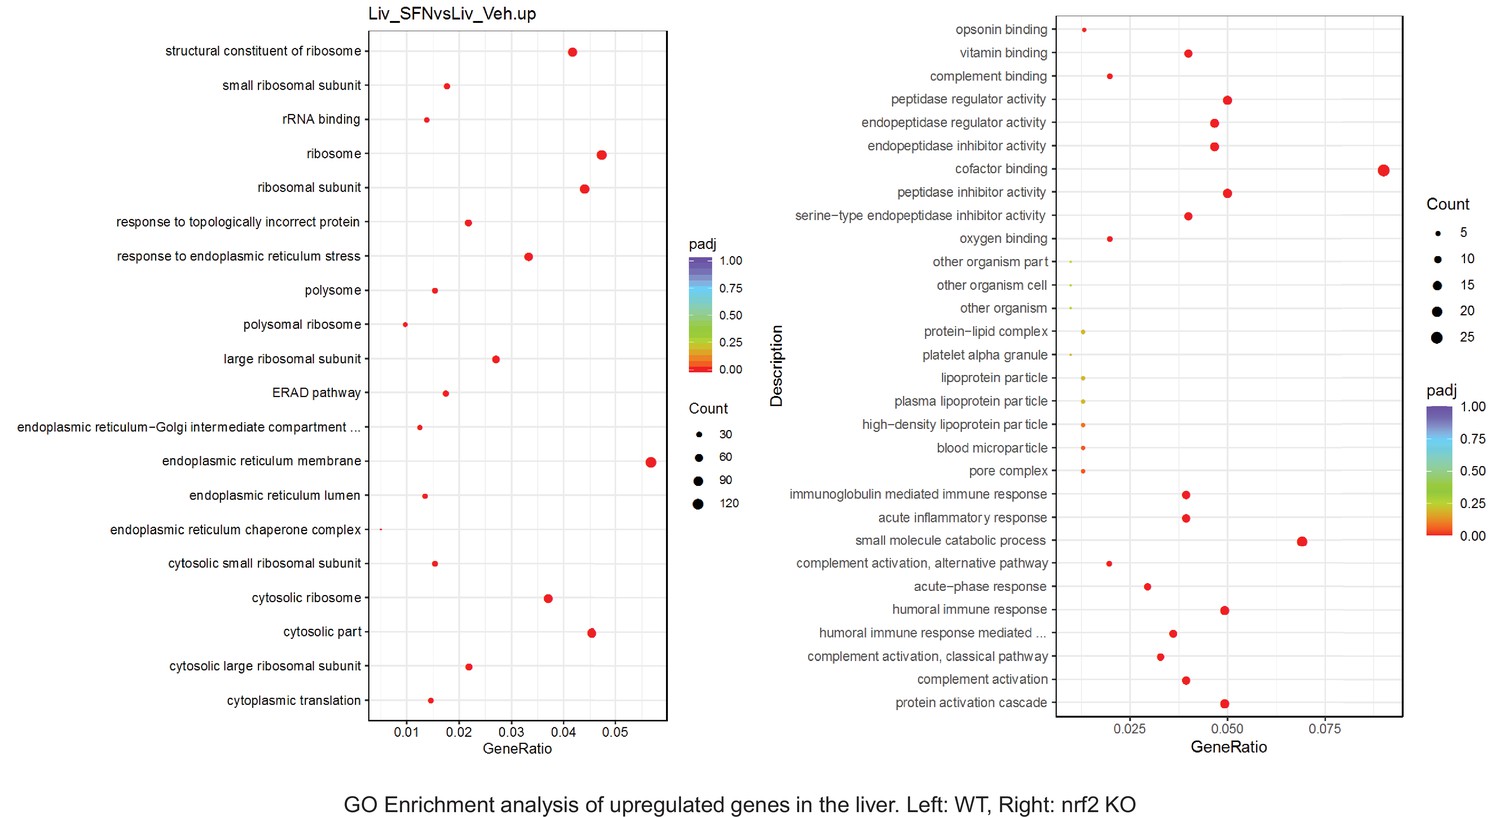
Pathway enrichment analyses of bulk RNA sequencing results indicating significantly altered genes following SFN treatments in tissues of WT DIO and NRF2 KO DIO mice.
Dot plots of GO Enrichment Pathway analyses of RNA sequencing results indicating significantly up regulated genes following SFN treatments in liver of WT DIO and NRF2 KO DIO mice. Pathways enriched in each analysis listed in Y axis. Gene Ratio represents the ratio of differentially expressed genes to all genes for each GO term. Size of dot represents number of significantly altered genes in each condition. Color of dot represents the adjusted p values (purple represents 1 and red represent 0), (Supplementary file 4).
Figure 6—figure supplement 13
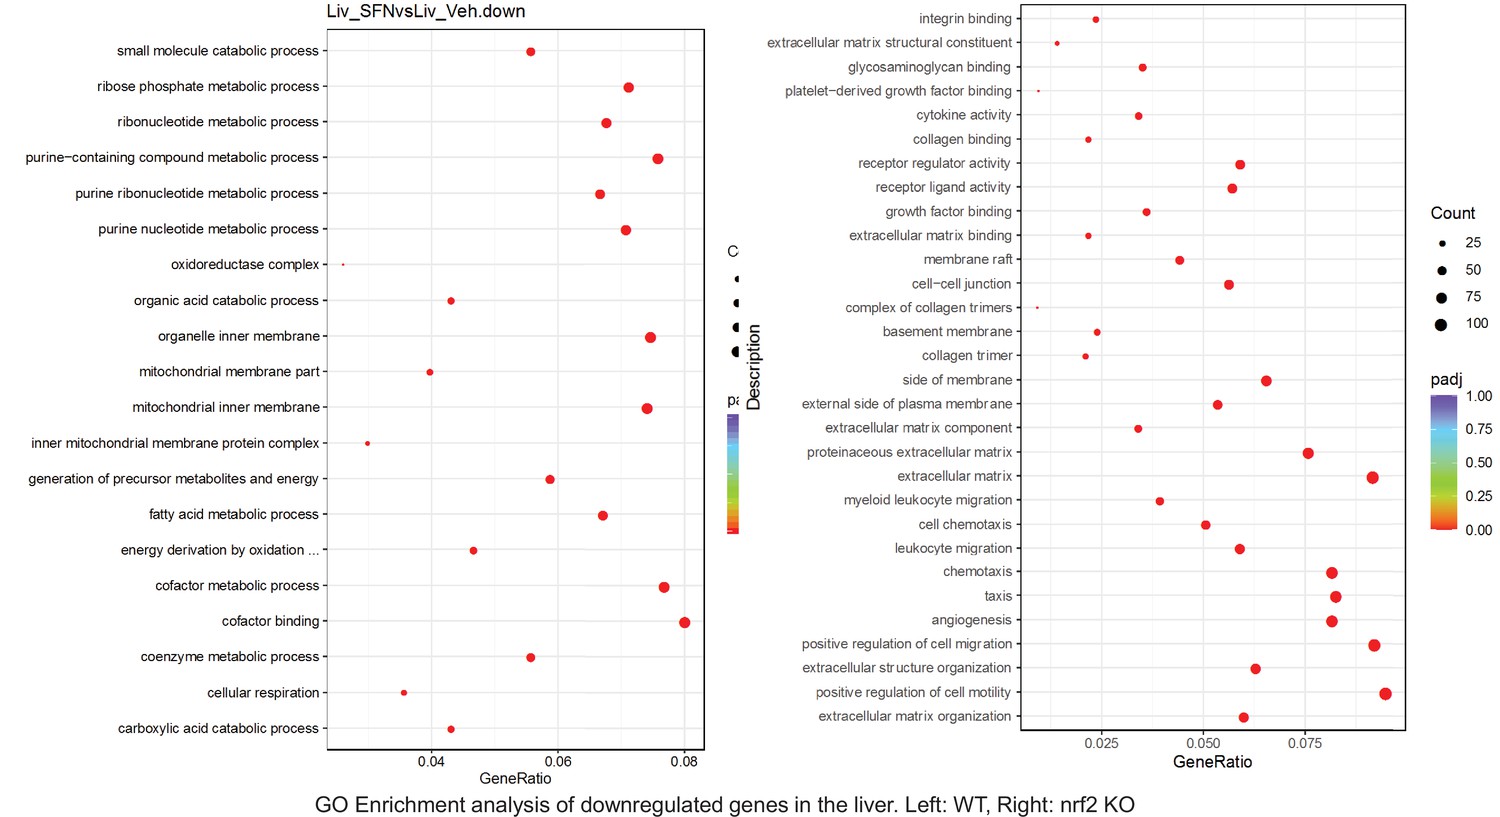
Pathway enrichment analyses of bulk RNA sequencing results indicating significantly altered genes following SFN treatments in tissues of WT DIO and NRF2 KO DIO mice.
Dot plots of GO Enrichment Pathway analyses of RNA sequencing results indicating significantly downregulated genes following SFN treatments in liver of WT DIO and NRF2 KO DIO mice. Pathways enriched in each analysis listed in Y axis. Gene Ratio represents the ratio of differentially expressed genes to all genes for each GO term. Size of dot represents number of significantly altered genes in each condition. Color of dot represents the adjusted p values (purple represents 1 and red represent 0), (Supplementary file 4).
Figure 6—figure supplement 14
Pathway enrichment analyses of bulk RNA sequencing results indicating significantly altered genes following SFN treatments in tissues of WT DIO and NRF2 KO DIO mice.
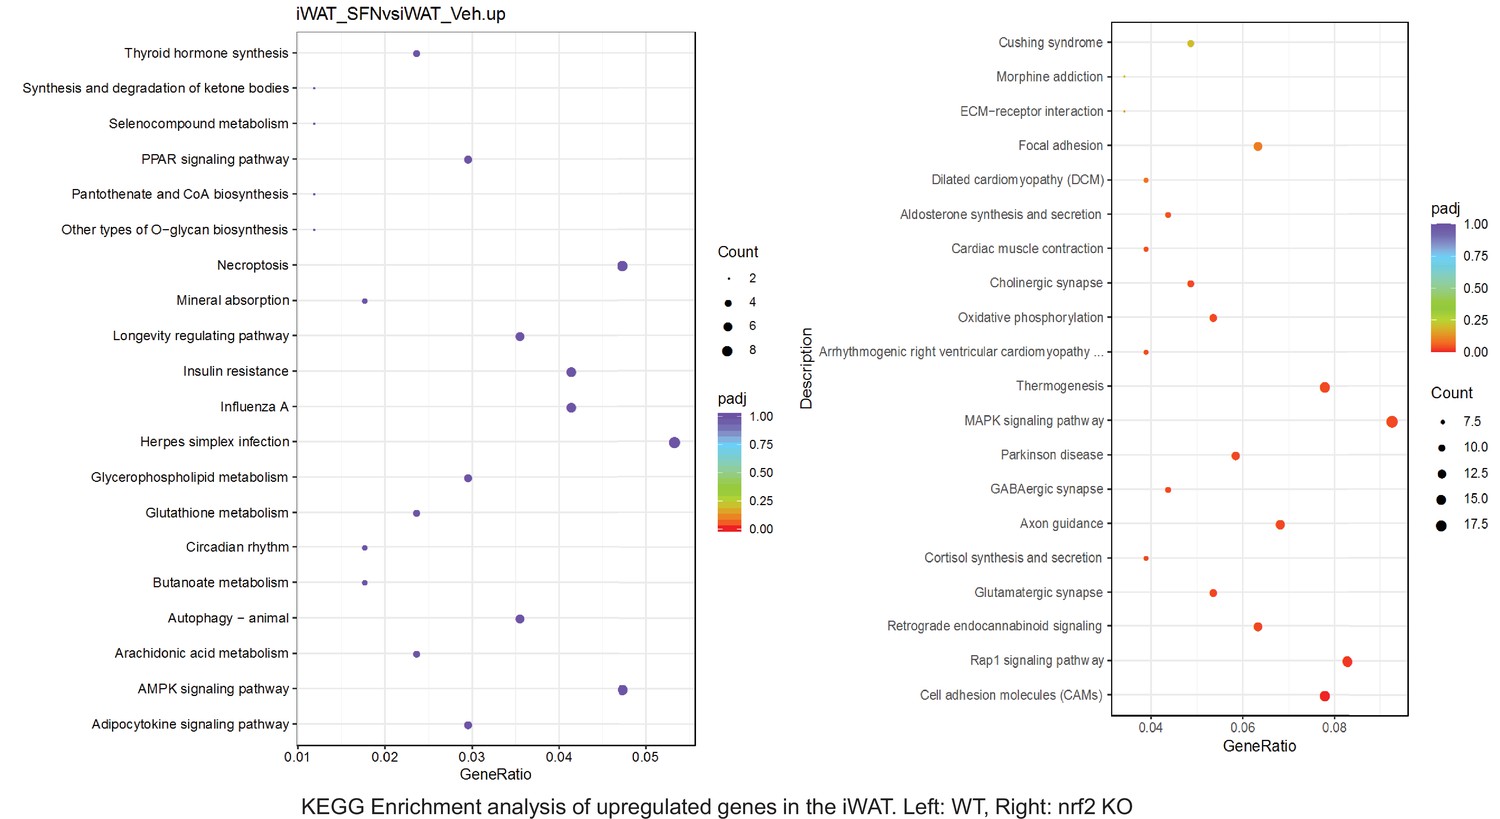
Dot plots of KEGG Enrichment Pathway analyses of RNA sequencing results indicating significantly up regulated genes following SFN treatments in inguinal white adipose tissue (iWAT) of WT DIO and NRF2 KO DIO mice. Pathways enriched in each analysis listed in Y axis. Gene Ratio represents the ratio of differentially expressed genes to all genes for each GO term. Size of dot represents number of significantly altered genes in each condition. Color of dot represents the adjusted p values (purple represents 1 and red represent 0), (Supplementary file 4).
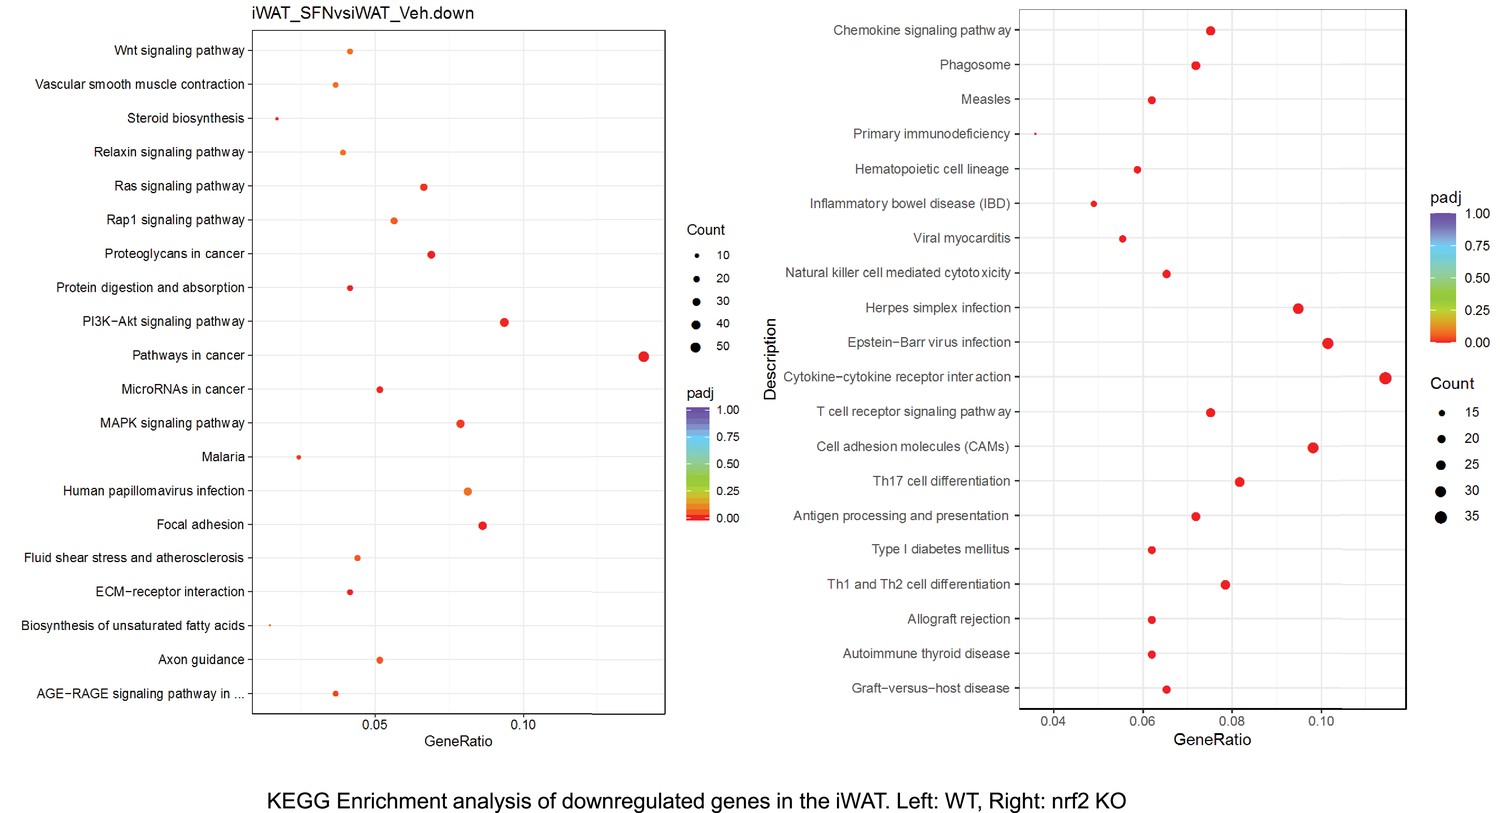
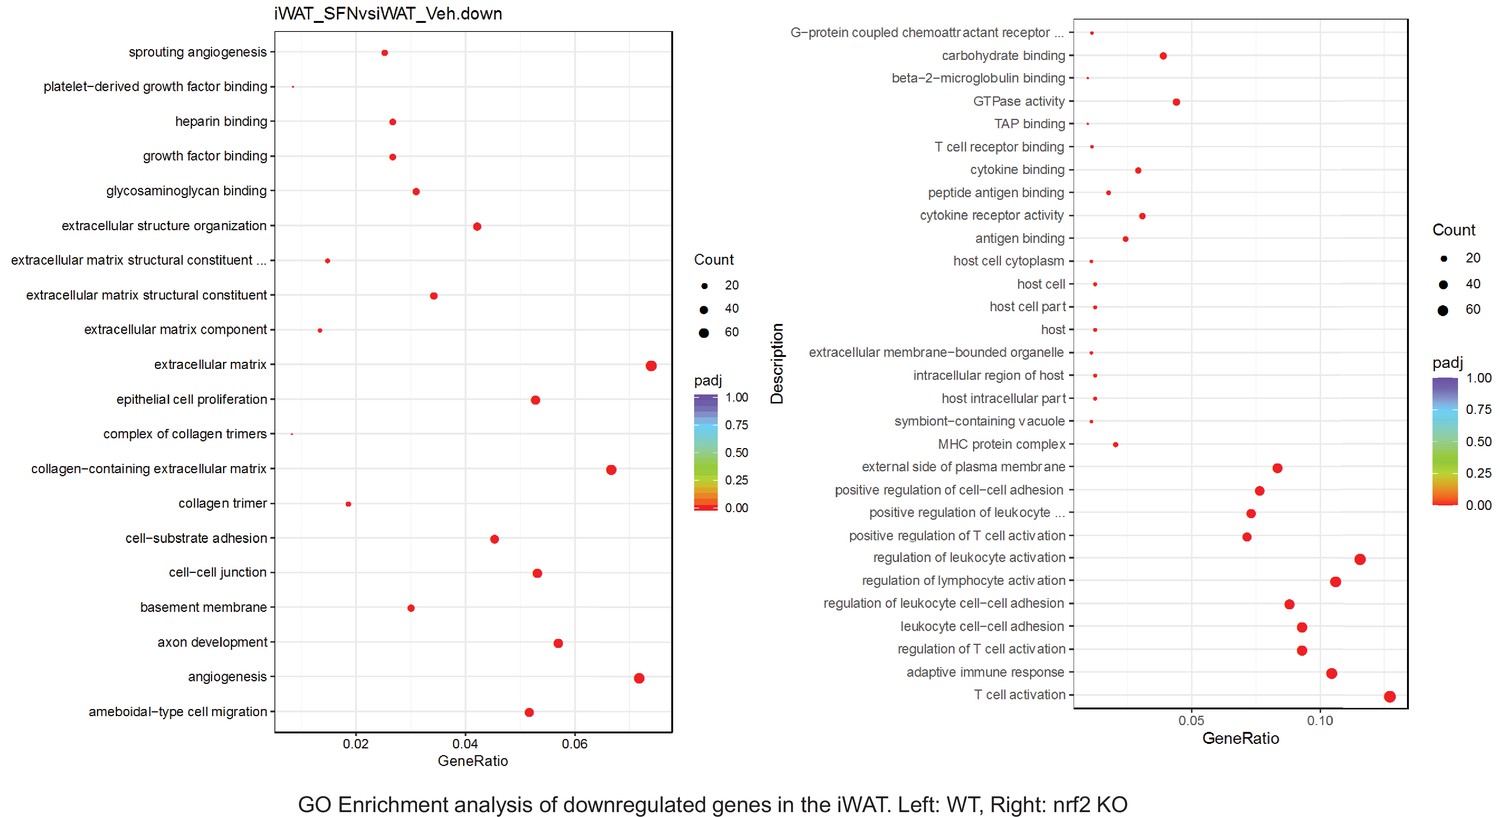
Figure 6—figure supplement 15
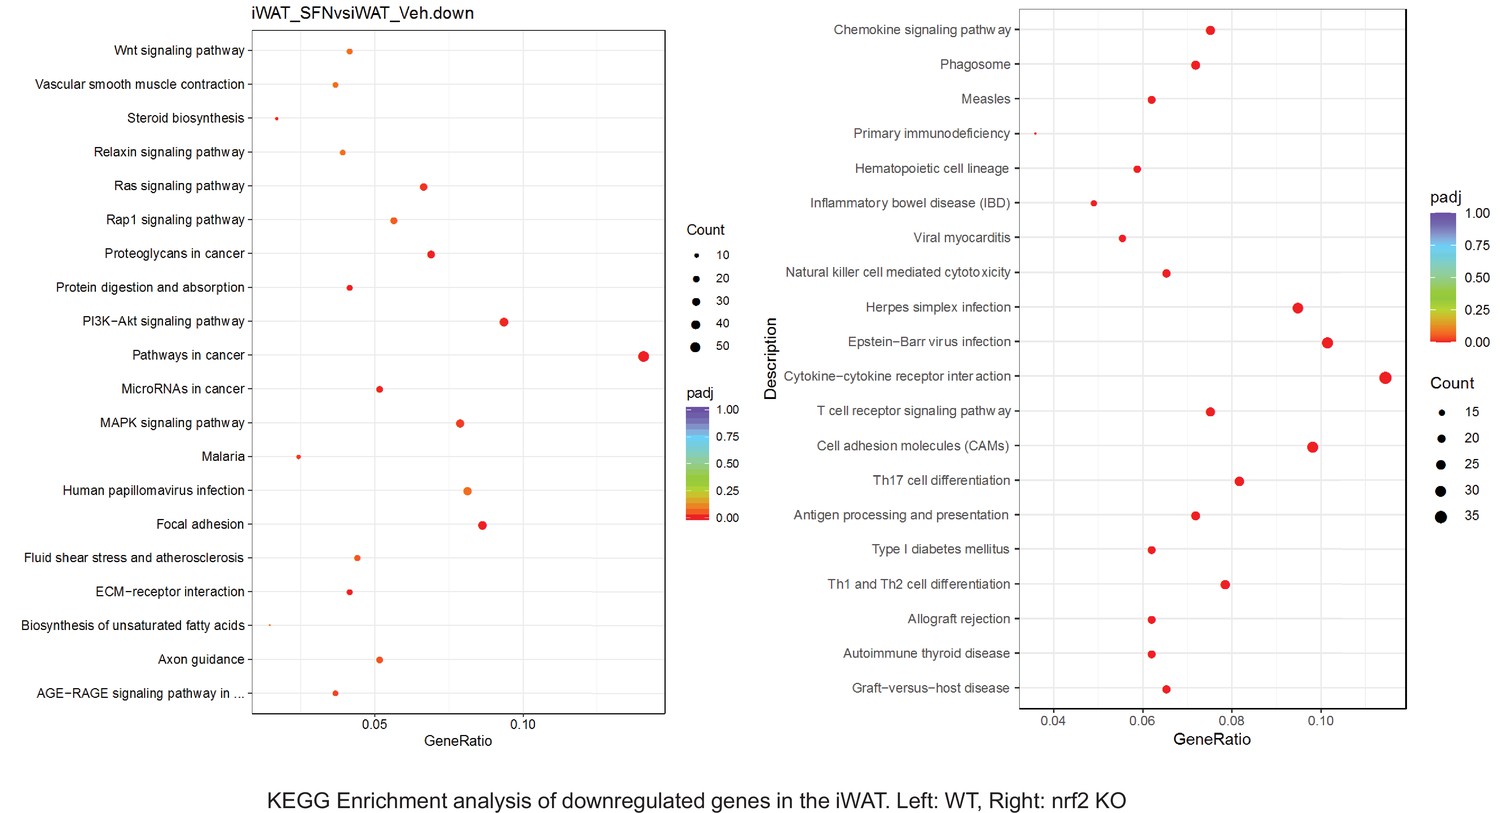
Pathway enrichment analyses of bulk RNA sequencing results indicating significantly altered genes following SFN treatments in tissues of WT DIO and NRF2 KO DIO mice.
Dot plots of KEGG, Enrichment Pathway analyses of RNA sequencing results indicating significantly downregulated genes following SFN treatments in inguinal white adipose tissue (iWAT) of WT DIO and NRF2 KO DIO mice. Pathways enriched in each analysis listed in Y axis. Gene Ratio represents the ratio of differentially expressed genes to all genes for each GO term. Size of dot represents number of significantly altered genes in each condition. Color of dot represents the adjusted p values (purple represents 1 and red represent 0), (Supplementary file 4).
Figure 6—figure supplement 16
Pathway enrichment analyses of bulk RNA sequencing results indicating significantly altered genes following SFN treatments in tissues of WT DIO and NRF2 KO DIO mice.
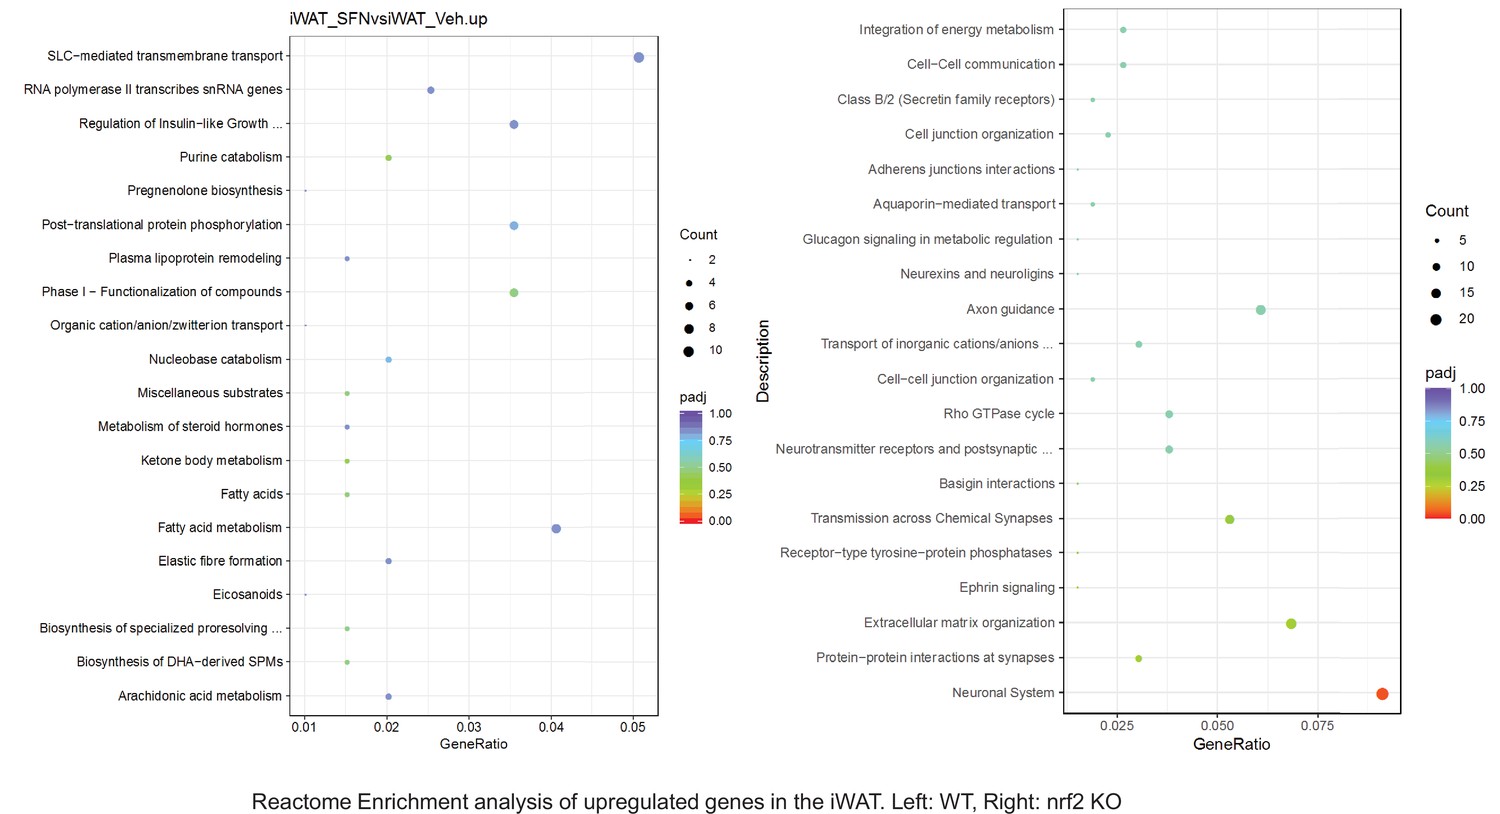
Dot plots of Reactome Enrichment Pathway analyses of RNA sequencing results indicating significantly up regulated genes following SFN treatments in inguinal white adipose tissue (iWAT) of WT DIO and NRF2 KO DIO mice. Pathways enriched in each analysis listed in Y axis. Gene Ratio represents the ratio of differentially expressed genes to all genes for each GO term. Size of dot represents number of significantly altered genes in each condition. Color of dot represents the adjusted p values (purple represents 1 and red represent 0), (Supplementary file 4).
Figure 6—figure supplement 17
Pathway enrichment analyses of bulk RNA sequencing results indicating significantly altered genes following SFN treatments in tissues of WT DIO and NRF2 KO DIO mice.
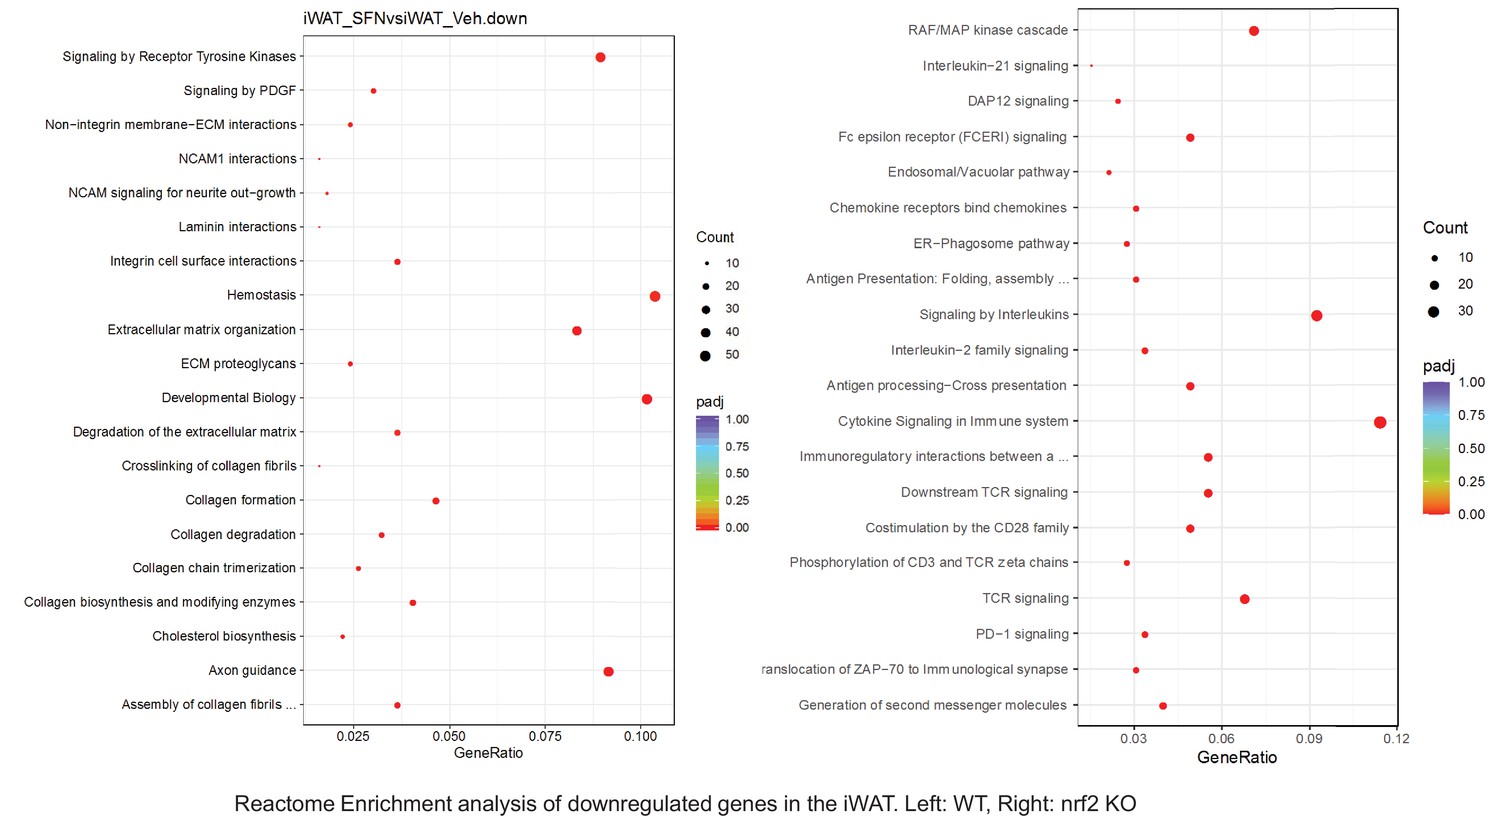
Dot plots of Reactome Enrichment Pathway analyses of RNA sequencing results indicating significantly downregulated genes following SFN treatments in inguinal white adipose tissue (iWAT) of WT DIO and NRF2 KO DIO mice. Pathways enriched in each analysis listed in Y axis. Gene Ratio represents the ratio of differentially expressed genes to all genes for each GO term. Size of dot represents number of significantly altered genes in each condition. Color of dot represents the adjusted p values (purple represents 1 and red represent 0), (Supplementary file 4).
Figure 6—figure supplement 18
Pathway enrichment analyses of bulk RNA sequencing results indicating significantly altered genes following SFN treatments in tissues of WT DIO and NRF2 KO DIO mice.
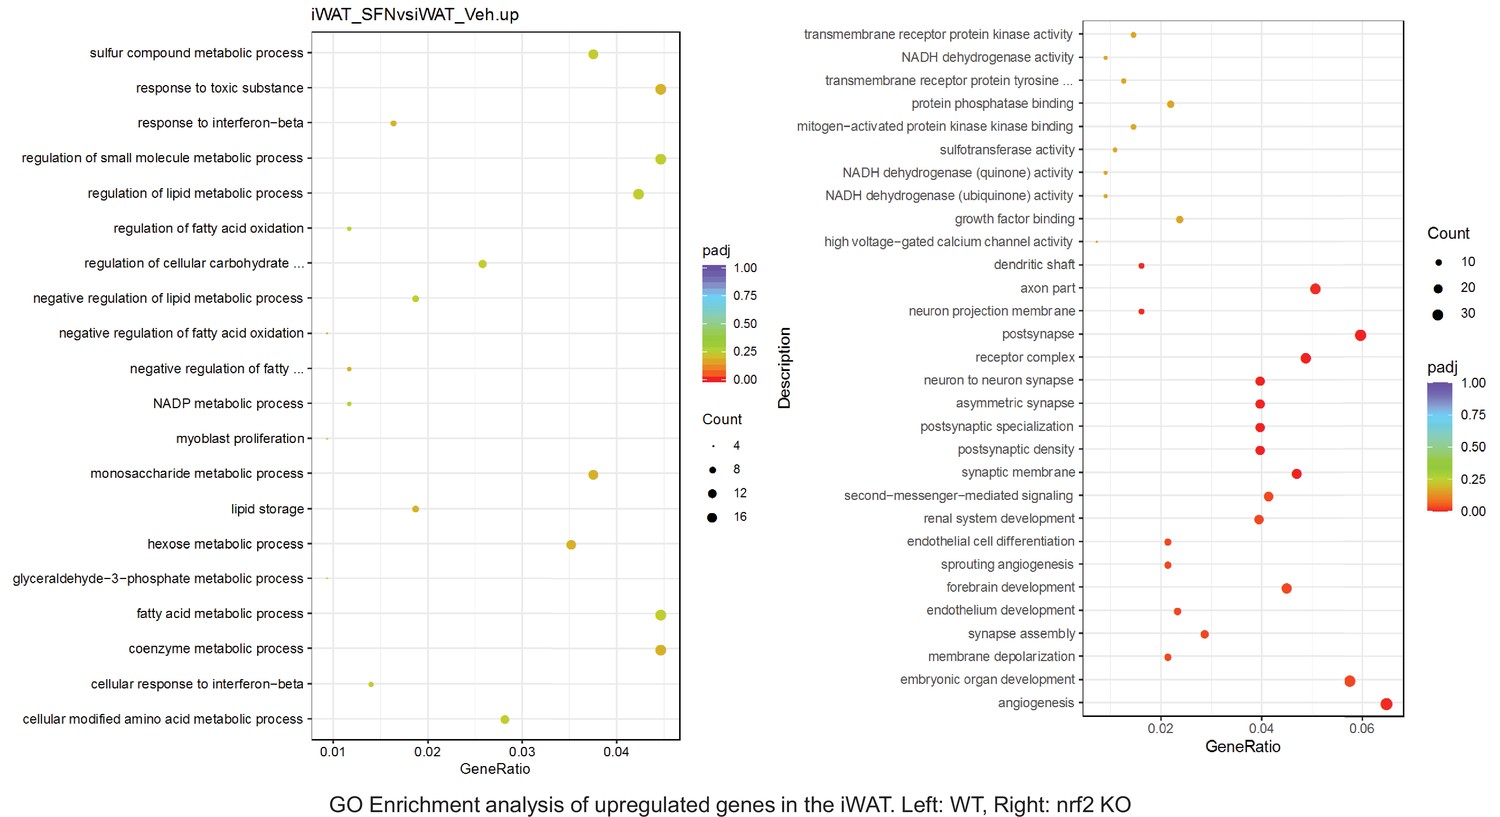
Dot plots of GO Enrichment Pathway analyses of RNA sequencing results indicating significantly up regulated genes following SFN treatments in inguinal white adipose tissue (iWAT) of WT DIO and NRF2 KO DIO mice. Pathways enriched in each analysis listed in Y axis. Gene Ratio represents the ratio of differentially expressed genes to all genes for each GO term. Size of dot represents number of significantly altered genes in each condition. Color of dot represents the adjusted p values (purple represents 1 and red represent 0), (Supplementary file 4).
Figure 6—figure supplement 19
Pathway enrichment analyses of bulk RNA sequencing results indicating significantly altered genes following SFN treatments in tissues of WT DIO and NRF2 KO DIO mice.
Dot plots of GO Enrichment Pathway analyses of RNA sequencing results indicating significantly downregulated genes following SFN treatments in inguinal white adipose tissue (iWAT) of WT DIO and NRF2 KO DIO mice. Pathways enriched in each analysis listed in Y axis. Gene Ratio represents the ratio of differentially expressed genes to all genes for each GO term. Size of dot represents number of significantly altered genes in each condition. Color of dot represents the adjusted p values (purple represents 1 and red represent 0), (Supplementary file 4).
Figure 6—figure supplement 20
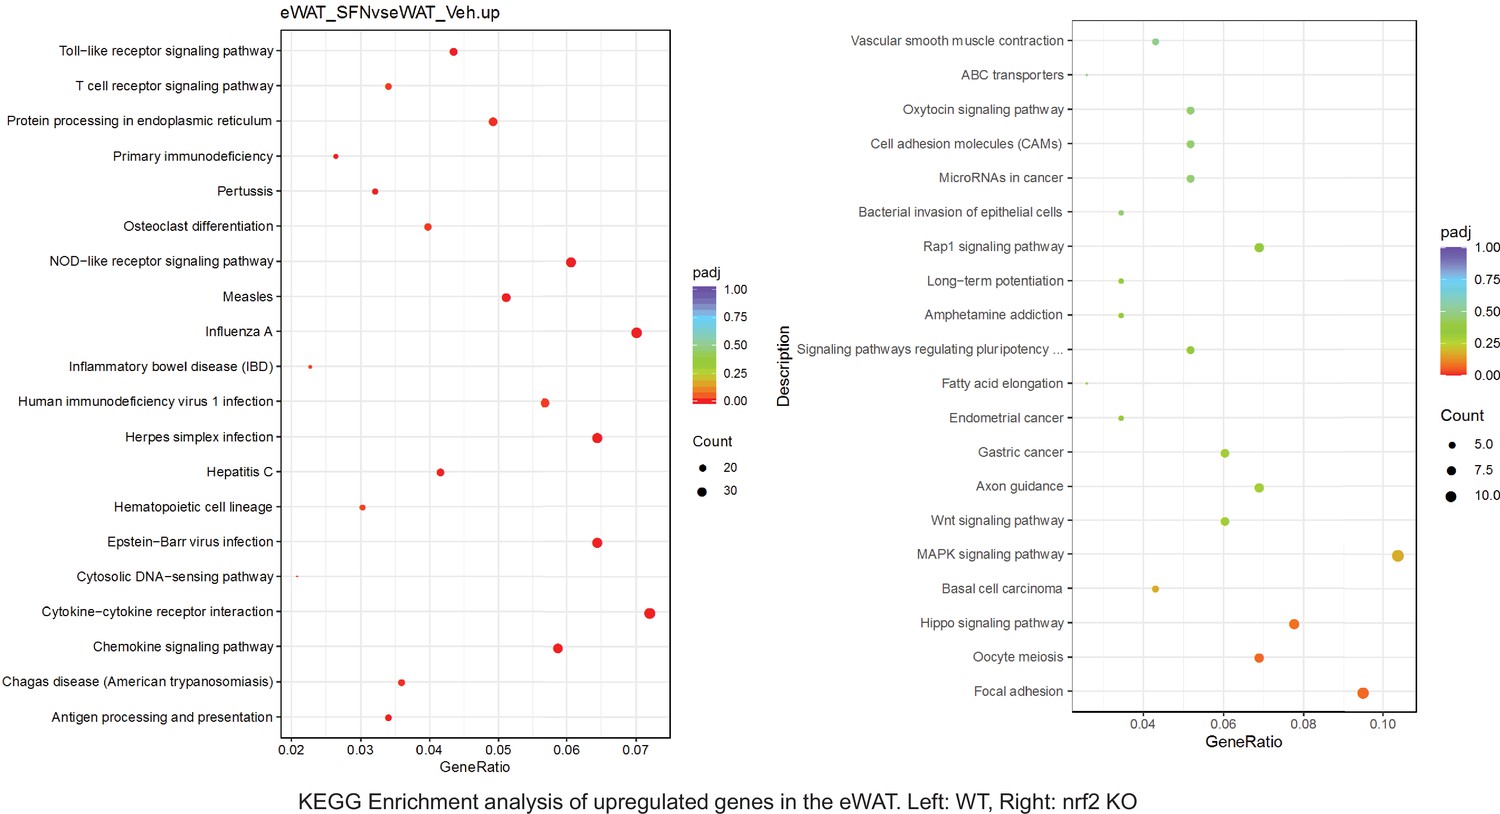
Pathway enrichment analyses of bulk RNA sequencing results indicating significantly altered genes following SFN treatments in tissues of WT DIO and NRF2 KO DIO mice.
Dot plots of KEGG Enrichment Pathway analyses of RNA sequencing results indicating significantly up regulated genes following SFN treatments in epididymal white adipose tissue (eWAT) of WT DIO and NRF2 KO DIO mice. Pathways enriched in each analysis listed in Y axis. Gene Ratio represents the ratio of differentially expressed genes to all genes for each GO term. Size of dot represents number of significantly altered genes in each condition. Color of dot represents the adjusted p values (purple represents 1 and red represent 0), (Supplementary file 4).
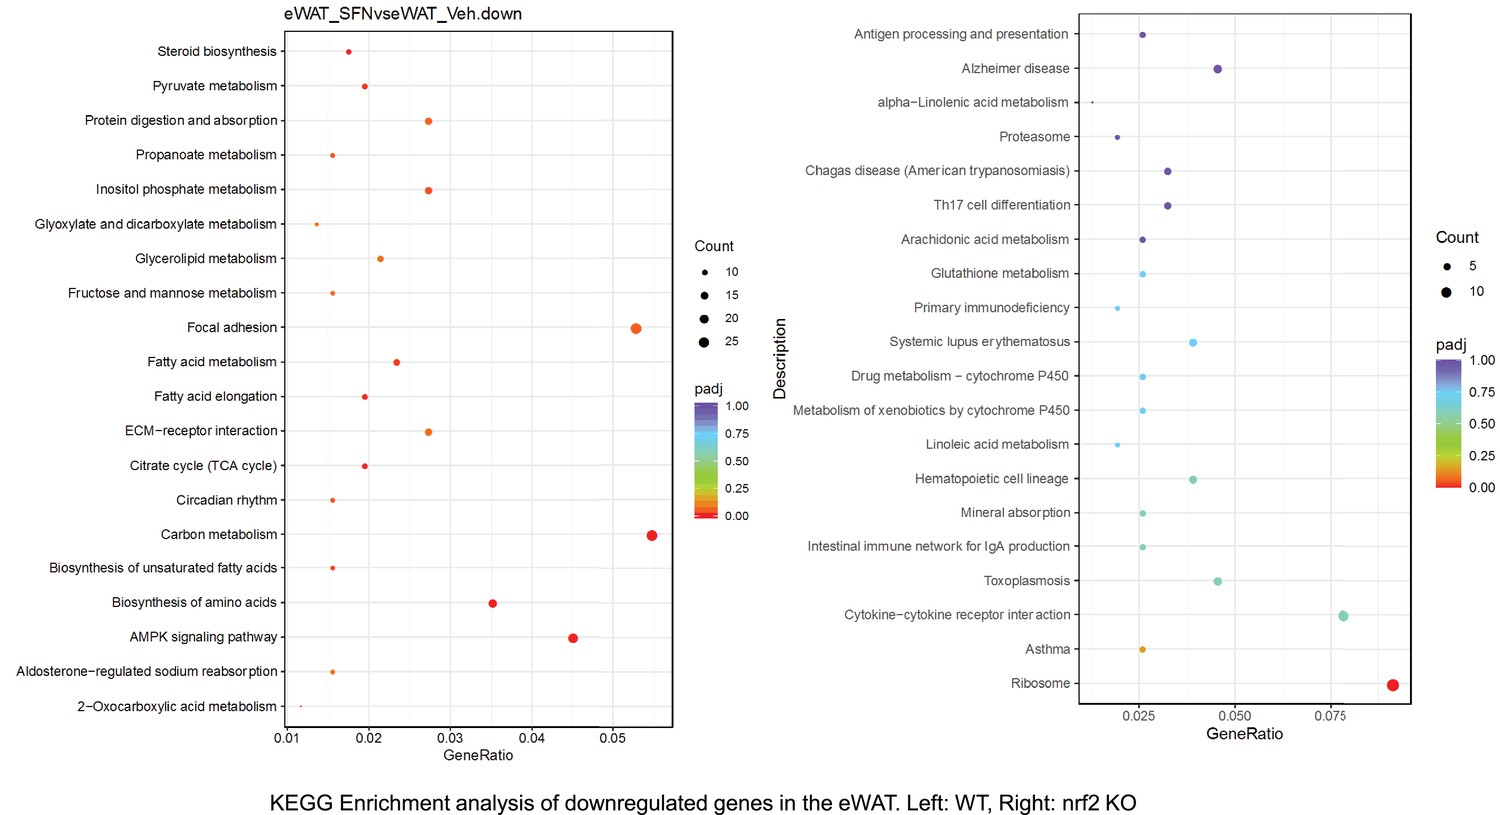
Figure 6—figure supplement 21
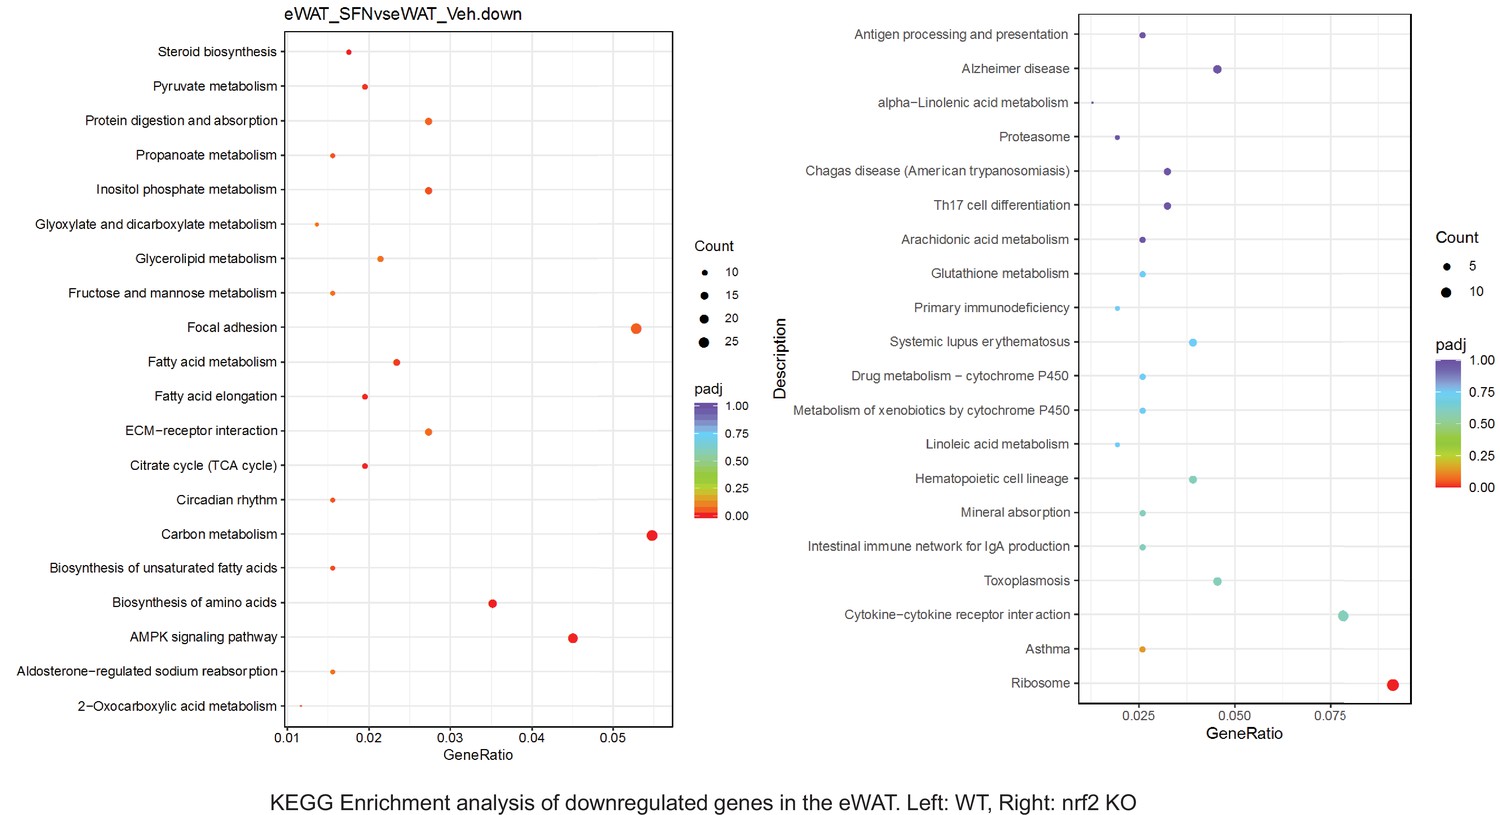
Pathway enrichment analyses of bulk RNA sequencing results indicating significantly altered genes following SFN treatments in tissues of WT DIO and NRF2 KO DIO mice.
Dot plots of KEGG, Enrichment Pathway analyses of RNA sequencing results indicating significantly downregulated genes following SFN treatments in epididymal white adipose tissue (eWAT) of WT DIO and NRF2 KO DIO mice. Pathways enriched in each analysis listed in Y axis. Gene Ratio represents the ratio of differentially expressed genes to all genes for each GO term. Size of dot represents number of significantly altered genes in each condition. Color of dot represents the adjusted p values (purple represents 1 and red represent 0), (Supplementary file 4).
Figure 6—figure supplement 22
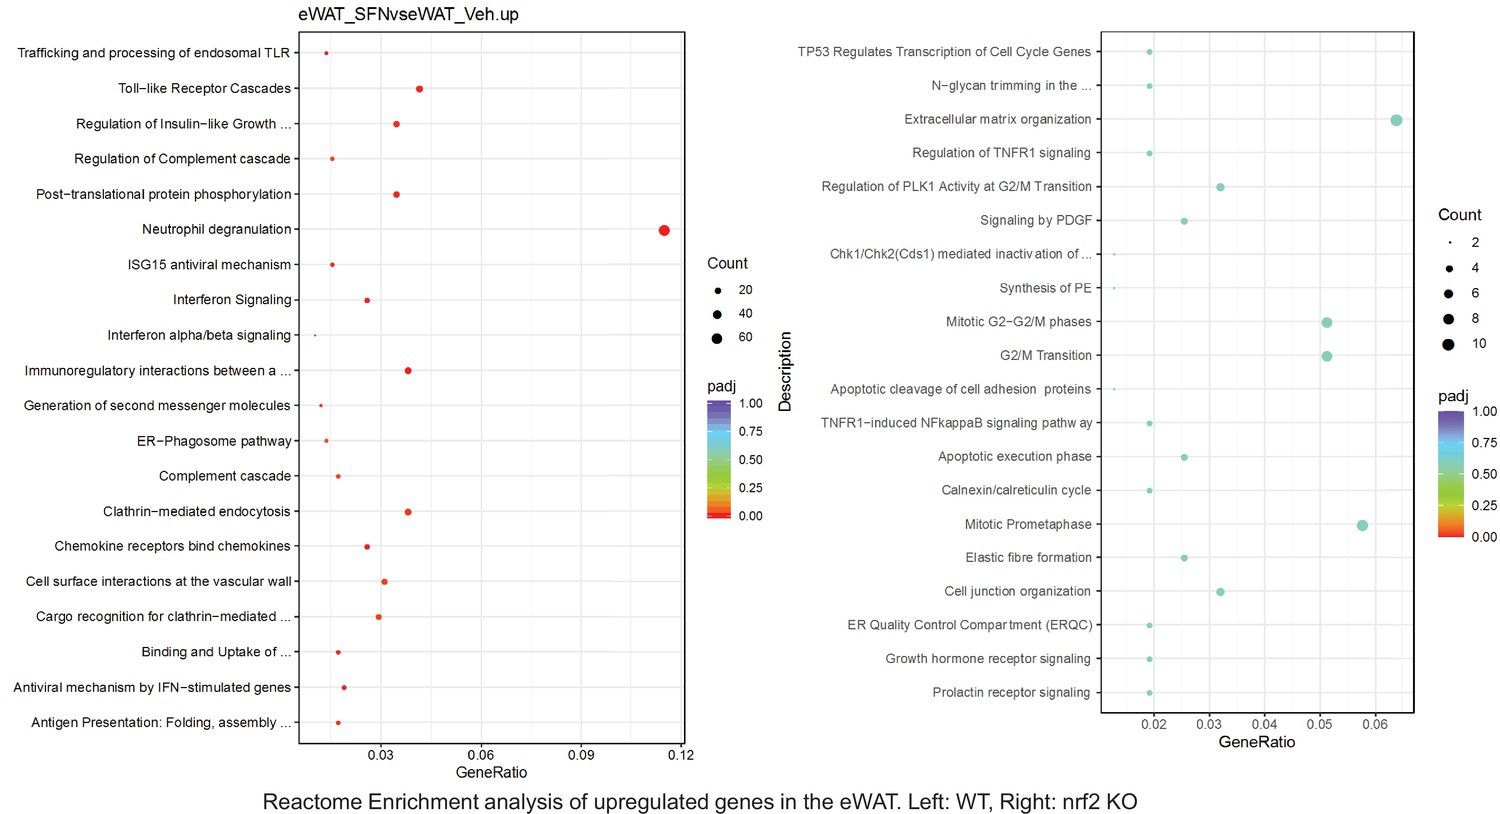
Pathway enrichment analyses of bulk RNA sequencing results indicating significantly altered genes following SFN treatments in tissues of WT DIO and NRF2 KO DIO mice.
Dot plots of Reactome Enrichment Pathway analyses of RNA sequencing results indicating significantly up regulated genes following SFN treatments in epididymal white adipose tissue (eWAT) of WT DIO and NRF2 KO DIO mice. Pathways enriched in each analysis listed in Y axis. Gene Ratio represents the ratio of differentially expressed genes to all genes for each GO term. Size of dot represents number of significantly altered genes in each condition. Color of dot represents the adjusted p values (purple represents 1 and red represent 0), (Supplementary file 4).
Figure 6—figure supplement 23
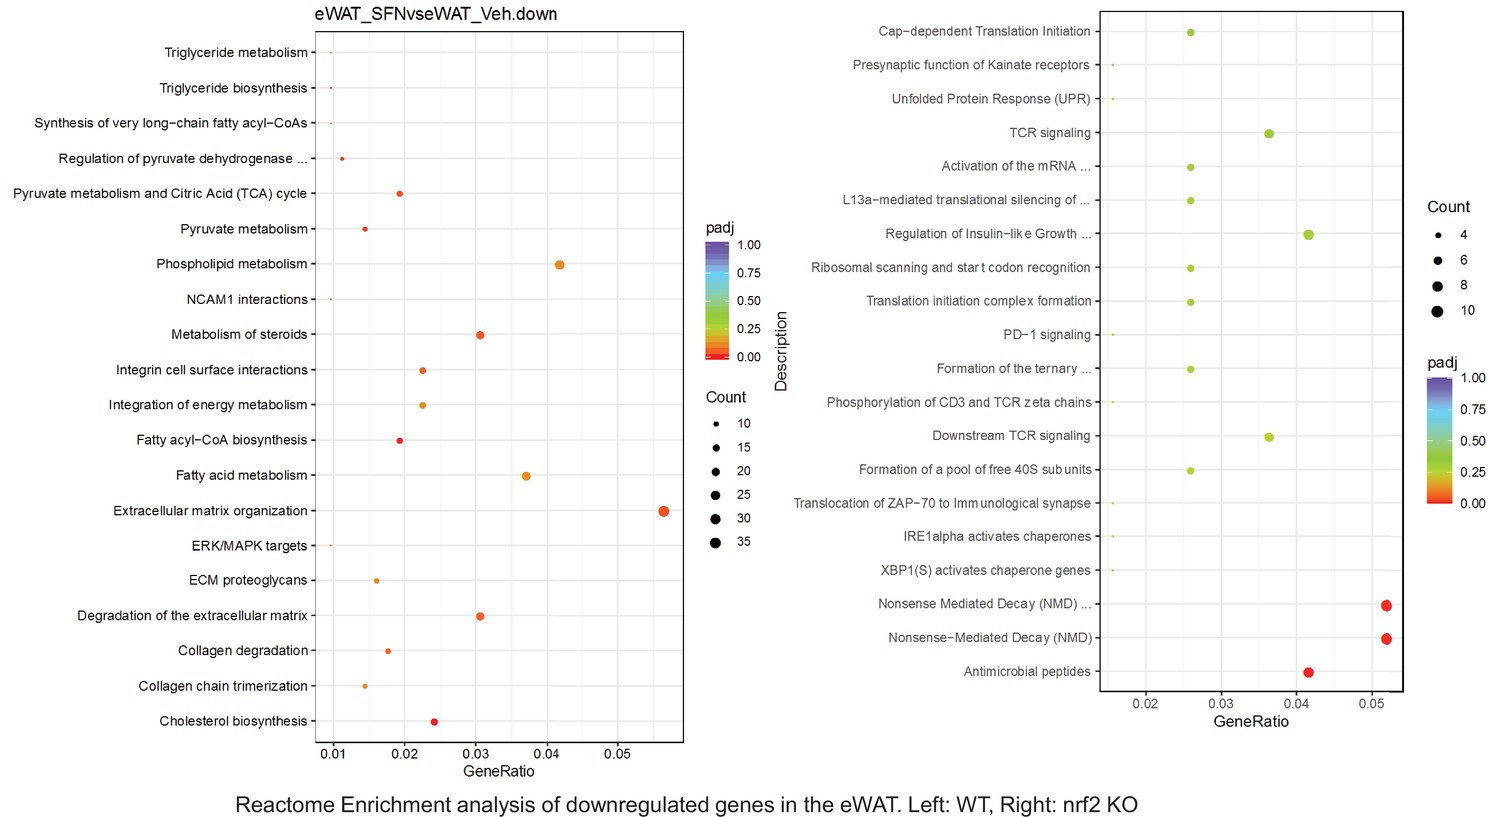
Pathway enrichment analyses of bulk RNA sequencing results indicating significantly altered genes following SFN treatments in tissues of WT DIO and NRF2 KO DIO mice.
Dot plots of Reactome Enrichment Pathway analyses of RNA sequencing results indicating significantly downregulated genes following SFN treatments in epididymal white adipose tissue (eWAT) of WT DIO and NRF2 KO DIO mice. Pathways enriched in each analysis listed in Y axis. Gene Ratio represents the ratio of differentially expressed genes to all genes for each GO term. Size of dot represents number of significantly altered genes in each condition. Color of dot represents the adjusted p values (purple represents 1 and red represent 0), (Supplementary file 4).
Figure 6—figure supplement 24
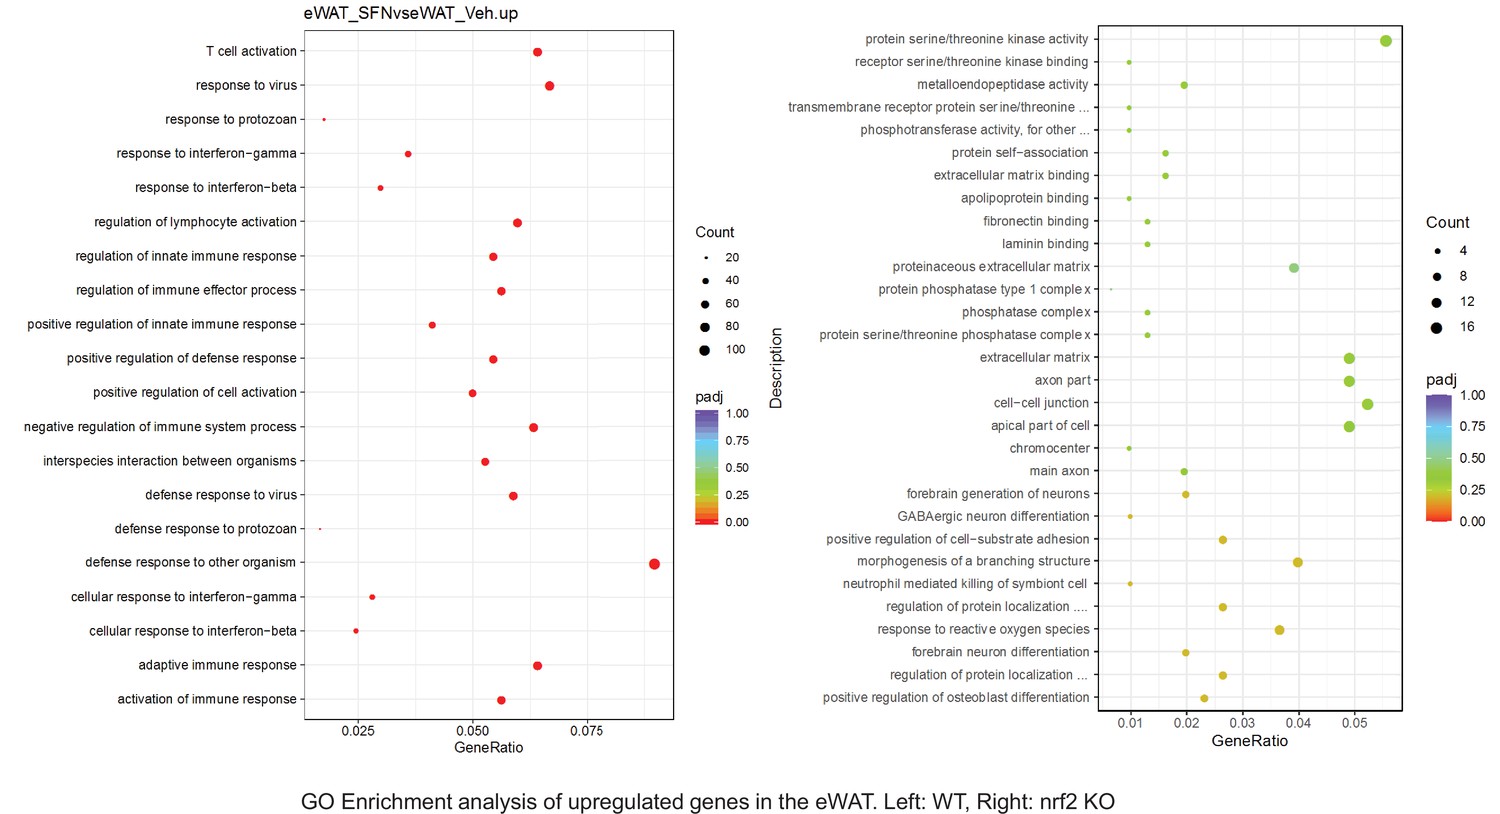
Pathway enrichment analyses of bulk RNA sequencing results indicating significantly altered genes following SFN treatments in tissues of WT DIO and NRF2 KO DIO mice.
Dot plots of GO Enrichment Pathway analyses of RNA sequencing results indicating significantly up regulated genes following SFN treatments in epididymal white adipose tissue (eWAT) of WT DIO and NRF2 KO DIO mice. Pathways enriched in each analysis listed in Y axis. Gene Ratio represents the ratio of differentially expressed genes to all genes for each GO term. Size of dot represents number of significantly altered genes in each condition. Color of dot represents the adjusted p values (purple represents 1 and red represent 0), (Supplementary file 4).
Figure 6—figure supplement 25
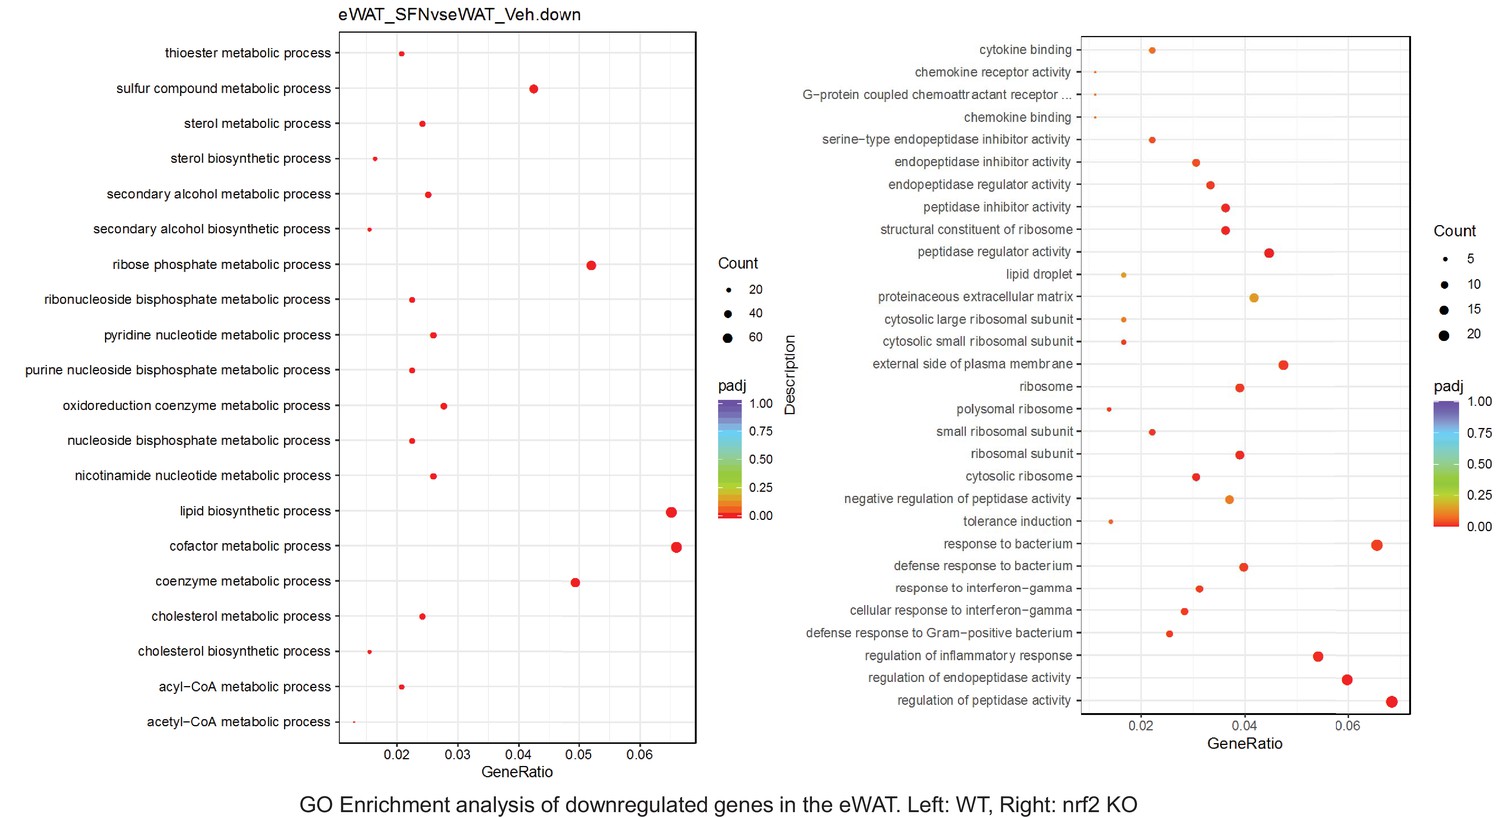
Pathway enrichment analyses of bulk RNA sequencing results indicating significantly altered genes following SFN treatments in tissues of WT DIO and NRF2 KO DIO mice.
Dot plots of GO Enrichment Pathway analyses of RNA sequencing results indicating significantly downregulated genes following SFN treatments in epididymal white adipose tissue (eWAT) of WT DIO and NRF2 KO DIO mice. Pathways enriched in each analysis listed in Y axis. Gene Ratio represents the ratio of differentially expressed genes to all genes for each GO term. Size of dot represents number of significantly altered genes in each condition. Color of dot represents the adjusted p values (purple represents 1 and red represent 0), (Supplementary file 4).
Figure 6—figure supplement 26
Pathway enrichment analyses of bulk RNA sequencing results indicating significantly altered genes following SFN treatments in tissues of WT DIO and NRF2 KO DIO mice.
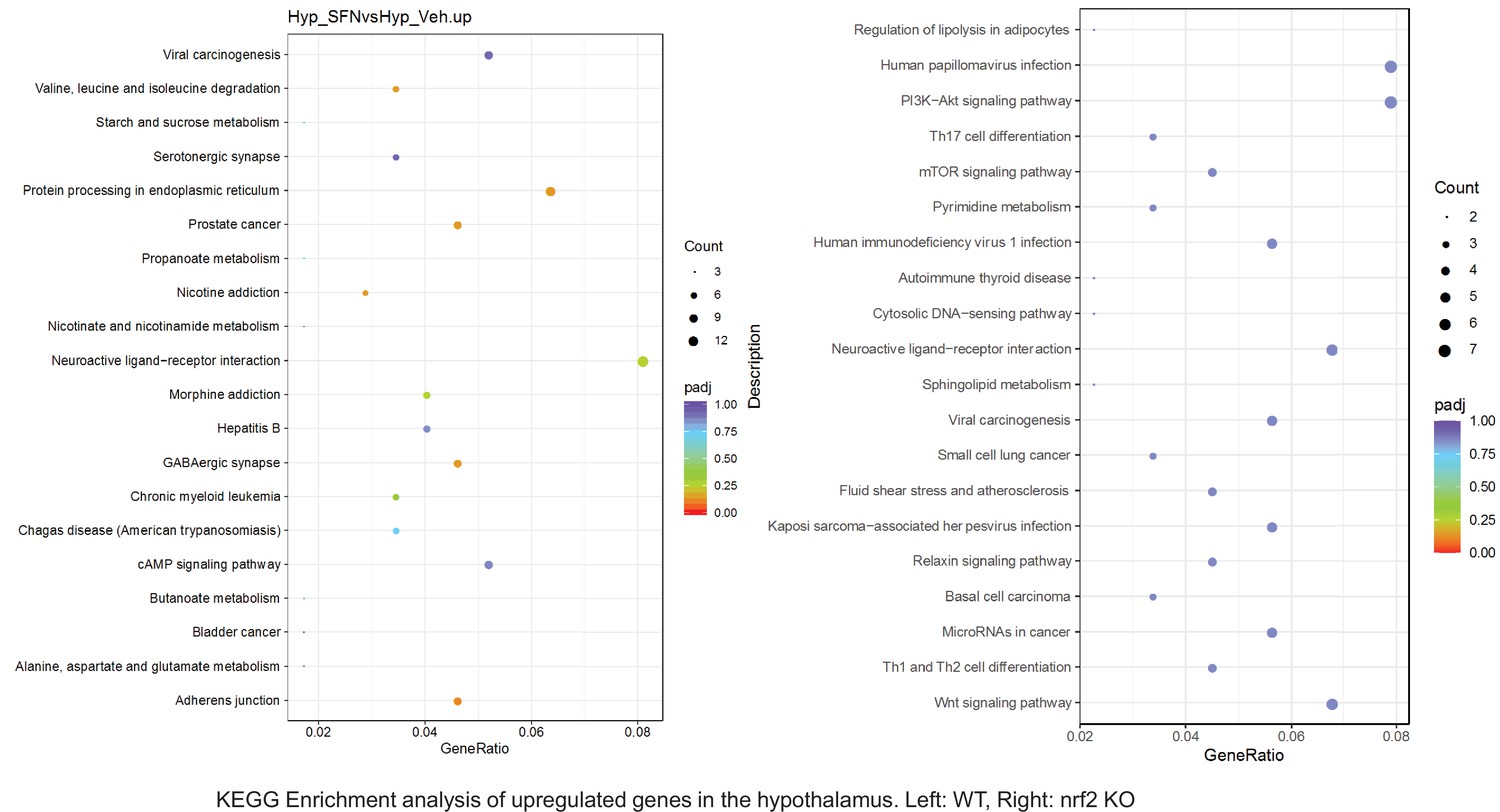
Dot plots of KEGG Enrichment Pathway analyses of RNA sequencing results indicating significantly up regulated genes following SFN treatments in hypothalamus of WT DIO and NRF2 KO DIO mice. Pathways enriched in each analysis listed in Y axis. Gene Ratio represents the ratio of differentially expressed genes to all genes for each GO term. Size of dot represents number of significantly altered genes in each condition. Color of dot represents the adjusted p values (purple represents 1 and red represent 0), (Supplementary file 4).
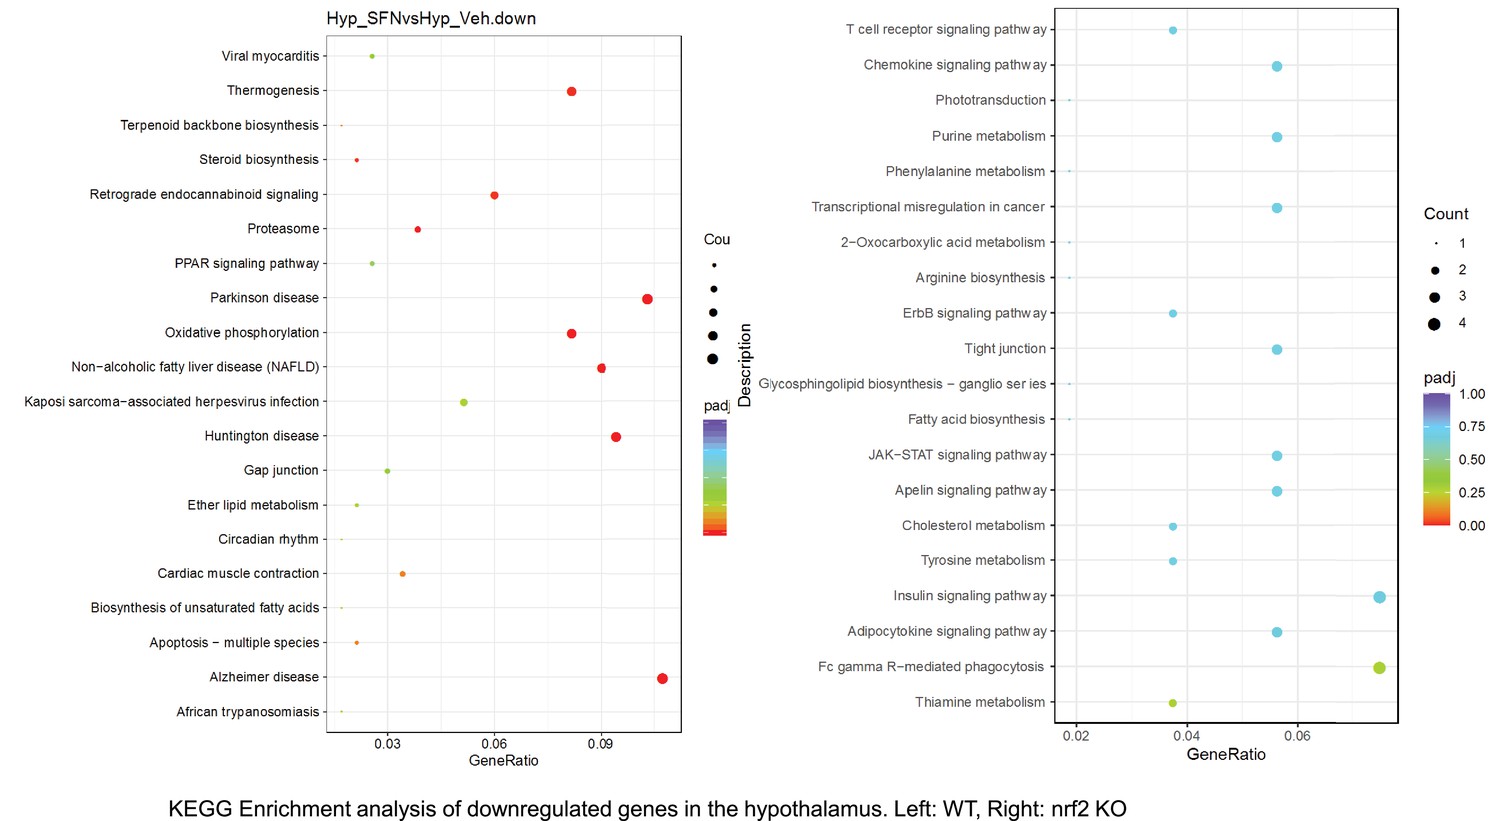
Figure 6—figure supplement 27
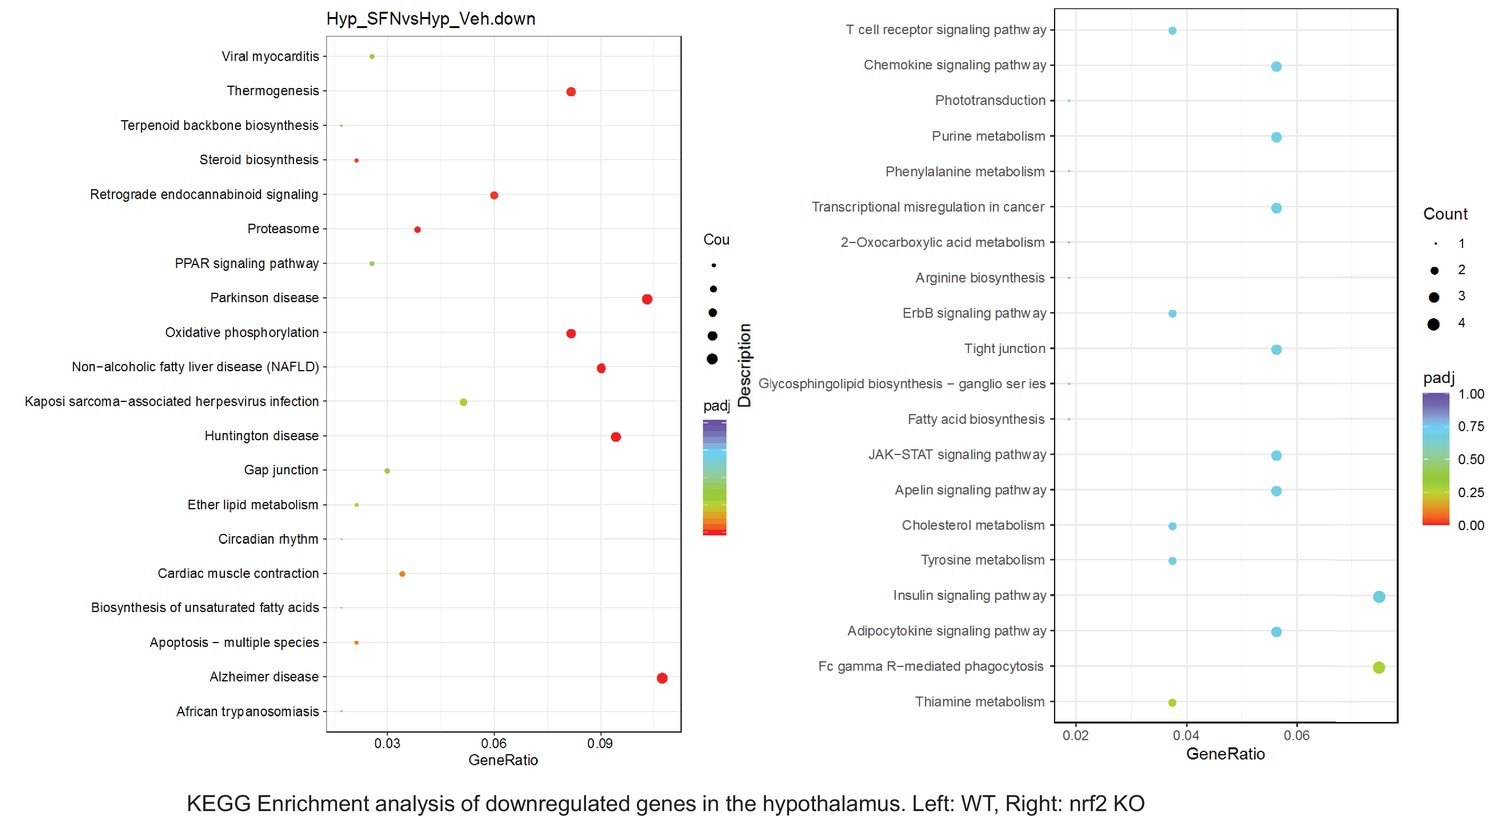
Pathway enrichment analyses of bulk RNA sequencing results indicating significantly altered genes following SFN treatments in tissues of WT DIO and NRF2 KO DIO mice.
Dot plots of KEGG, Enrichment Pathway analyses of RNA sequencing results indicating significantly downregulated genes following SFN treatments in hypothalamus of WT DIO and NRF2 KO DIO mice. Pathways enriched in each analysis listed in Y axis. Gene Ratio represents the ratio of differentially expressed genes to all genes for each GO term. Size of dot represents number of significantly altered genes in each condition. Color of dot represents the adjusted p values (purple represents 1 and red represent 0), (Supplementary file 4).
Figure 6—figure supplement 28
Pathway enrichment analyses of bulk RNA sequencing results indicating significantly altered genes following SFN treatments in tissues of WT DIO and NRF2 KO DIO mice.
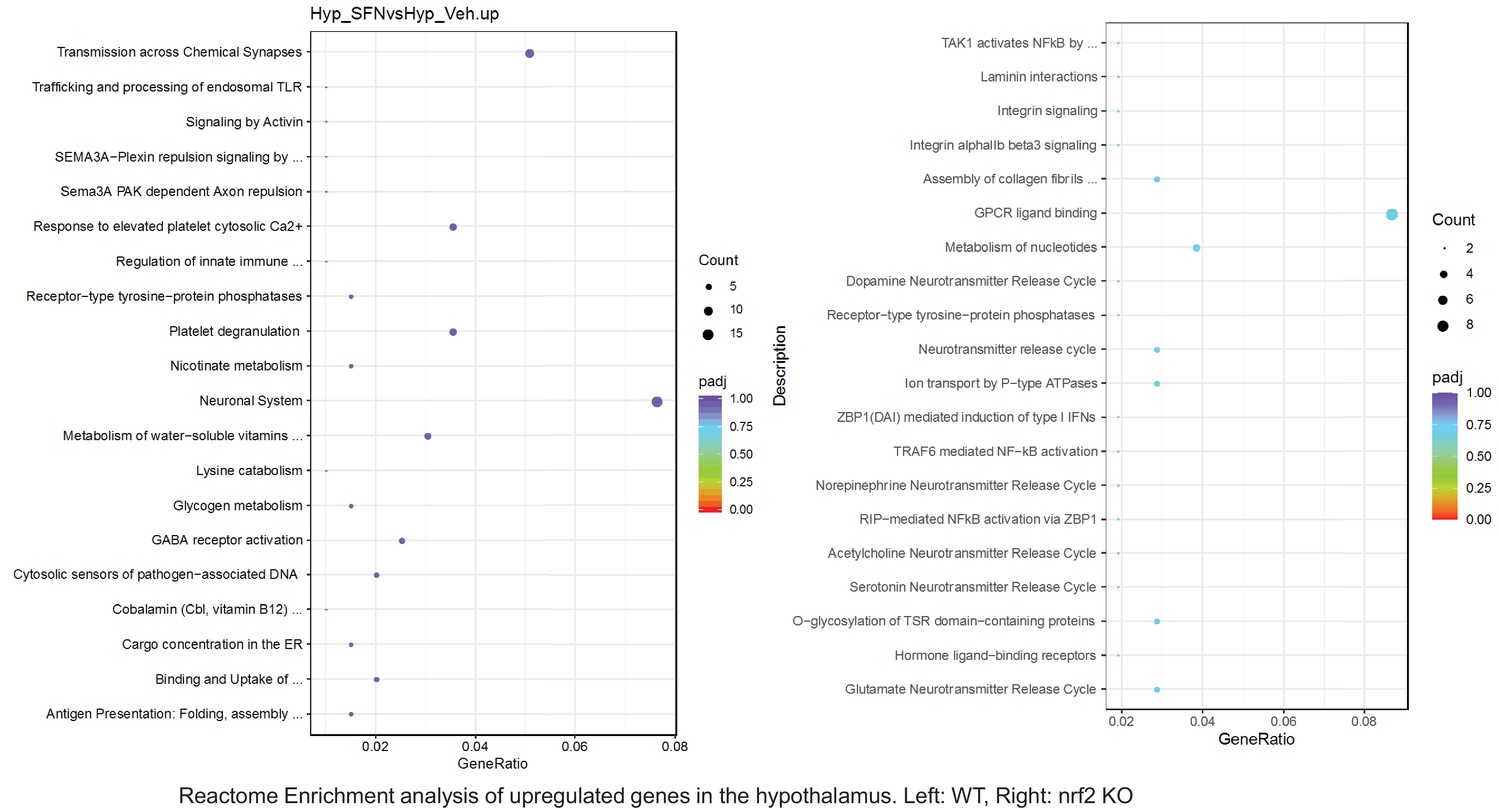
Dot plots of Reactome Enrichment Pathway analyses of RNA sequencing results indicating significantly up regulated genes following SFN treatments in hypothalamus of WT DIO and NRF2 KO DIO mice. Pathways enriched in each analysis listed in Y axis. Gene Ratio represents the ratio of differentially expressed genes to all genes for each GO term. Size of dot represents number of significantly altered genes in each condition. Color of dot represents the adjusted p values (purple represents 1 and red represent 0), (Supplementary file 4).
Figure 6—figure supplement 29
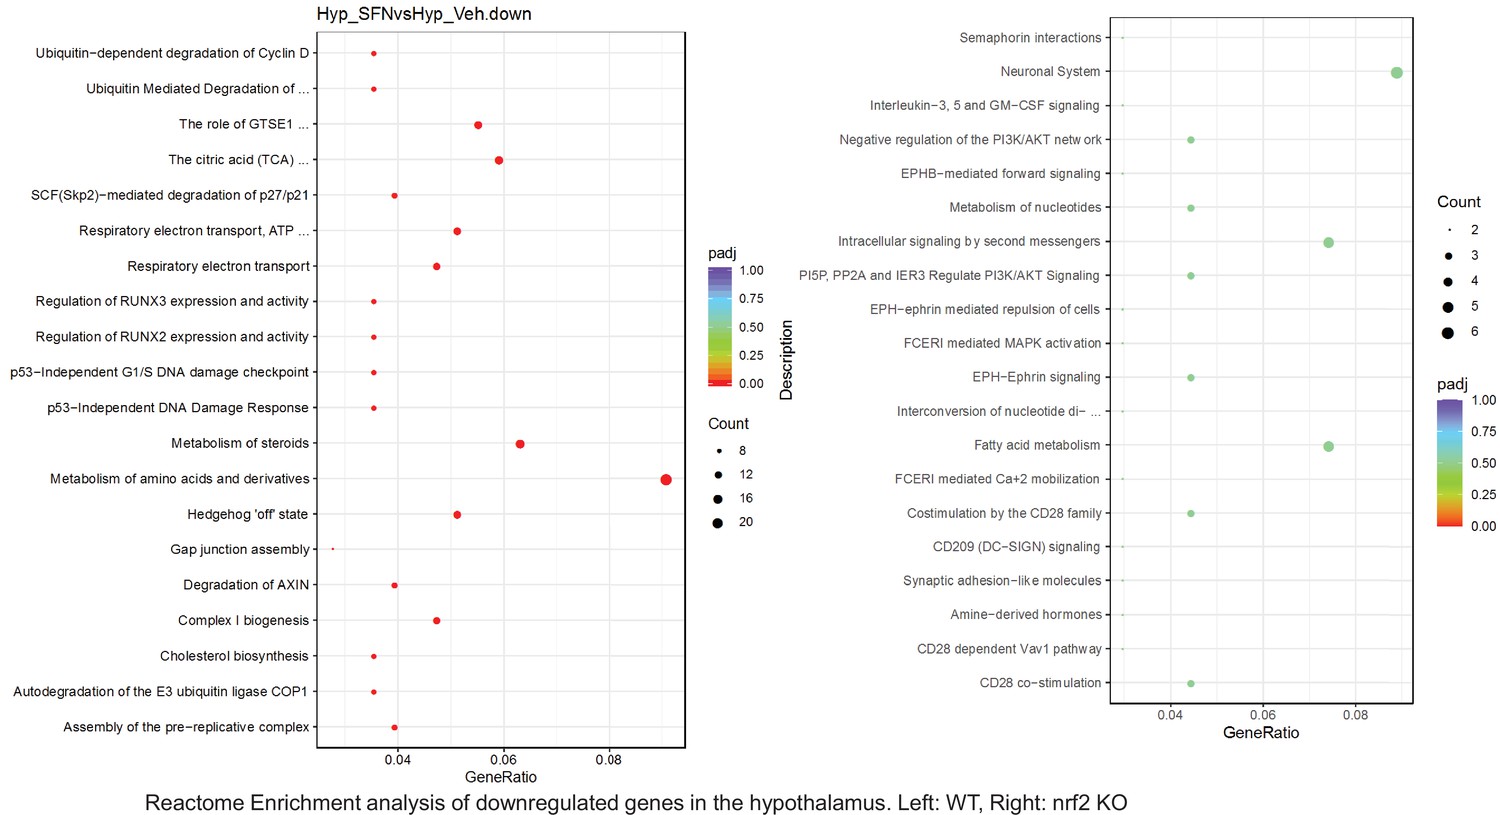
Pathway enrichment analyses of bulk RNA sequencing results indicating significantly altered genes following SFN treatments in tissues of WT DIO and NRF2 KO DIO mice.
Dot plots of Reactome Enrichment Pathway analyses of RNA sequencing results indicating significantly downregulated genes following SFN treatments in hypothalamus of WT DIO and NRF2 KO DIO mice. Pathways enriched in each analysis listed in Y axis. Gene Ratio represents the ratio of differentially expressed genes to all genes for each GO term. Size of dot represents number of significantly altered genes in each condition. Color of dot represents the adjusted p values (purple represents 1 and red represent 0), (Supplementary file 4).
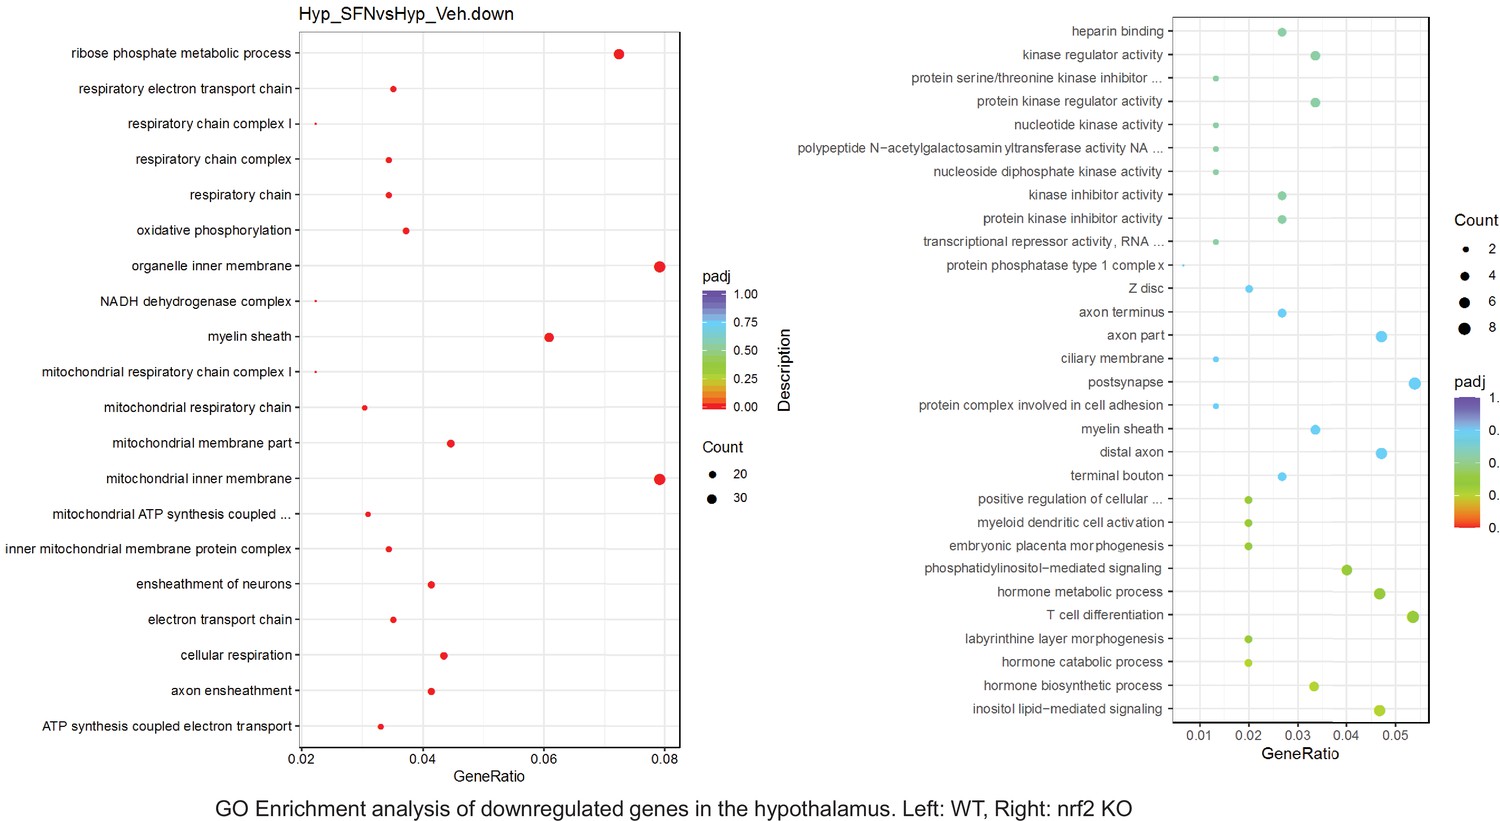
Figure 6—figure supplement 30
Pathway enrichment analyses of bulk RNA sequencing results indicating significantly altered genes following SFN treatments in tissues of WT DIO and NRF2 KO DIO mice.
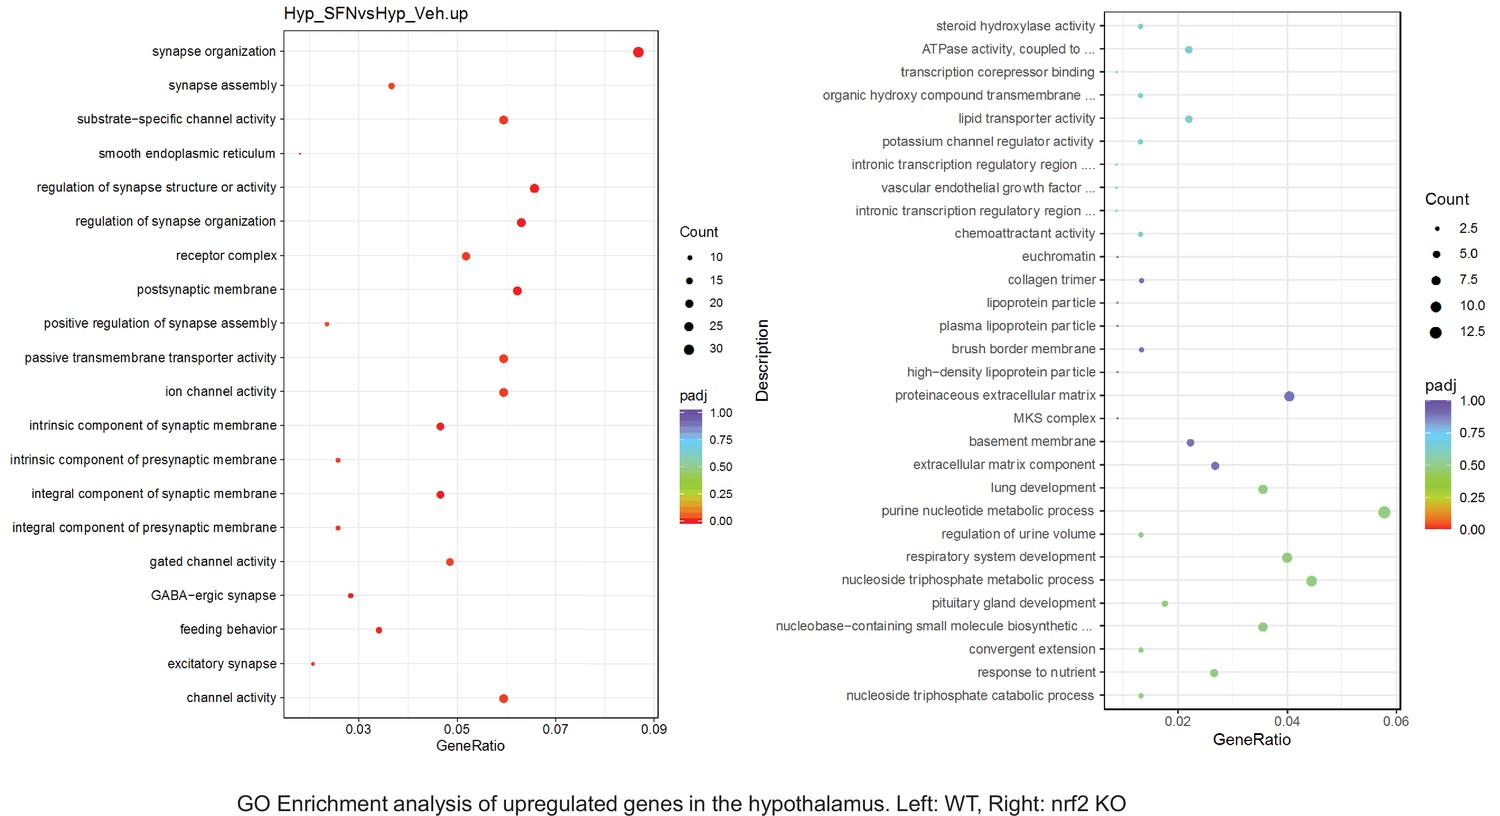
Dot plots of GO Enrichment Pathway analyses of RNA sequencing results indicating significantly up regulated genes following SFN treatments in hypothalamus of WT DIO and NRF2 KO DIO mice. Pathways enriched in each analysis listed in Y axis. Gene Ratio represents the ratio of differentially expressed genes to all genes for each GO term. Size of dot represents number of significantly altered genes in each condition. Color of dot represents the adjusted p values (purple represents 1 and red represent 0), (Supplementary file 4).
Figure 6—figure supplement 31
Pathway enrichment analyses of bulk RNA sequencing results indicating significantly altered genes following SFN treatments in tissues of WT DIO and NRF2 KO DIO mice.
Dot plots of GO Enrichment Pathway analyses of RNA sequencing results indicating significantly downregulated genes following SFN treatments in hypothalamus of WT DIO and NRF2 KO DIO mice. Pathways enriched in each analysis listed in Y axis. Gene Ratio represents the ratio of differentially expressed genes to all genes for each GO term. Size of dot represents number of significantly altered genes in each condition. Color of dot represents the adjusted p values (purple represents 1 and red represent 0), (Supplementary file 4).
Figure 6—figure supplement 32
Pathway enrichment analyses of bulk RNA sequencing results indicating significantly altered genes following SFN treatments in tissues of WT DIO mice.
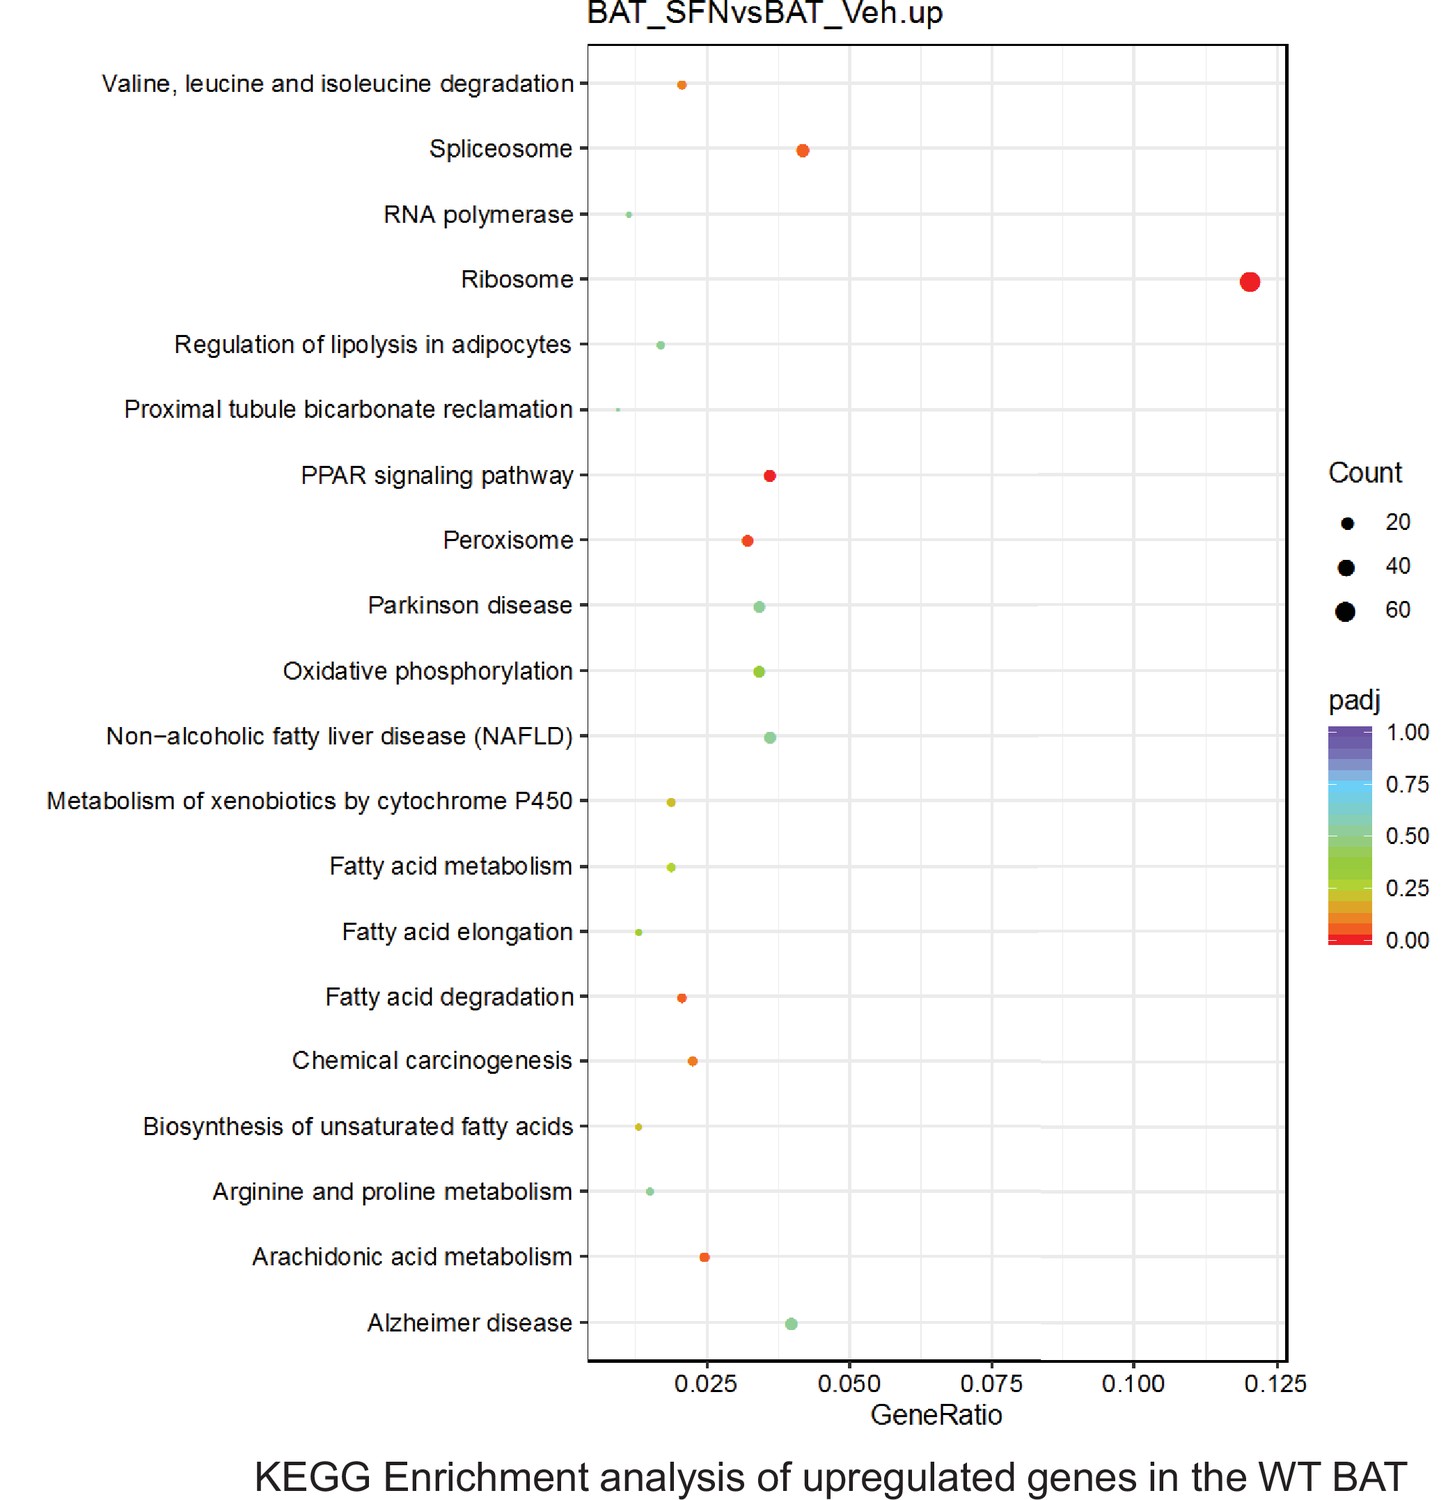
Dot plots of KEGG Enrichment Pathway analyses of RNA sequencing results indicating significantly up regulated genes following SFN treatments in brown adipose tissue (BAT) of WT DIO mice. Pathways enriched in each analysis listed in Y axis. Gene Ratio represents the ratio of differentially expressed genes to all genes for each GO term. Size of dot represents number of significantly altered genes in each condition. Color of dot represents the adjusted p values (purple represents 1 and red represent 0), (Supplementary file 4).
Figure 6—figure supplement 33
Pathway enrichment analyses of bulk RNA sequencing results indicating significantly altered genes following SFN treatments in tissues of WT DIO mice.
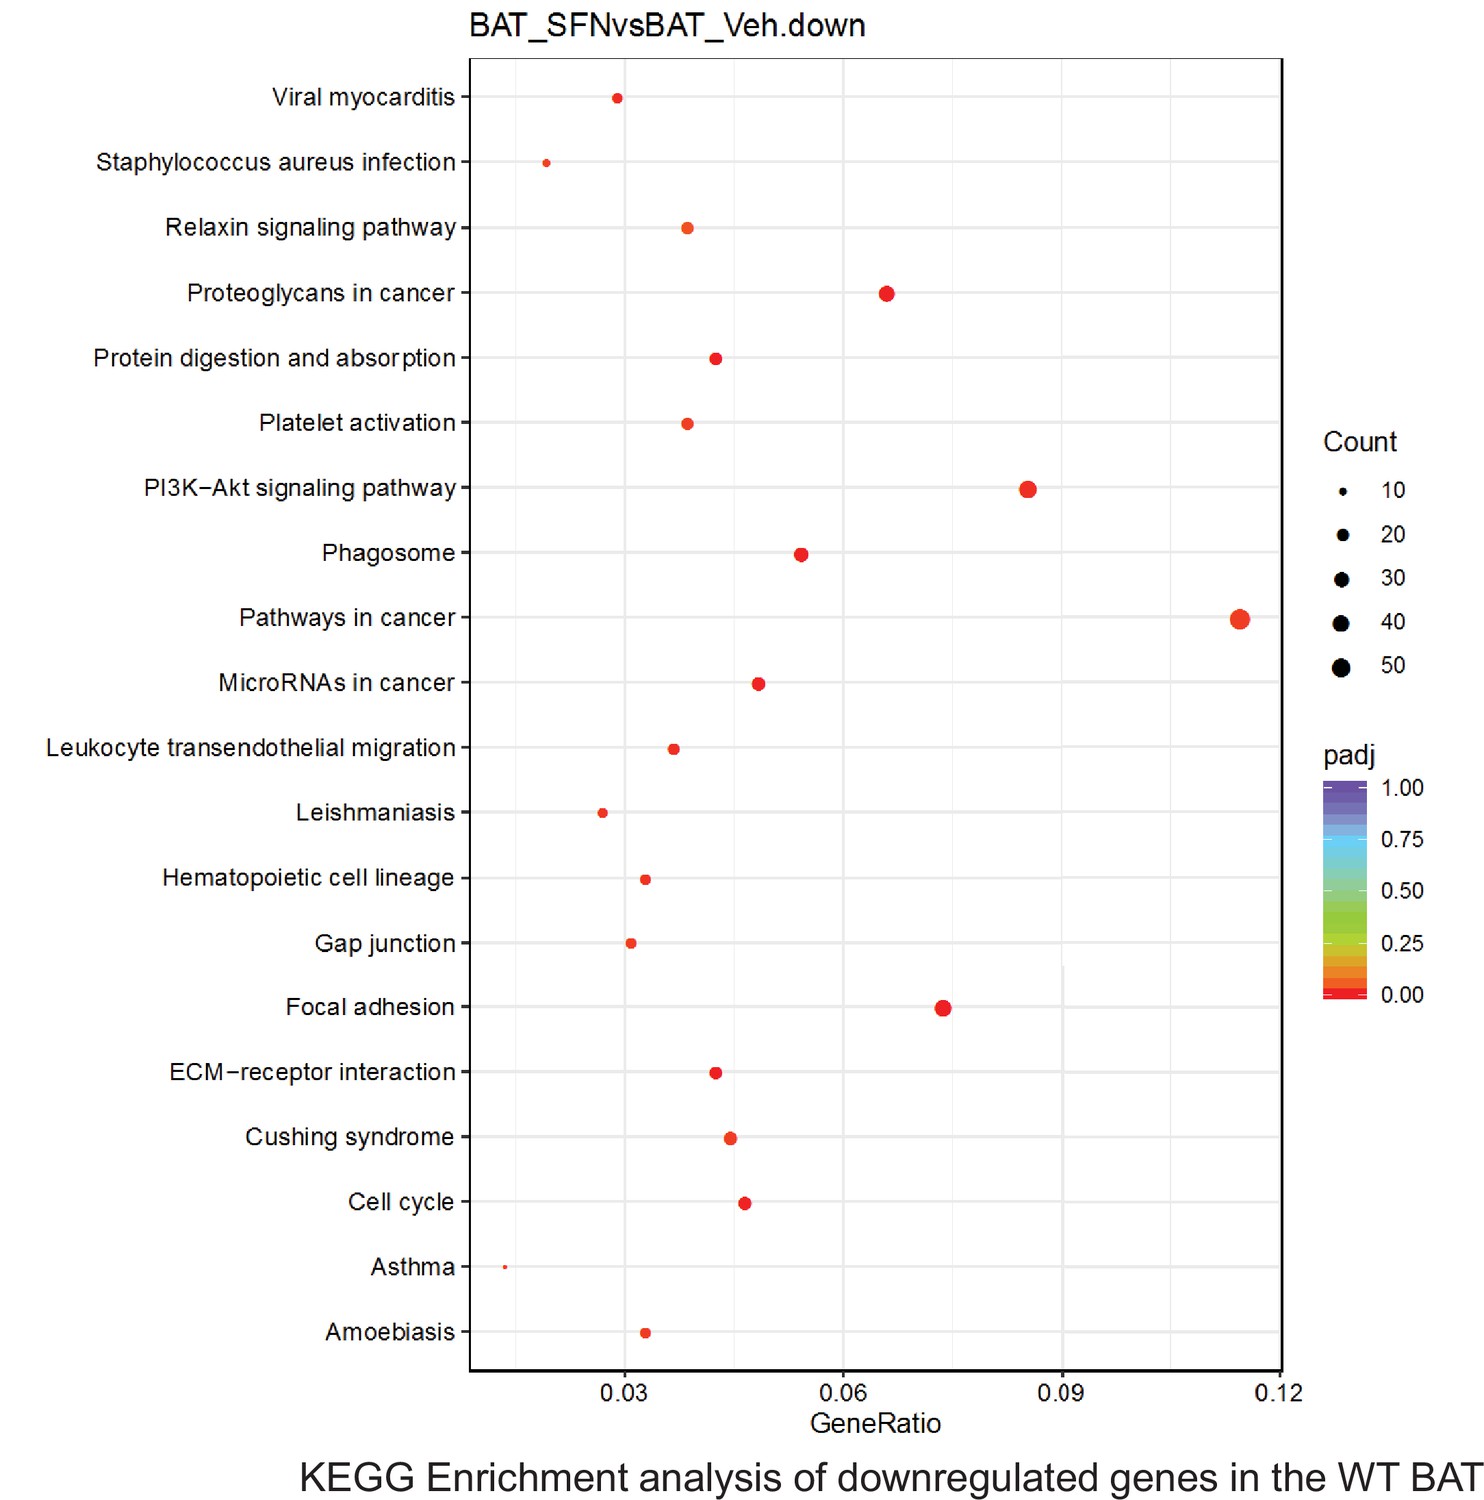
Dot plots of KEGG, Enrichment Pathway analyses of RNA sequencing results indicating significantly downregulated genes following SFN treatments in brown adipose tissue (BAT) of WT DIO mice. Pathways enriched in each analysis listed in Y axis. Gene Ratio represents the ratio of differentially expressed genes to all genes for each GO term. Size of dot represents number of significantly altered genes in each condition. Color of dot represents the adjusted p values (purple represents 1 and red represent 0), (Supplementary file 4).
Figure 6—figure supplement 34
Pathway enrichment analyses of bulk RNA sequencing results indicating significantly altered genes following SFN treatments in tissues of WT DIO mice.
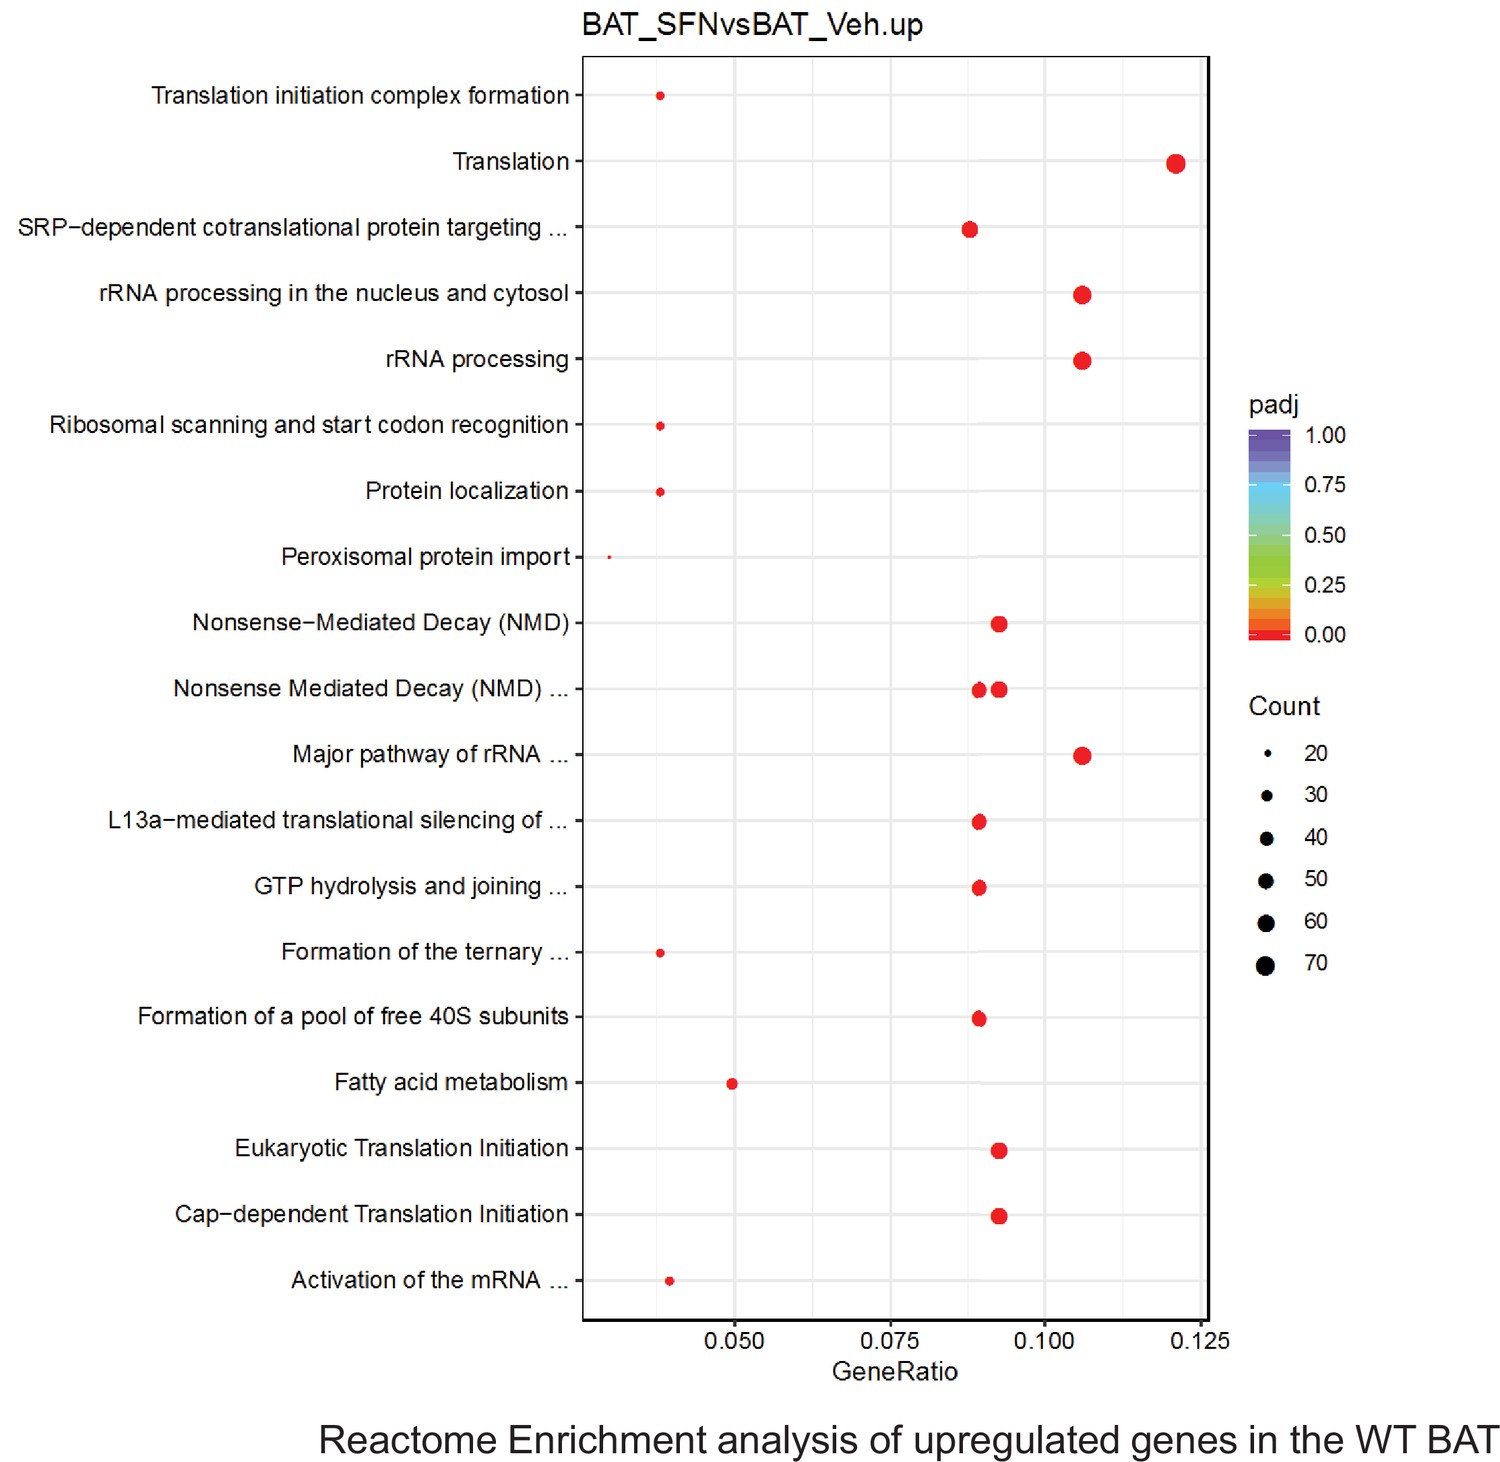
Dot plots of Reactome Enrichment Pathway analyses of RNA sequencing results indicating significantly up regulated genes following SFN treatments in brown adipose tissue (BAT) of WT DIO mice. Pathways enriched in each analysis listed in Y axis. Gene Ratio represents the ratio of differentially expressed genes to all genes for each GO term. Size of dot represents number of significantly altered genes in each condition. Color of dot represents the adjusted p values (purple represents 1 and red represent 0), (Supplementary file 4).
Figure 6—figure supplement 35
Pathway enrichment analyses of bulk RNA sequencing results indicating significantly altered genes following SFN treatments in tissues of WT DIO mice.
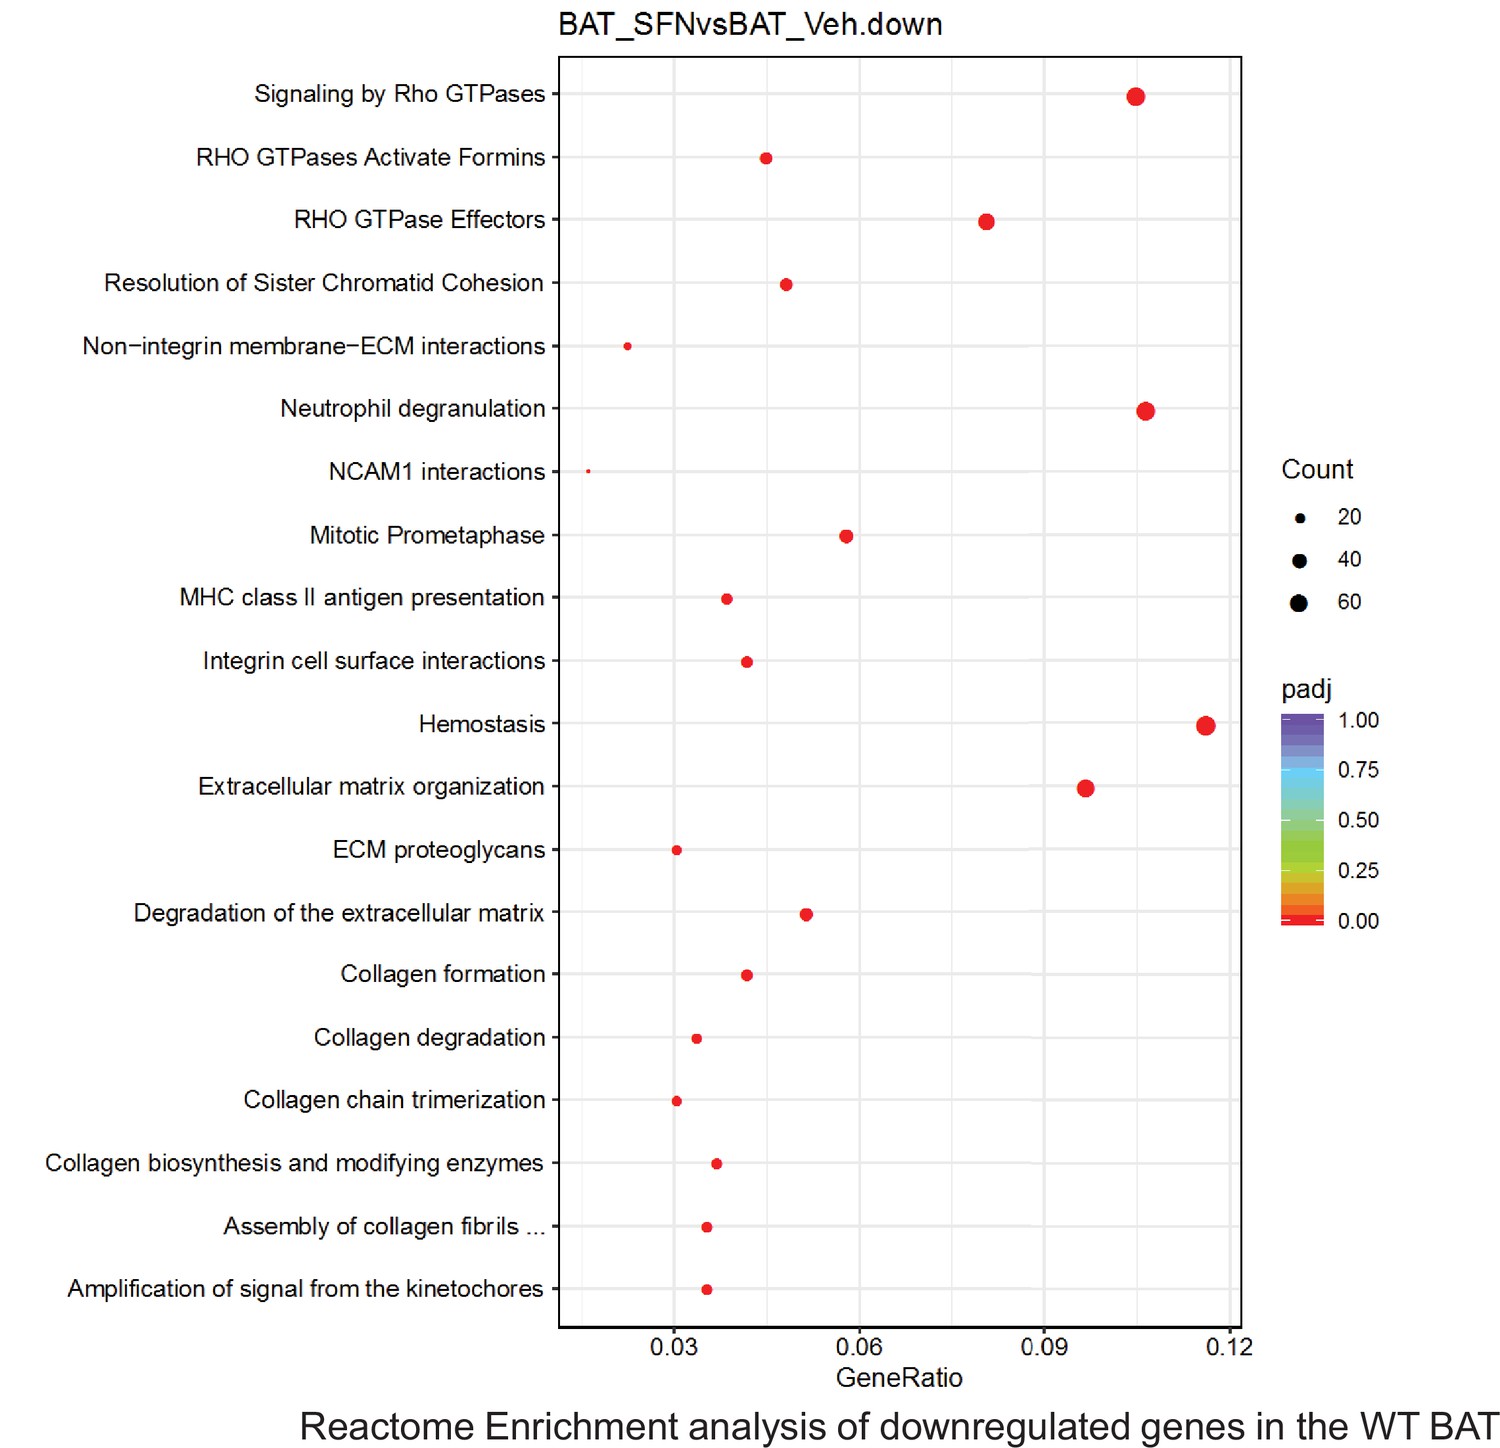
Dot plots of Reactome Enrichment Pathway analyses of RNA sequencing results indicating significantly downregulated genes following SFN treatments in brown adipose tissue (BAT) of WT DIO mice. Pathways enriched in each analysis listed in Y axis. Gene Ratio represents the ratio of differentially expressed genes to all genes for each GO term. Size of dot represents number of significantly altered genes in each condition. Color of dot represents the adjusted p values (purple represents 1 and red represent 0), (Supplementary file 4).
Figure 6—figure supplement 36
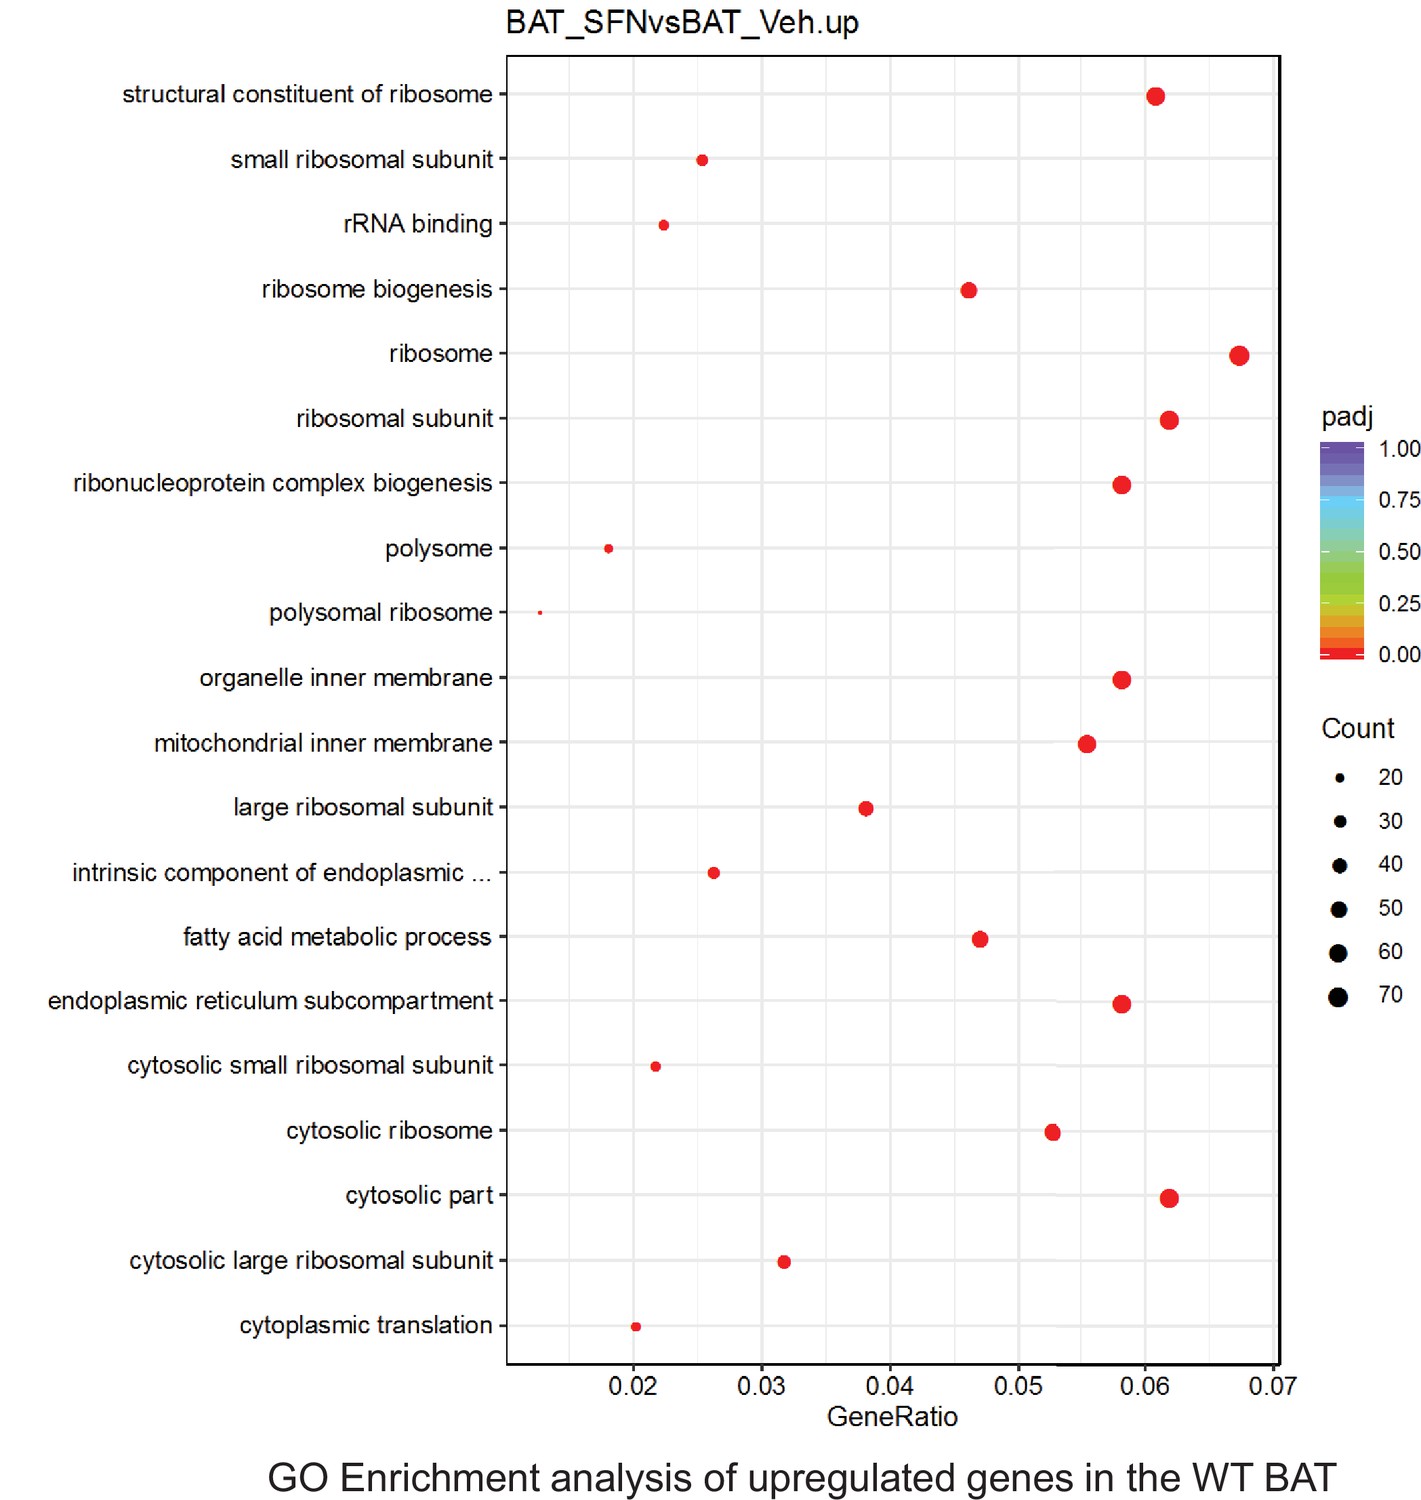
Pathway enrichment analyses of bulk RNA sequencing results indicating significantly altered genes following SFN treatments in tissues of WT DIO mice.
Dot plots of GO Enrichment Pathway analyses of RNA sequencing results indicating significantly up regulated genes following SFN treatments in brown adipose tissue (BAT) of WT DIO mice. Pathways enriched in each analysis listed in Y axis. Gene Ratio represents the ratio of differentially expressed genes to all genes for each GO term. Size of dot represents number of significantly altered genes in each condition. Color of dot represents the adjusted p values (purple represents 1 and red represent 0), (Supplementary file 4).
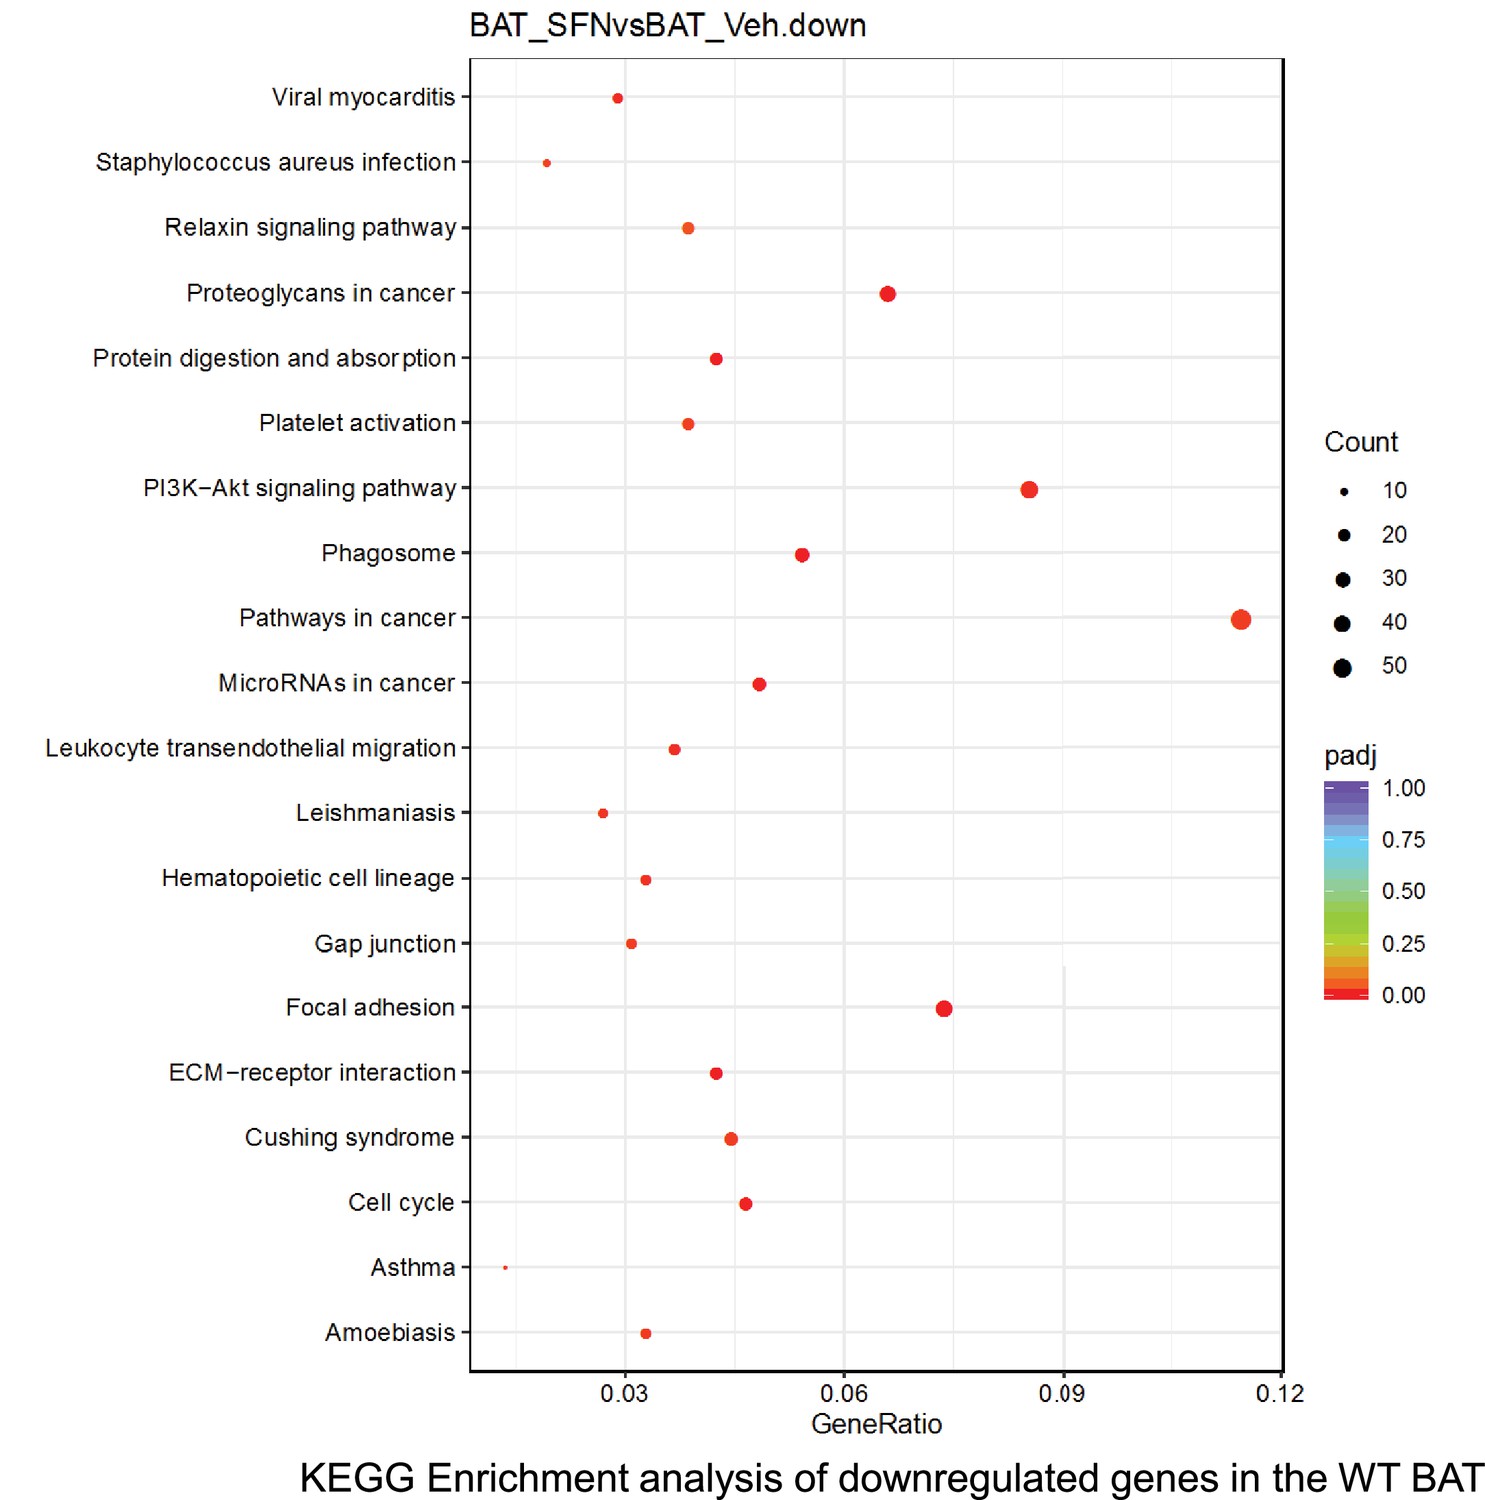
Figure 6—figure supplement 37
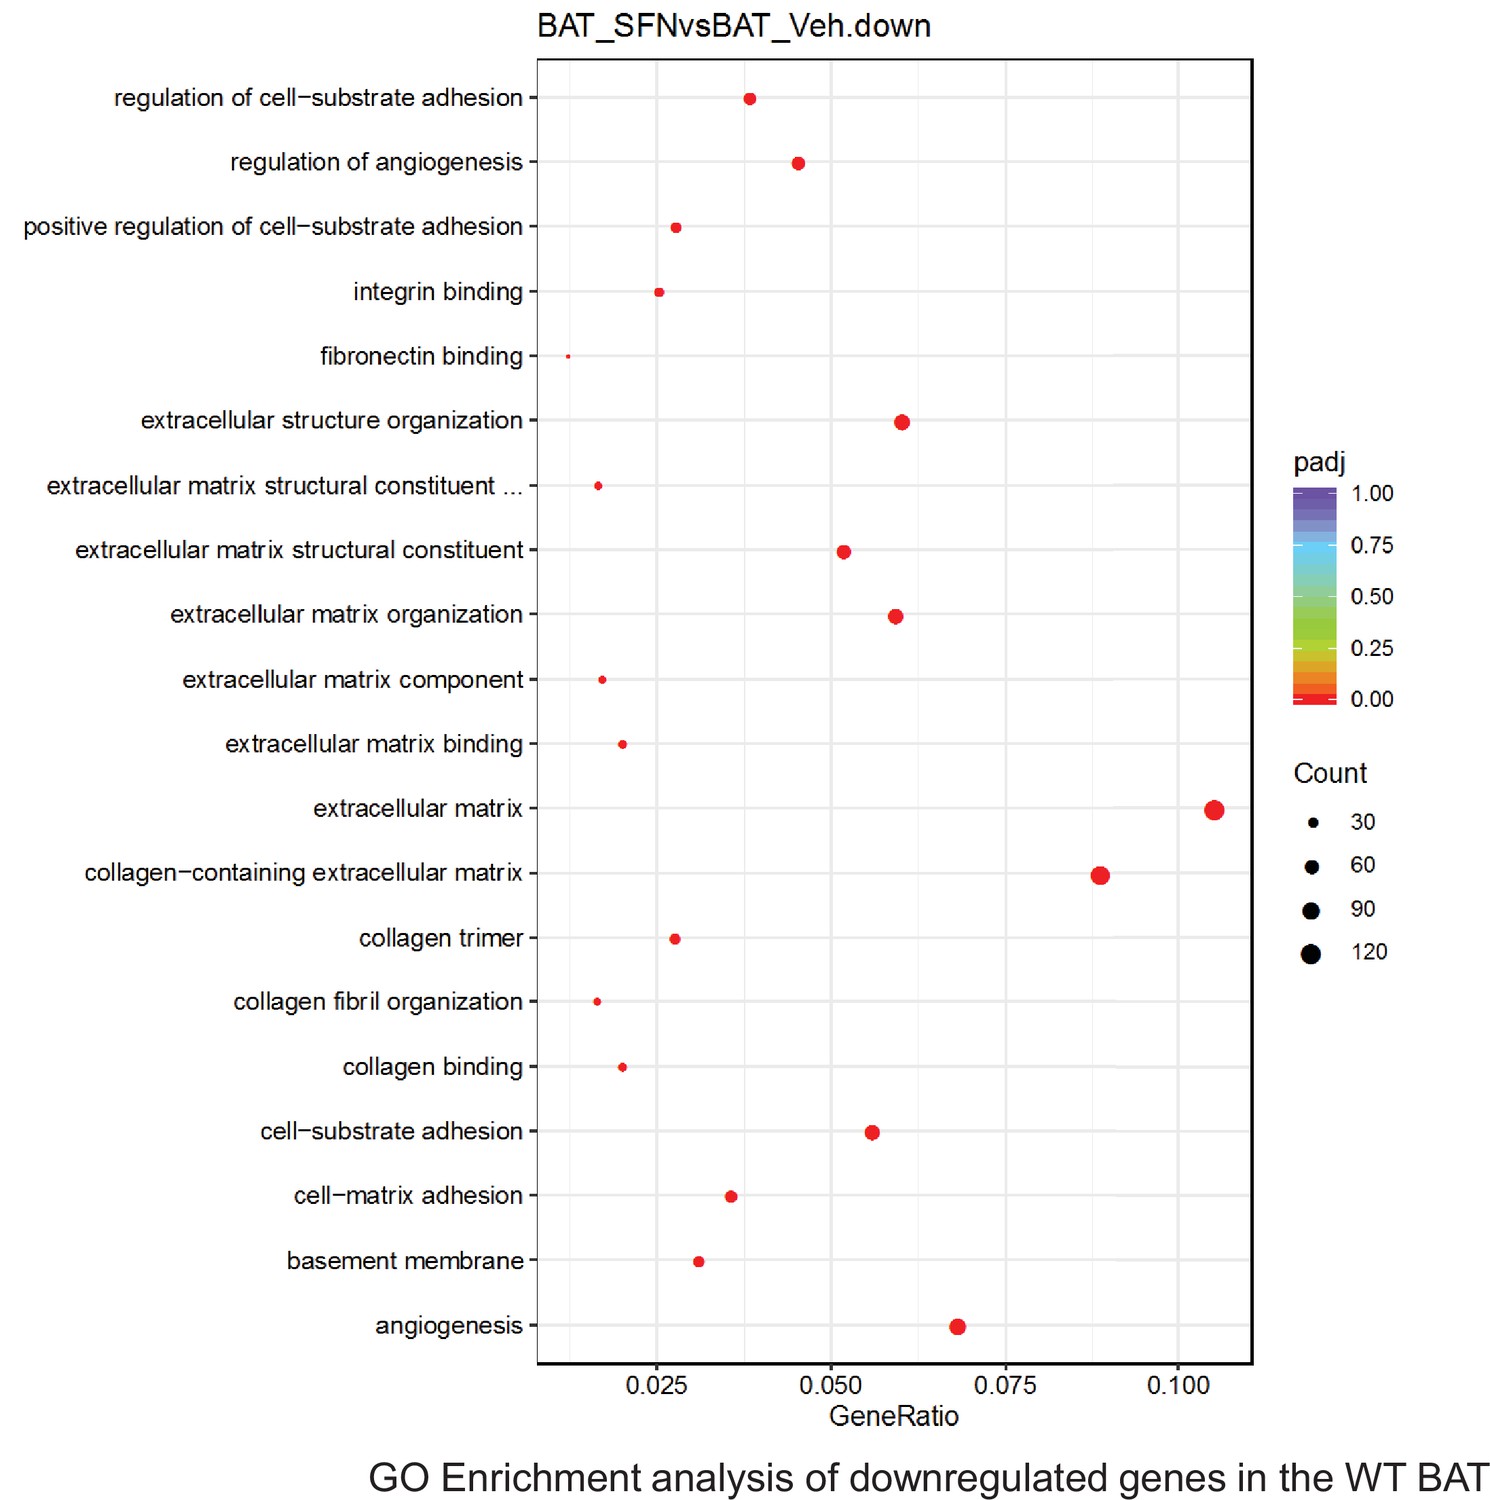
Pathway enrichment analyses of bulk RNA sequencing results indicating significantly altered genes following SFN treatments in tissues of WT DIO mice.
Dot plots of GO Enrichment Pathway analyses of RNA sequencing results indicating significantly downregulated genes following SFN treatments in brown adipose tissue (BAT) of WT DIO mice. Pathways enriched in each analysis listed in Y axis. Gene Ratio represents the ratio of differentially expressed genes to all genes for each GO term. Size of dot represents number of significantly altered genes in each condition. Color of dot represents the adjusted p values (purple represents 1 and red represent 0), (Supplementary file 4).
Additional files
-
Supplementary file 1
Profiles of global transcriptional changes obtained from bulk RNAseq indicate significantly altered genes following 1-week sulforaphane (SFN) treatment in skeletal muscle, liver, inguinal white adipose tissue (iWAT), epididymal white adipose tissue (eWAT), hypothalamus, and brown adipose tissue (BAT) of WT diet-induced obese (DIO) mice.
The highest transcriptional changes were detected in the liver, and the least number of transcriptional changes were observed in the hypothalamus.
- https://cdn.elifesciences.org/articles/67368/elife-67368-supp1-v1.xlsx
-
Supplementary file 2
Profiles of global transcriptional changes obtained from bulk RNAseq indicate significantly altered genes following a 4-week sulforaphane (SFN) treatment in skeletal muscle, liver, inguinal white adipose tissue (iWAT), epididymal white adipose tissue (eWAT), hypothalamus, and brown adipose tissue (BAT) of NRF2 KO diet-induced obese (DIO) mice.
Results failed to show the SFN-induced upregulation of Hmox1 in the skeletal muscle of NRF2 KO mice.
- https://cdn.elifesciences.org/articles/67368/elife-67368-supp2-v1.xlsx
-
Supplementary file 3
Profiles of potential transcription factors for the significantly upregulated genes following 1-week sulforaphane (SFN) treatment in skeletal muscle, liver, inguinal white adipose tissue (iWAT), epididymal white adipose tissue (eWAT), hypothalamus, and brown adipose tissue (BAT) of WT diet-induced obese (DIO) mice.
NRF2 is identified as the most significant transcription factor only for the skeletal muscle gene set in WT mice.
- https://cdn.elifesciences.org/articles/67368/elife-67368-supp3-v1.xlsx
-
Supplementary file 4
Profiles of KEGG, Reactome, and GO enrichment of pathway analyses indicating significantly altered genes following sulforaphane (SFN) treatments in skeletal muscle, liver, inguinal white adipose tissue (iWAT), epididymal white adipose tissue (eWAT) and the hypothalamus of WT diet-induced obese (DIO) and NRF2 KO DIO, mice, and the brown adipose tissue (BAT) of WT DIO mice.
KEGG pathway analysis of skeletal muscle transcriptome identifies ribosome biogenesis, proteasome pathway, the RNA transport, and mitophagy as the significantly upregulated pathways in SFN-treated wild-type mice. The KEGG pathway analysis of muscle samples from NRF2 KO animals identified only the splicesome pathway as significantly upregulated following SFN treatments.
- https://cdn.elifesciences.org/articles/67368/elife-67368-supp4-v1.xlsx
-
Transparent reporting form
- https://cdn.elifesciences.org/articles/67368/elife-67368-transrepform1-v1.pdf
Download links
A two-part list of links to download the article, or parts of the article, in various formats.
Downloads (link to download the article as PDF)
Open citations (links to open the citations from this article in various online reference manager services)
Cite this article (links to download the citations from this article in formats compatible with various reference manager tools)
Sulforaphane reduces obesity by reversing leptin resistance
eLife 11:e67368.
https://doi.org/10.7554/eLife.67368


