HIV status alters disease severity and immune cell responses in Beta variant SARS-CoV-2 infection wave
- Africa Health Research Institute, South Africa
- School of Laboratory Medicine and Medical Sciences, University of KwaZulu-Natal, South Africa
- KwaZulu-Natal Research Innovation and Sequencing Platform, South Africa
- Division of Infection and Immunity, University College London, United Kingdom
- HIV Pathogenesis Programme, The Doris Duke Medical Research Institute, University of KwaZulu-Natal, South Africa
- Max Planck Institute for Infection Biology, Germany
- Department of Infectious Diseases, Nelson R. Mandela School of Clinical Medicine, University of KwaZulu-Natal, South Africa
- Centre for the AIDS Programme of Research in South Africa, South Africa
- Division of Infectious Diseases, Department of Medicine, University of Alabama at Birmingham, United States
- Centre for Epidemic Response and Innovation, School of Data Science and Computational Thinking, Stellenbosch University, South Africa
- Department of Global Health, University of Washington, United States
- Department of Immunology and Microbiology, University of Copenhagen, Denmark
Figures
Figure 1 with 5 supplements
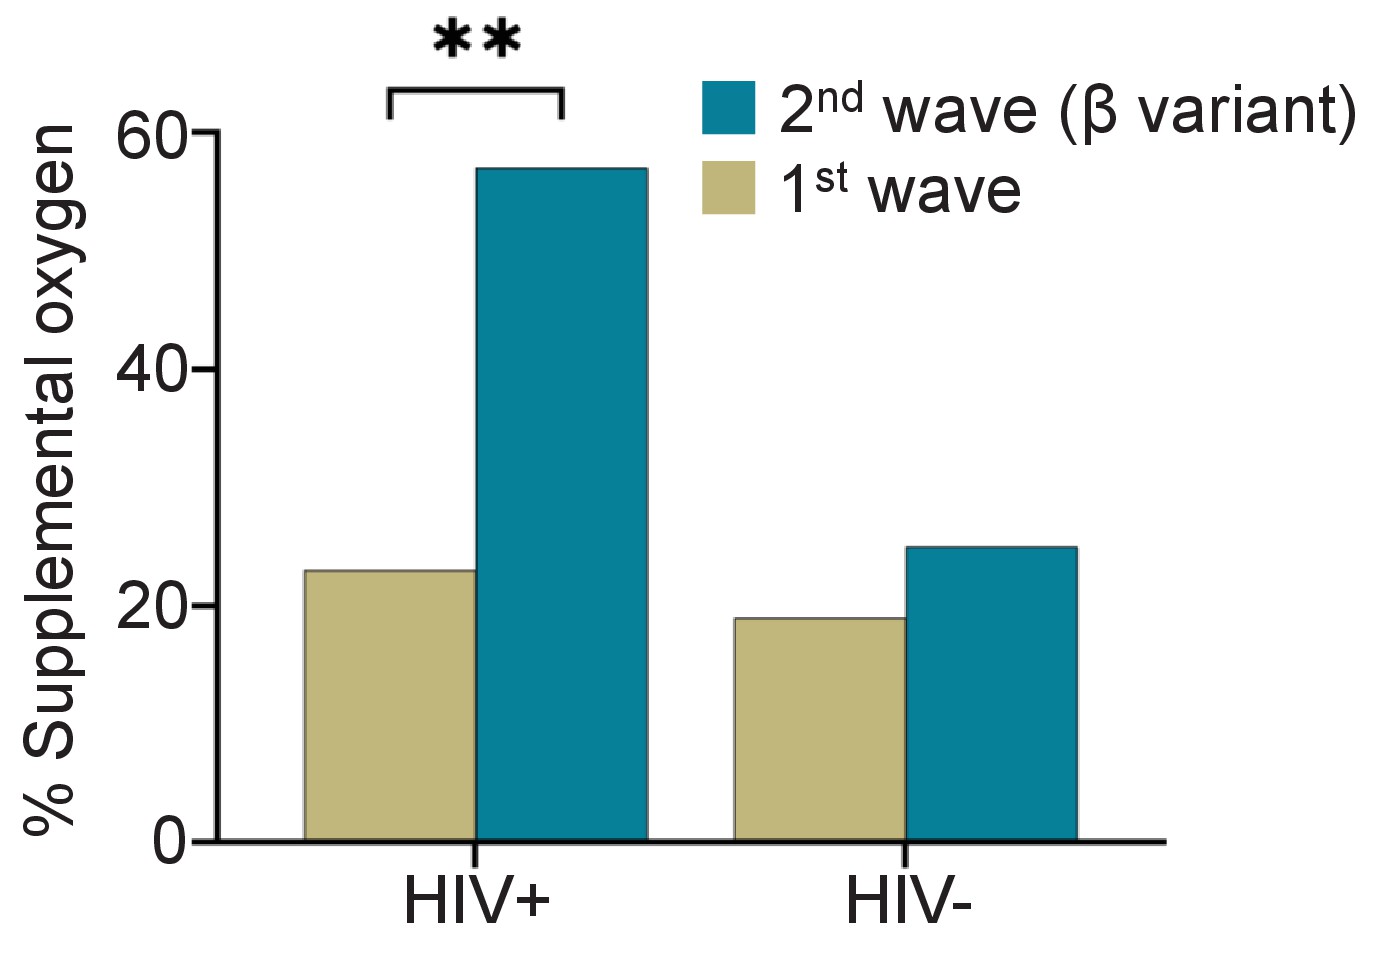
Fraction of PLWH and HIV-negative participants requiring supplemental oxygen during the first and the Beta variant dominated second infection waves.
p=0.0025 by Fisher’s Exact test.
Figure 1—figure supplement 1
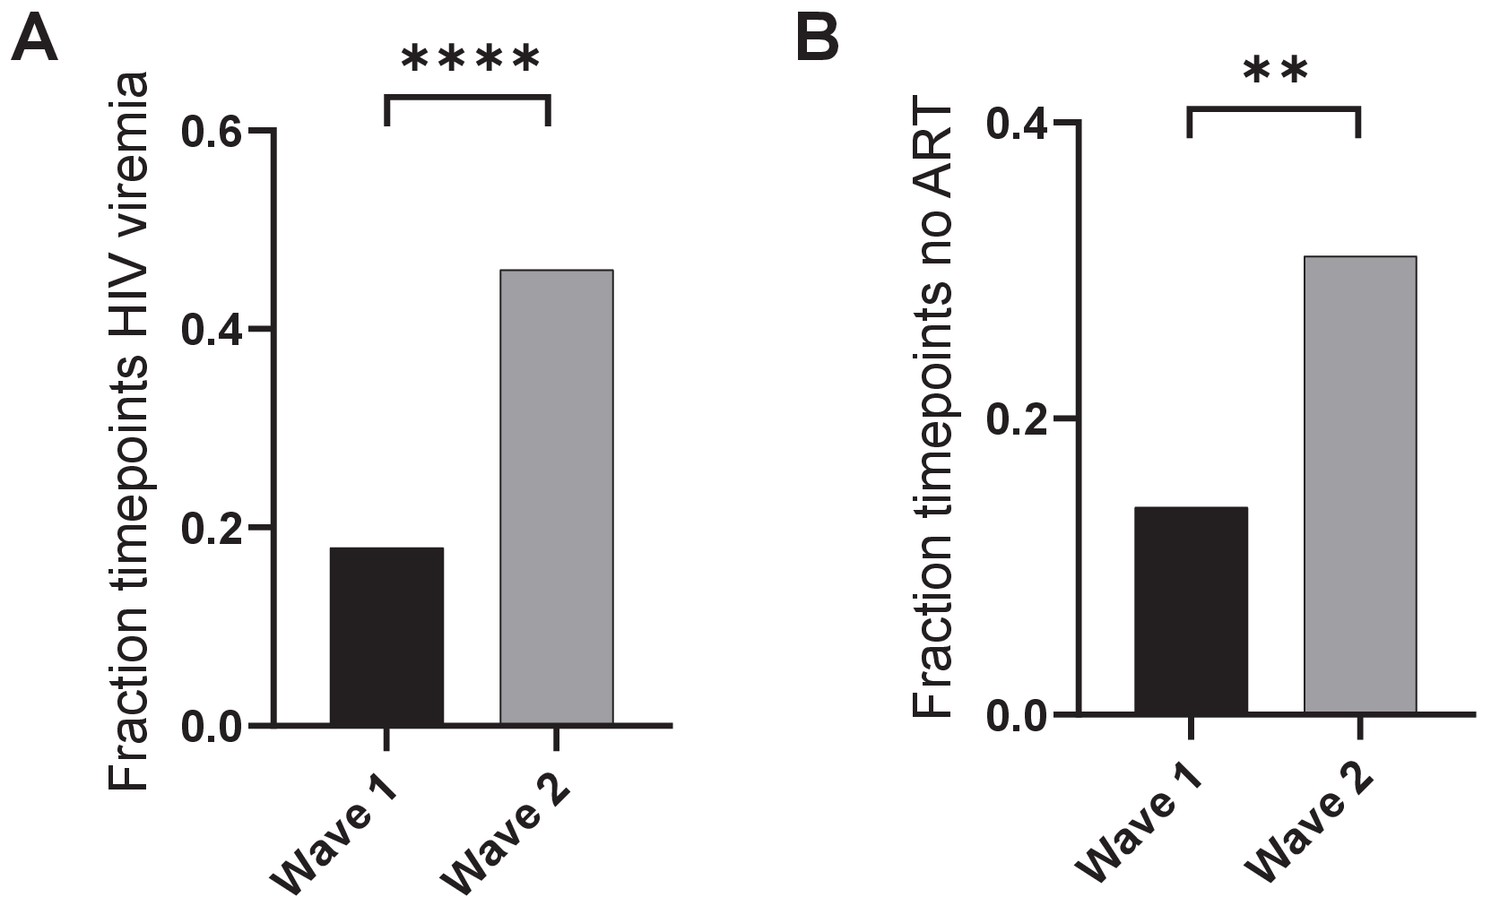
Viremia and ART in PLWH in wave 1 versus wave 2.
(A) HIV viremia was calculated as the number of study timepoints in wave 1 or wave 2 with HIV RNA > 200 copies/ml divided by all measured timepoints for PLWH. (B) The fraction of timepoints with no detectable ART was calculated as the number of study timepoints in wave 1 or wave 2 where the concentration of none of the ART components was above level of quantification divided by the number of timepoints where ART was measured. p-values are * <0.05; ** <0.01; *** < 0.001, **** < 0.0001 as determined by Fisher’s Exact test.
Figure 1—figure supplement 2
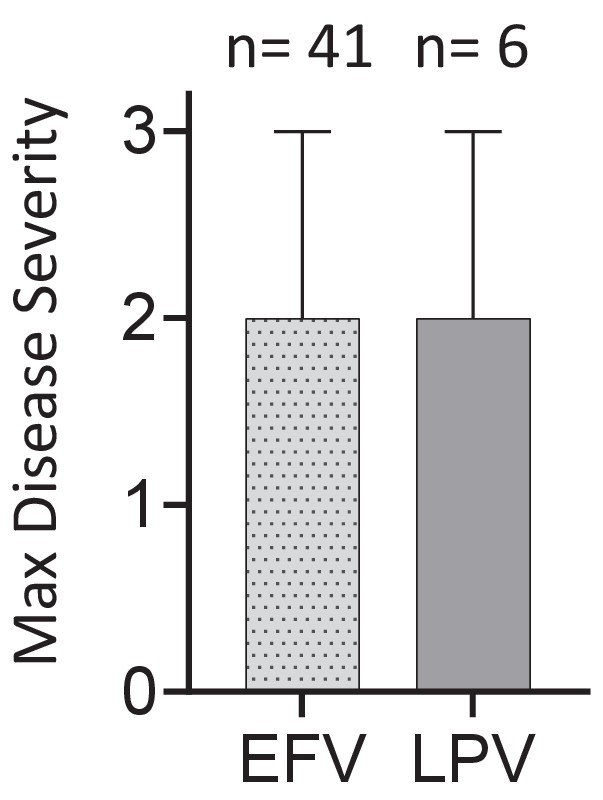
Effect of ART regimen on disease severity.
Disease severity was scored on a 3 point scale, where 1: asymptomatic, 2: mild, and 3: supplemental oxygen or death. EFV: efavirenz-based regimen. LPV: Lopinavir based regimen.
Figure 1—figure supplement 3
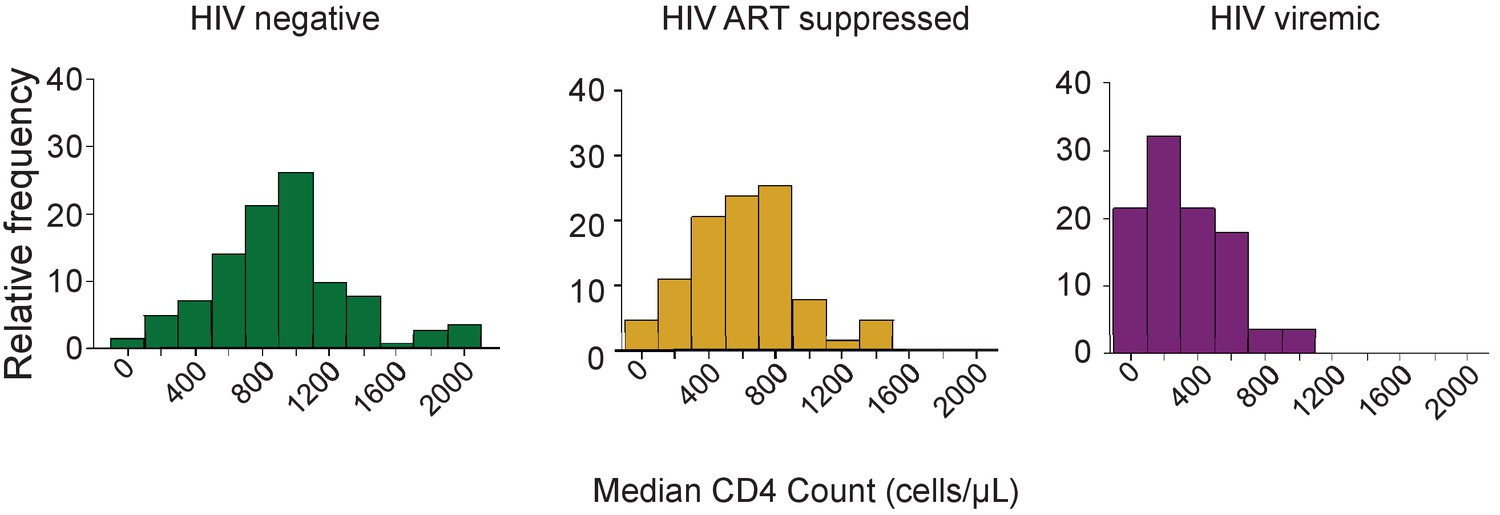
Distribution of CD4 counts by HIV status.
Plotted are the CD4 T cell count distributions for HIV negative, HIV ART suppressed, and HIV viremic participants. X-axis is the median CD4 count over all study visits, and y-axis is relative frequency of participants as percentage.
Figure 1—figure supplement 4
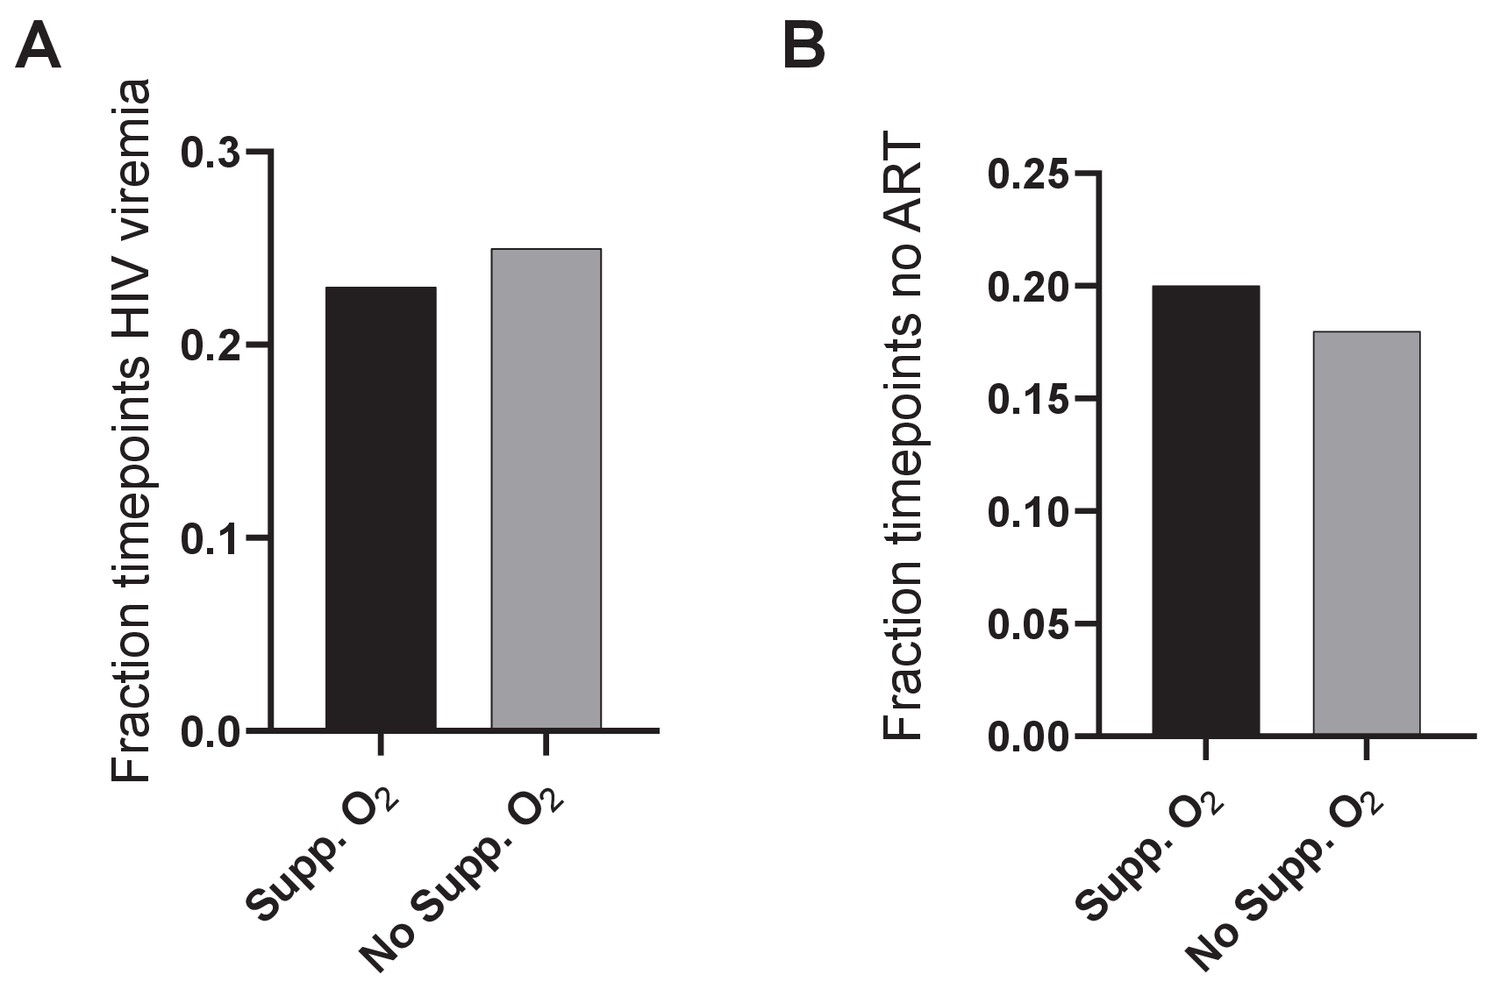
Viremia and ART in PLWH requiring versus not requiring supplemental oxygen.
(A) HIV viremia was calculated as the number of study timepoints with HIV RNA > 200 copies/ml divided by all measured timepoints for PLWH. (B) The fraction of timepoints with no detectable ART was calculated as the number of study timepoints where the concentration of none of the ART components was above level of quantification divided by all measured PLWH timepoints. No significance for comparison in (A) or (B) as determined by Fisher’s Exact test.
Figure 1—figure supplement 5
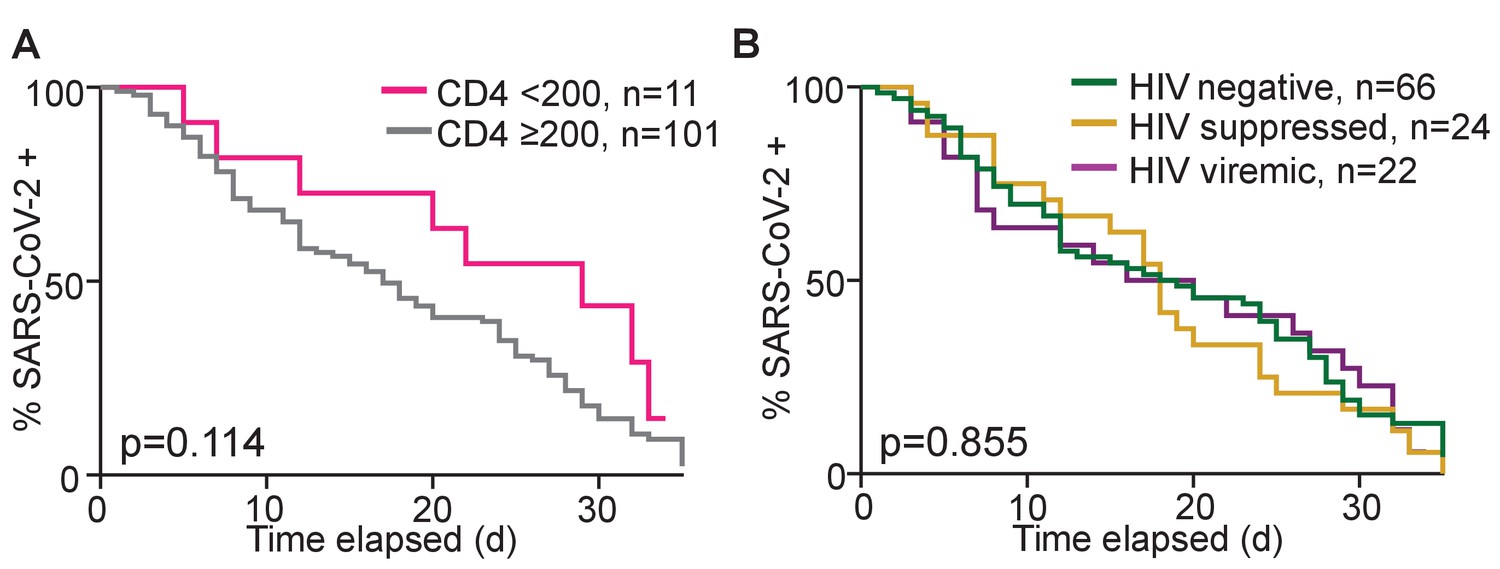
Dependence of time to SARS-CoV-2 clearance on CD4 count and HIV status.
(A) Number of participants remaining SARS-CoV-2 positive by qPCR with time as a function of CD4 count. (B) Number of participants remaining SARS-CoV-2 positive by qPCR with time as a function of HIV status. Time is days post-diagnostic swab. Only participants who were tested with two conclusive tests result (either SARS-CoV-2 positive or negative) during the time-period were included.
Figure 2 with 2 supplements
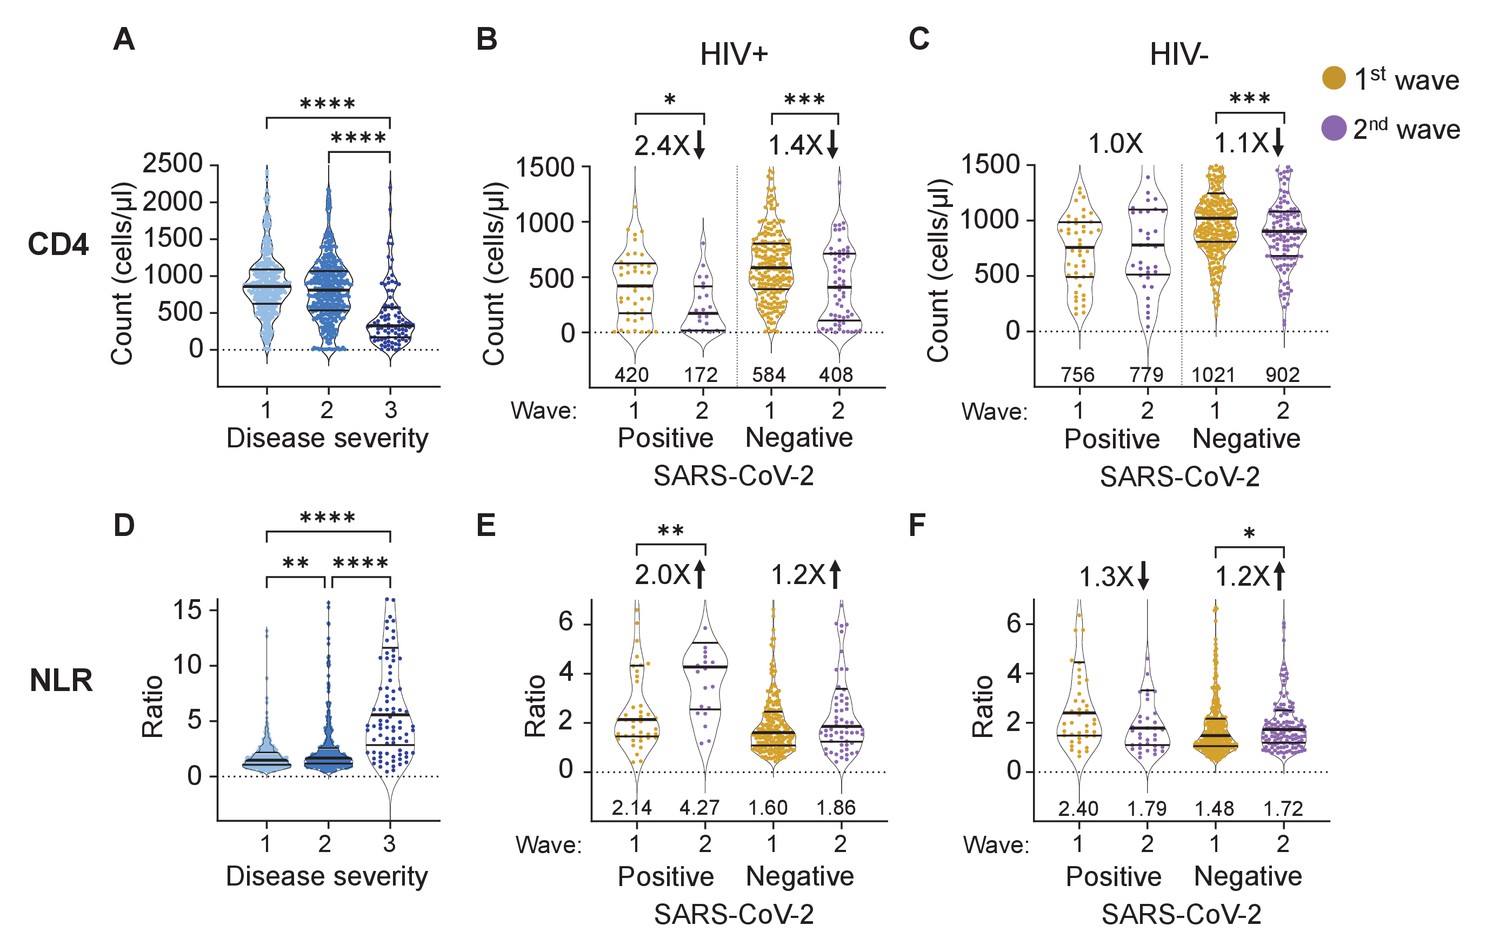
The differential effect of HIV on the CD4 count and neutrophil to lymphocyte ratio between waves.
(A) The concentration of CD4 T cells in the blood in all participants in all infection waves and at all timepoints as a function of disease severity. Disease severity was scored as 1: asymptomatic, 2: mild, and 3: on supplemental oxygen or death. CD4 counts in PLWH (B) and HIV negative (C) participants in wave 1 versus wave 2 during active SARS-CoV-2 infection and after SARS-CoV-2 clearance. (D) Neutrophil to lymphocyte ratio (NLR) in the blood in all participants in all infection waves and at all timepoints as a function of disease severity. NLR in PLWH (E) and HIV negative (F) participants in wave 1 versus wave 2 during active SARS-CoV-2 infection and after SARS-CoV-2 clearance. SARS-CoV-2 positive indicates a timepoint where SARS-CoV-2 RNA was detected. Data shown as violin plots with median and IQR, with the median denoted below each plot. Fold-change in the second wave versus first wave is indicated, with arrow denoting direction of change. p-values are * <0.05; ** <0.01; *** < 0.001, **** < 0.0001 as determined by Kruskal-Wallis test with Dunn's multiple comparison correction or by Mann-Whitney U test. Plots scales were restricted to highlight changes close to the median.
Figure 2—figure supplement 1
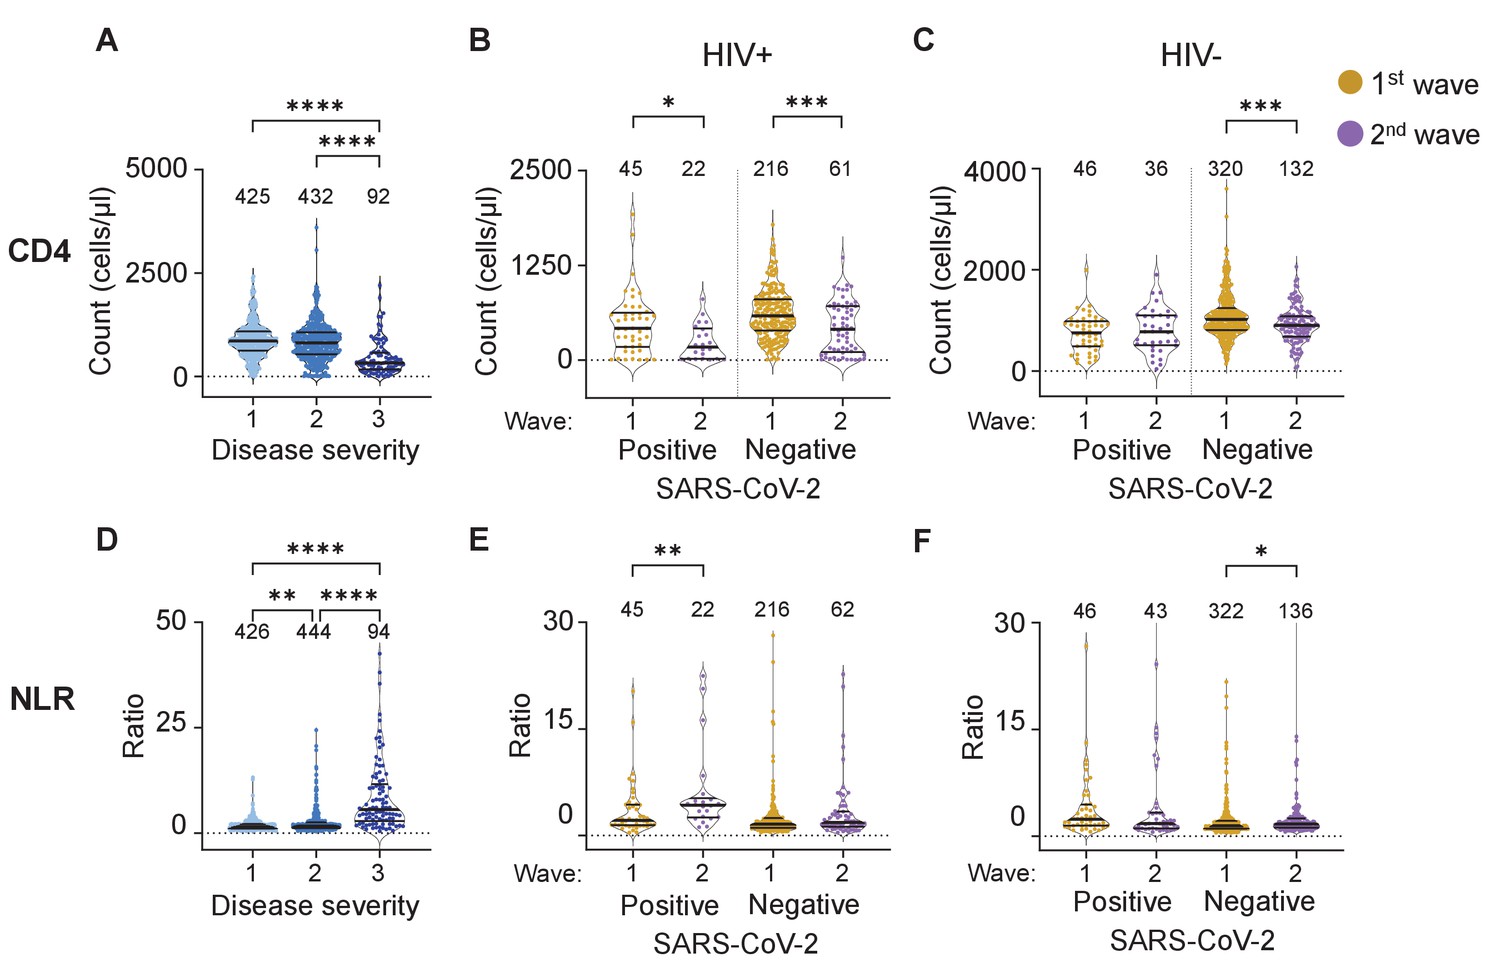
The differential effect of HIV on the CD4 count and neutrophil to lymphocyte ratio between waves - full dataset and number of data points per plot.
(A) The concentration of CD4 T cells in the blood in all participants in all infection waves and at all time-points as a function of disease severity. Disease severity was scored as 1: asymptomatic, 2: mild, and 3: requiring supplemental oxygen and/or death. CD4 counts in PLWH (B) and HIV negative (C) participants in wave 1 versus wave 2 during active SARS-CoV-2 in during active SARS-CoV-2 infection and after SARS-CoV-2 clearance. (D) Neutrophil to lymphocyte ratio (NLR) in the blood in all participants in all infection waves and at all time-points as a function of disease severity. NLR in PLWH (E) and HIV-negative (F) participants in wave 1 versus wave 2 during active SARS-CoV-2 in during active SARS-CoV-2 infection and after SARS-CoV-2 clearance. SARS-CoV-2 positive indicates a timepoint where SARS-CoV-2 RNA was detected in the upper respiratory tract. Data shown as violin plots with median and IQR, with the median also denoted below each plot. Fold-change in the second wave versus first wave is indicated by the number above the second wave data, with arrow denoting direction of change. p-values are * <0.05; ** <0.01; *** < 0.001, **** < 0.0001 as determined by Kruskal-Wallis test with Dunn's multiple comparison correction for the left plots or by Mann-Whitney U test for the other data.
Figure 2—figure supplement 2
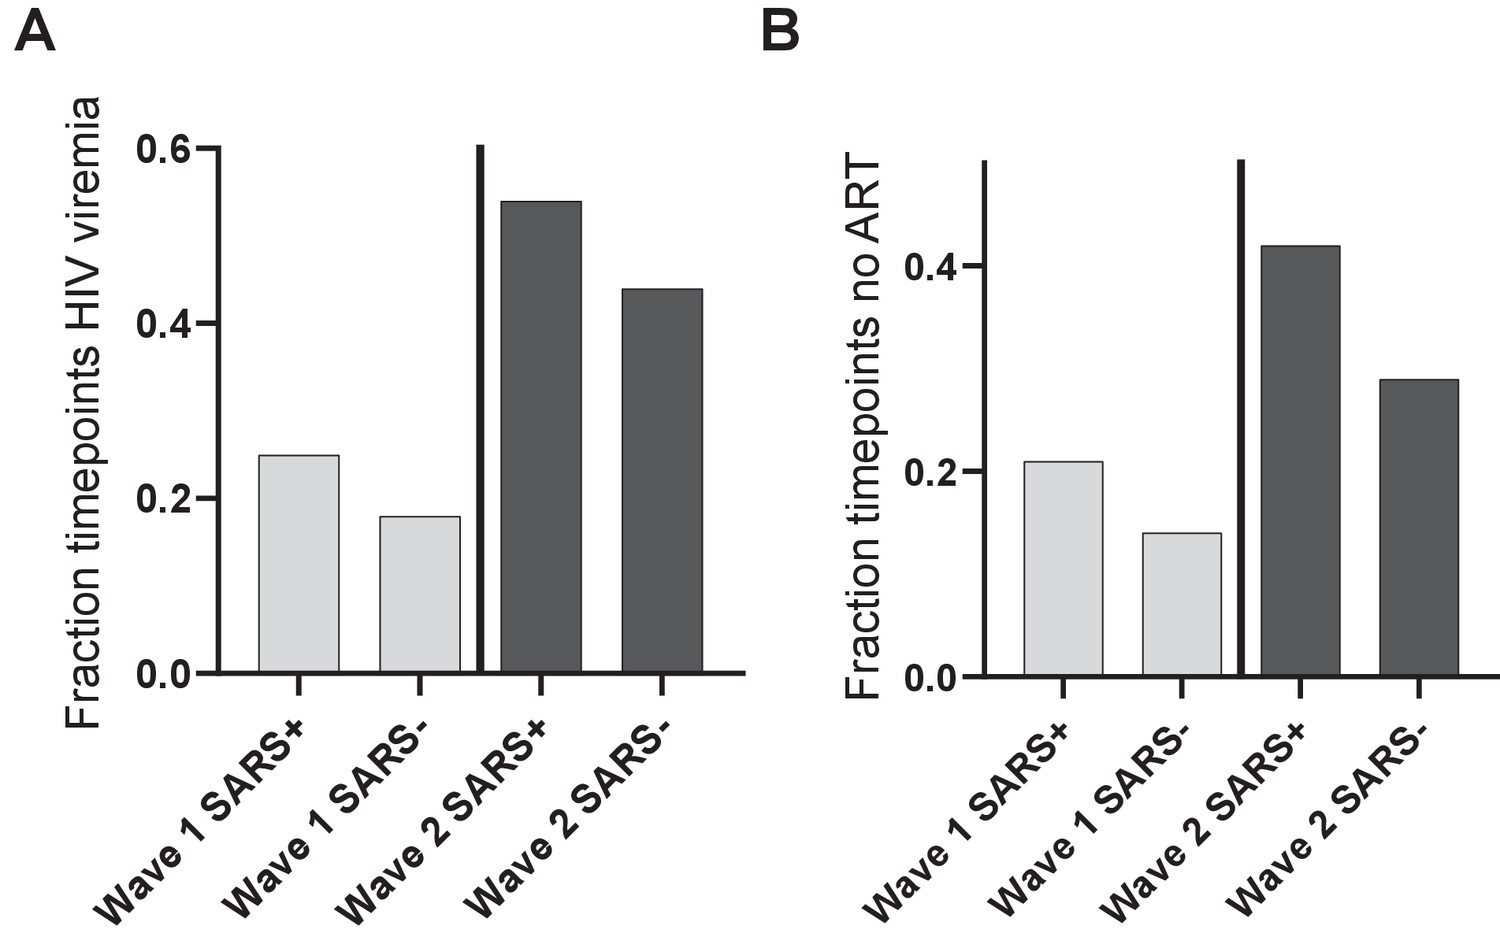
No significant increase in control of HIV infection at convalescence relative to active SARS-CoV-2 infection.
(A) The fraction of measured timepoints at which HIV viremia was detected in infection wave 1 (left bars) or infection wave 2 (right bars) during active SARS-CoV-2 infection (SARS+) or convalescence (SARS-). HIV viremia was calculated as the number of study timepoints in wave 1 or wave 2 with HIV RNA > 200 copies/ml divided by all measured timepoints for PLWH. (B) The fraction of measured timepoints at which no ART was detected in infection wave 1 (left bars) or infection wave 2 (right bars) during active SARS-CoV-2 infection (SARS+) or convalescence (SARS-). The fraction of timepoints with no detectable ART was calculated as the number of study timepoints in wave 1 or wave 2 where the concentration of none of the ART components was above level of quantification divided by all measured PLWH timepoints.
Figure 3 with 1 supplement
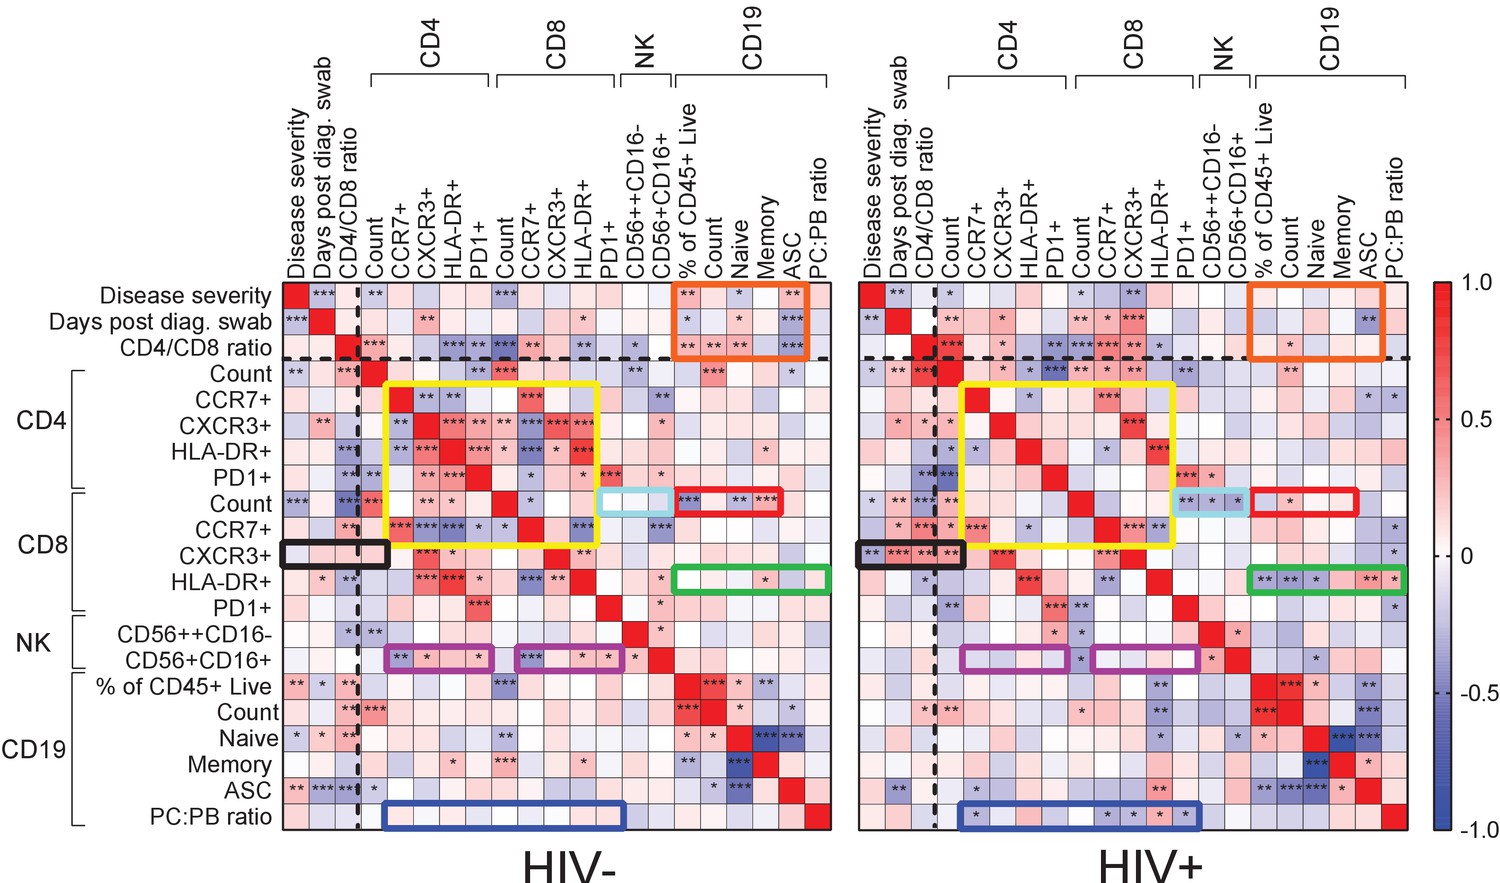
Immune cell and clinical correlates in HIV negative and PLWH groups.
Spearman rank correlation values () are shown from red (1.0) to blue (−1.0). p-values per correlation are *< 0.5; **< 0.01; ***< 0.001. The number of matched pairs for HIV negative participants ranged from 77 to 229 and for PLWH from 48 to 164. Rectangles represent regions where a set of correlations is present in one group and absent in the other. Black dashed lines represent the divide between clinical and cellular parameters.
Figure 3—figure supplement 1
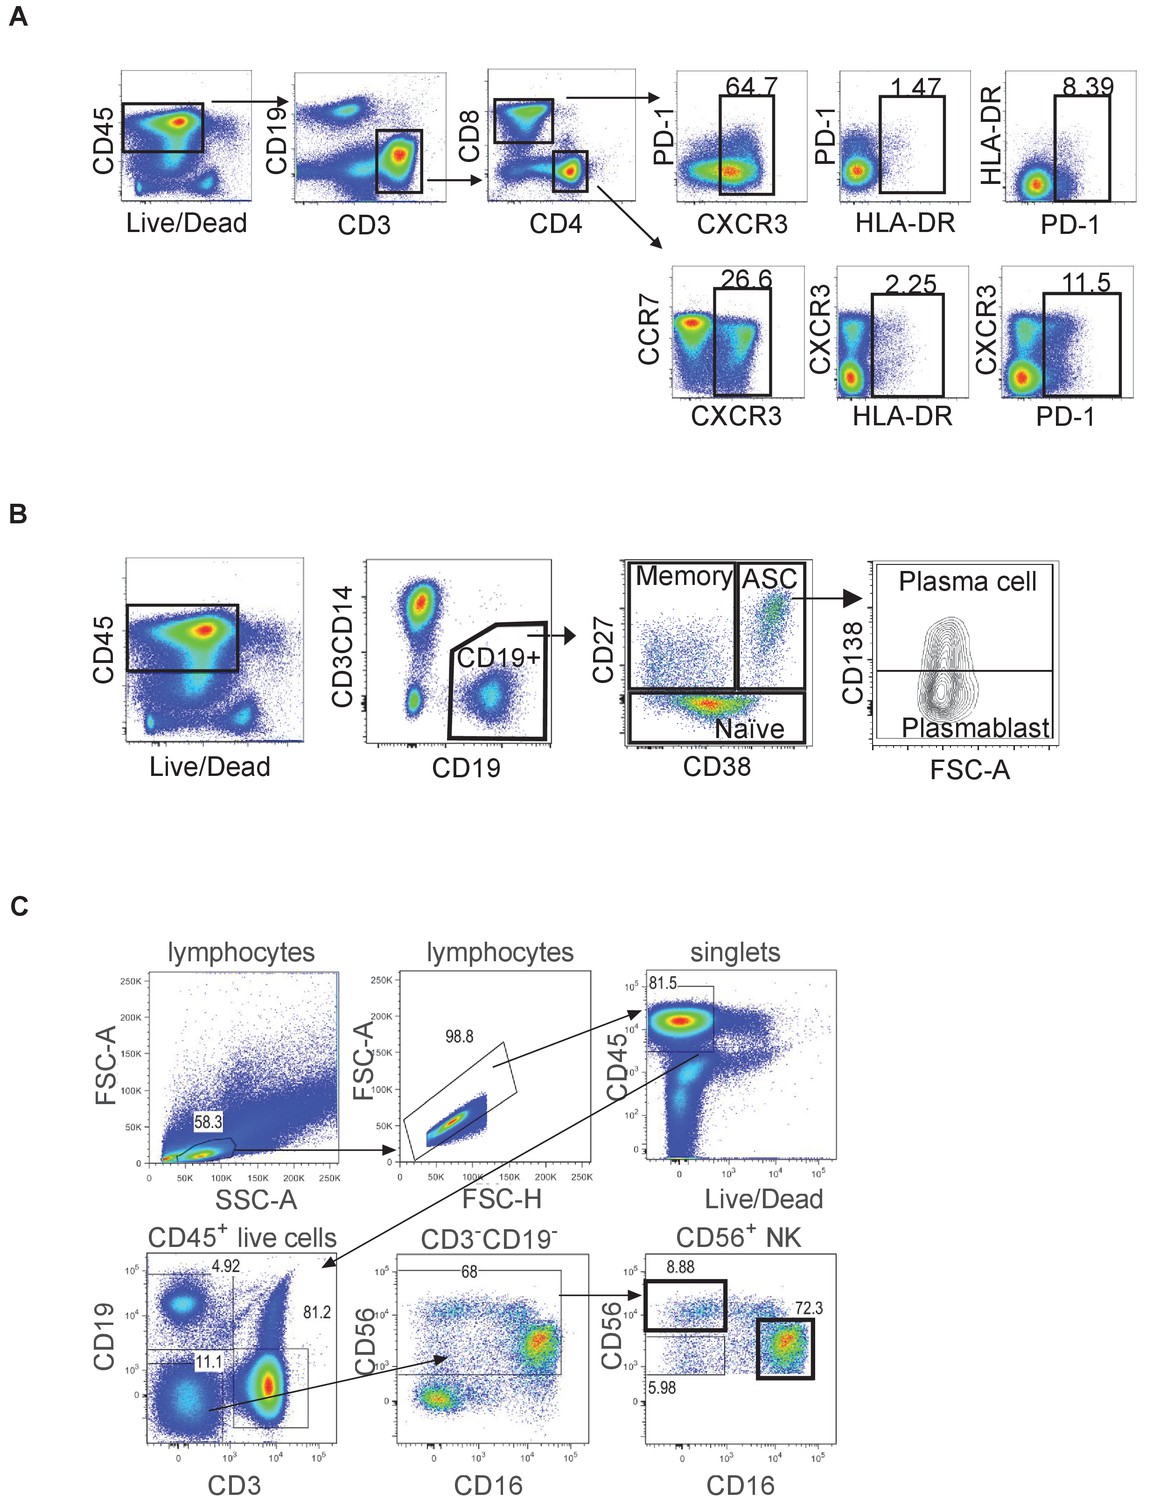
Gating strategy.
(A) Gating of T cell subsets. Live CD3+ cells were gated into CD4+ and CD8+ subsets, which were further divided based on CXCR3, HLA-DR, and PD-1 for CD8 T cells and CXCR3, CCR7, HLA-DR, and PD-1 for CD4 T cells. (B) Gating of B cell subsets. Live CD19+ cells were subdivided into memory, naive, and antibody secreting cells (ASC) based on CD27 and CD38. ASC were further subdivided into plasma cells and plasmablasts based on CD138. (C) Gating of NK cell subsets. Live CD19- CD3- cells were subdivided into CD56+ NK cells, which were further gated into CD56hiCD16- regulatory and CD56+CD16+ cytotoxic NK cell subsets.
Figure 4
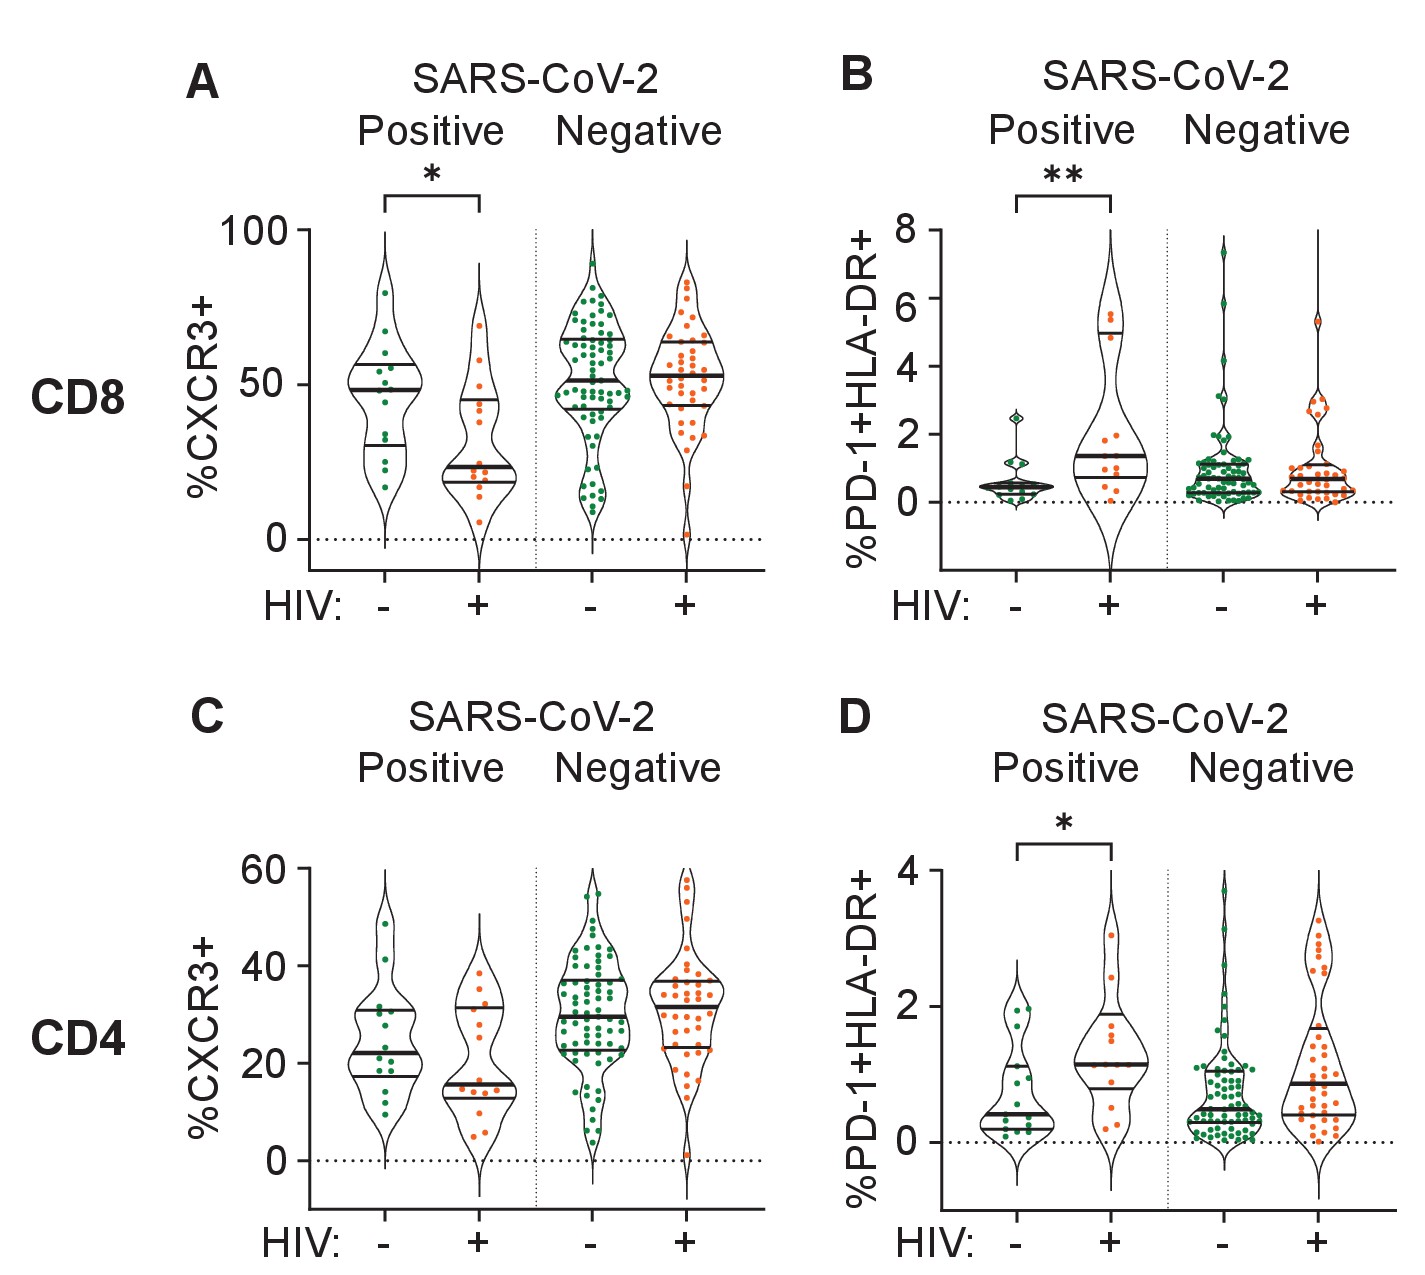
Differences between PLWH and HIV-negative participants in immune cell markers.
Percent of CD8 T cells positive for CXCR3 (A) or double positive for HLA-DR and PD-1 (B). Percent of CD4 T cells positive for CXCR3 (C) or double positive for HLA-DR and PD-1 (D). Data is composed of 15 participant timepoints which were SARS-CoV-2+HIV-, 14 SARS-CoV-2+HIV+, 40 SARS-CoV-2-HIV+, and 74 SARS-CoV-2-HIV-, where SARS-CoV-2+ indicates SARS-CoV-2 RNA was detected in the upper respiratory tract. p-values for differences between PLWH and HIV-negative participants are * <0.05; ** <0.01; *** < 0.001, **** < 0.0001 as determined by the Mann-Whitney U test.
Tables
Table 1
Participant characteristics.
| All (n=236) | HIV- (n = 143, 60.6%) | HIV+ (n=93, 39.4%) | Odds ratio (95% CI) | p-value | |
|---|---|---|---|---|---|
| Demographics | |||||
| Age years, median (IQR) | 45 (35–57) | 49 (35–62) | 41 (35–50) | - | 0.003* |
| Male sex, n (%) | 82 (34.7) | 48 (33.6) | 34 (36.6) | 1.1 (0.7–2.0) | 0.68 |
| Current smoker, n (%) | 13 (5.5) | 4 (2.8) | 9 (9.7) | 3.7 (1.2 – gt10) | 0.038 |
| Comorbidity, n (%) | |||||
| Hypertension#, n=235 | 57 (24.1) | 42 (29.4) | 15 (16.1) | 0.5 (0.2–0.9) | 0.023 |
| Diabetes | 42 (17.8) | 32 (22.4) | 10 (10.8) | 0.4 (0.2–0.9) | 0.024 |
| Obesity#, n=221 | 91 (42.3) | 64 (47.1) | 27 (29.0) | 0.6 (0.3–1.0) | 0.086 |
| Active TB | 10 (4.2) | 1 (0.7) | 9 (9.7) | >10 | 0.001 |
| History TB | 32 (13.6) | 3 (2.1) | 29 (31.2) | >10 | <0.0001 |
| HIV associated parameters | |||||
| HIV viremic, n (% of all HIV) | - | - | 28 (30.1) | - | - |
| Years ART, median (IQR) | - | - | 9.4 (3.9–13.2) | - | - |
| CD4 cells/μL median (IQR) n=221 | 633 (326–974) | 887 (534–1148) | 464 (200–702) | - | <0.0001* |
| CD4/CD8 | 1.2 (0.8–1.7) | 1.6 (1.2–2.1) | 0.8 (0.4–1.1) | - | <0.0001* |
| Disease severity, n (%) | |||||
| Asymptomatic | 33 (14.0) | 25 (17.5) | 8 (8.6) | 0.4 (0.2–1.0) | 0.058 |
| Ambulatory with symptoms | 128 (54.2) | 80 (55.9) | 48 (51.6) | 0.8 (0.5–1.4) | 0.59 |
| Supplemental oxygen | 62 (26.3) | 30 (21.0) | 32 (34.4) | 2.0 (1.1–3.5) | 0.024 |
| Death | 13 (5.5) | 8 (5.6) | 5 (5.4) | 1.0 (0.3–2.9) | >0.99 |
| COVID-19 treatment, n (%) | |||||
| Corticosteroids | 74 (31.2) | 47 (32.9) | 27 (29.0) | 0.8 (0.5–1.5) | 0.57 |
| Anticoagulants | 53 (22.5) | 35 (24.5) | 18 (19.4) | 0.7 (0.4–1.4) | 0.43 |
| Symptom, n (%) | |||||
| Sore throat | 88 (37.3) | 55 (38.5) | 33 (35.5) | 0.9 (0.5–1.5) | 0.68 |
| Runny nose | 53 (22.5) | 30 (21.0) | 23 (24.7) | 1.2 (0.7–2.3) | 0.53 |
| Cough | 153 (64.8) | 91 (63.6) | 62 (66.7) | 1.1 (0.7–2.0) | 0.68 |
| History of fever#, n=235 | 58 (24.7) | 29 (20.3) | 29 (31.2) | 1.8 (1.0–3.3) | 0.063 |
| Shortness of breath | 148 (62.7) | 87 (60.8) | 61 (65.6) | 1.2 (0.7–2.1) | 0.49 |
-
p-value calculated via 2-sided Fisher’s Exact test, except for * which was calculated via Mann-Whitney U test. # Not including pregnancy or unable to be measured.
Table 2
Characteristics by HIV status of participants requiring supplemental oxygen.
| All (n=68) | HIV- (n = 35, 51.5%) | HIV+ (n=33, 48.5%) | Odds ratio (95% CI) | p-value | |
|---|---|---|---|---|---|
| Demographics | |||||
| Age years, median (IQR) | 51 (38–64) | 62 (47–66) | 41 (36–56) | - | 0.003* |
| Male sex, n (%) | 25 (36.8) | 12 (34.3) | 13 (39.4) | 1.2 (0.5–3.3) | 0.80 |
| Current smoker, n (%) | 2 (2.9) | 1 (2.9) | 1 (3.0) | 1.1 (<0.1 – >10) | gt0.99 |
| Comorbidity, n (%) | |||||
| Hypertension | 26 (38.2) | 18 (51.4) | 8 (24.2) | 0.3 (0.1–0.8) | 0.026 |
| Diabetes | 17 (25.0) | 13 (37.1) | 4 (12.1) | 0.2 (0.1–0.8) | 0.025 |
| Obesity#, n=57 | 23 (40.4) | 11 (31.4) | 12 (36.4) | 1.8 (0.6–5.1) | 0.42 |
| Active TB | 6 (8.8) | 1 (2.9) | 5 (15.2) | 6.1 (0.9 – >10) | 0.10 |
| History TB | 16 (23.5) | 2 (5.7) | 14 (42.4) | 12.2 (2.7 – >10) | lt0.001 |
| HIV associated parameters | |||||
| HIV viremic, n (% of all HIV) | - | - | 9 (27.3) | - | - |
| Years ART, median (IQR) | - | - | 11.6 (6.1–13.3) | - | - |
| CD4 cells/μL median (IQR) n=65 | 309 (170–545) | 339 (227–592) | 277 (134–461) | - | 0.072* |
| COVID-19 treatment, n (%) | |||||
| Corticosteroids | 43 (63.2) | 25 (71.4) | 18 (54.5) | 0.5 (0.2–1.3) | 0.21 |
| Anticoagulants | 31 (45.6) | 18 (51.4) | 13 (39.4) | 0.6 (0.2–1.6) | 0.34 |
-
p-value calculated via two-sided Fisher’s Exact test, except for * which was calculated via Mann-Whitney U test. # Not including pregnancy or unable to be measured.
Additional files
-
Source data 1
Participant information.
- https://cdn.elifesciences.org/articles/67397/elife-67397-data1-v3.xlsx
-
Supplementary file 1
Summary of case visits.
- https://cdn.elifesciences.org/articles/67397/elife-67397-supp1-v3.docx
-
Supplementary file 2
Timing of enrollment in PLWH and HIV negative participants.
- https://cdn.elifesciences.org/articles/67397/elife-67397-supp2-v3.docx
-
Supplementary file 3
ART regimen in PLWH as determined by LC-MS/MS.
- https://cdn.elifesciences.org/articles/67397/elife-67397-supp3-v3.docx
-
Supplementary file 4
Infection wave 1 COVID-19 disease severity by HIV status.
- https://cdn.elifesciences.org/articles/67397/elife-67397-supp4-v3.docx
-
Supplementary file 5
Infection wave 2 COVID-19 disease severity by HIV status.
- https://cdn.elifesciences.org/articles/67397/elife-67397-supp5-v3.docx
-
Supplementary file 6
Comparison between HIV negative participants requiring and not requiring supplemental oxygen.
- https://cdn.elifesciences.org/articles/67397/elife-67397-supp6-v3.docx
-
Supplementary file 7
Comparison between PLWH requiring and not requiring supplemental oxygen.
- https://cdn.elifesciences.org/articles/67397/elife-67397-supp7-v3.docx
-
Transparent reporting form
- https://cdn.elifesciences.org/articles/67397/elife-67397-transrepform-v3.docx
Download links
A two-part list of links to download the article, or parts of the article, in various formats.
Downloads (link to download the article as PDF)
Open citations (links to open the citations from this article in various online reference manager services)
Cite this article (links to download the citations from this article in formats compatible with various reference manager tools)
HIV status alters disease severity and immune cell responses in Beta variant SARS-CoV-2 infection wave
eLife 10:e67397.
https://doi.org/10.7554/eLife.67397


