Loss of Tsc1 in cerebellar Purkinje cells induces transcriptional and translation changes in FMRP target transcripts
- Department of Neurology, Rosamund Stone Zander Translational Neuroscience Center, Kirby Neurobiology Center, Boston Children’s Hospital, United States
- Department of Cardiology, Boston Children’s Hospital, United States
- Harvard Medical School, United States
- Roche Pharma Research and Early Development, Neuroscience and Rare Diseases, Roche Innovation Center Basel, Switzerland
Figures
Figure 1 with 1 supplement
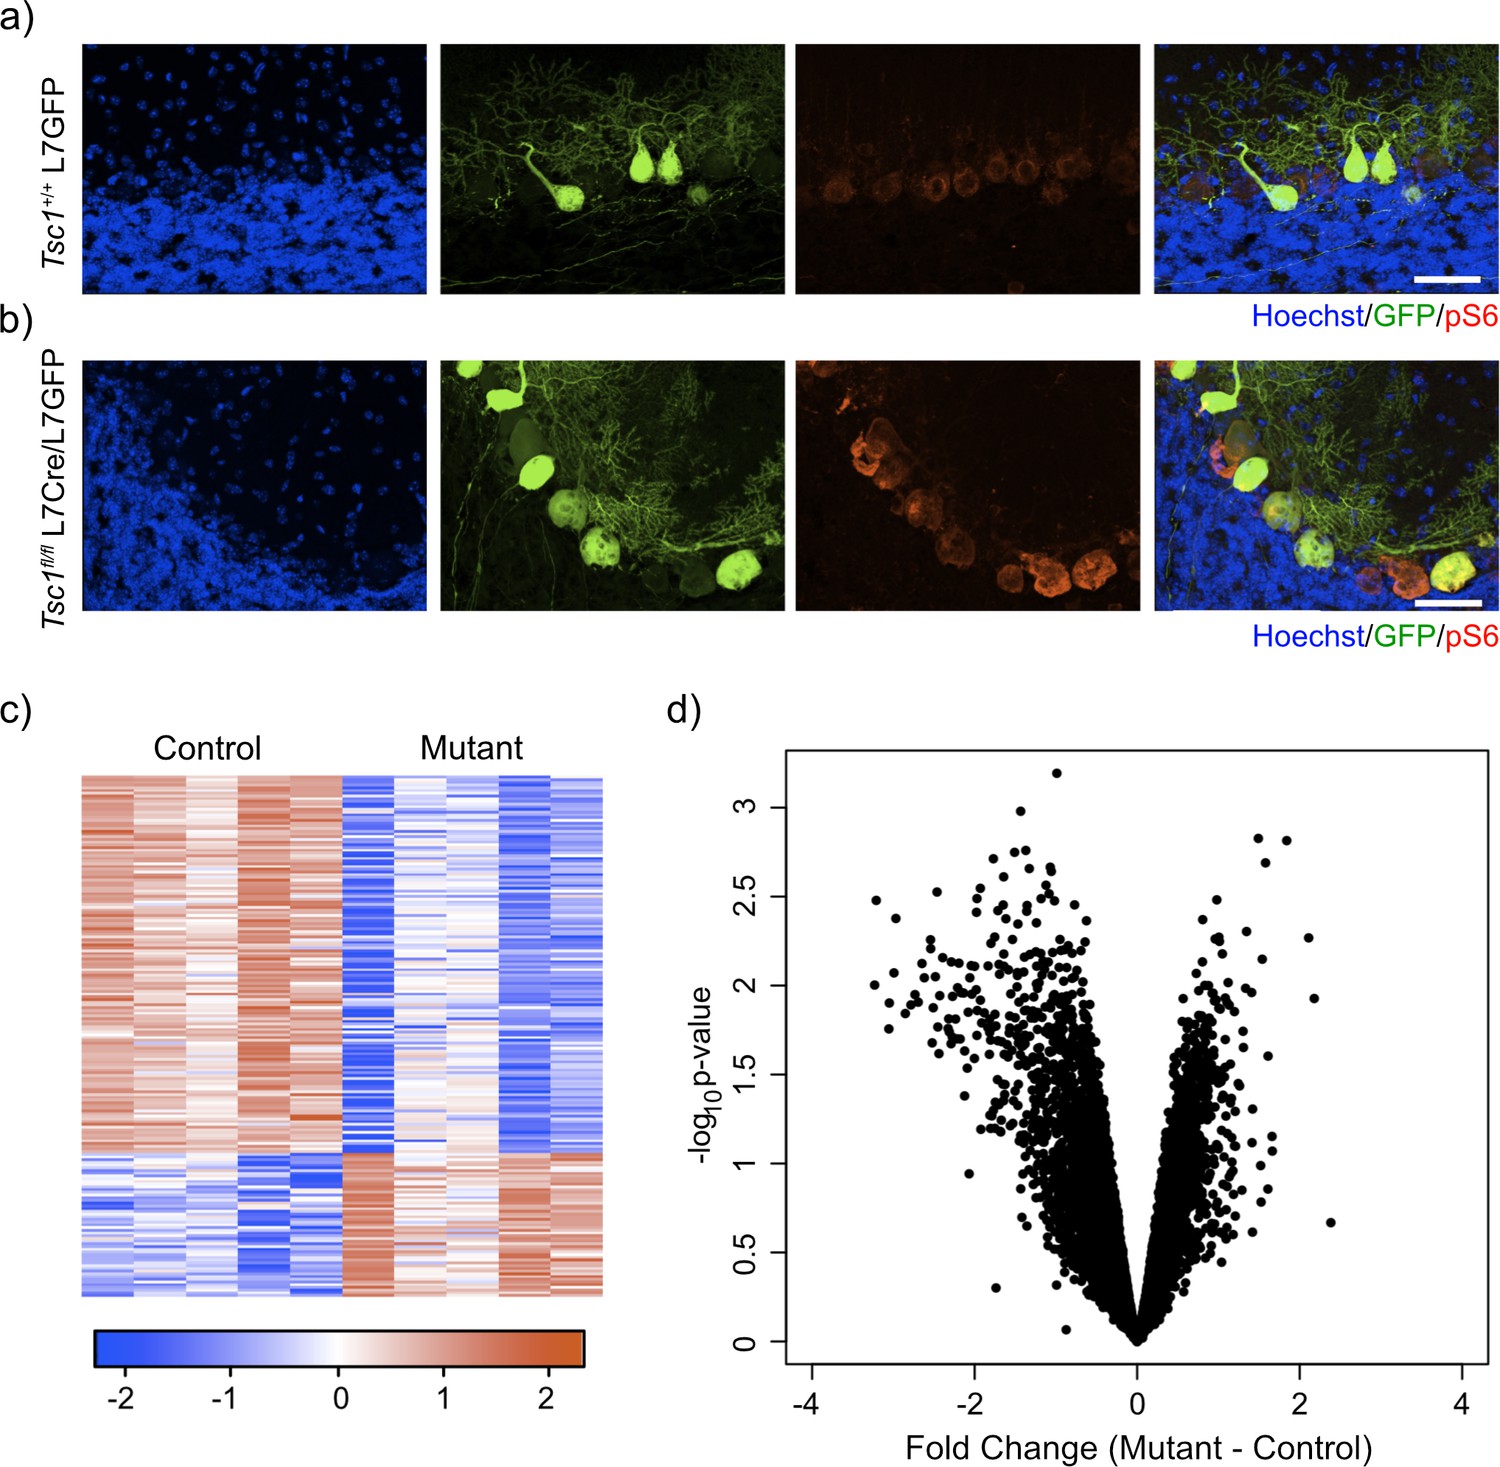
Labeling and sorting Tsc1fl/fl PCs show predominance of downregulation gene expression.
(a) Immunocytochemical characterization of wild-type control L7-GFP+ mouse PCs on P21 mouse cerebellum. Cell nuclei were stained with Hoechst. GFP+ PCs had dim expression of phosphorylated S6 (red). Scale bar 50 μm. (b) Immunocytochemical characterization of Tsc1fl/fl L7Cre+L7-GFP+ mouse PCs on P21 mouse cerebellum. Cell nuclei were stained with Hoechst. GFP+ PCs were strongly positive for pS6 (red). Scale bar 50 μm. (c) Heatmap of differentially expressed genes in mutant (Tsc1fl/fl; N = 4) vs control (Tsc1+/+; N = 4) PCs (FC > 2 and p-value<0.01; n = 679 genes). Each row of the heatmap represents the scaled expression of one gene, where red corresponds to higher relative expression and blue corresponds to lower relative expression. (d) This volcano plot shows the relationship between fold change, calculated Mutant-Control, and p-value across all genes. A majority of genes in this dataset demonstrate downregulation in the mutant PCs compared to control.
Figure 1—figure supplement 1
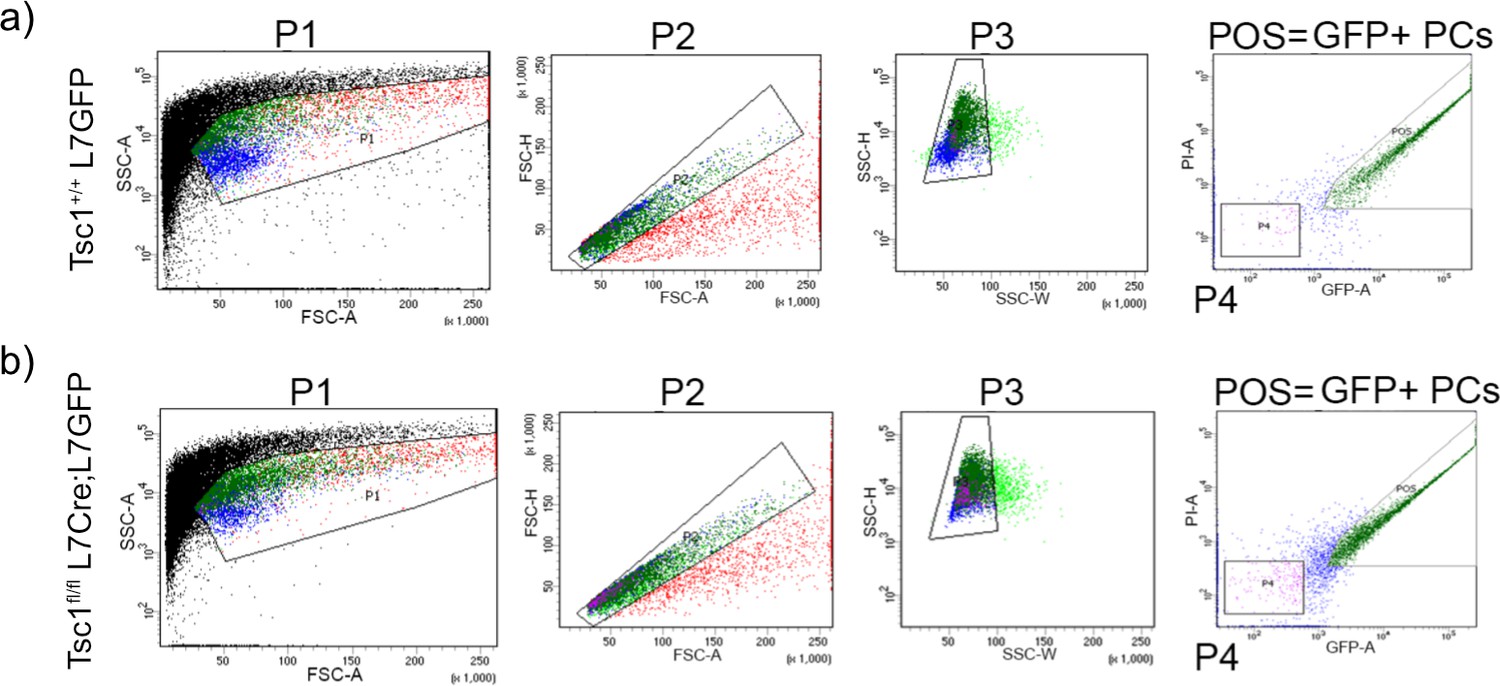
Gating strategy for FACS isolation of GFP labeled PCs.
The gating for isolation of GFP-positive PCs is shown for (a) Tsc1+/+ L7GFP and (b) Tsc1fl/fl L7Cre;L7GFP animals. Cells were identified from debris based on the forward and side scatter (P1). Single cells were identified using FSC-H (P2) and SSC-H/SSC-W (P3). Finally, GFP-positive cells were selected and sorted into separate tubes (gate: POS).
Figure 2 with 1 supplement
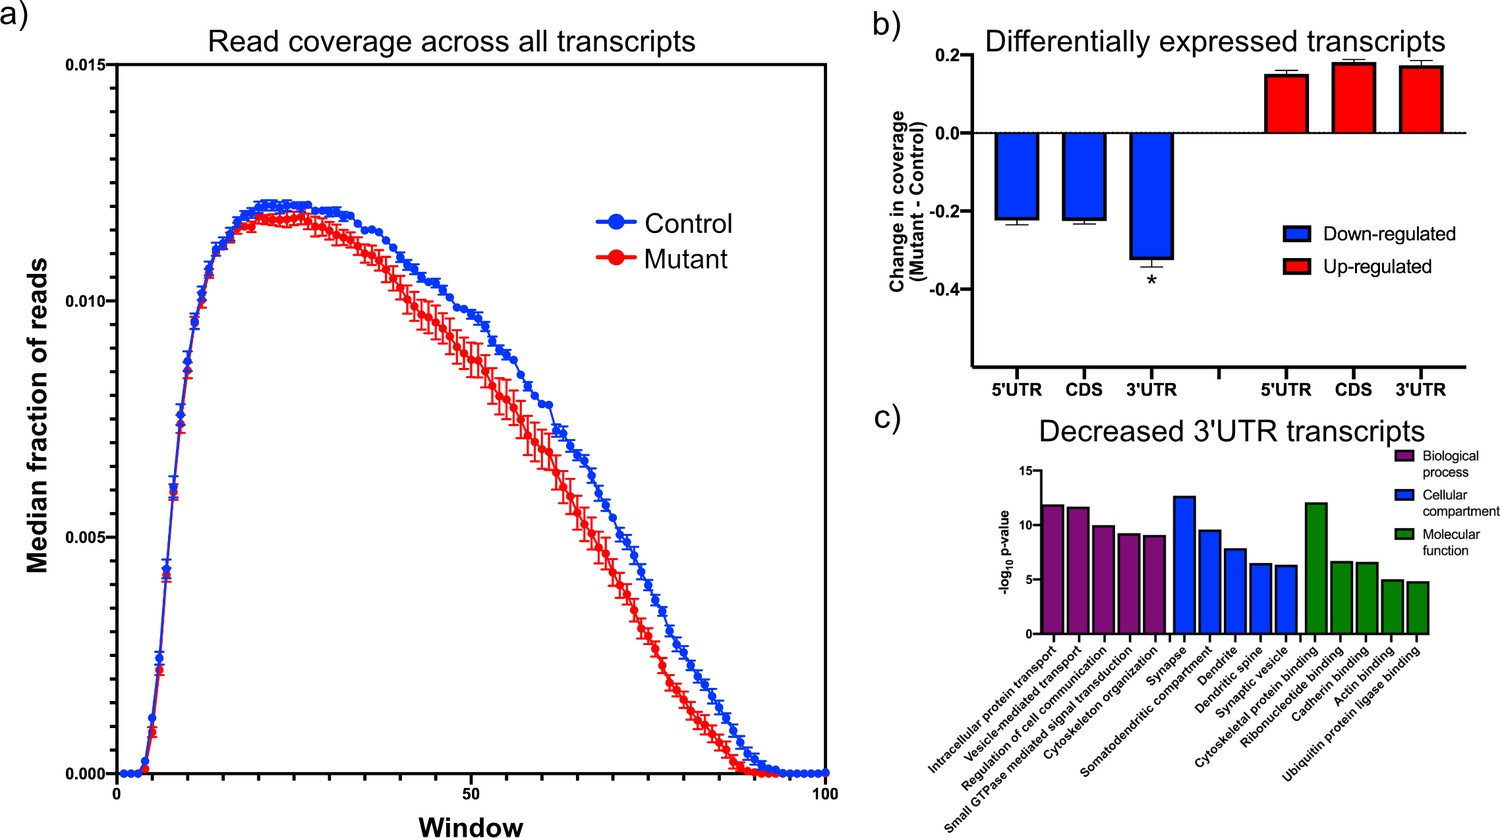
Downregulated transcripts in Tsc1-deficient PCs display enhanced reduction in the 3’UTR and are enriched in synaptic genes.
(a) This plot shows the median coverage of reads across all downregulated transcripts. Each transcript was divided into 100 equally sized intervals and coverage was calculated across each of these intervals. The error bars show the SEM between five animals of each genotype, where mutant PCs are shown in red and control PCs are shown in blue. There is a bias for fewer reads across the 3’ regions of transcripts in mutant PCs. (b) This bar plot shows the read coverage across different segments of each transcript for downregulated (blue) and upregulated (red) transcripts. Read coverage was calculated separately for the 5’ UTR, coding sequence, and 3’ UTR, and the error bars represent SEM. The 3’ UTR of downregulated genes in mutant PCs demonstrate significantly reduced coverage compared to the 5’ UTR and coding sequence (*p<0.001, ANOVA with Tukey’s post hoc test). (c) This bar plot shows the enrichment of functional gene ontology categories among the downregulated transcripts with enhanced reduction in the 3’ UTR. Several synapse-related categories are among the most enriched categories.
Figure 2—figure supplement 1
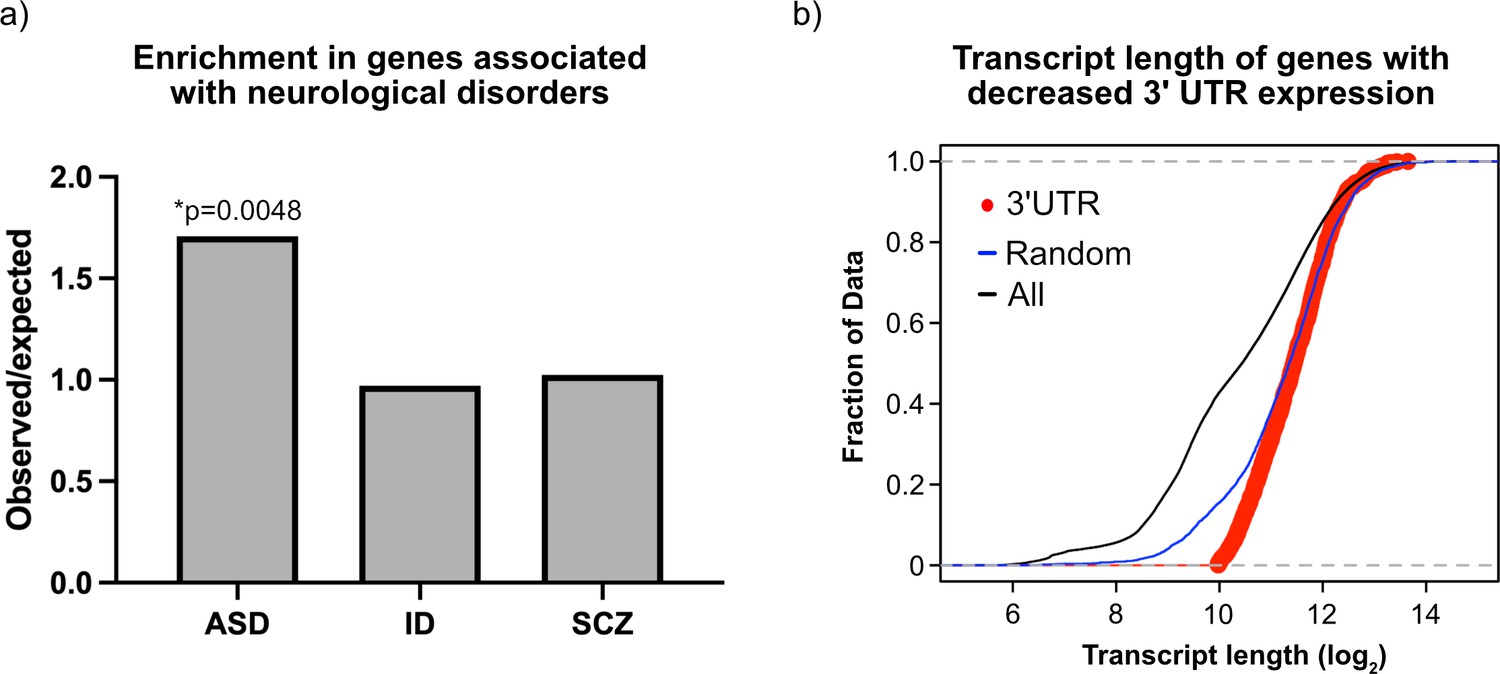
Characterization of transcripts with reduced 3’UTR expression.
(a) Barplot of observed/expected ratios for transcripts with reduced 3’UTR expression in the following sets of genes associated with neurological disorders: (1) ASD – genes from SFARI (https://gene.sfari.org/) with a score of 1, (2) intellectual disability (ID) from Parikshak et al., 2013, and (3) schizophrenia (SCZ) from Wang et al., 2018. p-values were calculated using a hypergeometric probability. (b) ECDF plot of transcript length of transcripts with reduced 3’UTR expression (red), a random set of transcripts with similar expression distribution (n = 2934) to those with reduced 3’UTR expression (blue), and all transcripts (black). Genes with reduced 3’UTR expression were significantly longer than similarly expressed genes (p=8.6e-5; Mann–Whitney U-test) and all detected transcripts (p<2.2e-16; Mann–Whitney U-test).
Figure 3
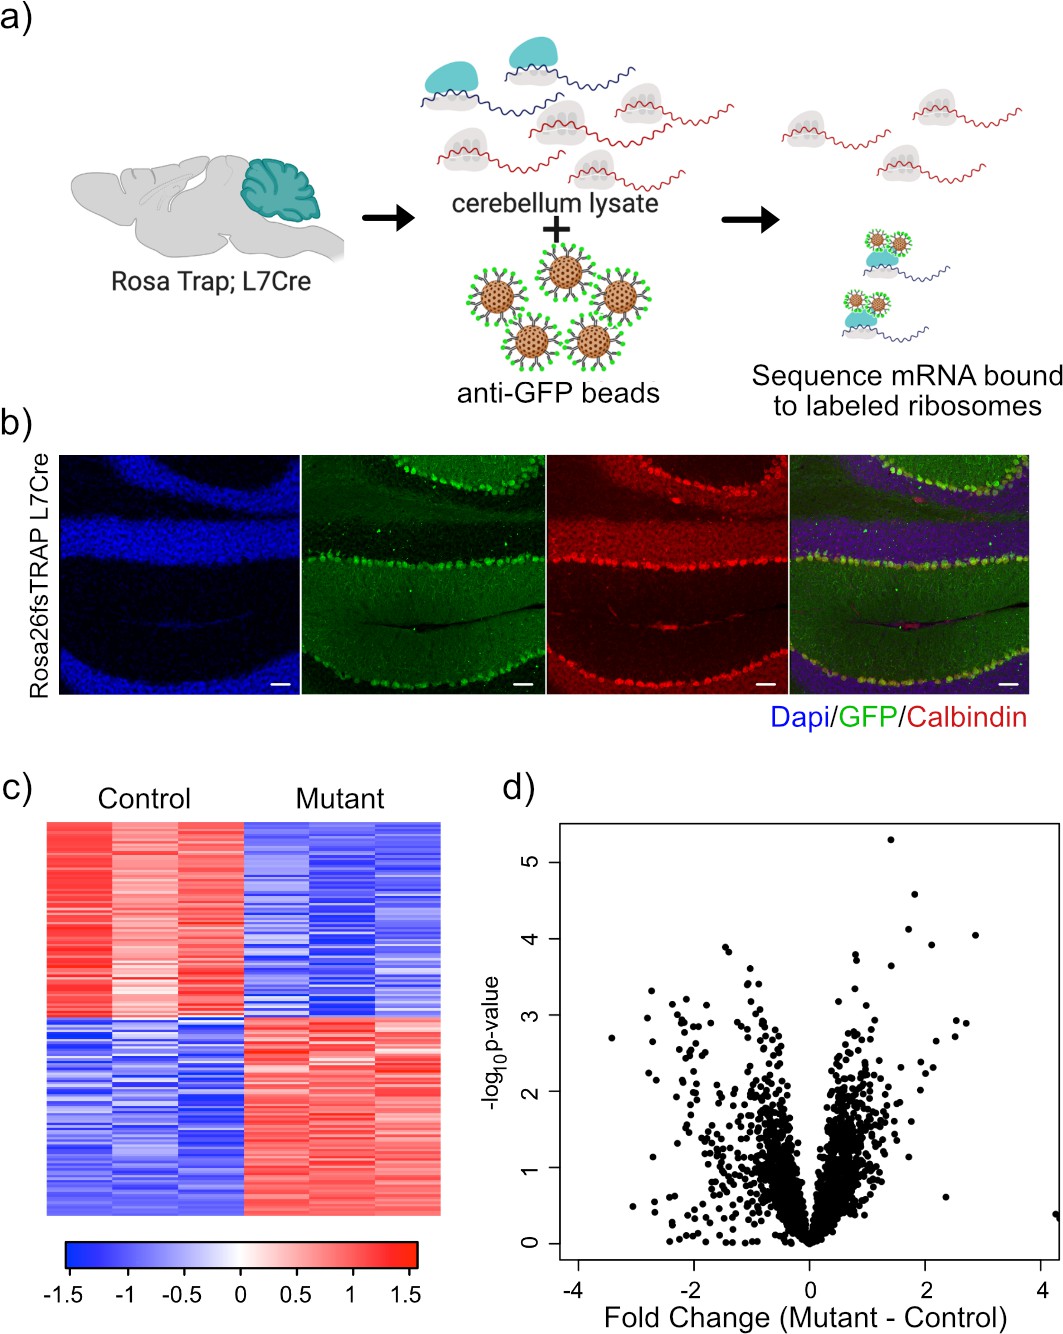
Expression of GFP-tagged ribosomes and ribosomal binding of transcripts in PCs.
(a) Schematic of TRAP protocol for identifying ribosomally bound transcripts specifically within PCs. (b) Anti-GFP immunofluorescence of in Rosa26fsTRAP L7Cre animals shows labeling of the PCs of the cerebellum. Sagittal sections from P56 Rosa-Trap animals expressing Cre under Pcp2 promoter (L7Cre) were stained with GFP (green), calbindin (red), and DAPI (blue). Scale bars, 10 µm. (c) Heatmap of TRAP levels of genes that were previously identified to be downregulated at the transcript level. Each row of the heatmap represents the scaled expression of one transcript, where red corresponds to higher relative expression and blue corresponds to lower relative expression. (d) This histogram shows the fold changes of the TRAP values for the previously identified downregulated transcripts between mutant and control PCs. Despite being downregulated at the total mRNA level, these transcripts generally show maintained ribosomal binding.
Figure 4
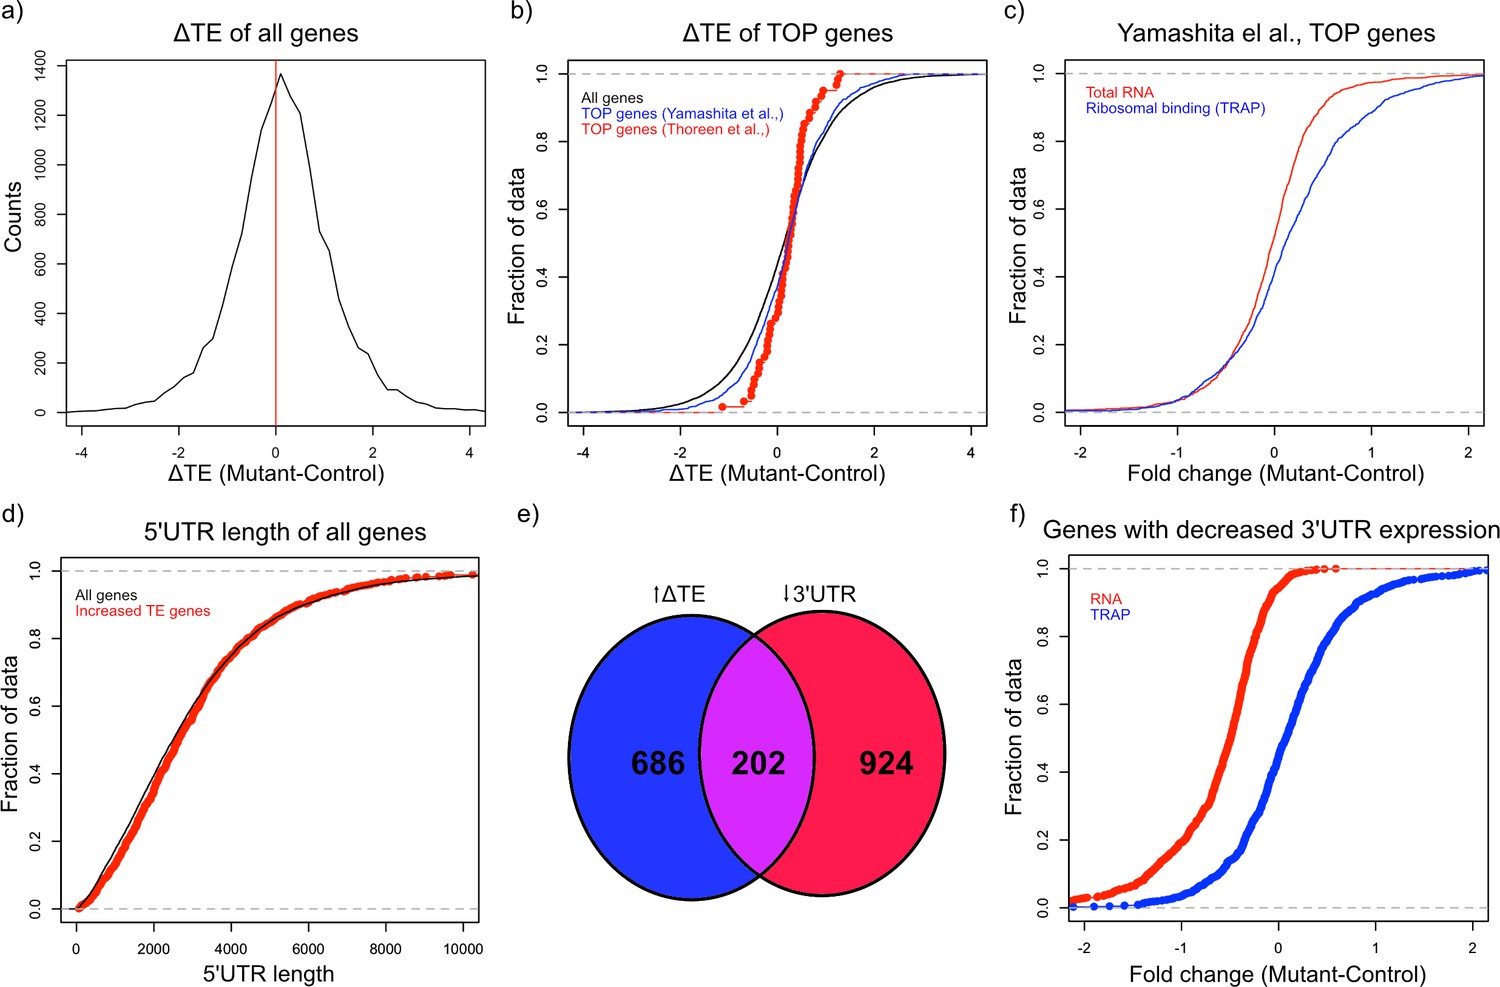
Alterations in TE in Tsc1fl/fl PCs.
(a) This histogram shows the ΔTE between mutant and control PCs, and the vertical red line in the middle identifies the point where ΔTE = 0. A majority of the genes are situated to the right of the red line demonstrating increased ΔTE in mutant PCs. (b) These empiric cumulative distribution function (ECDF) plots show the distribution for all genes (black), known TOP genes from Thoreen et al. (red), and predicted TOP genes from Yamashita et al. (blue). There is a slight shift towards higher ΔTE for Yamashita et al. predicted TOP genes compared to all genes (p=0.004, T-test). (c) ECDF plot of fold changes for the total RNA and TRAP data for the predicted TOP genes from Yamashita et al., demonstrating that these genes have a slightly higher ribosomal binding in CC PCs without a change in the total RNA levels. (d) ECDF plot of the 5’ UTR length for all genes (black) and genes with significantly increased ΔTE (red). There is no difference between these two groups of genes (p>0.05, Mann–Whitney U-test). (e) Venn diagram showing the highly significant overlap between genes with significantly increased ΔTE and downregulated transcripts with reduced coverage in the 3’ UTR. (f) ECDF plot of fold changes for the total RNA and TRAP data for downregulated transcripts with reduced 3’ UTR coverage. These data show that the increased ΔTE of these genes is due to reduced total RNA levels with maintained ribosomal binding levels.
Figure 5
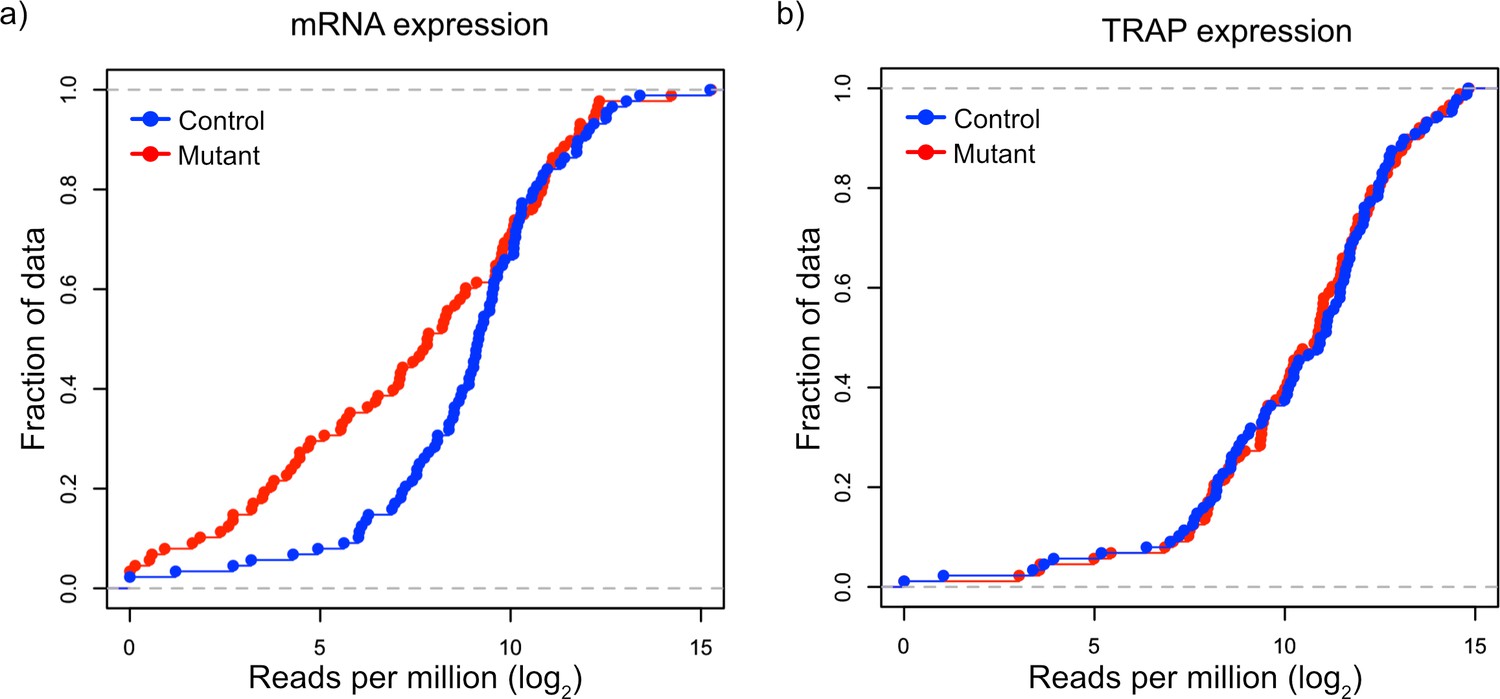
Validation of downregulation of transcripts and maintained ribosomal loading in Tsc1-deficient PCs.
(a) This cumulative distribution function shows the distribution of total mRNA expression from sorted PCs for 150 FMRP target genes, previously found to be downregulated in mutant PCs, between mutant (red) and control (blue) PCs. (b) This cumulative distribution function shows the TRAP values for the same 150 genes between mutant (red) and control (blue) PCs. Despite the obvious downregulation of many genes at the total mRNA level, the ribosomal loading of these transcripts appears mostly unchanged.
Figure 6 with 1 supplement
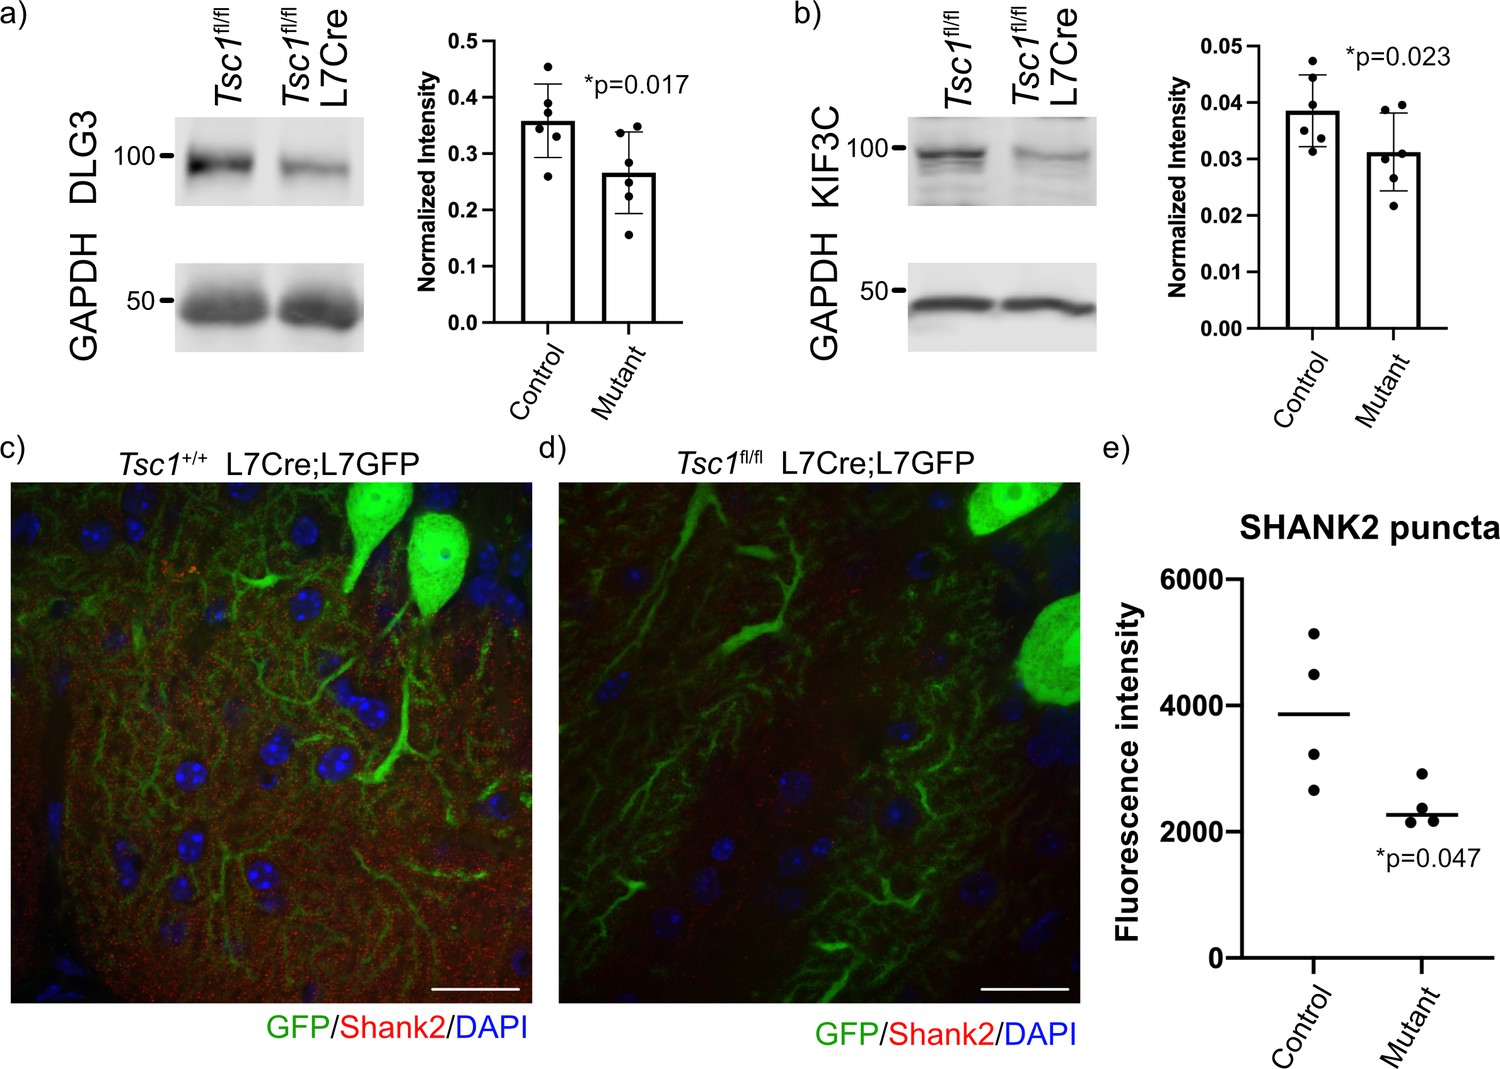
Reduced expression of FMRP targets in mutant cerebellum.
Protein expression of (a) DLG3 and (b) KIF3C assessed by western blot of whole cerebellum lysates from control (Tsc1fl/fl) and mutant (Tsc1fl/fl L7Cre) animals (N = 6). Bands were quantified using densitometry, and p-values calculated using a paired T-test, where littermates were paired together. Confocal images of staining of SHANK2 in (c) Tsc1+/+ L7Cre/L7GFP and (d) Tsc1fl/fl L7Cre/L7GFP animals. SHANK2 is present in punctae along PC dendrites in the molecular layer, and GFP-labeled PCs are shown in green. Scale bars = 20 μm. (e) Bar plot showing the quantification of the intensity of SHANK2+ punctae in control and mutant animals. Each data point represents the mean value across 10 images from three–four independent slices from the same animal. N = 4 animals. p=0.047 (T-test).
Figure 6—figure supplement 1
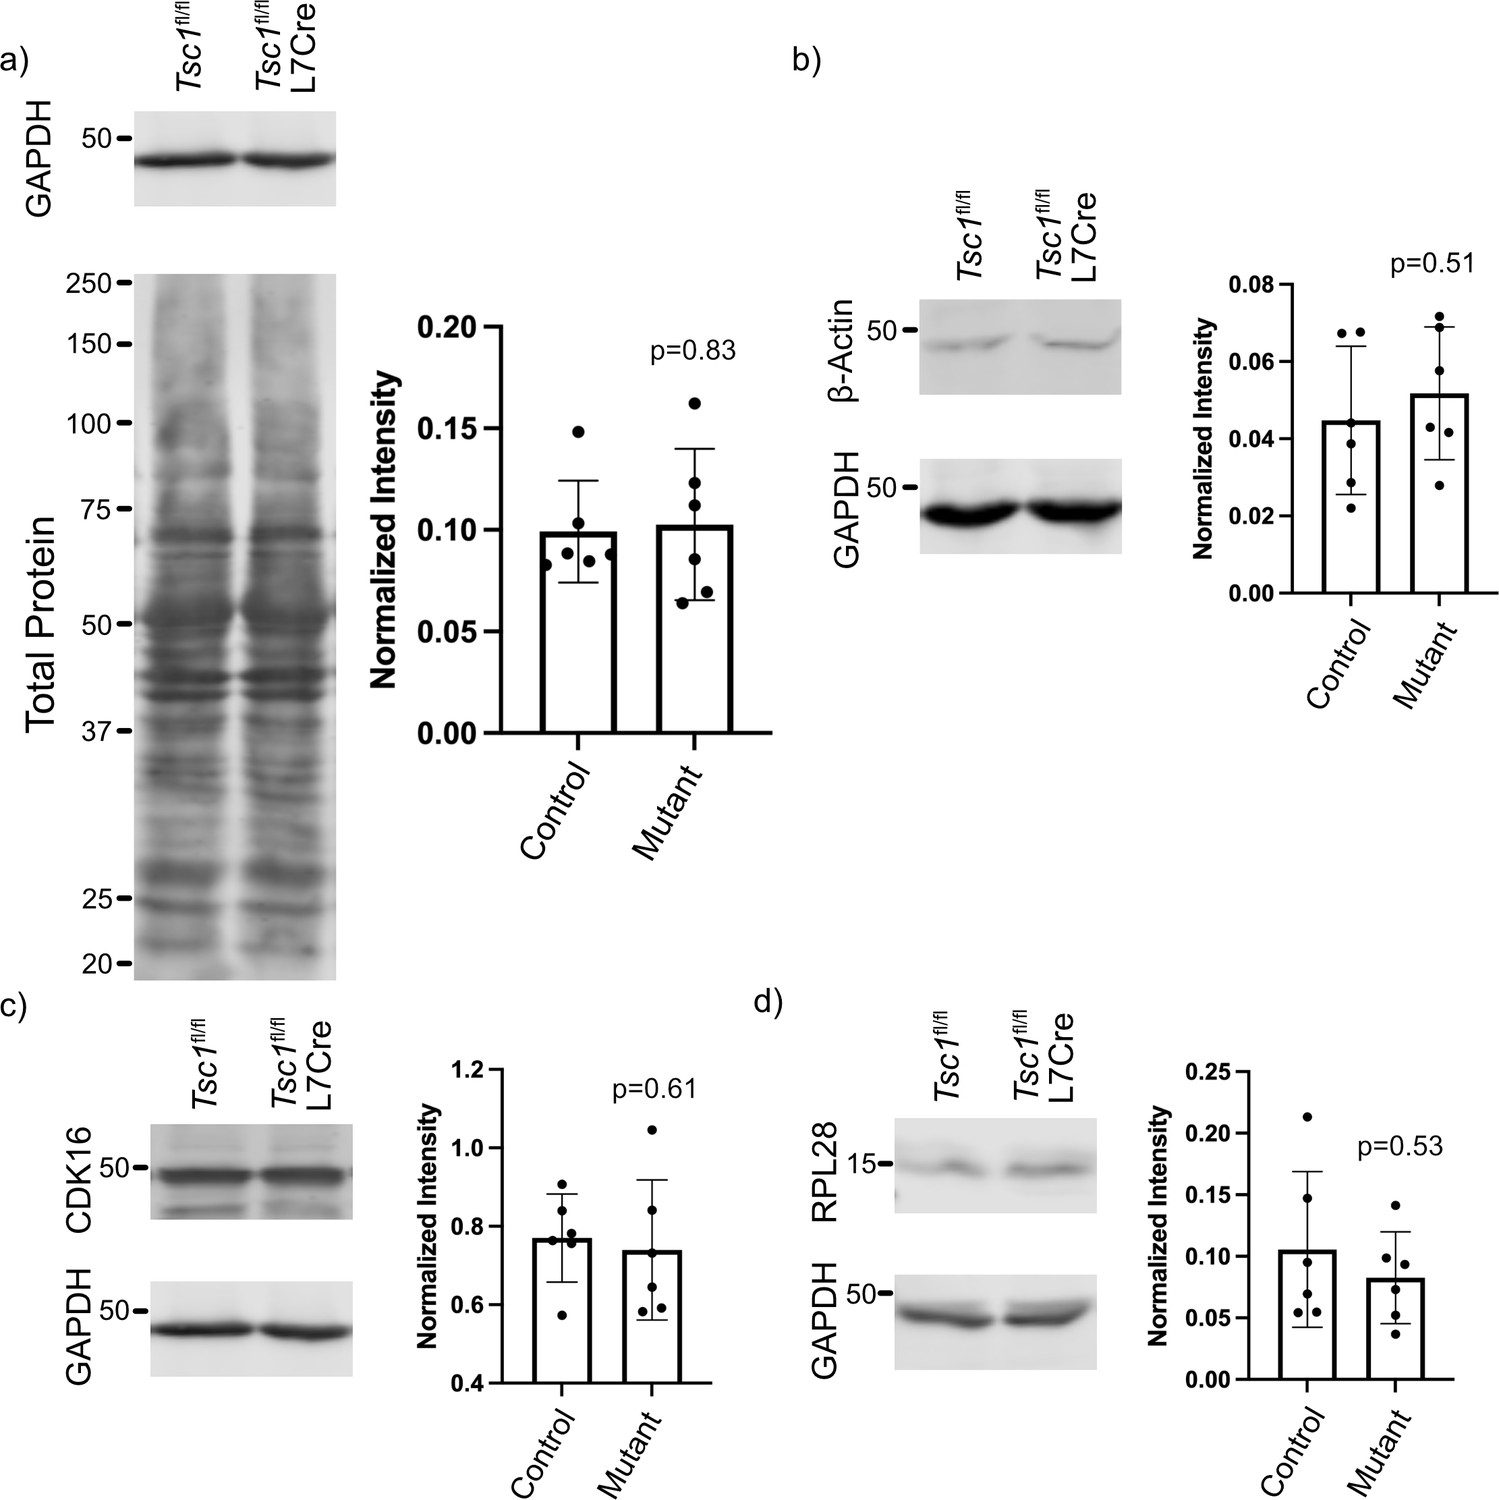
Western blot controls and 5’ TOP genes.
(a) Western blot of GAPDH and total protein showing that GAPDH is unchanged between mutant and control cerebellum, verifying its use as a loading control. (b) Western blot of β-actin in mutant and control cerebellum showing no significant change between genotypes. (c) Western blot of the predicted 5’ TOP gene, Cdk16, showing no significant change between mutant and control cerebellum. (d) Western blot of the predicted 5’ TOP gene, Rpl28, showing no significant change between mutant and control cerebellum. Each protein was assessed in six animals per genotype, and p-values were calculated using a paired T-test by pairing littermates together.
Tables
Key resources table
| Reagent type (species) or resource | Designation | Source or reference | Identifiers | Additional information |
|---|---|---|---|---|
| Strain, strain background (Mus musculus) | Tsc1fl/fl | Jackson Labs | (Stock# 005680) | |
| Strain, strain background (Mus musculus) | Rosa26fsTRAP | Jackson Labs | (Stock# 022367) | |
| Strain, strain background (Mus musculus) | L7Cre | Jackson Labs | (Stock# 010536) | |
| Strain, strain background (Mus musculus) | L7GFP | Jackson Labs | (Stock# 004690) | |
| Antibody | Anti-GFP (Mouse monoclonal) | Memorial Sloan Kettering Centre | HtzGFP-19F7 and HtzGFP-19C8 | 50 µg per IP |
| Antibody | Anti-DLG3 (PSD93) (Mouse monoclonal) | Biolegend | 818302 | (1:1000) |
| Antibody | Anti-KIF3C (Rabbit polyclonal) | Proteintech | 144333–1-AP | (1:800) |
| Antibody | Anti-CDK16 (PCTAIRE) (Rabbit polyclonal) | Proteintech | 10102–1-AP | (1:750) |
| Antibody | Anti-Rpl28 (Rabbit polyclonal) | Proteintech | 16649–1-AP | (1:1000) |
| Antibody | Anti-Gapdh (Mouse monoclonal) | ThermoFisher | AM4300 | (1:10,000) |
| Antibody | Anti-B Actin (Mouse Monoclonal) | Cell Signaling | 3700 | (1:5000) |
| Antibody | Anti-GFP (Chicken polyclonal) | ThermoFisher | A10262 | (1:1000) |
| Antibody | Anti-Shank2 (Rabbit polyclonal) | ThermoFisher | PA5-78652 | (1:500) |
| Peptide, recombinant protein | Purified Recombinant Biotinylated Protein L | Pierce | 29997 | |
| Chemical compound, drug | Streptavidin MyOne T1 Dynabeads | ThermoFisher | 65601 | |
| Chemical compound, drug | Cycloheximide | Sigma Aldrich | 01810–1G | |
| Chemical compound, drug | RNasin | Promega | N2515 | |
| Chemical compound, drug | Superasin | ThermoFisher | AM2694 | |
| Chemical compound, drug | DHPC | Avanti Polar Lipids | 850306 | |
| Chemical compound, drug | TRIzol | ThermoFisher | 15596026 | |
| Chemical compound, drug | Papain | Worthington | LS003126 | |
| Chemical compound, drug | DNase I | Worthington | LK003172 | |
| Commercial assay or kit | RNAeasy Minelute kit | Qiagen | 74204 | |
| Software, algorithm | R v4.0.2 | https://cran.r-project.org/ | ||
| Software, algorithm | Prism v9 | GraphPad | ||
| Software, algorithm | Python v2.7 | https://www.python.org/ |
Additional files
-
Source data 1
Raw and annotated western blot images.
- https://cdn.elifesciences.org/articles/67399/elife-67399-data1-v1.zip
-
Supplementary file 1
Supplemental table 1.
- https://cdn.elifesciences.org/articles/67399/elife-67399-supp1-v1.csv
-
Supplementary file 2
Supplemental table 2.
- https://cdn.elifesciences.org/articles/67399/elife-67399-supp2-v1.csv
-
Supplementary file 3
Supplemental table 3.
- https://cdn.elifesciences.org/articles/67399/elife-67399-supp3-v1.csv
-
Supplementary file 4
Supplemental table 4.
- https://cdn.elifesciences.org/articles/67399/elife-67399-supp4-v1.csv
-
Supplementary file 5
Supplemental table 5.
- https://cdn.elifesciences.org/articles/67399/elife-67399-supp5-v1.csv
-
Transparent reporting form
- https://cdn.elifesciences.org/articles/67399/elife-67399-transrepform-v1.pdf
Download links
A two-part list of links to download the article, or parts of the article, in various formats.
Downloads (link to download the article as PDF)
Open citations (links to open the citations from this article in various online reference manager services)
Cite this article (links to download the citations from this article in formats compatible with various reference manager tools)
Loss of Tsc1 in cerebellar Purkinje cells induces transcriptional and translation changes in FMRP target transcripts
eLife 10:e67399.
https://doi.org/10.7554/eLife.67399


