Protomer alignment modulates specificity of RNA substrate recognition by Ire1
- Department of Biochemistry and Biophysics, University of California San Francisco, United States
- Howard Hughes Medical Institute, United States
- Department of Pharmaceutical Chemistry, University of California at San Francisco, United States
- Department of Microbiology and Immunology, University of California at San Francisco, United States
- Department of Molecular Biophysics and Biochemistry, Yale School of Medicine, United States
- Department of Cellular and Molecular Pharmacology, University of California at San Francisco, United States
Figures
Figure 1 with 1 supplement
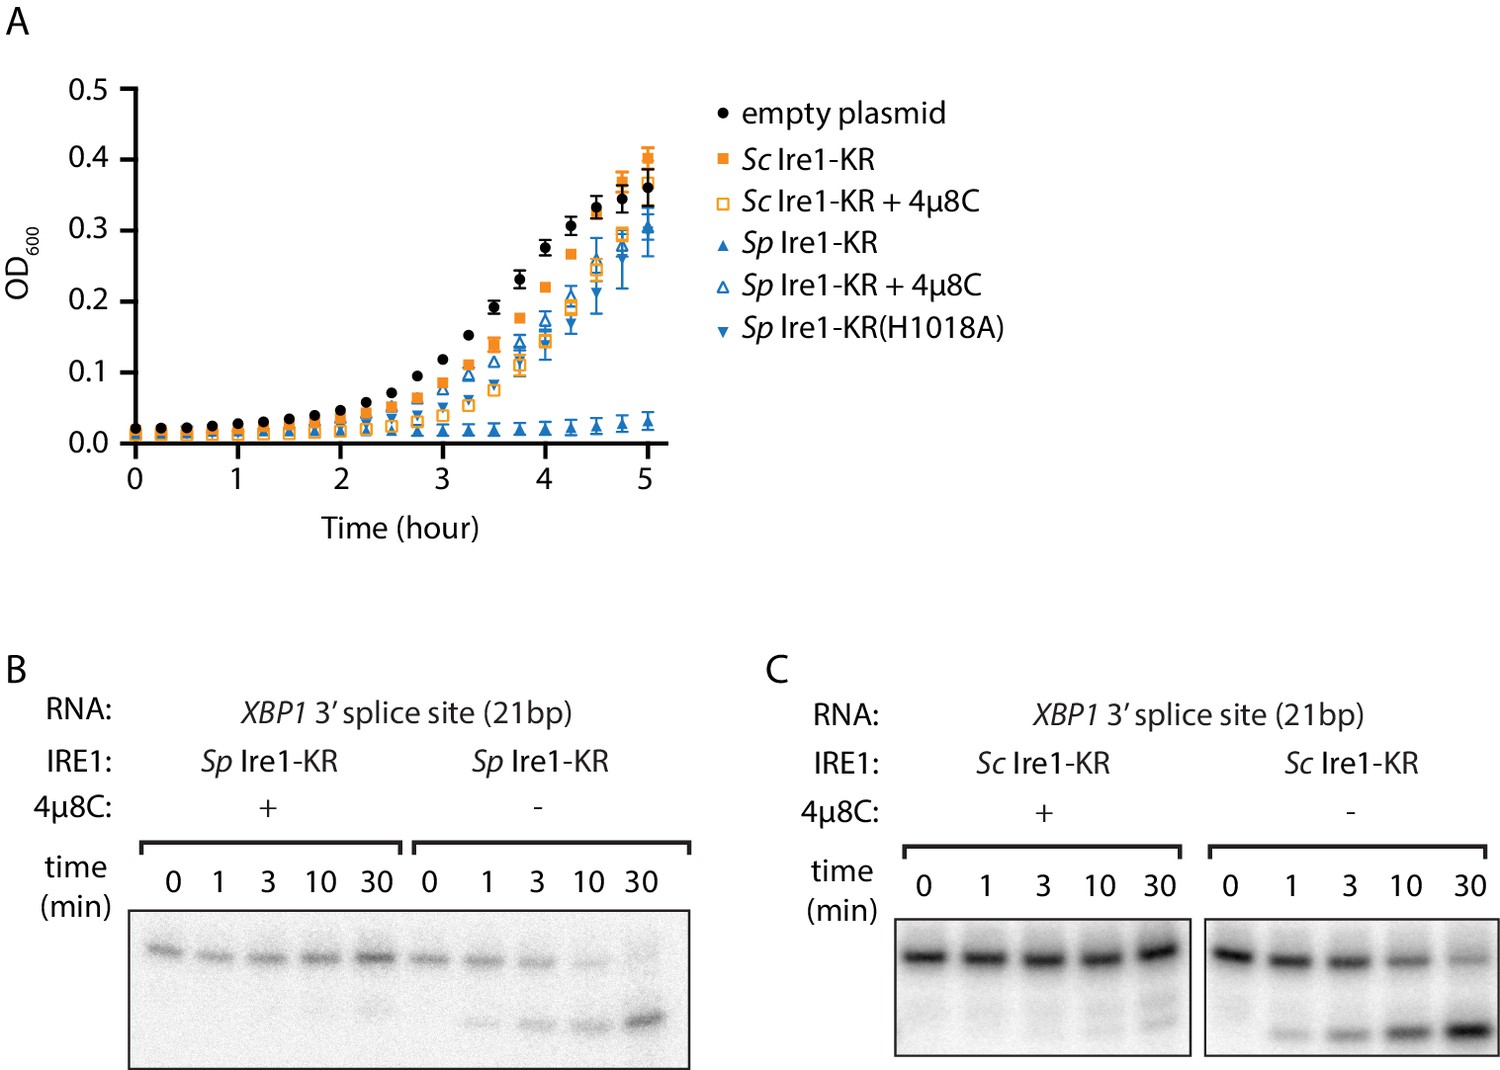
The promiscuous RNase activity of S. pombe Ire1 causes toxicity to bacterial cells.
(A) Growth curves of bacterial cells expressing various Ire1 kinase-RNase (KR) domains. Optical densities at 600 nm (OD600) were measured every 15 min for 5 hr. Bacterial cells expressing S. cerevisiae (Sc) or S. pombe (Sp) Ire1-KR were incubated at 37°C. In the indicated samples, 1 μM of the Ire1’s RNase inhibitor 4μ8C was added to the culture. The Sp Ire1-KR(H1018A) has a catalytically inactive RNase. (B, C) In vitro RNA cleavage assays with or without 200 μM of 4μ8C. 5’ radiolabeled stem-loop RNA substrates, which are derived from the XBP1 mRNA 3’ splice site, were incubated with 12.5 μM of Sp (B) or Sc (C) Ire1-KR at 30°C for the indicated time.
Figure 1—figure supplement 1
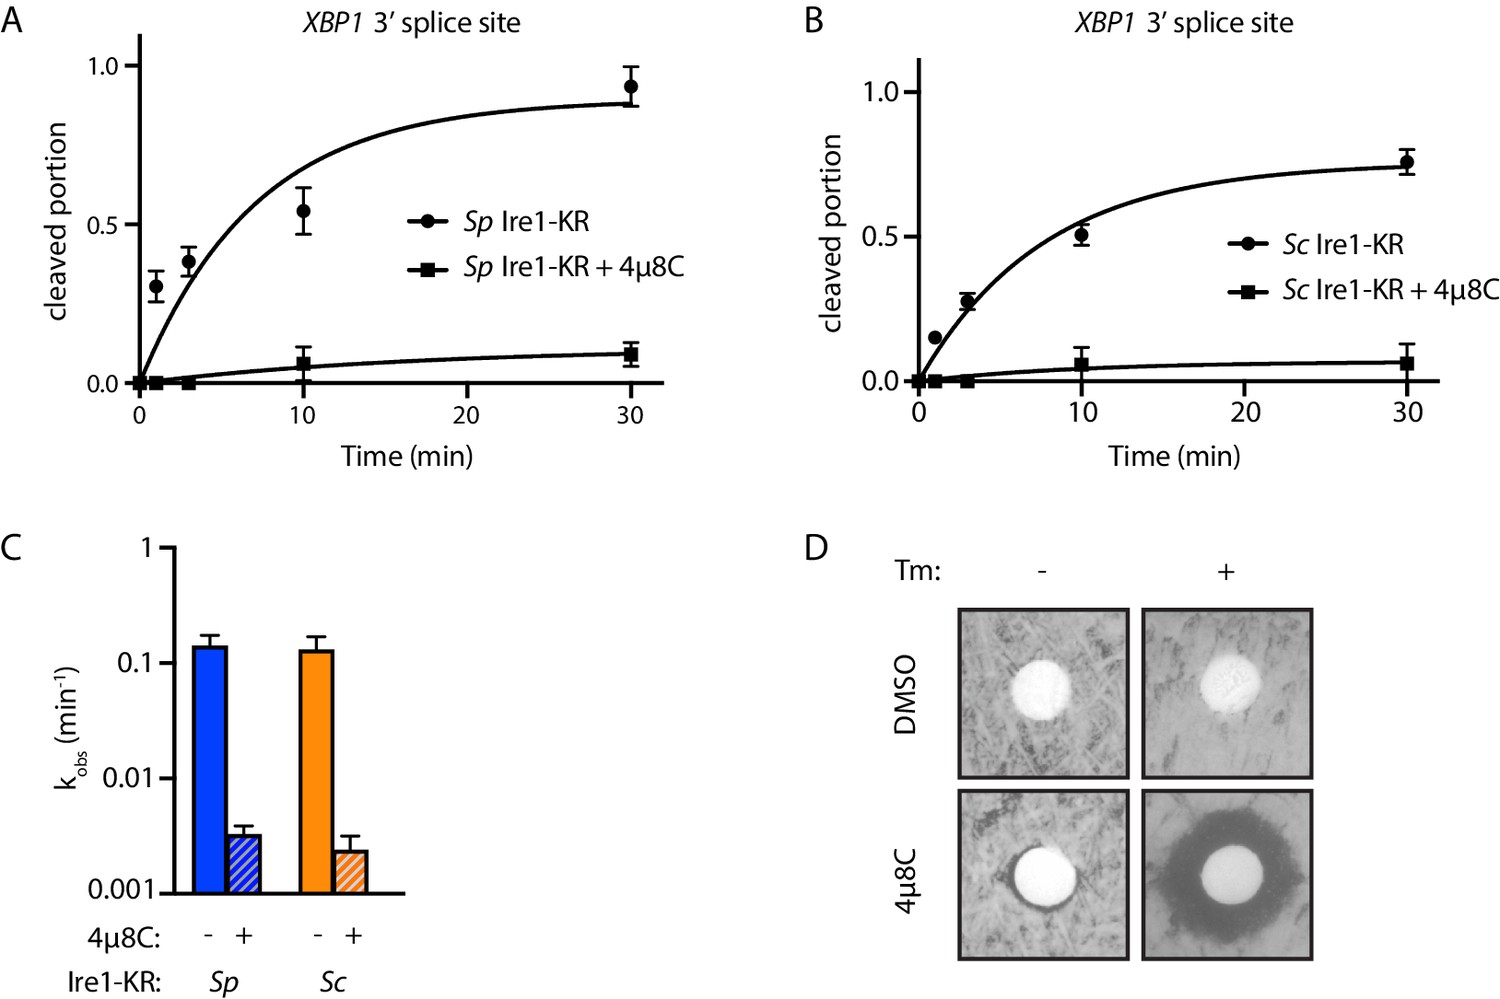
4µ8C inhibits the RNase activity of S. pombe and S. cerevisiae Ire1.
(A–B) Results from the in vitro cleavage assays in Figure 1B & C were quantified using ImageJ. Cleaved portion was calculated as: cleaved RNA / (cleaved RNA +uncleaved RNA). For cleaved portion ≥0.1 at time point 30 min, the data were fitted to a first-order exponential function. For cleaved portion <0.1 at time point 30 min, the data were fitted to a linear function. Experiments were performed in duplicates. (C) Bar graph showing the kobs of the indicated Ire1 with or without 4µ8C. (D) 4µ8C inhibits S. pombe Ire1’s RNase activity in vivo. A total of 200 µl of WT S. pombe cell culture at OD600 0.5 was evenly spread onto YE5S plate, which does or does not contain 0.05 µg/ml of tunicamycin. Circular Whatman paper (diameter ~1 cm) was placed onto the YE5S plates. A total of 5 µl of DMSO or 4µ8C (at concentration of 1 mM) was spotted onto the Whatman papers. Plates were incubated at 30°C for 3 days.
Figure 2 with 1 supplement

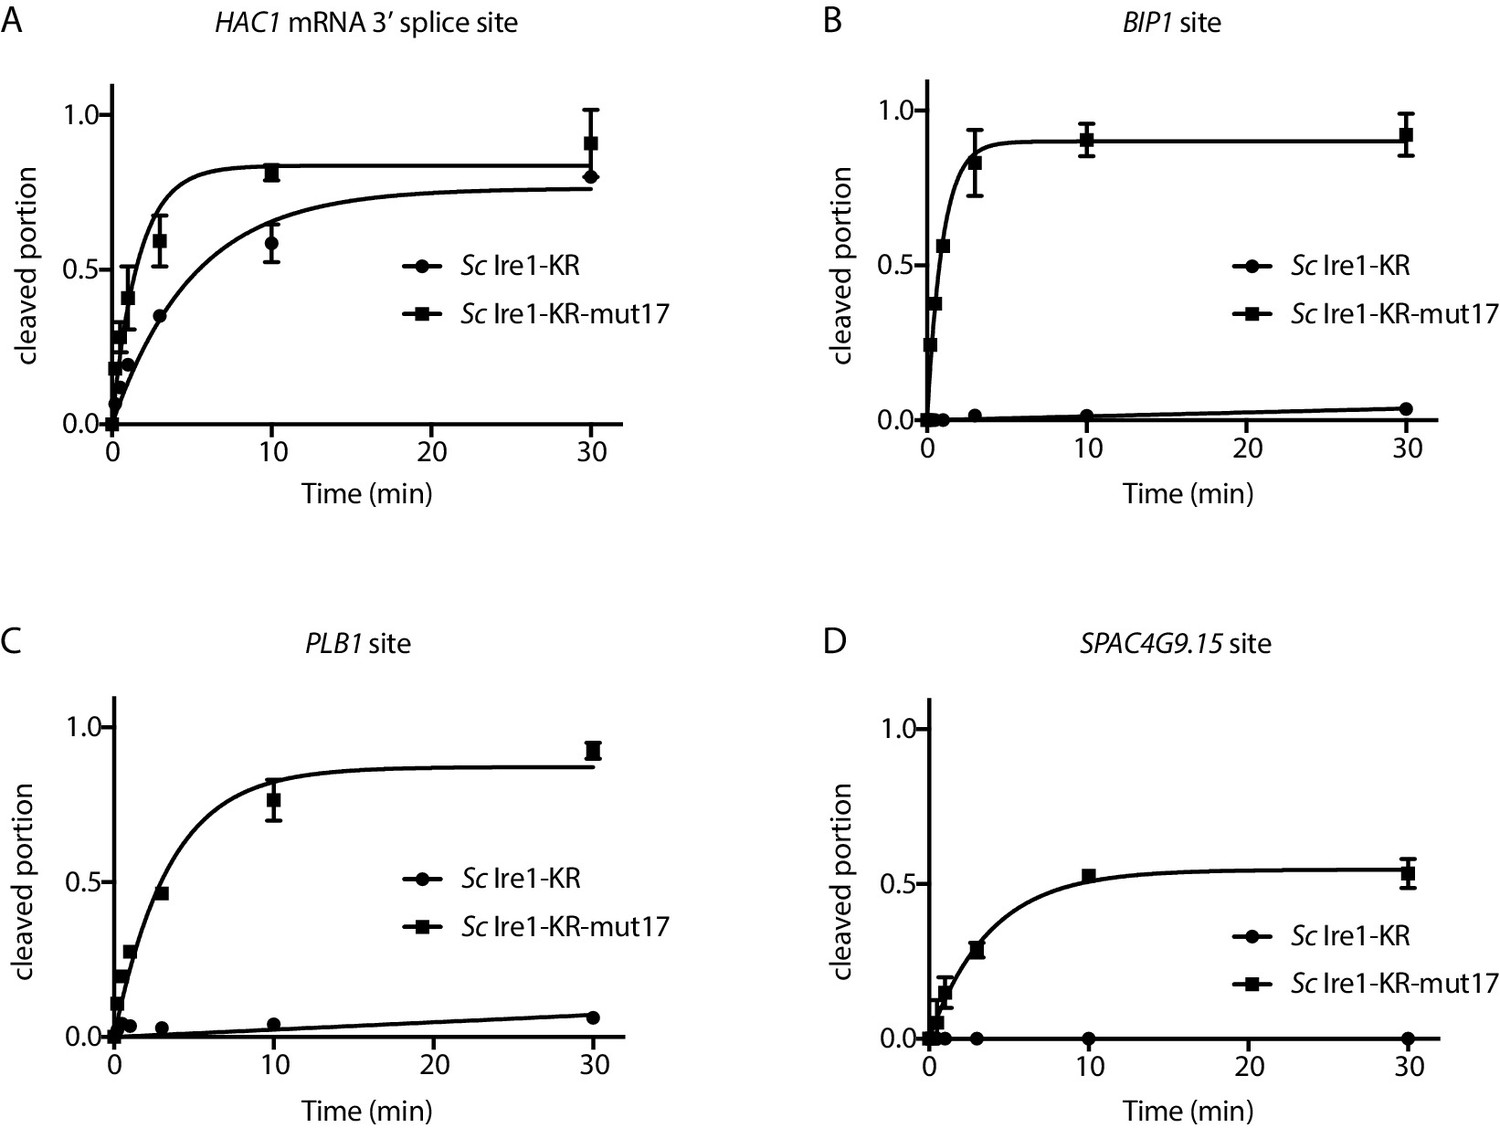
S. cerevisiae Ire1-KR-mut17 has a promiscuous RNase activity.
(A) Sequence alignment of the RNase domains of Ire1 orthologs from Saccharomyces cerevisiae, Schizosaccharomyces pombe, Schizosaccharomyces octosporus, Schizosaccharomyces cryophilus. A total of 17 residues (green) were selected as the candidate residues that may regulate Ire1’s RNase promiscuity. These candidate residues are located at back-to-back dimer interface (marked with *), oligomer interface (marked with +) or near the helix loop element (marked with ^). Sequence of the helix loop element (HLE) is underlined. (B) The location of the 17 candidate residues (green) on the back-to-back dimer structure of the Ire1 cytosolic domain (PDB: 3FBV) with kinase domain in yellow and RNase domain in purple. The dimer interface, oligomer interface and HLE regions are indicated in dashed boxes. (C–F) In vitro RNA cleavage assays with 12.5 μM of wildtype (WT) Sc Ire1-KR or Sc Ire1-KR-mut17. The stem-loop RNA substrates are derived from the Sc HAC1 mRNA 3’ splice site (C), Sp BIP1 (D), PLB1 (E), and SPAC4G9.15 (F) mRNA cleavage sites. Experimental conditions are the same as in Figure 1B&C. Predicted RNA secondary structures are illustrated. Ire1 cleavage sites are marked with red dashed lines. (G) Comparison of the kobs of WT Sc Ire1-KR, Sc Ire1-KR-mut17 and Sp Ire1-KR. The kobs of WT Sc Ire1-KR and Sc Ire1-KR-mut17 were calculated from experiments in (C–F). The kobs of Sp Ire1-KR was measured under the same condition from our previous study (Li et al., 2018). ‘BD’ indicates cleavage activity below detection limit. Experiments were performed in duplicates. (H) Bacterial growth assay for WT Sc Ire1-KR, Sc Ire1-KR-mut17, and Sp Ire1-KR. Experimental conditions are the same as in Figure 1A. In the indicated samples, 1 μM of 4μ8C was added.
-
Figure 2—source data 1
A list of the 17 candidate residues on S. cerevisiae and S. pombe Ire1.
The oligomer interface is referred as the interface IF2C and the back-to-back dimer interface is referred as the interface IF1C in Korennykh et al., 2009.
- https://cdn.elifesciences.org/articles/67425/elife-67425-fig2-data1-v3.xlsx
Figure 2—figure supplement 1
Quantification of in vitro cleavage assays.
Results from the in vitro cleavage assays in Figure 2C–F were quantified and analyzed using the same methods as in Figure 1—figure supplement 1A.
Figure 3 with 1 supplement
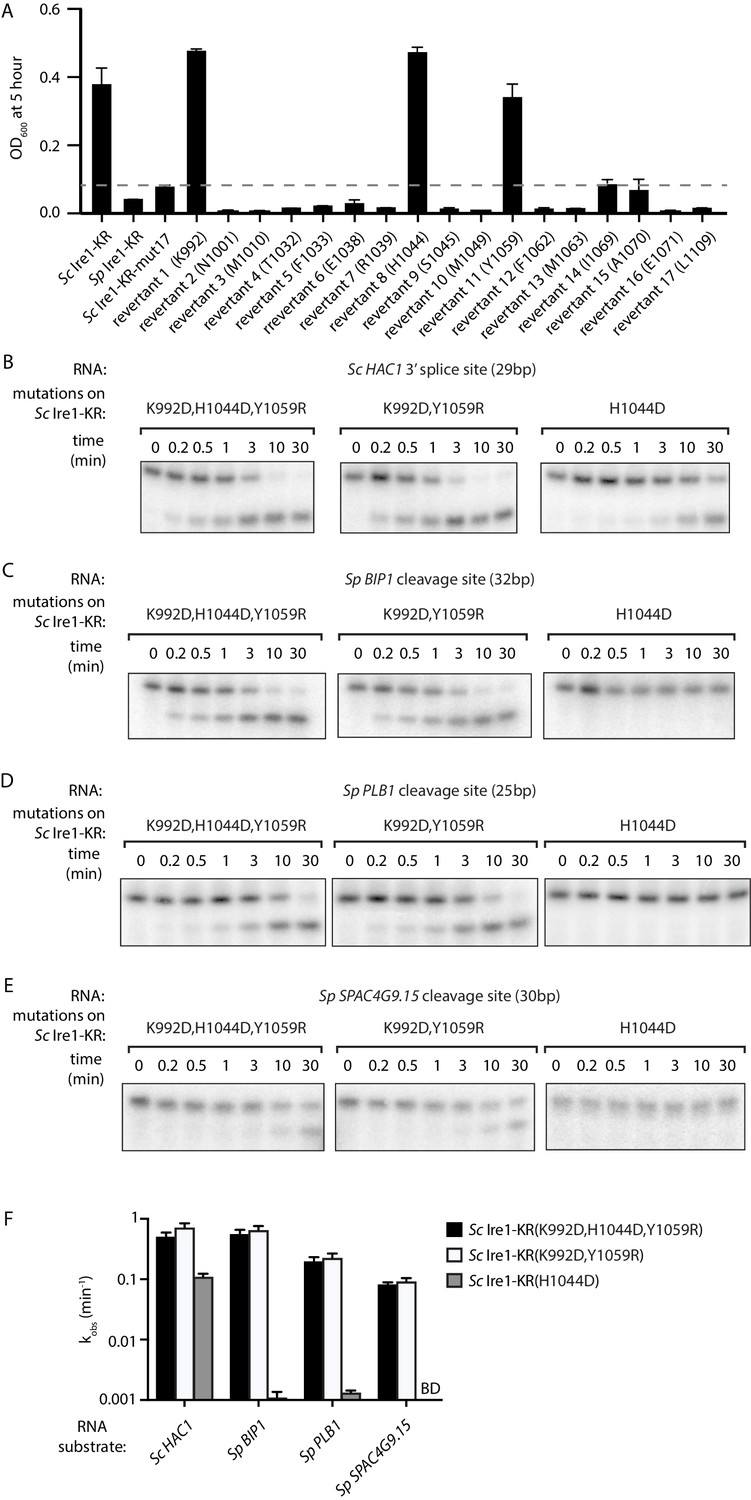
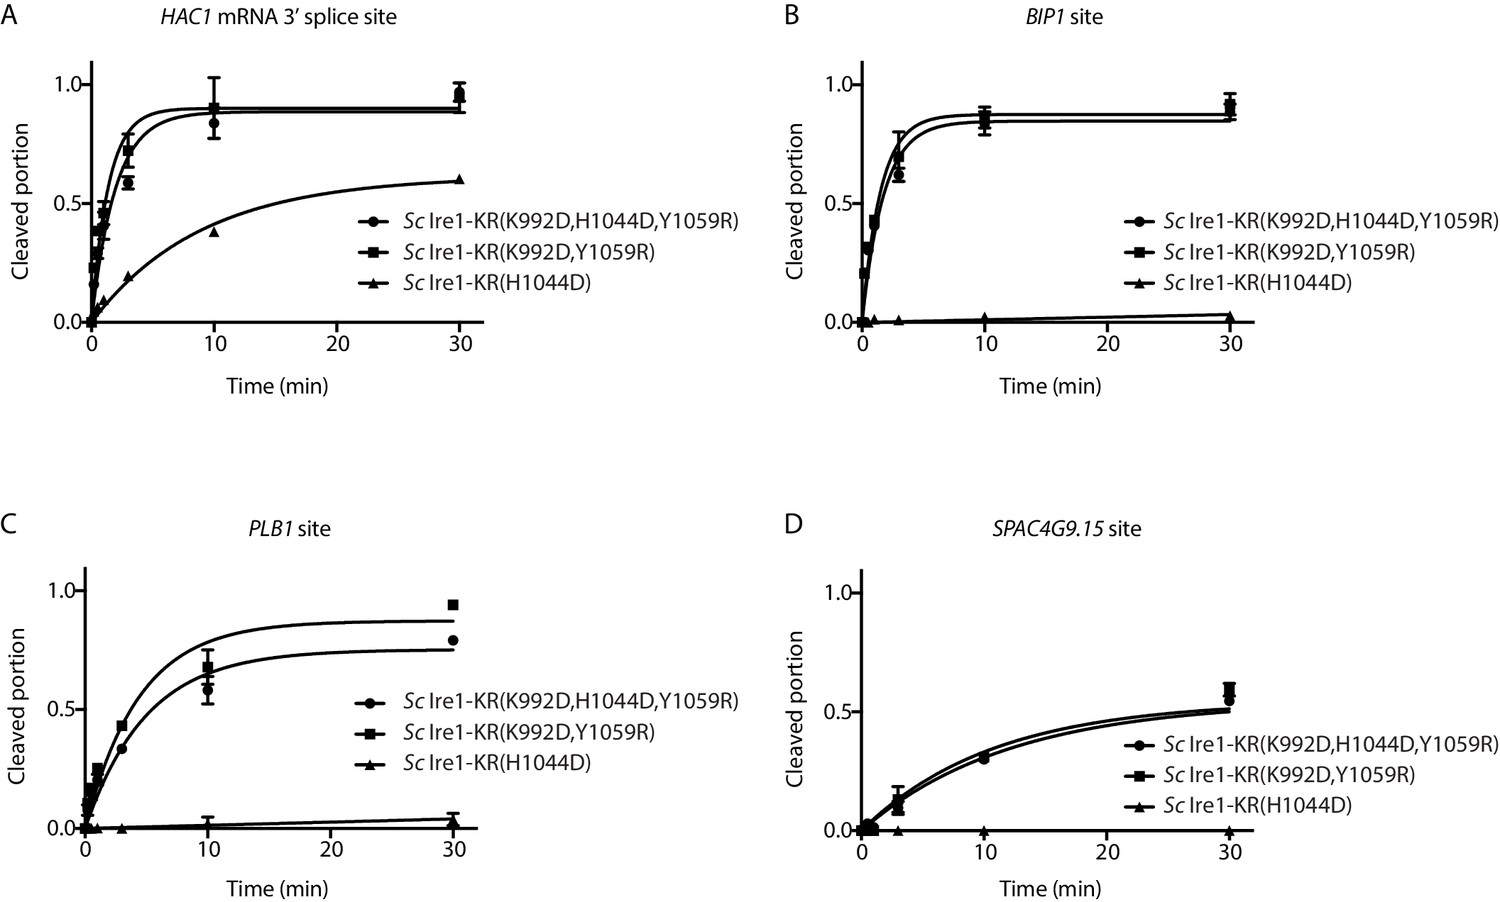
Two residues at Ire1’s RNase-RNase dimer interface regulate Ire1’s RNase promiscuity.
(A) Bacterial growth assay for Sc Ire1-KR revertants. Conditions are the same as in Figure 1A. OD600 at 5 hr time-point was measured. Experiments were performed in duplicates. Dashed line marks the threshold used to separate toxic and non-toxic Ire1 constructs. (B–E) In vitro cleavage assays of Sc Ire1-KR(K992D,H1044D,Y1059R), Sc Ire1-KR(K992D,Y1059R) and Sc Ire1-KR(H1044D) on Sc HAC1 mRNA 3’ splice site (B), Sp BIP1 (C), PLB1 (D) and SPAC4G9.15 (E) mRNA cleavage sites. Experimental conditions are the same as in Figure 1C. (F) Comparison of the kobs that are calculated from results in (B–E). ‘BD’ indicates cleavage activity below detection limit. Experiments were performed in duplicates.
-
Figure 3—source data 1
The detailed sequence information of S. cerevisiae Ire1-KR constructs used in this study.
‘Y’ indicates the mutation is present in the corresponding Ire1 construct. ‘N’ indicates the mutation is absent in the corresponding Ire1 construct.
- https://cdn.elifesciences.org/articles/67425/elife-67425-fig3-data1-v3.xlsx
Figure 3—figure supplement 1
Quantification of in vitro cleavage assays.
Results from the in vitro cleavage assays in Figure 3B–E were quantified and analyzed using the same methods as in Figure 1—figure supplement 1A.
Figure 4
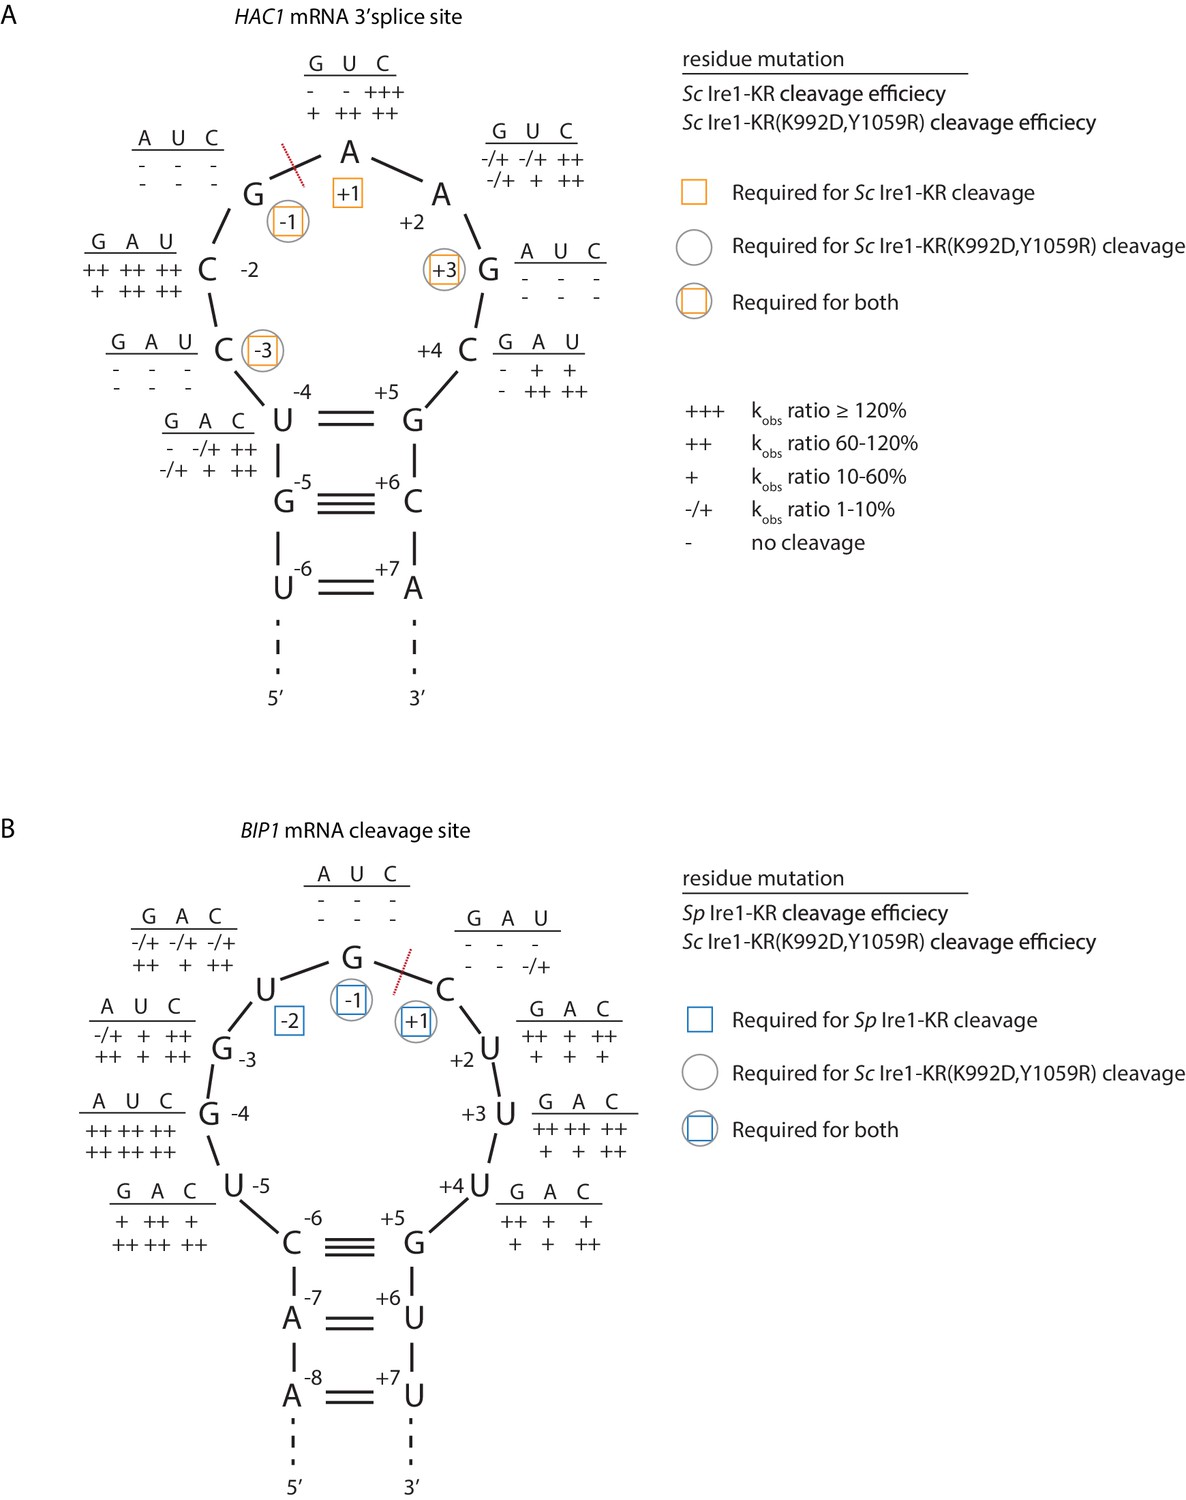
S. cerevisiae Ire1-KR(K992D,Y1059R) has a promiscuous RNase activity.
(A–B) A series of twenty-four (A) and twenty-seven (B) stem-loop RNA substrates, which are derived from the S. cerevisiae HAC1 mRNA 3’ splice site (A) or the S. pombe BIP1 mRNA cleavage site (B), are in vitro transcribed. Each of the substrate carries a single-point mutation, which is located on the loop or at the end position of the stem. The sequence of the various point mutations is indicated next to each residue (above the line). Listed below these sequences are the cleavage efficiencies, at which each mutant RNA substrate was cleaved by Sc Ire1-KR (first row below the line in panel A), Sp Ire1-KR (first row below the line in panel B) or Sc Ire1-KR(K992D,Y1059R) (second rows below the lines in panels A and B). kobs of mutant stem-loop RNAs is normalized to kobs of WT HAC1 (A) or BIP1 (B) stem-loop RNAs that are cleaved by the corresponding Ire1. (-) is no cleavage; (-/+) is 1–10%; (+) is 10–60%; (++) is 60–120%; (+++) is >120%. Ire1 cleavage sites are marked with red dashed lines. Yellow squares (in A), blue squares (in B) and gray circles (in A and B) mark the positions, at which specific residues are required to achieve efficient cleavages by Sc Ire1-KR, Sp Ire1-KR, and Sc Ire1-KR(K992D,Y1059R), respectively. Experimental conditions are the same as in Figure 1C.
Figure 5 with 5 supplements
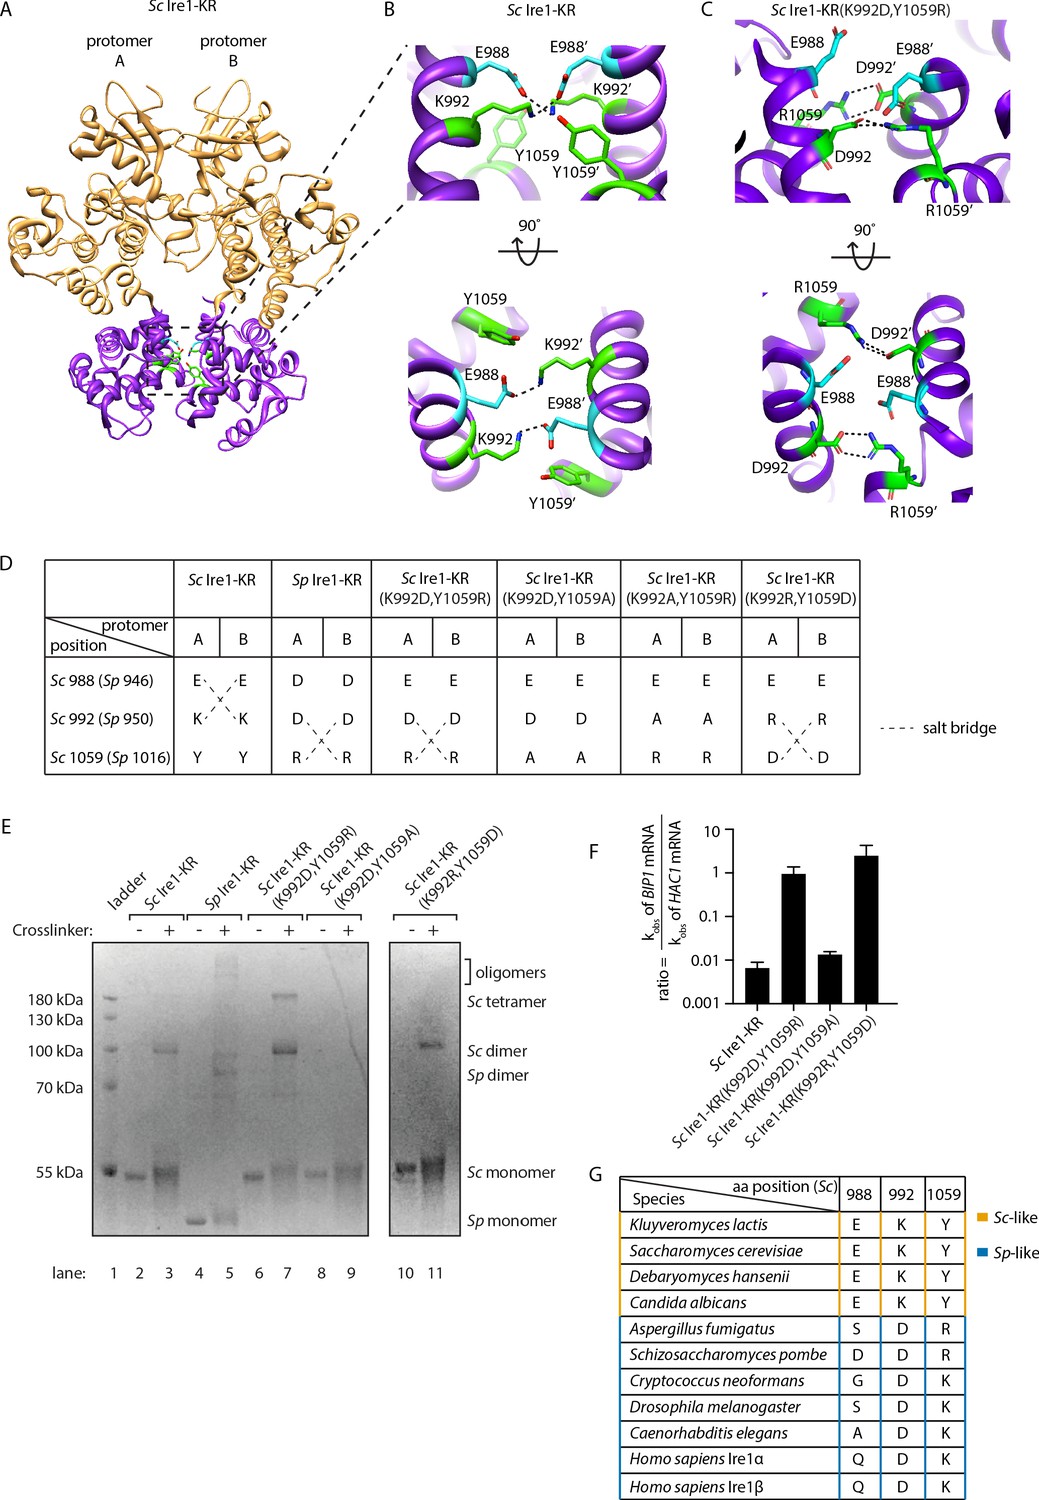
Structural re-arrangement at Ire1 dimer interface regulates the RNase promiscuity.
(A) Back-to-back dimer structure of WT Sc Ire1 cytosolic domain (PDB: 3FBV) with kinase domain in yellow and RNase domain in purple. K992 and Y1059 are colored in green while E988 is colored in blue. Side chain labels on protomer B are marked with ‘. (B) Close-up view focusing on the interface region of WT Sc Ire1 dimer. Dashed lines indicate salt bridges. (C) Close-up view focusing on the interface region of the predicted dimer structure of Sc Ire1-KR(K992D,Y1059R), which was generated by a 20-ns molecular dynamics (MD) simulation from an initial structural model that was built from the WT Sc Ire1 dimer (PDB: 3FBV). The final frame of the simulation was illustrated. D992 and R1059 are colored in green while E988 is colored in blue. Dashed lines indicate salt bridges. (D) Illustration of the residues at Sc Ire1 position 988, 992, and 1059 (or Sp Ire1 position 946, 950 and 1016). Dashed lines indicate salt bridges. (E) Crosslinking gel for various Ire1-KR constructs. Indicated Ire1-KR (12.5 μM) constructs were incubated with or without 1 mM of crosslinker bissulfosuccinimidyl suberate for 2 hr on ice before being separated on an SDS-PAGE gel and stained by coomassie blue. (F) Ire1’s ability to distinguish Sc HAC1- and Sp BIP1-derived RNA substrates is measured by the ratio of their corresponding kobs. (G) Evolutionary comparison of Ire1 orthologs from various species. The analysis focuses on three residues, which correspond to position 988, 992 and 1059 on Sc Ire1. The S. cerevisiae-like pattern (yellow) has an E/D at 988, K/R at 992 and Y at 1059. The S. pombe-like pattern (blue) has a varying amino acid (aa) at 988, D/E at 992 and K/R at 1059.
-
Figure 5—source data 1
In this table, 230 Ire1 orthologs were compared.
Their residues at three positions, which correspond to the S. cerevisiae Ire1 E988, K992 and Y1059, are listed.
- https://cdn.elifesciences.org/articles/67425/elife-67425-fig5-data1-v3.xlsx
Figure 5—figure supplement 1
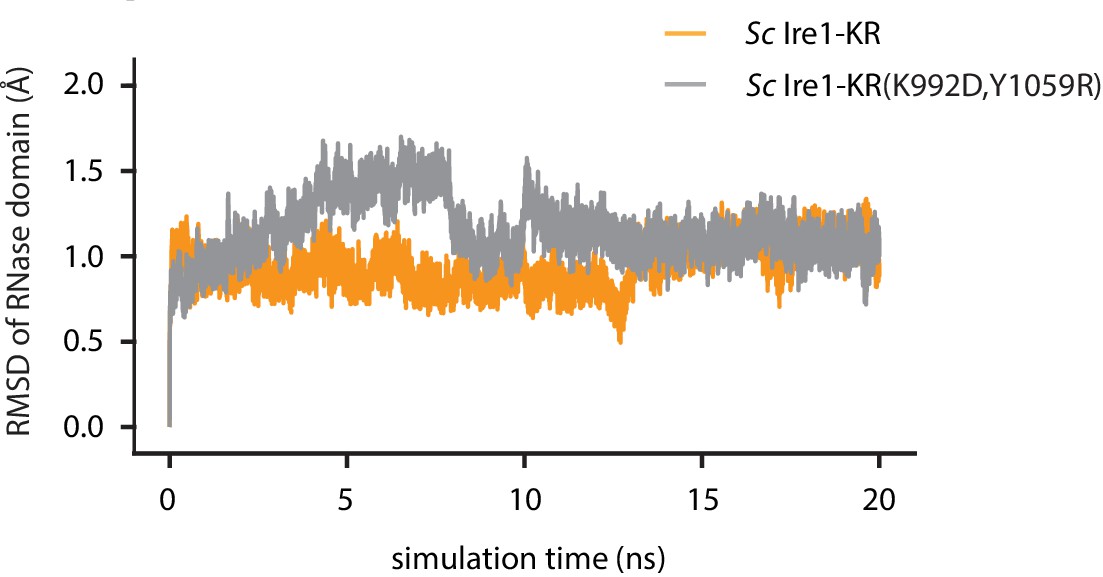
The root-mean-square deviation (RMSD) of atomic positions of Ire1 RNase domain during the simulation.
Result of WT Sc Ire1-KR is in yellow and Sc Ire1-KR(K992D,Y1059R) is in gray.
Figure 5—figure supplement 2
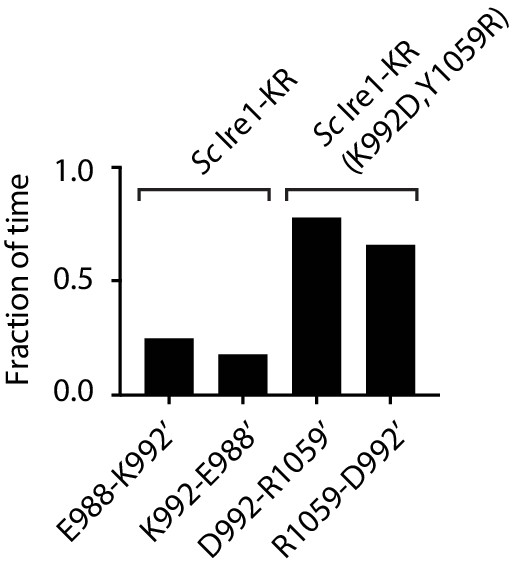
Time fraction of the MD simulation during which the indicated salt bridges are present.
A 20-ns MD simulation was performed on the dimer structure of WT Sc Ire1 KR or Sc Ire1-KR(K992D,Y1059R). At a given time point during the simulation, if the distance between the two indicated residues is smaller than 2.5 Å, the two residues are considered to be connected by a salt bridge. The bar graph shows the accumulative time fraction during which each indicated salt bridge is present. Side chain on protomer B are marked with ‘.
Figure 5—figure supplement 3
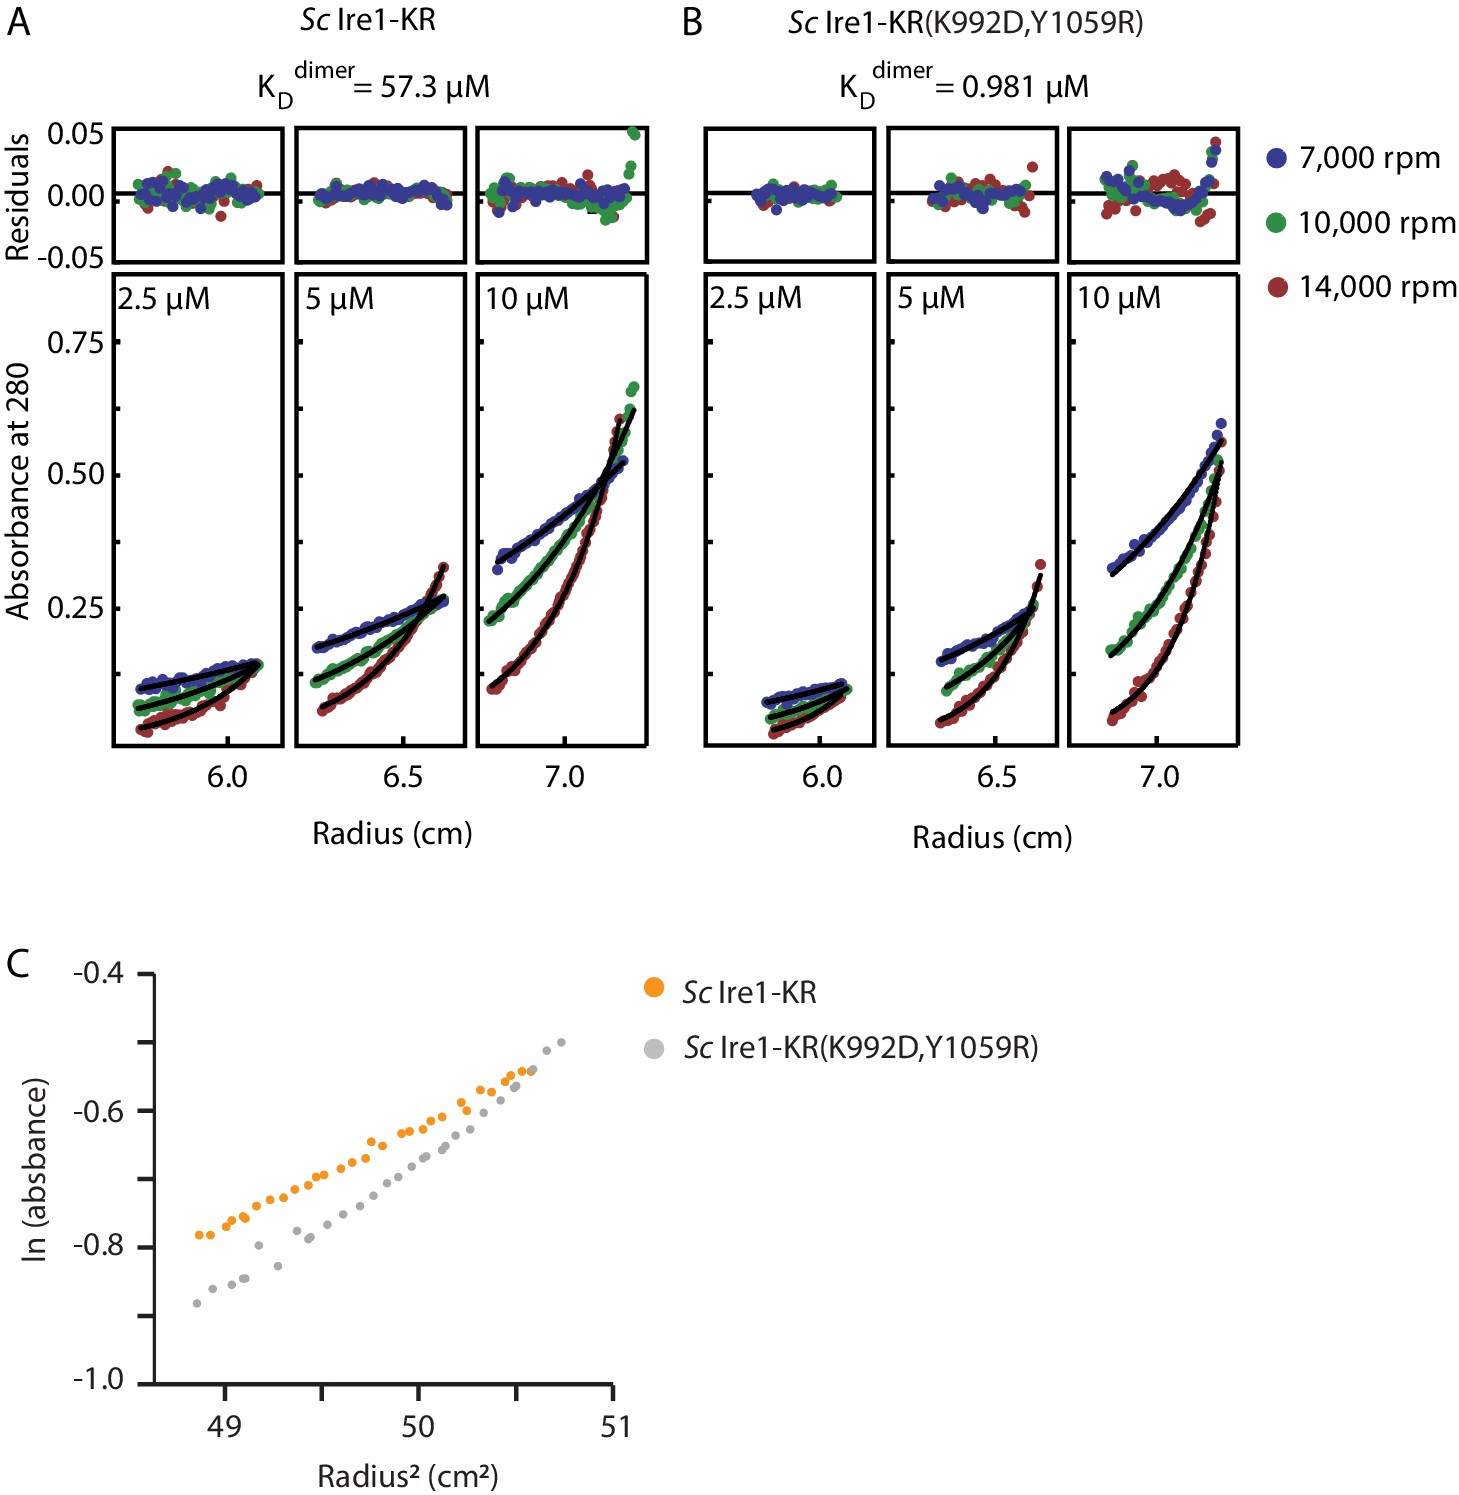
Sedimentation equilibrium analytical ultracentrifugation (SE-AUC) analysis of Sc Ire1-KR and Sc Ire1-KR(K992D,Y1059R).
Each protein was examined under nine conditions: at three protein concentrations (2.5, 5, and 10 µM) and three centrifugal speeds (7,000, 10,000, and 14,000 rpm). All nine sets of data for each protein were fitted to an equilibrium model. (A) WT Sc Ire1-KR was mostly monomeric at the concentrations tested and had a monomer-dimer equilibrium constant of 57 μM. (B) Sc Ire1-KR(K992D,Y1059R) showed a higher propensity to form dimers/tetramers than WT Sc Ire1 KR, with a monomer-dimer equilibrium constant of 0.98 μM. (C) Plot of the natural logarithm of the absorbance at 280 nm versus the square of the spin radius for the 10 μM Sc Ire1-KR and Sc Ire1-KR(K992D,Y1059R) samples at 7,000 rpm.
Figure 5—figure supplement 4

RNA cleavage efficiencies of Sc Ire1-KR mutants bearing mutations at back-to-back dimer interface.
kobs of the indicated Sc Ire1-KR constructs cleaving stem-loop RNA substrates derived from Sc HAC1 mRNA 3’ splice site or Sp BIP1 mRNA cleavage site. ‘BD’ indicates cleavage activity below detection limit.
Figure 5—figure supplement 5
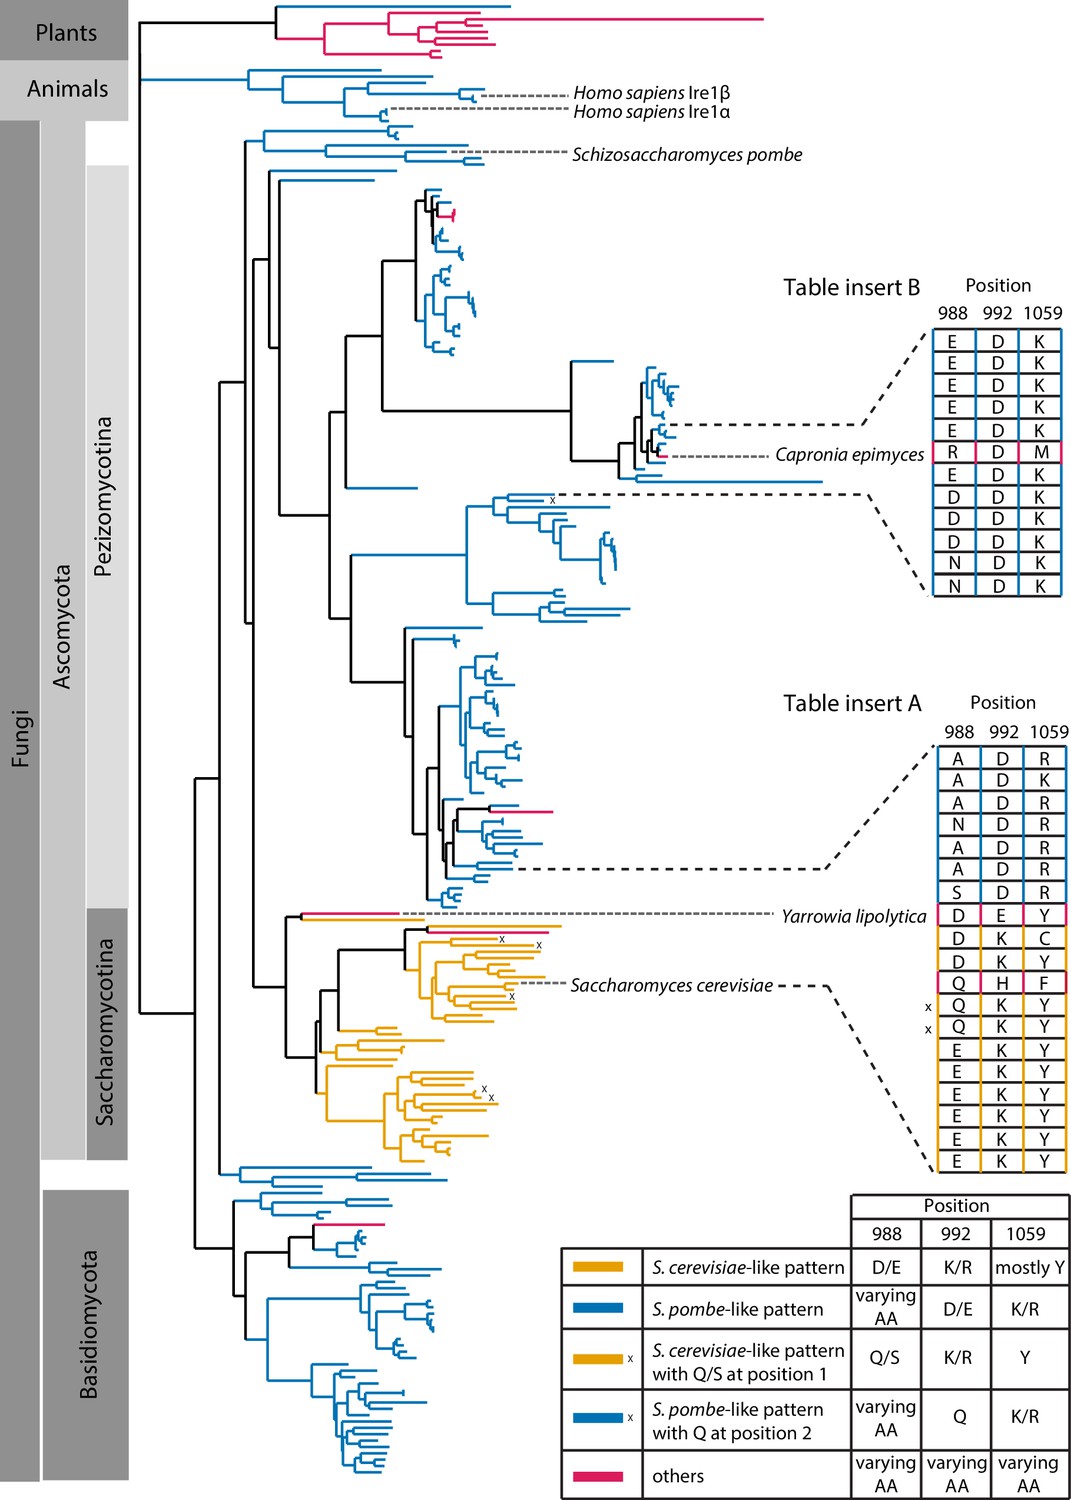
Evolutionary comparison of Ire1 orthologs.
We generated a deep alignment of 230 Ire1 orthologs from fungi (211), representative plants (9) and animals (10). We compared residues at three positions, which correspond to the S. cerevisiae Ire1 E988, K992, and Y1059. Among the 230 orthologs being analyzed, 175 of them have the S. pombe-like pattern (blue)—with a varying amino acid at position 988, a negatively charged amino acid (aspartate or glutamate) at position 992 and a positively charged amino acid (lysine or arginine) at position 1059. Thirty-three of the Ire1 orthologs have the S. cerevisiae-like pattern—with a negatively charged amino acid (aspartate or glutamate) at position 988, a positively charged amino acid (lysine or arginine) at position 992 and mostly tyrosine at position 1059. Tyrosine at position 1059 may orchestrate the positioning of lysine/arginine side chain at position 992 (Lee et al., 2008). The S. cerevisiae-like pattern is restricted to the Saccharomycotina. In 6 Ire1 orthologs, the S. cerevisiae- or S. pombe-like inter-molecular salt bridge are replaced with a putative hydrogen bond (marked with x). Ire1 orthologs from higher plants exhibit a pattern distinct from S. cerevisiae and S. pombe. One interesting case (Table insert A) is with the Ire1 from Yarrowia lipolytica, whose location on the evolutionary tree is at the boundary between S. cerevisiae-like and S. pombe-like species. Yarrowia lipolytica Ire1 is in a transitioning state from the S. cerevisiae-like into the S. pombe-like Ire1—its amino acids at position 988 (aspartate) and 1059 (tyrosine) remain S. cerevisiae-like whereas its amino acid at position 992 (glutamate) changed from S. cerevisiae-like (positively charged) into S. pombe-like (negatively charged). The case of Yarrowia lipolytica Ire1 suggests that salt-bridge rewiring occurs during the evolutionary process. Another interesting case (Table insert B) is with the Ire1 from Capronia epimyces. While its neighboring species have S. pombe-like pattern, Capronia epimyces Ire1 undergoes a unique evolution with arginine, aspartate and methionine at positions 988, 992, and 1059, making it a charge reversal (at positions 988 and 992) of S. cerevisiae-like Ire1. The detailed sequences are listed in Figure 5—source data 1.
Figure 6 with 1 supplement
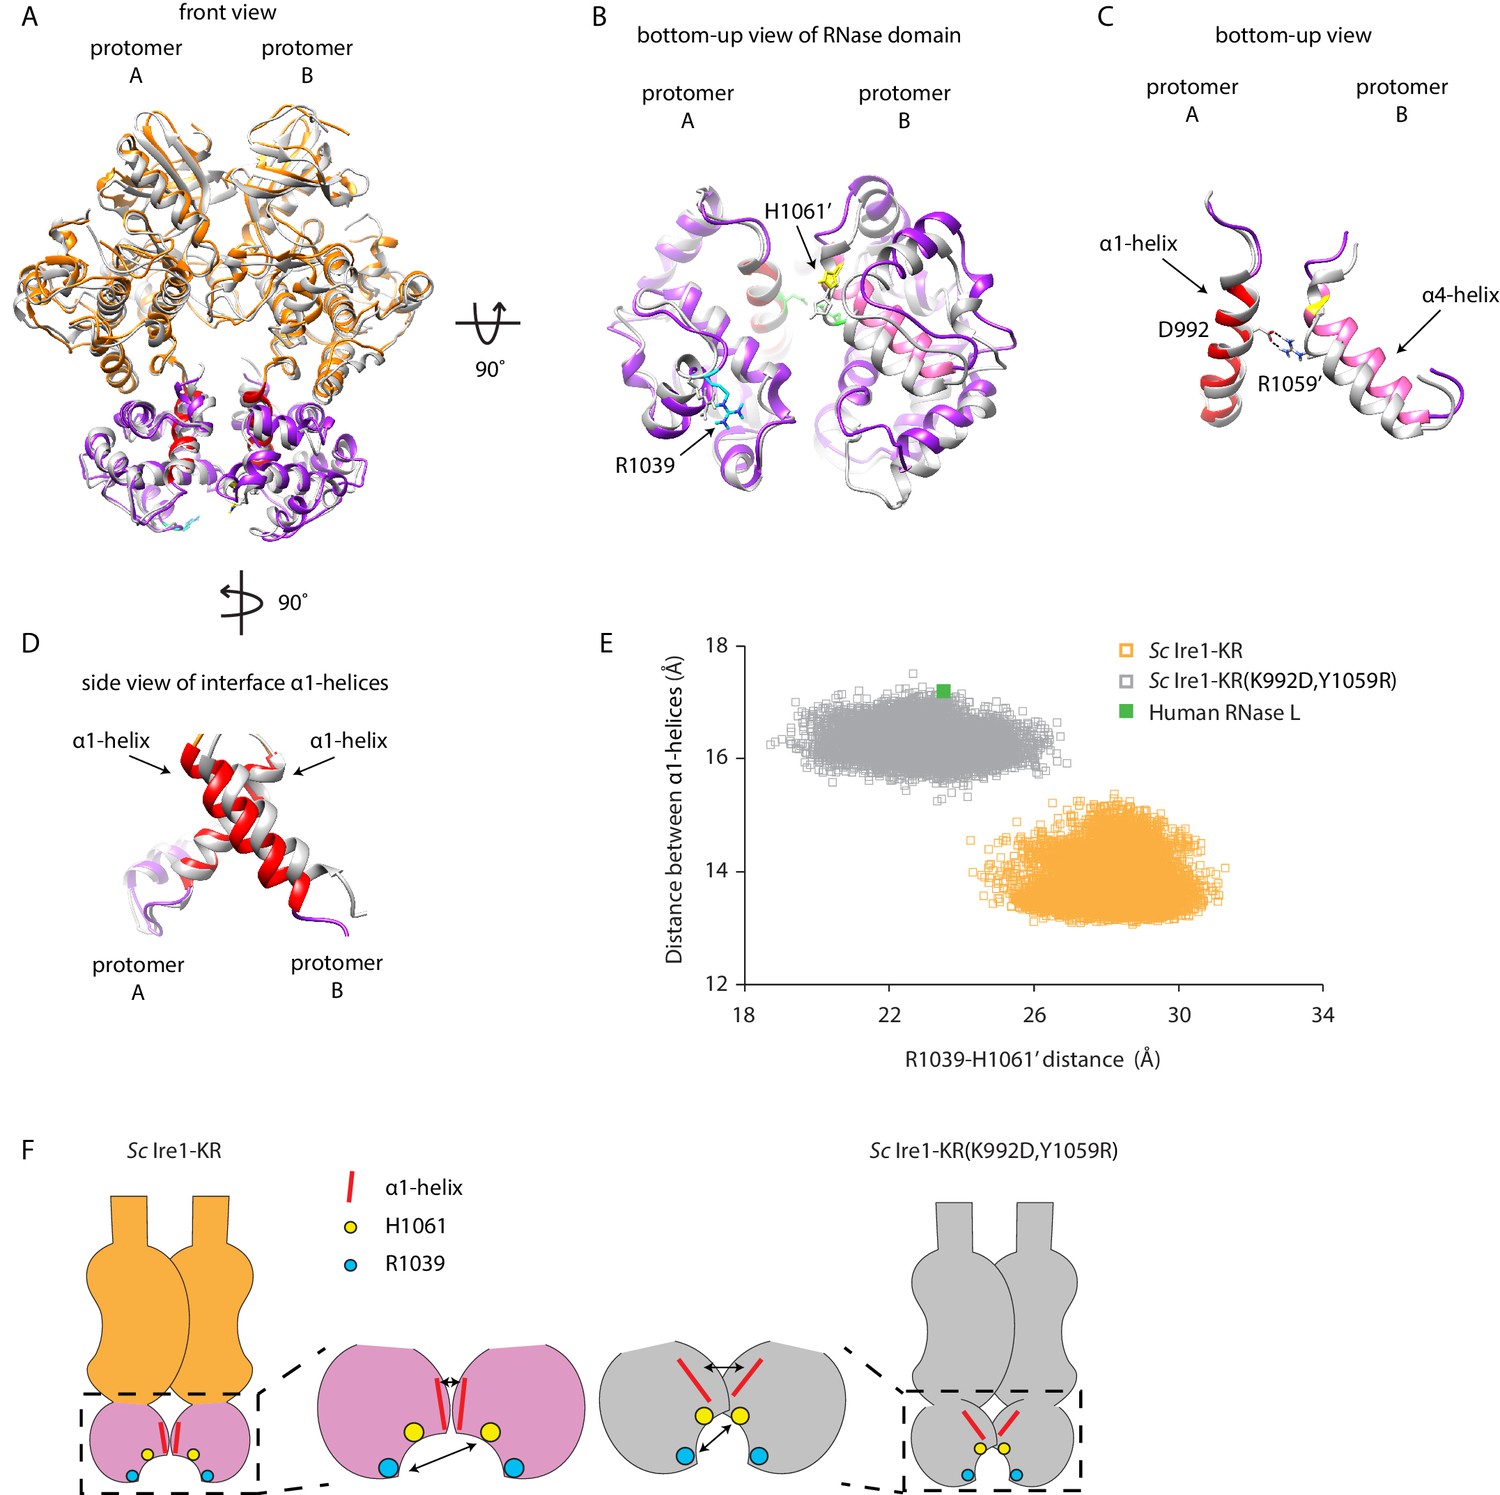
Interface mutations change the protomer alignment in Ire1 dimer.
(A) Structure alignment of WT Sc Ire1-KR and Sc Ire1-KR(K992D,Y1059R). 20-ns MD simulations were performed on both WT Sc Ire1-KR and Sc Ire1-KR(K992D,Y1059R). The last simulation frame was used for structure alignment. The protomer A of the two dimers were aligned with minimal root mean square deviation. Sc Ire1-KR(K992D,Y1059R) is in gray. WT Sc Ire1-KR has its kinase domain in yellow and RNase domain in purple. The α1-helix at position 983–998, α4-helix at position 1048–1064, H1061, and R1039 are in red, pink, yellow, and cyan, respectively. (B, C) Bottom-up view of the aligned RNase domains (B), and the α1- and α4-helix (C). Side chains of D992 and R1059 are shown. Dashed lines are salt bridges. (D) Side view of α1-helices. Color coding are the same as in (A). Side chain labels on protomer B are marked with ‘. (E) Measuring Ire1 protomer alignment in the MD simulation. Y-axis is the distance between the centers of mass of the two α1-helices. X-axis is the distance between the α-carbons of R1039 on protomer A and H1061’ on protomer B. Each dot represents a time point in the MD simulation. Measurements of WT Sc Ire1-KR are in yellow while measurements of Sc Ire1-KR(K992D,Y1059R) are in gray. The green dot is the measurement from the crystal structure of human RNase L (PDB: 4OAV). The R1039-H1061’ distance on Sc Ire1 corresponds to the R651-H672’ distance on RNase L. The α1-helix on RNase L is from W589 to V599. (F) Cartoon illustration showing the protomer alignment of WT Sc Ire1-KR and Sc Ire1-KR(K992D,Y1059R). Their RNase domains were zoomed in with double-arrow lines showing the distances being measured in (E).
Figure 6—figure supplement 1
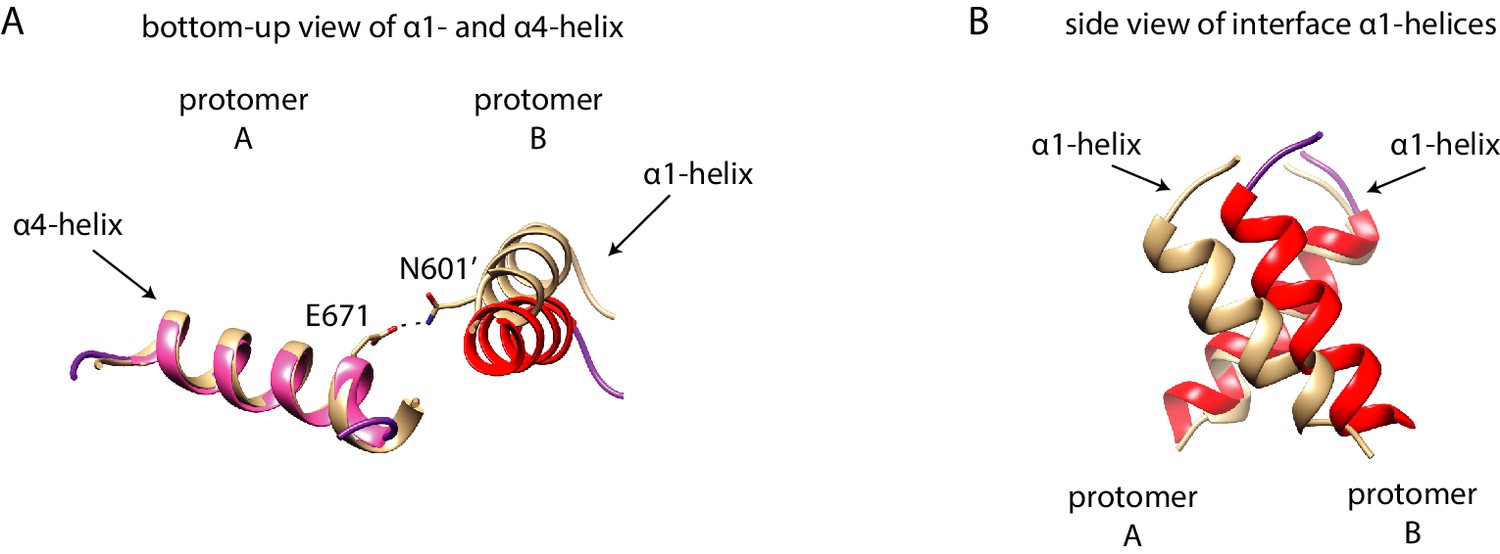
Protomer alignment of RNase L.
The dimer structure of WT Sc Ire1-KR (as used in Figure 6A) and human RNase L (PDB: 4OAV) were compared. The protomer A of the Sc Ire1-KR and human RNase L dimers were aligned with minimal root mean square deviation. The RNase L is in light brown. The color coding of Sc Ire1-KR is the same as in Figure 6. (A) Bottom-up view of the α1- and α4-helix; (B) Side view of α1-helices.
Tables
Table 1
Plasmids used in this study.
In all of the plasmids, a GST and an HRV 3C protease site are N-terminally fused to Ire1-KR.
| Plasmid number | Description | Source |
|---|---|---|
| pPW1477 | Sc Ire1-KR on pGEX6P-2 | Korennykh et al., 2009 |
| pPW3205 | Sp Ire1-KR on pGEX6P-2 | Li et al., 2018 |
| pPW3244 | Sc Ire1-KR-mut17 on pGEX6P-2 | This study |
| pPW3262 | Sc Ire1-KR(K992D,Y1059R) on pGEX6P-2 | This study |
| pPW3263 | Sc Ire1-KR(K992D,H1044D,Y1059R) on pGEX6P-2 | This study |
| pPW3256 | revertant 1 (K992) on pGEX6P-2 | This study |
| pPW3245 | revertant 2 (N1001) on pGEX6P-2 | This study |
| pPW3246 | revertant 3 (M1010) on pGEX6P-2 | This study |
| pPW3247 | revertant 4 (T1032) on pGEX6P-2 | This study |
| pPW3248 | revertant 5 (F1033) on pGEX6P-2 | This study |
| pPW3257 | revertant 6 (E1038) on pGEX6P-2 | This study |
| pPW3258 | revertant 7 (R1039) on pGEX6P-2 | This study |
| pPW3259 | revertant 8 (H1044) on pGEX6P-2 | This study |
| pPW3260 | revertant 9 (S1045) on pGEX6P-2 | This study |
| pPW3249 | revertant 10 (M1049) on pGEX6P-2 | This study |
| pPW3250 | revertant 11 (Y1059) on pGEX6P-2 | This study |
| pPW3261 | revertant 12 (F1062) on pGEX6P-2 | This study |
| pPW3251 | revertant 13 (M1063) on pGEX6P-2 | This study |
| pPW3252 | revertant 14 (I1069) on pGEX6P-2 | This study |
| pPW3253 | revertant 15 (A1070) on pGEX6P-2 | This study |
| pPW3254 | revertant 16 (E1071) on pGEX6P-2 | This study |
| pPW3255 | revertant 17 (L1109) on pGEX6P-2 | This study |
| pPW3441 | Sc Ire1-KR(K992D,Y1059A) on pGEX6P-2 | This study |
| pPW3442 | Sc Ire1-KR(K992A,Y1059R) on pGEX6P-2 | This study |
| pPW3443 | Sc Ire1-KR(K992R,Y1059D) on pGEX6P-2 | This study |
| pPW3275 | Sc Ire1-KR(H1018A) on pGEX6P-2 | This study |
Additional files
Download links
A two-part list of links to download the article, or parts of the article, in various formats.
Downloads (link to download the article as PDF)
Open citations (links to open the citations from this article in various online reference manager services)
Cite this article (links to download the citations from this article in formats compatible with various reference manager tools)
Protomer alignment modulates specificity of RNA substrate recognition by Ire1
eLife 10:e67425.
https://doi.org/10.7554/eLife.67425


