Properties of multivesicular release from mouse rod photoreceptors support transmission of single-photon responses
- Truhlsen Eye Institute and Department of Ophthalmology and Visual Sciences, College of Medicine, University of Nebraska Medical Center, United States
- Cellular and Integrative Physiology, United States
- Pharmacology and Experimental Neuroscience, United States
- Department of Neurobiology, Duke University School of Medicine, United States
Figures
Figure 1
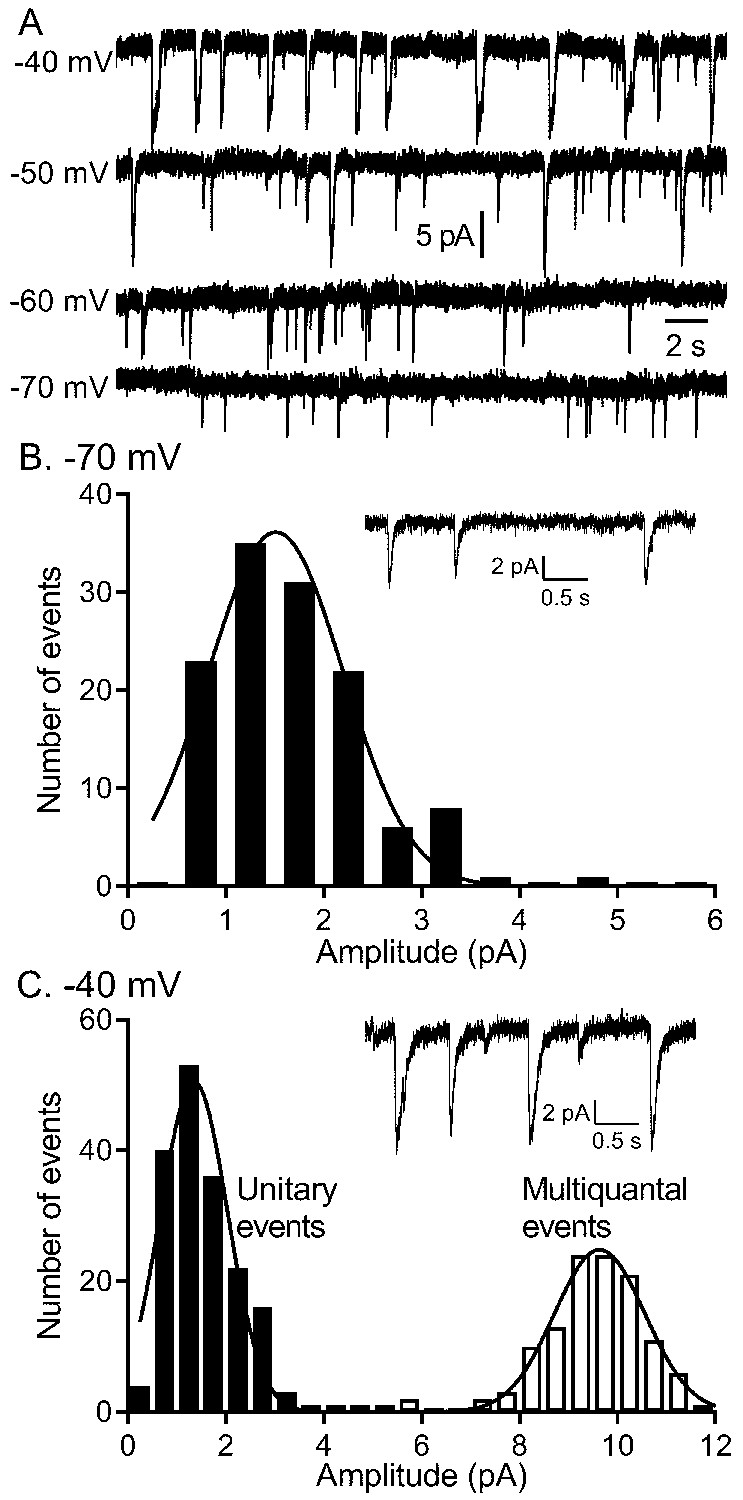
The quantity of glutamate released measured by IA(glu) increased with depolarization but near −40 mv, release shifted from single vesicle fusion events to multivesicular release events consisting of 10–20 vesicles apiece.
(A) Representative traces from a single rod clamped at various voltages. (B) Example recording and amplitude histogram of unitary IA(glu) events from a rod voltage-clamped at −70 mV. Amplitude histogram was fit with a Gaussian function (mean ± SD = 1.51 ± 0.688 pA; n = 127 events). (C) Example recording and amplitude histogram from the same rod held at −40 mV. Amplitude histograms for unitary (black bars) and multivesicular (open bars) events were each fit with Gaussian functions (mean unitary event amplitude = 1.35 ± 0.685 pA; n = 178 events; multiquantal event amplitude = 9.64 ± 0.924 pA, n = 118 events).
Figure 2
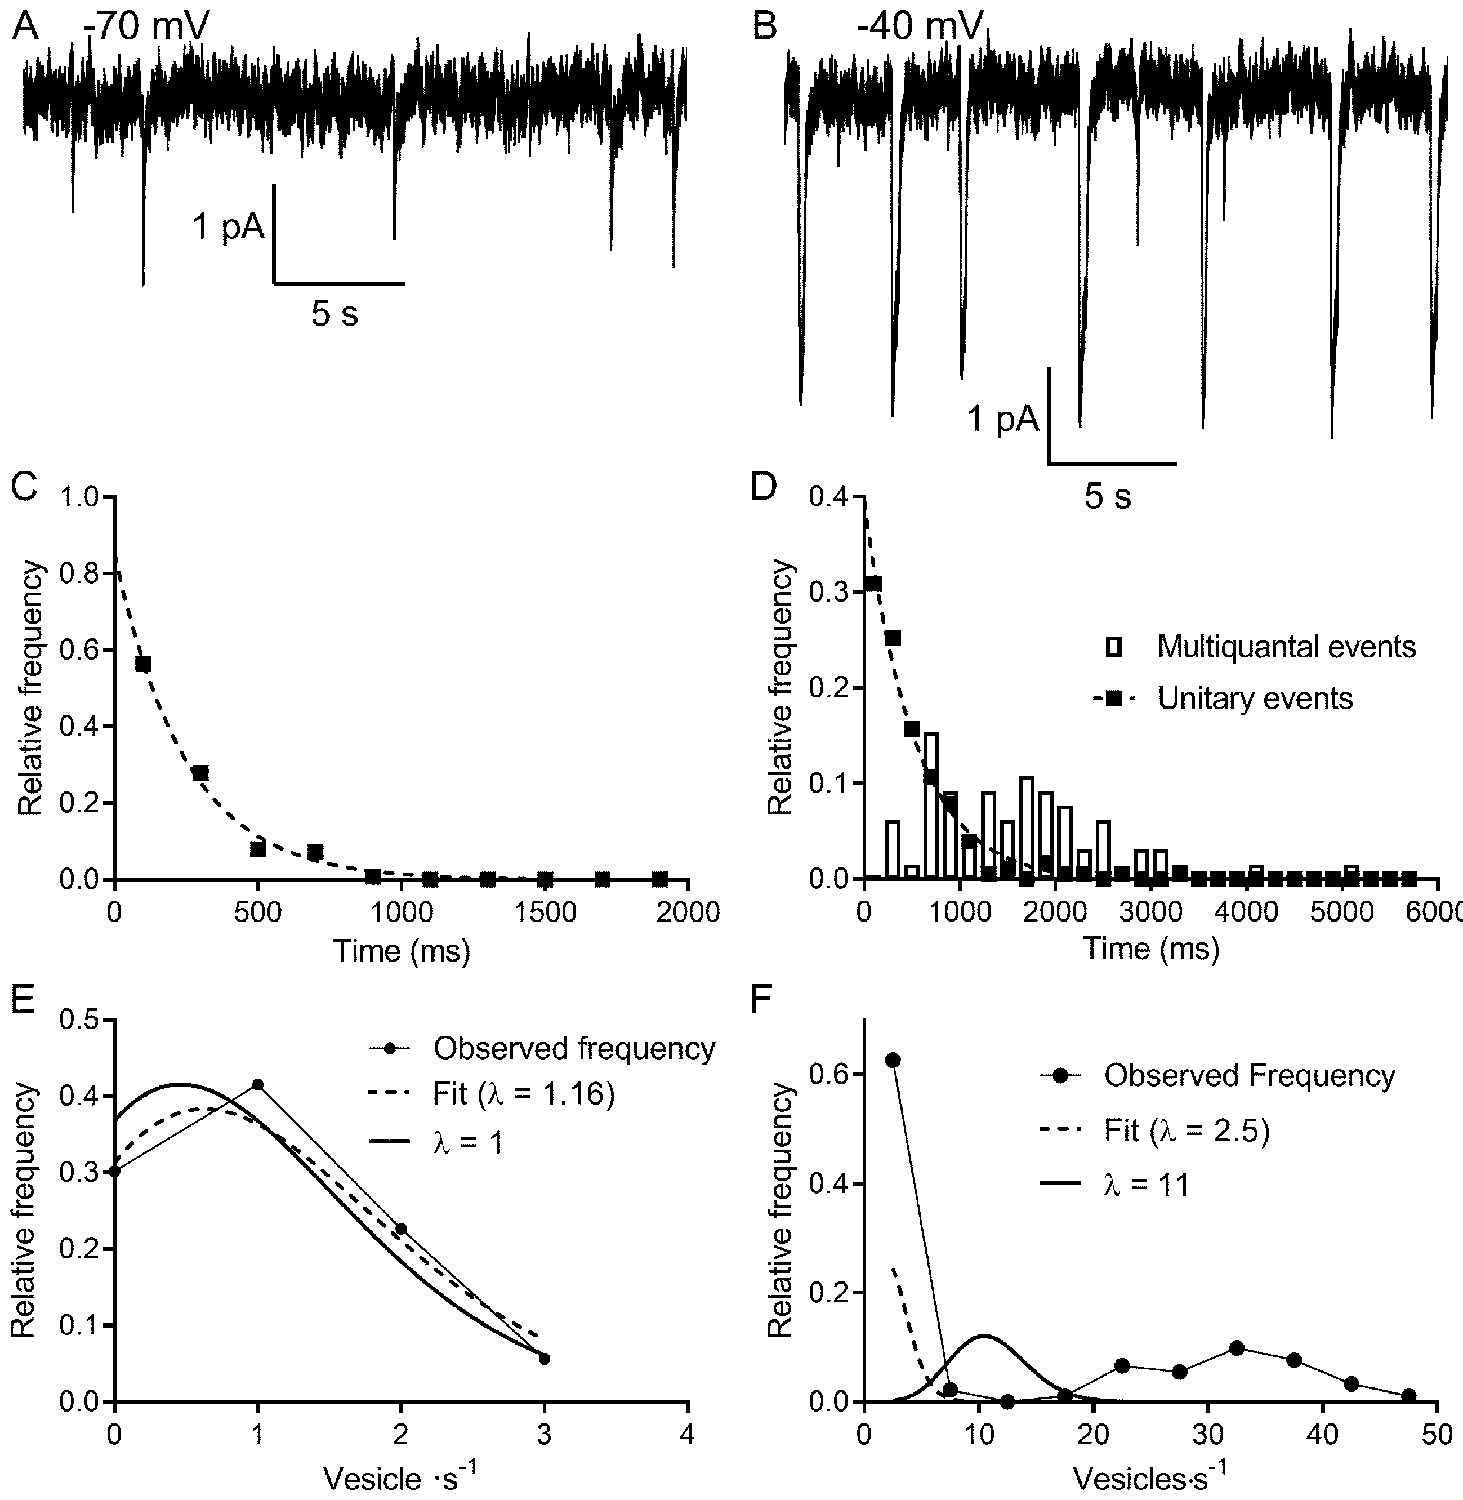
Multivesicular release events are not Poisson distributed in time.
(A, B) Lengthy recording segments illustrating the stochastic release of individual vesicles at −70 mV (A) with more regular multivesicular release events at −40 mV (B). (C) Plot of the interevent interval frequency distribution for unitary events measured at −70 mV. Consistent with a Poisson distribution, these data were well fit with a one-phase exponential decay (τ = 248 ms; R2 = 0.993). (D) Frequency histogram of intervals between both unitary (filled squares) and multivesicular (open bars) events. The distribution of intervals between unitary events was well described by a single exponential function (τ = 532 ms; R2 = 0.985), whereas the intervals between multivesicular events were poorly fit with a single exponential. (E) Graph of the relative frequency of individual vesicle release events measured at −70 mV occurring in 1 s bins measured over 90–180 s. Data were fit with the Poisson equation (Equation 6) constrained to the observed mean of λ = 1 event per s (dashed line, calculated, R2 = 0.88). We obtained an even better fit but with a similar value for λ when it was unconstrained (dashed line, fit λ = 1.16, R2 = 0.95). Data from the same cell shown in (C and D). (F) Graph of the relative frequency of quanta released in each 1 s bin. If we consider each of the quanta released in a multivesicular event as separate release events, then there were either 0 or ~35 quanta released per second. This distribution was not well described by Poisson statistics, whether λ was constrained to match the actual mean quantal rate of 10.98 (solid line, R2 = −0.39) or when λ was unconstrained (dashed line, best fit λ = 2.5, R2 = 0.46).
Figure 3

Multivesicular events increased in amplitude and declined in frequency during recording.
(A, B) Example traces recorded from the same rod held at −40 mV during the first minute (A) and after 5 min (B). (C) The amplitude of multivesicular events as a function of time during the recording. (D) The intervals between multivesicular events as a function of time (room temperature). The plot of intervals (s) as a function of time after patch rupture (min) was fit with a linear regression (y-intercept = 1.22 s, slope = 0.33 s/min, R2 = 0.42, n = 123 intervals).
Figure 4
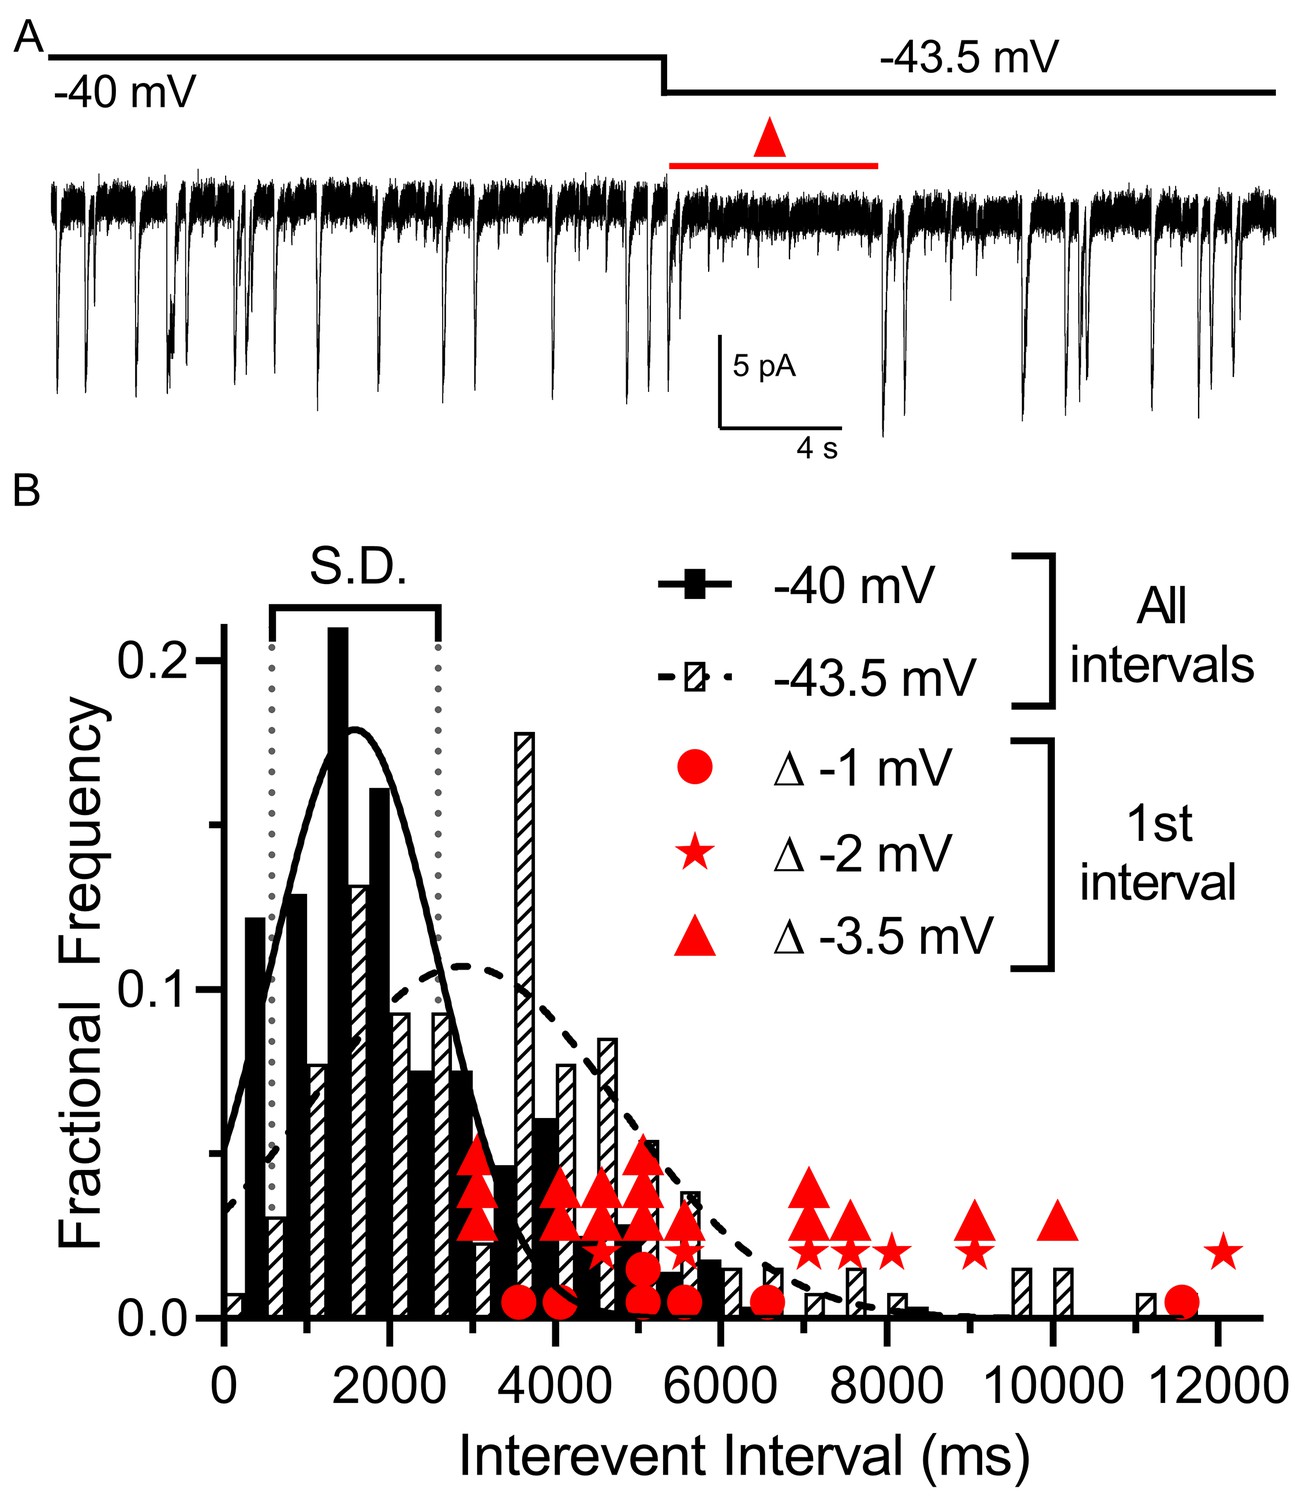
Multivesicular release was sensitive to small hyperpolarizing steps.
(A) Example trace showing that multivesicular IA(glu) release events paused for several seconds immediately after hyperpolarizing the rod from −40 to −43.5 mV and the overall rate of these events remained slower for the remainder of the step. Red triangle denotes the time interval measured and plotted as red triangles in panel B. (B) Frequency distribution of intervals between multivesicular events measured at −40 and −43.5 mV (n = 9 rods), each fit with a single Gaussian (−40 mV, 1583 ± 1004 ms; −43.5 mV, 2896 ± 1872 ms). Hyperpolarization from −40 (279 events) to −43.5 (129 events) significantly extended the mean interval between multivesicular events (p<0.0001, unpaired t-test). Filled circles, stars and triangles show the intervals measured in individual trials immediately after hyperpolarizing steps of 1 (n = 7), 2 (n = 7), or 3.5 mV (n = 16) from a prior holding potential of −40 mV, respectively. All of these intervals were >1 standard deviation (vertical dotted lines) above the mean interval between multivesicular events measured at −40 mV.
Figure 5
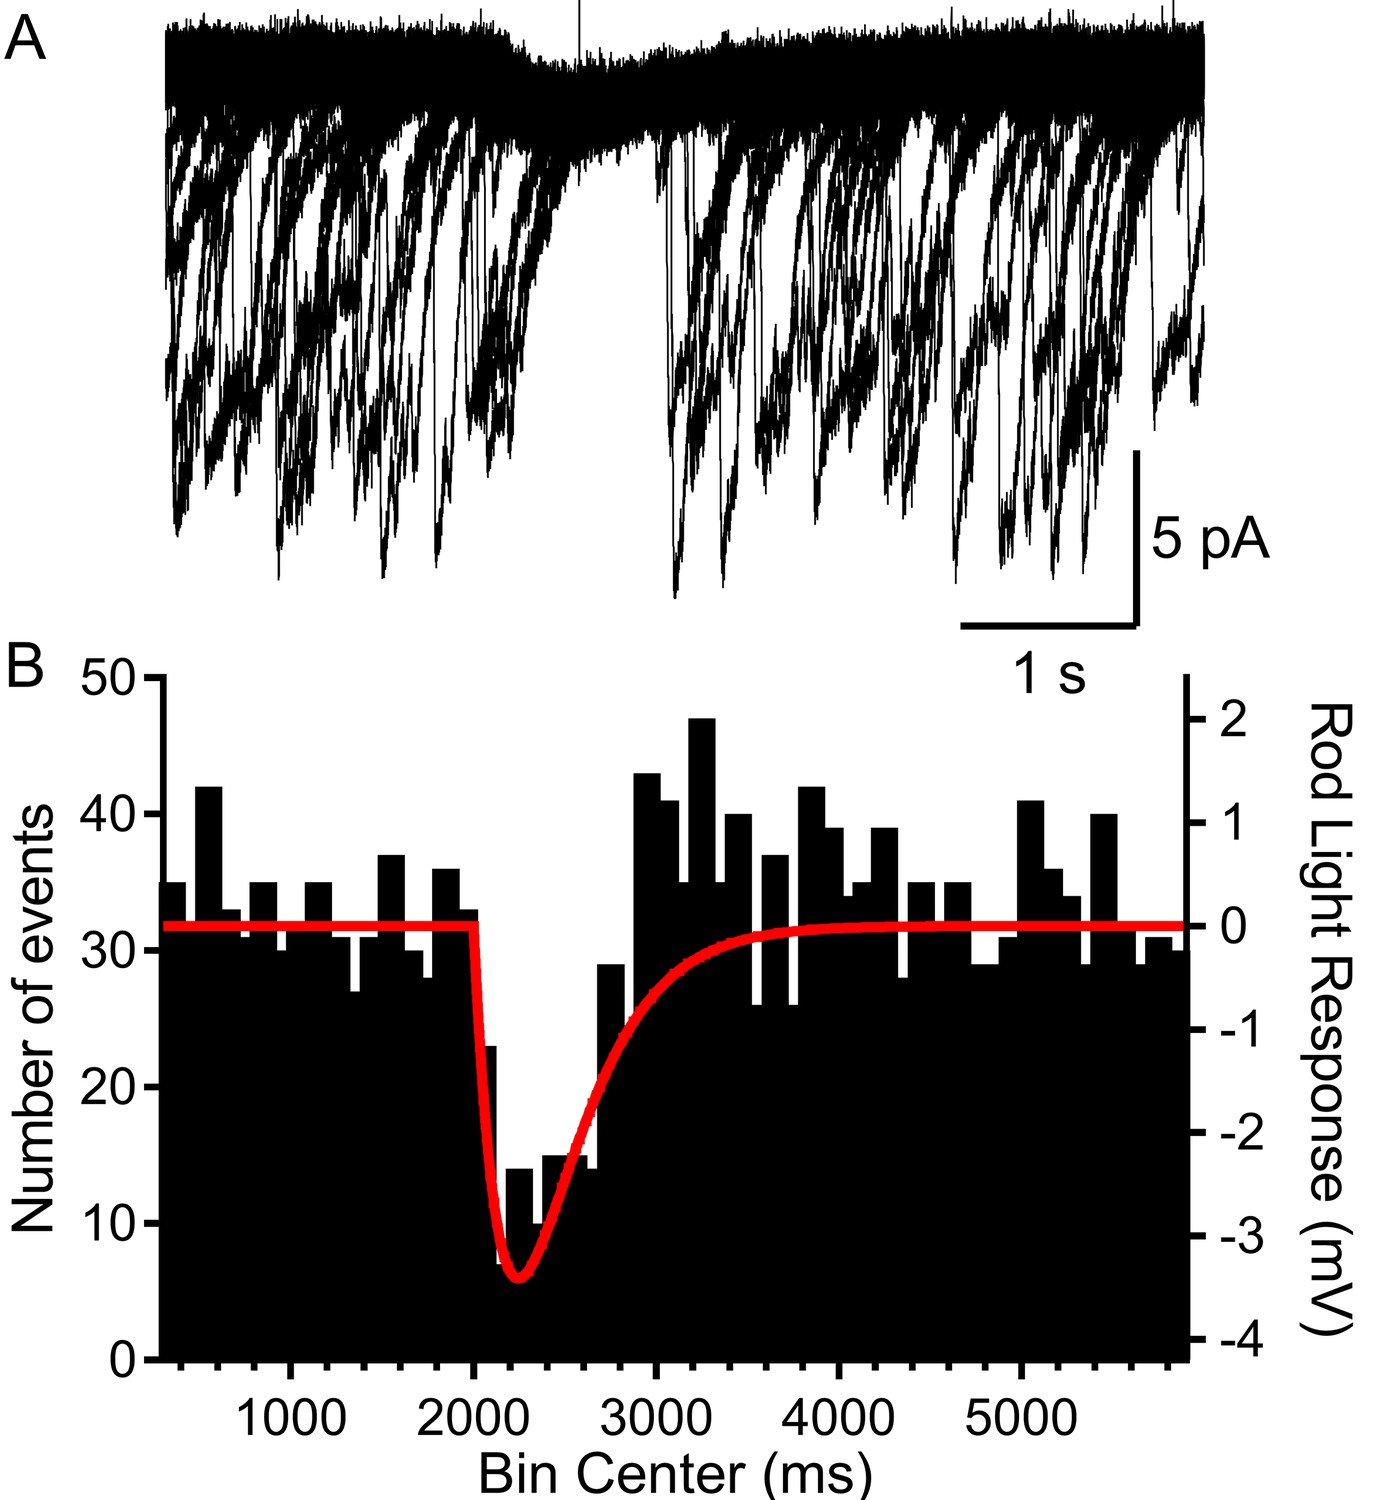
Rods voltage-clamped at −40 were presented a voltage stimulus that mimicked the single-photon response of mouse rods.
(A) Example of a rod presented with the voltage stimulus 30 consecutive times, showing an appreciable pause in release during the single-photon voltage waveform. (B) Summary data showing the number of multivesicular events (1892 events, 28 rods) initiated before, during, and after the voltage stimulus (red trace). Multivesicular release events were almost never initiated during the single-photon waveform.
-
Figure 5—source data 1
Start times for multivesicular events during simulated single-photon light responses.
- https://cdn.elifesciences.org/articles/67446/elife-67446-fig5-data1-v2.xlsx
Figure 6
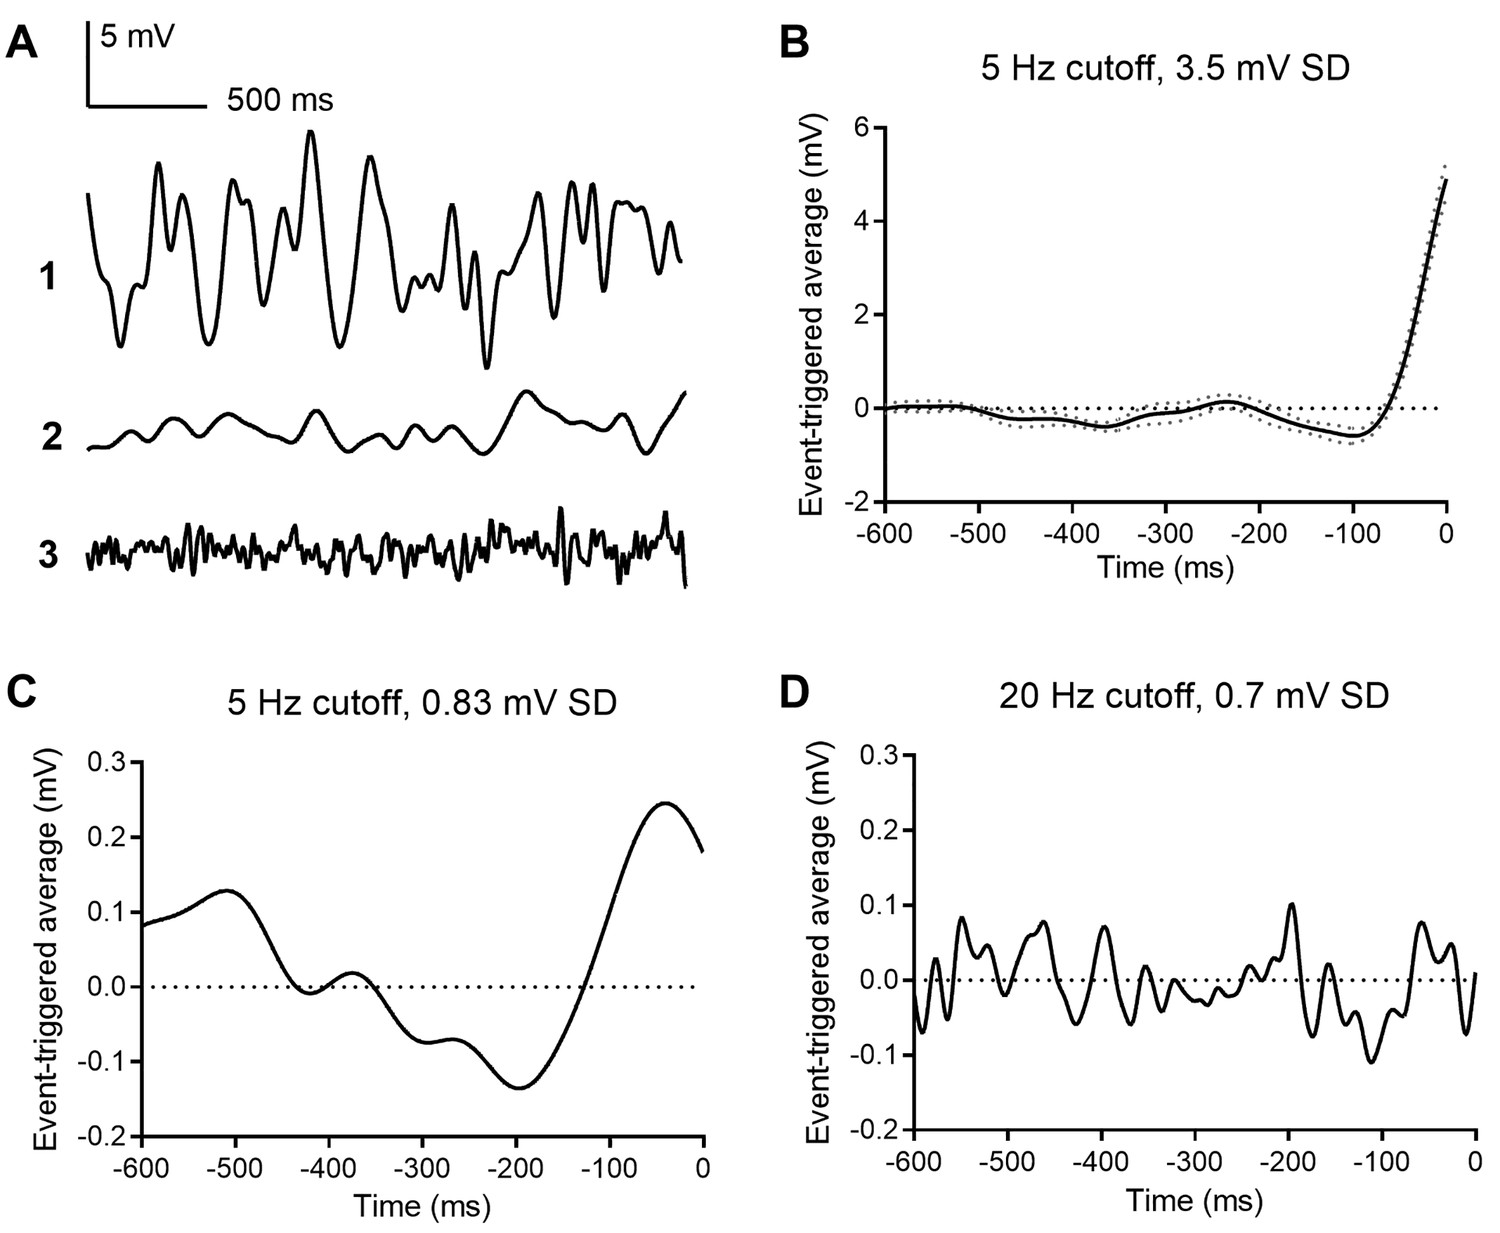
Event triggered averages (ETAs) compiled from responses to white noise voltage stimuli.
(A) 2.5 s segments of white noise voltage stimulus with 5 Hz cut-off and 3.5 mV SD. (B) ETA evoked by the same white noise stimulus. (C) ETA evoked by a smaller stimulus with 5 Hz cutoff but only 0.8 mV SD. (D) ETA evoked by a white noise stimulus with 20 Hz cut-off and 0.7 mV SD.
Figure 7
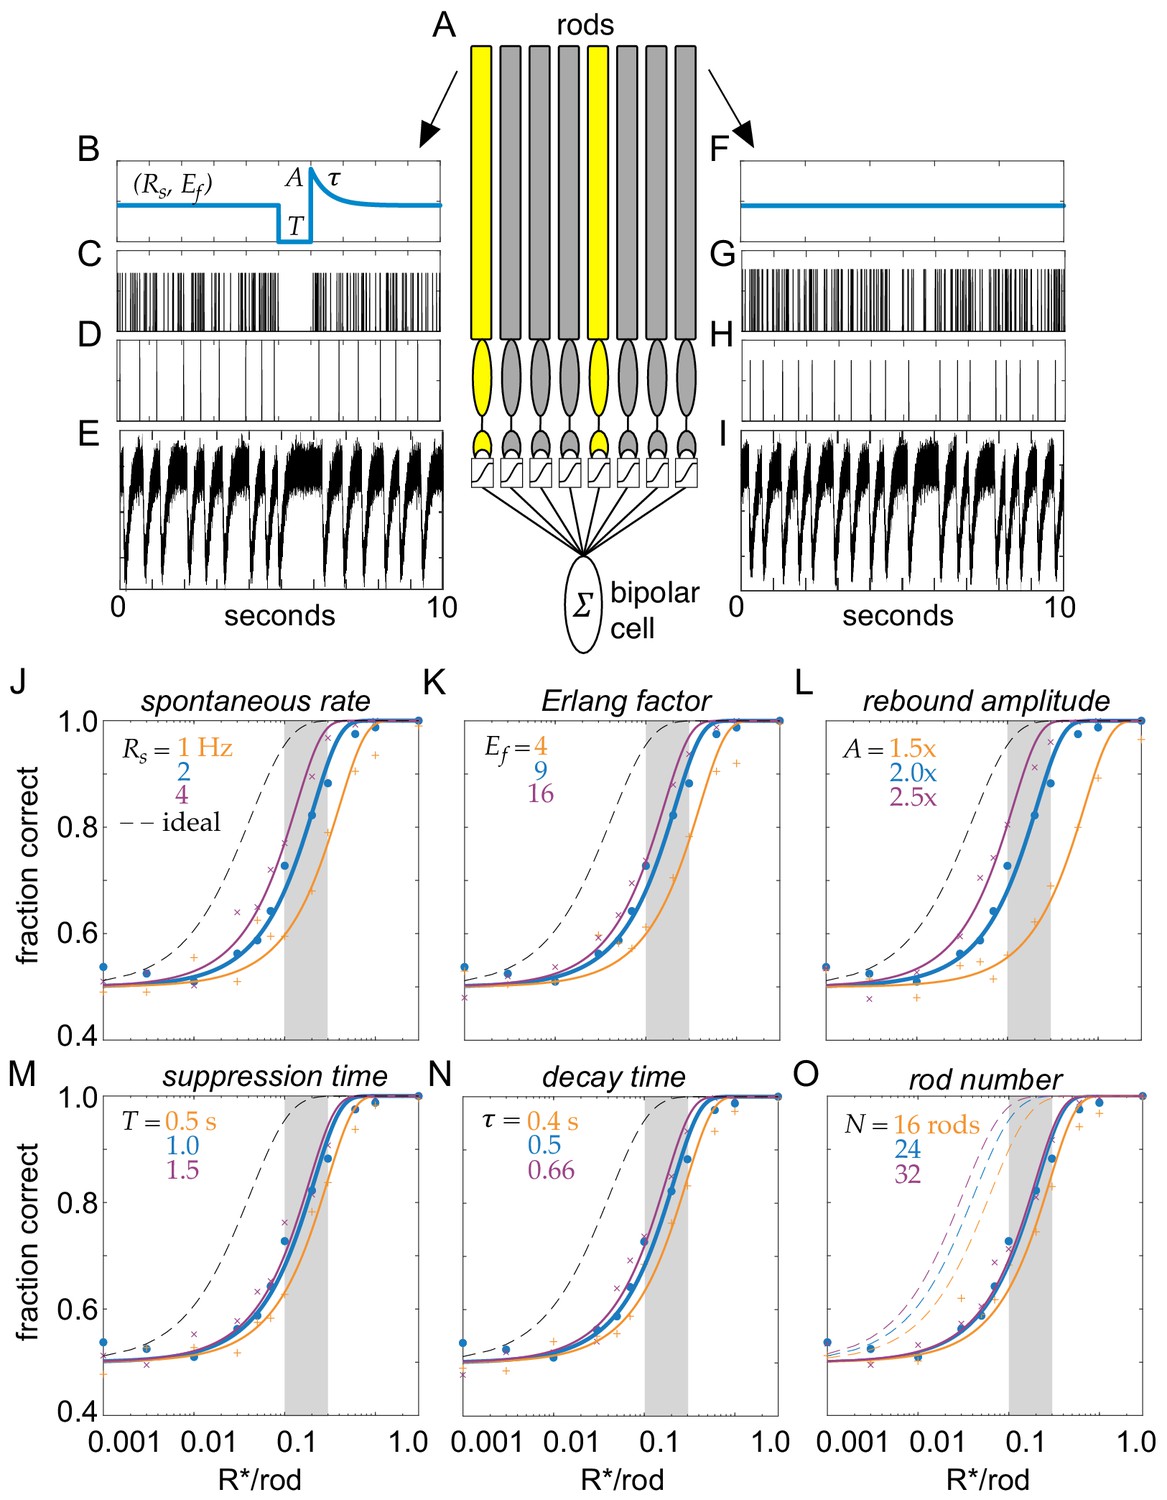
Model of clockwork multivesicular release can account for the detection threshold of rod-bipolar cells.
(A) Schematic of a pool of simulated rod photoreceptors providing input to a simulated rod-bipolar cell. Yellow rods indicate cells absorbing a photon; gray rods indicate cells generating only noise. (B) Temporal dynamics of transmitter release illustrating the key parameters of the Erlang release model (see text for details). A flash is delivered 5 s into the trial. (C) Poisson counts underlying the Erlang process. (D) Accumulation of nine Poisson events in (C) triggers an Erlang event. (E) Erlang events in (D) convolved with function mimicking multivesicular release (Equation 1), with additive Gaussian noise. (F–I) Same as (B–E), but for a rod that does not absorb a photon. (J–O) Fraction correct in two-alternative forced-choice detection task as a function of flash strength. Points show output of model, and curves show cumulative Gaussian fits. Blue shows performance of model for parameters estimated from data. Orange and purple show performance for lower and higher model parameters, respectively, for spontaneous release rate (O), Erlang factor (R), rebound amplitude (L), suppression time (M), decay time (N), and rod number in pool (O).
Figure 8

Temporally regular multivesicular release supports flash detection.
(A) Comparison of different models in 2AFC detection task. Black dashed curve is performance of an ideal photon detector. Green is performance predicted from rod photocurrents. Blue is performance of the multivesicular Erlang release model (Figure 7). Red curves show performance of asynchronous Poisson release for three different release suppression durations (100, 200, and 500 ms). Points show simulation results; curves show cumulative Gaussian fits. (B) Comparison of detection thresholds (75% correct performance) in the 2AFC task for different release rates and Erlang factors, using the multivesicular release model.
Additional files
Download links
A two-part list of links to download the article, or parts of the article, in various formats.
Downloads (link to download the article as PDF)
Open citations (links to open the citations from this article in various online reference manager services)
Cite this article (links to download the citations from this article in formats compatible with various reference manager tools)
Properties of multivesicular release from mouse rod photoreceptors support transmission of single-photon responses
eLife 10:e67446.
https://doi.org/10.7554/eLife.67446


