Conformational specificity of opioid receptors is determined by subcellular location irrespective of agonist
- Cellular and Molecular Biology Program, University of Michigan, United States
- Department of Pharmacology University of Michigan Medical School, United States
Figures
Figure 1 with 3 supplements
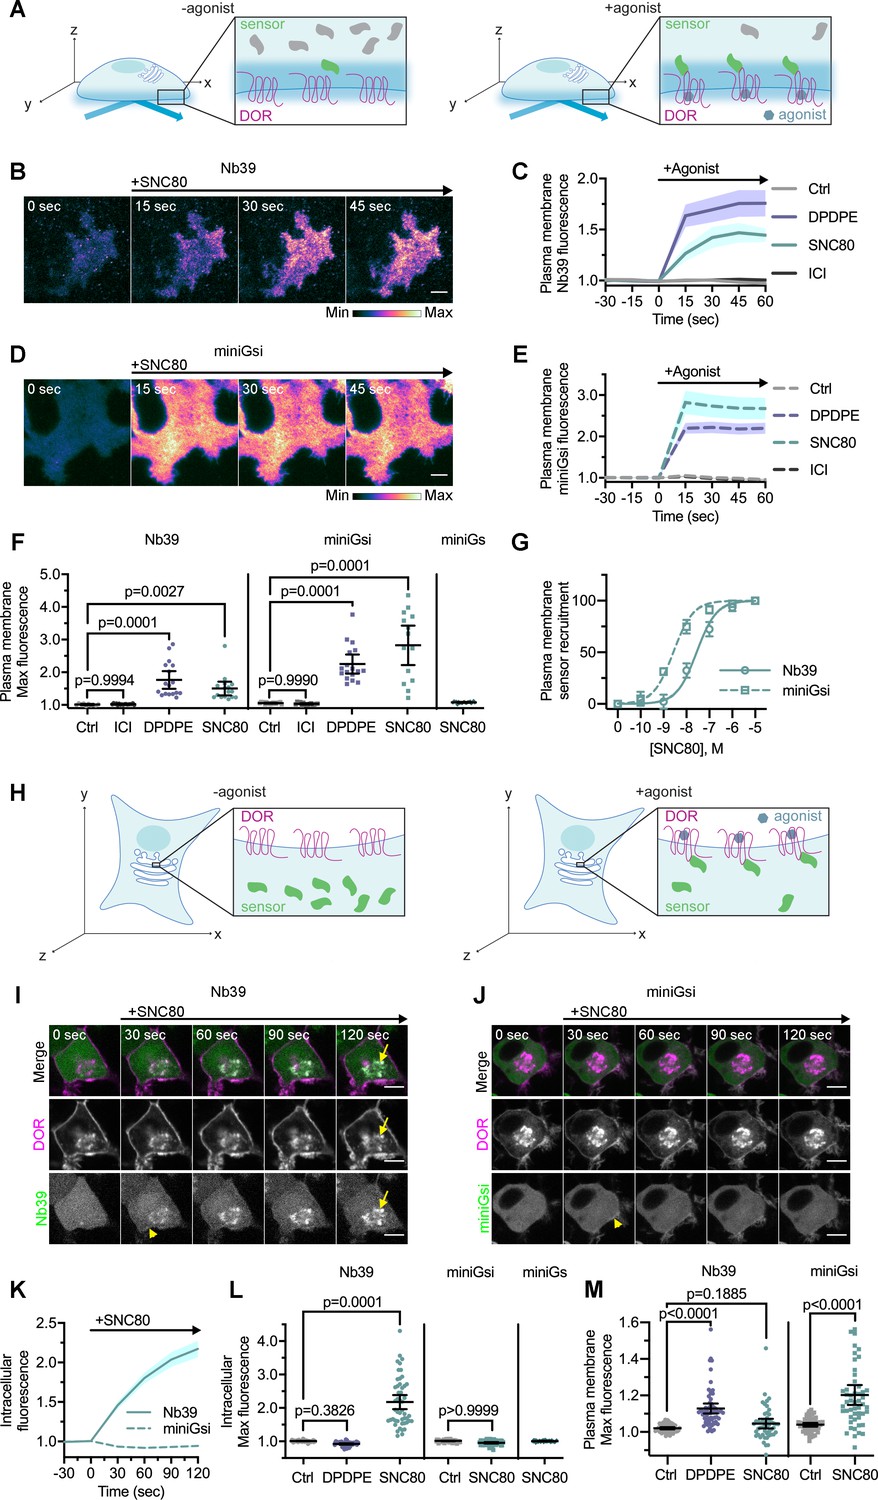
Nb39 and miniGsi are differentially recruited to plasma membrane and intracellular DOR.
(A) Schematic of biosensor recruitment to δ-opioid receptor (DOR) in the plasma membrane (PM) using total internal reflection fluorescence microscopy (TIR-FM). Only fluorescent proteins within the evanescent wave close to the PM were excited, such that baseline fluorescence was low when biosensors were diffuse in the cell but increased upon agonist addition as biosensors were recruited to active DOR in the plasma membrane. (B) Nb39-mVenus in PC12 cells expressing SNAP-DOR imaged using TIR-FM to capture recruitment to the PM after addition of 10 µM SNC80 (scale bar = 5 µm). (C) Increase in Nb39-mVenus fluorescence by TIR-FM normalized to the mean baseline fluorescence over time after addition of 10 µM DOR agonist, DPDPE or SNC80, 10 µM inverse agonist, ICI174864 (ICI), or vehicle control (Ctrl, n = 10 cells; ICI, n = 17 cells; DPDPE, n = 17 cells; SNC80, n = 16 cells; all across three biological replicates defined as coverslips prepared and imaged independently; solid line indicates mean, shading ± SEM). (D) Venus-miniGsi in PC12 cells expressing SNAP-DOR imaged using TIR-FM to capture recruitment to the PM after addition of 10 µM SNC80 (scale bar = 5 µm). Calibration bars indicate relative fluorescence values in scaled images. (E) Increase in Venus-miniGsi fluorescence by TIR-FM normalized to the mean baseline fluorescence over time after addition of 10 µM DPDPE or SNC80, 10 µM inverse agonist ICI, or vehicle control (Ctrl, n = 17 cells; ICI, n = 15 cells; DPDPE, n = 17 cells; SNC80, n = 14 cells; all across three biological replicates; dashed line indicates mean, shading ± SEM). (F) Nb39 max PM biosensor fluorescence significantly increased over baseline within 60 s of addition of either agonist DPDPE or SNC80 but not with addition of inverse agonist ICI, by one-way ANOVA (p<0.0001) with p-values from Dunnett’s multiple comparisons test to vehicle control reported in the figure. miniGsi max PM biosensor fluorescence significantly increased over baseline within 60 s of addition of either agonist DPDPE or SNC80 but not with addition of inverse agonist ICI, by one-way ANOVA (p<0.0001) with p-values from Dunnett’s multiple comparisons test to vehicle control reported in the figure. Venus-miniGs, a sensor for Gs coupling, fluorescence did not visibly increase after addition of 10 µM SNC80 (Nb39: Ctrl, n = 10 cells; ICI, n = 17 cells; DPDPE, n = 17 cells; SNC80, n = 16 cells; miniGsi: Ctrl, n = 17 cells; ICI, n = 15 cells; DPDPE, n = 17 cells; SNC80, n = 14 cells; miniGs-SNC80, n = 20 cells; all across three biological replicates; mean ± 95% CI, points represent individual cells). (G) Concentration-response curves for Nb39 (EC50 = 22.7 nM) and miniGsi (EC50 = 2.284 nM) plasma membrane recruitment measured in TIR-FM, in cells treated with increasing concentrations of SNC80 ranging from 0.1 nM to 10 μM. Responses were normalized from 0 to 100 for cells within each condition (Nb39, n = 13 cells; miniGsi, n = 7 cells; symbols indicate mean normalized response for cells in each condition with error bars indicating ± 95% CI; solid and dashed lines indicate fitted non-linear curves with a standard slope of 1, for Nb39 and miniGsi, respectively). (H) Schematic of biosensor recruitment to DOR in intracellular compartments upon addition of a cell-permeable agonist. Both Nb39 and miniGsi biosensors were diffuse throughout the cytoplasm in the absence of agonist (left), but were expected to localize to membranes containing active receptor upon agonist addition (right). (I) PC12 cells expressing SNAP-DOR (magenta in merge) and Nb39-mVenus (green in merge) were treated with 10 µM SNC80 and imaged live by confocal microscopy. Treatment with SNC80 led to an increase in Nb39-mVenus signal in a perinuclear region (yellow arrow), which colocalized with intracellular DOR (white in merge). A small amount of Nb39 recruitment is also visible at the PM (yellow arrowhead) (scale bar = 5 µm). (J) PC12 cells expressing SNAP-DOR (magenta in merge) and Venus-miniGsi (green in merge) were treated with 10 µM SNC80 and imaged live by confocal microscopy. miniGsi did not localize to intracellular DOR after agonist treatment, though a small amount of miniGsi recruitment is visible at the PM (yellow arrowhead) (scale bar = 5 µm). (K) Nb39 (solid line indicates mean, shading ± SEM) and miniGsi (dashed line, shading ± SEM) fluorescence in the region of the cell defined by intracellular DOR normalized to mean baseline fluorescence over time after addition of 10 µM SNC80 (Nb39, n = 49 cells across four biological replicates; miniGsi, n = 51 cells across three biological replicates). (L) Max intracellular biosensor fluorescence in the region of the cell defined by intracellular DOR within 120 s of agonist addition shows a significant increase in Nb39 recruitment with addition of permeable agonist SNC80 but not with peptide agonist DPDPE, by one-way ANOVA (p<0.0001) with p-values from Dunnett’s multiple comparisons test to vehicle control reported in the figure. In contrast, miniGsi intracellular max fluorescence did not increase upon addition of 10 µM SNC80 by one-tailed Student’s t-test compared to vehicle control. miniGs intracellular max fluorescence also did not visibly increase upon SNC80 treatment (Nb39: Ctrl, n = 61 cells; DPDPE, n = 61 cells; SNC80, n = 49 cells; miniGsi: Ctrl, n = 57 cells; SNC80, n = 51 cells; miniGs: SNC80, n = 36 cells; all across a minimum of three biological replicates; mean ± 95% CI, points represent individual cells). (M) Max plasma membrane biosensor fluorescence in the region of the cell defined by plasma membrane DOR for the same cells quantified in (L) shows a significant increase in Nb39 recruitment with addition of DPDPE and a small but non-significant increase upon addition of SNC80, by one-way ANOVA (p<0.0001). P-values from Dunnett’s multiple comparisons test to vehicle control are reported. MiniGsi plasma membrane max fluorescence also significantly increased upon addition of SNC80, as estimated by one-tailed Student’s t-test, compared to vehicle control (Nb39: Ctrl, n = 61 cells; DPDPE, n = 61 cells; SNC80, n = 49 cells; miniGsi: Ctrl, n = 57 cells; SNC80, n = 51 cells; miniGs: SNC80, n = 36 cells; all across a minimum of three biological replicates; mean ± 95% CI, points represent individual cells with one outlier in the miniGsi SNC80 condition equal to 2.0167, not shown in the graph).
Figure 1—figure supplement 1

DOR expression levels are similar across treatment conditions.
(A) Plasma membrane δ-opioid receptor (DOR) expression levels in cells expressing Nb39, miniGsi, or miniGs were similar across untreated or 10 µM agonist treatment conditions control (Nb39: Ctrl, n = 10 cells; ICI, n = 17 cells; DPDPE, n = 17 cells; SNC80, n = 16 cells; miniGsi: Ctrl, n = 17 cells; ICI, n = 15 cells; DPDPE, n = 17 cells; SNC80, n = 14 cells; miniGs-SNC80, n = 20 cells; across a minimum of three biological replicates; mean ± 95% CI, points represent individual cells). (B) Intracellular DOR expression levels in cells expressing Nb39, miniGsi, or miniGs were similar across untreated or 10 µM agonist treatment conditions (Nb39: Ctrl, n = 61 cells; DPDPE, n = 61 cells; SNC80, n = 49 cells; miniGsi: Ctrl, n = 57 cells; SNC80, n = 51 cells; miniGs: SNC80, n = 36 cells; all across three biological replicates; mean ± 95% CI, points represent individual cells).
Figure 1—figure supplement 2
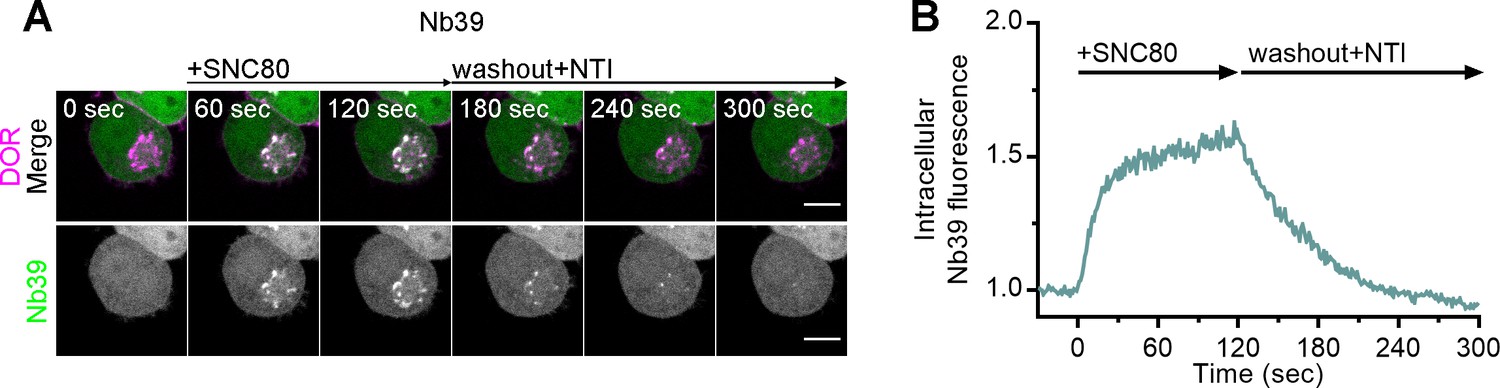
Nb39 recruitment to active DOR is reversible.
(A) PC12 cells expressing SNAP-DOR (magenta in merge) and Nb39-mVenus (green in merge) were imaged live by confocal microscopy. Cells were pretreated with an irreversible, impermeable antagonist β-chlornaltrexamine (CNA) (1 µM) for 15 min prior to imaging to inhibit plasma membrane δ-opioid receptor (DOR) activation and internalization. After 1 µM SNC80 treatment, Nb39-mVenus fluorescence increased in a perinuclear region, which colocalized with intracellular DOR (white in merge), and this recruitment was reversed upon a washout, introducing fresh imaging media containing permeable antagonist naltrindole (NTI, 10 µM) (scale bar = 5 µm). (B) Representative trace of Nb39 fluorescence in the region of the cell defined by intracellular DOR normalized to mean baseline fluorescence for the cell shown in (A).
Figure 1—figure supplement 3

Mechanism of DOR Golgi retention does not influence sensor recruitment to Golgi or PM DOR, and sensor recruitment to intracellular DOR is not correlated with sensor expression.
(A) Nb39, but not miniGsi, max intracellular fluorescence increased over baseline within 120 s of 10 µM SNC80 addition in cells treated with 10 µM PI3K inhibitor LY294002 or 20 µM PI4K inhibitor MI14 to induce δ-opioid receptor (DOR) retention in the Golgi through a DOR-specific and -non-specific mechanism (Malhotra and Campelo, 2011; Wang et al., 2003), respectively (Nb39: PI3Ki, n = 18 cells; PI4Ki, n = 25 cells; miniGsi: PI3Ki, n = 12 cells; PI4Ki, n = 8 cells; all across one biological replicate; mean ± 95% CI, points represent individual cells). (B) Nb39 and miniGsi max plasma membrane fluorescence increased to a similar degree within 60 s of 10 µM SNC80 addition in untreated cells without Golgi DOR and nerve growth factor (NGF)-treated cells with Golgi DOR (Nb39: untreated, n = 16 cells; NGF, n = 7 cells; miniGsi: untreated, n = 14 cells; NGF, n = 11 cells; all across one biological replicate; mean ± 95% CI, points represent individual cells). (C) Scatterplot of max intracellular fluorescence increase and corresponding mean Nb39 fluorescence as a measure of sensor expression (n = 49 cells, points represent individual cells). Linear regression analysis indicated no significant correlation between max intracellular fluorescence increase and Nb39 expression (R2 = 0.05745, p=0.0972). (D) Scatterplot of max intracellular fluorescence increase and corresponding mean miniGsi fluorescence as a measure of sensor expression (n = 51 cells, points represent individual cells). Linear regression analysis indicated no significant correlation between max intracellular fluorescence increase and miniGsi expression (R2 = 0.005465, p=0.6062).
Figure 2
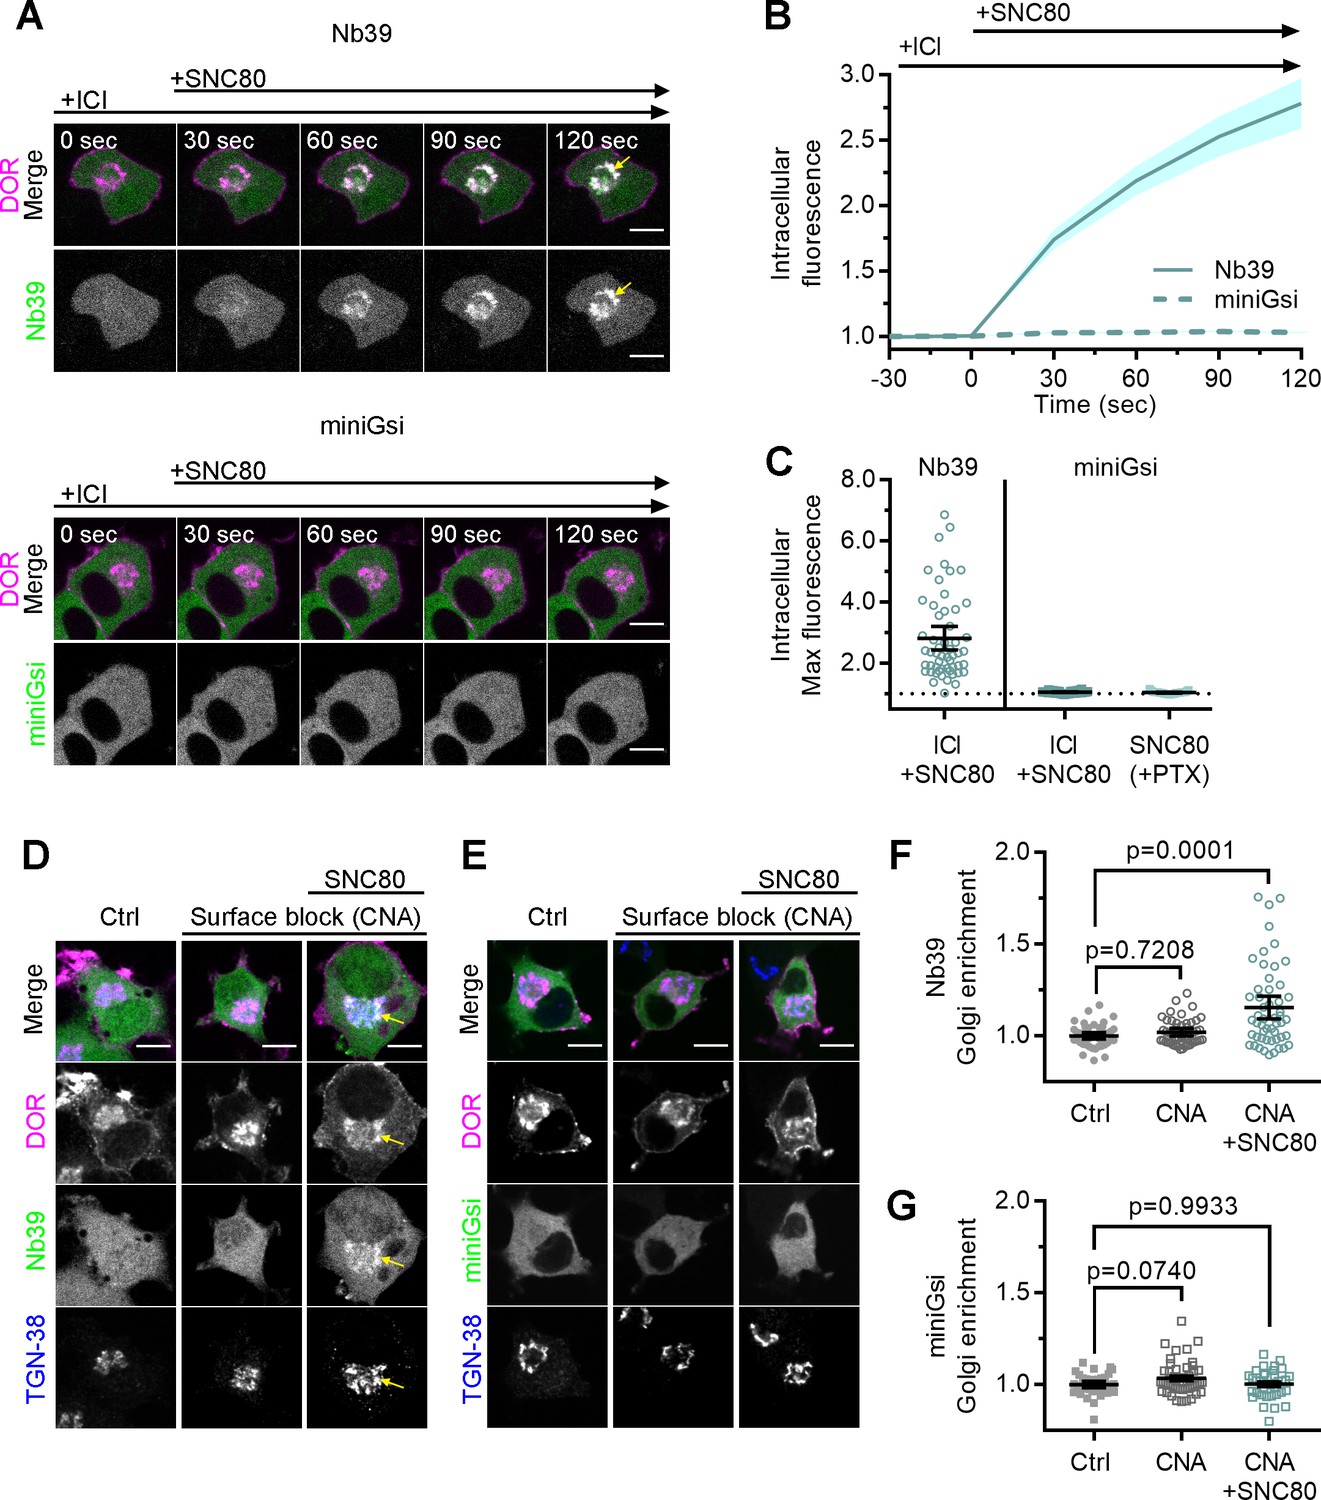
Differential sensor recruitment to Golgi DOR is independent of plasma membrane DOR activation.
(A) PC12 cells expressing SNAP-DOR (magenta in merge) and Nb39-mVenus or Venus-miniGsi (green in merge) were imaged live by confocal microscopy with 100 µM ICI174864 (ICI) present in the media before addition of 100 nM SNC80. After SNC80 treatment, Nb39-mVenus fluorescence increased in a perinuclear region (yellow arrow), which colocalized with intracellular δ-opioid receptor (DOR) (white in merge), whereas Venus-miniGsi remained diffuse through the cell (scale bar = 5 µm). (B) Nb39 (solid line indicates mean, shading ± SEM) or miniGsi (dashed line, shading ± SEM) fluorescence in the region of the cell defined by intracellular DOR normalized to mean baseline fluorescence in cells treated with 100 µM ICI and 100 nM SNC80 (Nb39, n = 54 cells across three biological replicates; miniGsi, n = 58 cells across four biological replicates). (C) Nb39-mVenus max intracellular fluorescence increased over baseline within 120 s of SNC80 in cells treated with 100 µM ICI and 100 nM SNC80. In contrast, miniGsi intracellular max fluorescence did not visibly increase over baseline in cells treated with ICI and SNC80, nor in cells pretreated with pertussis toxin (PTX) and SNC80 (Nb39: ICI + SNC80, n = 54 cells; miniGsi: ICI + SNC80, n = 58 cells; PTX + SNC80, n = 33 cells; mean ± 95% CI, points represent individual cells). (D) PC12 cells expressing Flag-DOR and Nb39-mVenus or Venus-miniGsi, (E) (green in merge) were treated with either 10 µM β-chlornaltrexamine (CNA) alone for 15 min or 10 µM CNA for 15 min followed by 10 µM SNC80 for 5 min, then fixed and stained for Flag (magenta in merge) and trans-Golgi network marker TGN-38 (blue in merge) (scale bar = 5 µm). Colocalization of DOR, Nb39, and TGN-38 is visible in white and light blue (yellow arrow) in cells treated with CNA and SNC80, but not CNA alone. (F) Normalized Nb39-mVenus fluorescence enriched in the Golgi, expressed as sensor fluorescence in the region of the cell defined by TGN-38 staining divided by sensor fluorescence in the region of the cell not containing TGN-38 staining. Nb39 Golgi enrichment was significantly increased in cells treated with CNA and SNC80, but not CNA alone, by one-way ANOVA (p<0.0001) with p-values reported in the figure from Dunnett’s multiple comparisons test compared to control cells (Ctrl, n = 46 cells; CNA, n = 49; CNA + SNC80, n = 52; all across two biological replicates; points indicate individual cells with bars representing mean ± 95% CI). (G) Venus-miniGsi Golgi enrichment was not significantly increased in cells treated with either CNA and SNC80 or CNA alone, by one-way ANOVA (p=0.0654) with p-values reported in the figure from Dunnett’s multiple comparisons test compared to control cells (Ctrl, n = 40 cells; CNA, n = 50; CNA + SNC80, n = 37; all across two biological replicates; points indicate individual cells with bars representing mean ± 95% CI).
Figure 3
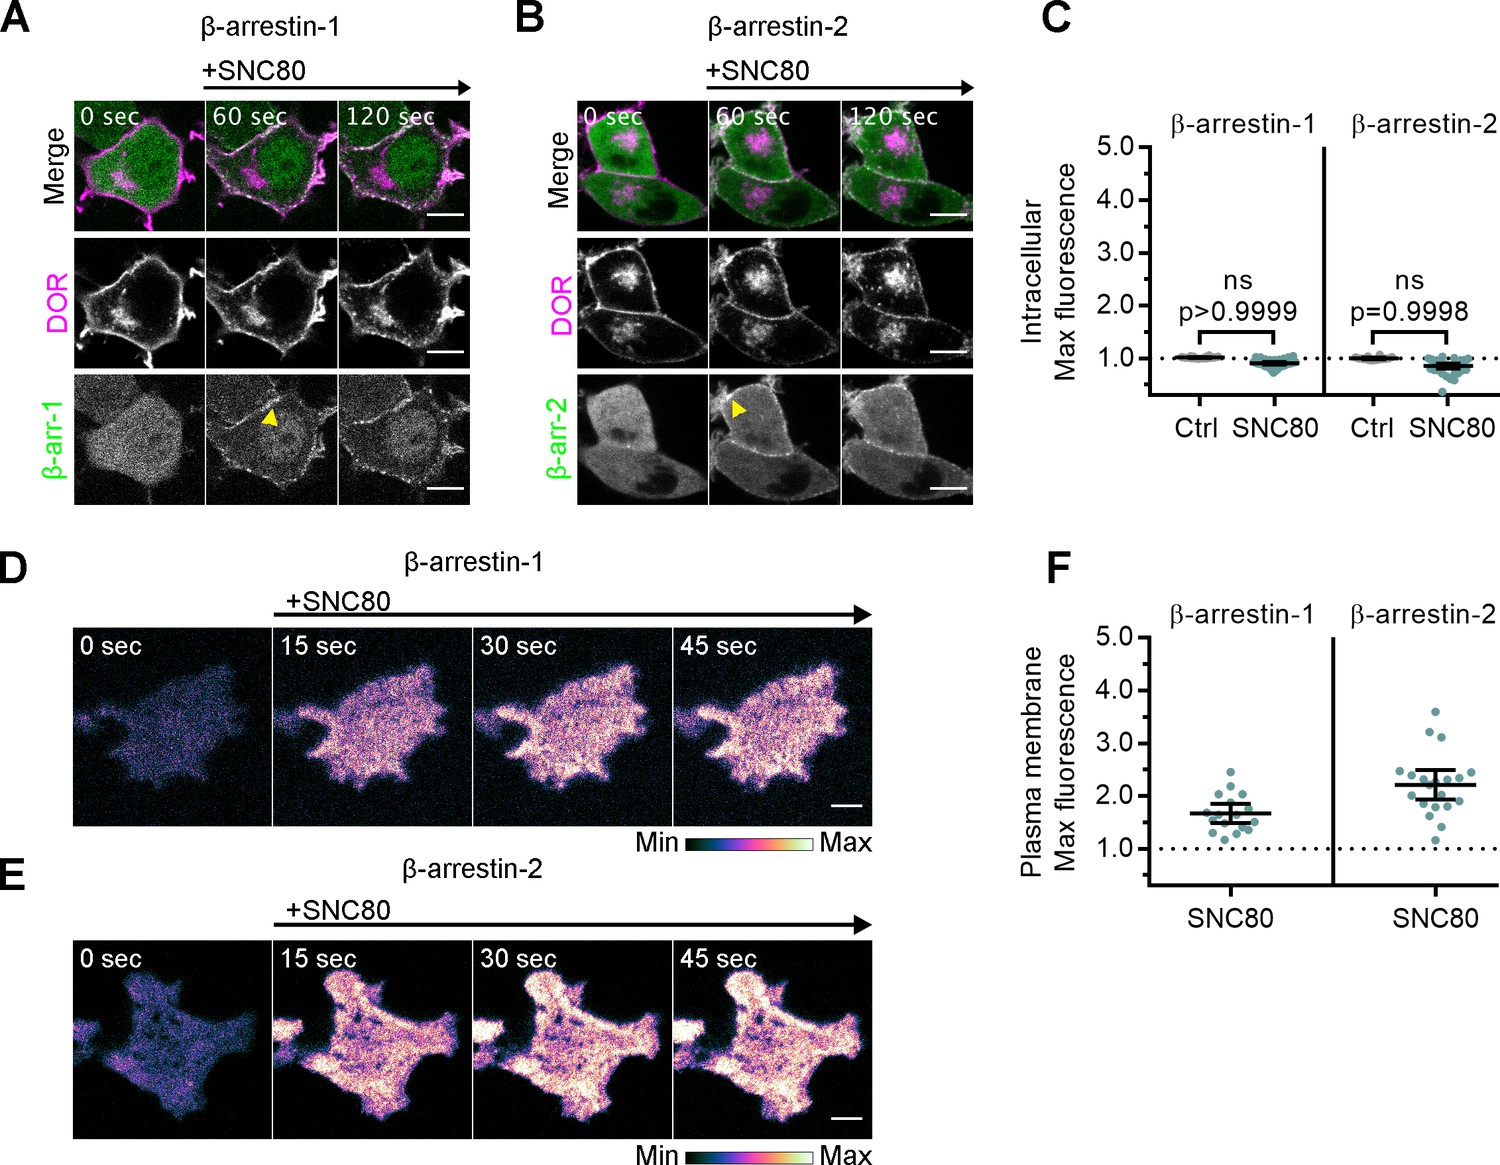
Arrestins are differentially recruited to plasma membrane and intracellular DOR.
(A) PC12 cells expressing SNAP-DOR (magenta in merge) and β-arrestin-1-mScarlet (green in merge) were treated with 10 µM SNC80 and imaged live by confocal microscopy. β-arrestin-1-mScarlet signal increased at the plasma membrane (PM) (yellow arrowhead) but not at sites colocalized with intracellular δ-opioid receptor (DOR) upon 10 µM SNC80 treatment (scale bar = 5 µm). (B) PC12 cells expressing SNAP-DOR (magenta in merge) and β-arrestin-2-tdTomato (green in merge). β-arrestin-2-tdTomato signal increased at the PM (yellow arrowhead) but not at sites colocalized with intracellular DOR upon 10 µM SNC80 treatment (scale bar = 5 µm). (C) Neither β-arrestin-1-mScarlet nor β-arrestin-2-tdTomato max intracellular fluorescence significantly increased within 120 s of SNC80 addition by one-tailed Student’s t-test compared to control cells (β-arr-1: Ctrl, n = 16 cells; SNC80, n = 33 cells; β-arr-2: Ctrl, n = 14 cells; SNC80, n = 37 cells; with control conditions across one biological replicate and SNC80 conditions across three biological replicates; mean ± 95% CI, points represent individual cells). (D) β-arrestin-1-mScarlet in PC12 cells expressing SNAP-DOR imaged using total internal fluorescence reflection microscopy (TIR-FM) to capture recruitment to the PM after addition of 10 µM SNC80 (scale bar = 5 µm). (E) β-arrestin-2-tdTomato in PC12 cells expressing SNAP-DOR imaged using TIR-FM to capture recruitment to the PM after addition of 10 µM SNC80 (scale bar = 5 µm). Calibration bars indicate relative fluorescence values in scaled images. (F) Both β-arrestin-1-mScarlet and β-arrestin-2-tdTomato max PM fluorescence increased within 60 s of 10 µM SNC80 addition (β-arr-1: SNC80, n = 17 cells; β-arr-2: SNC80, n = 20 cells; all across three biological replicates; mean ± 95% CI, points represent individual cells).
Figure 4 with 1 supplement
Golgi DOR inhibits cAMP.
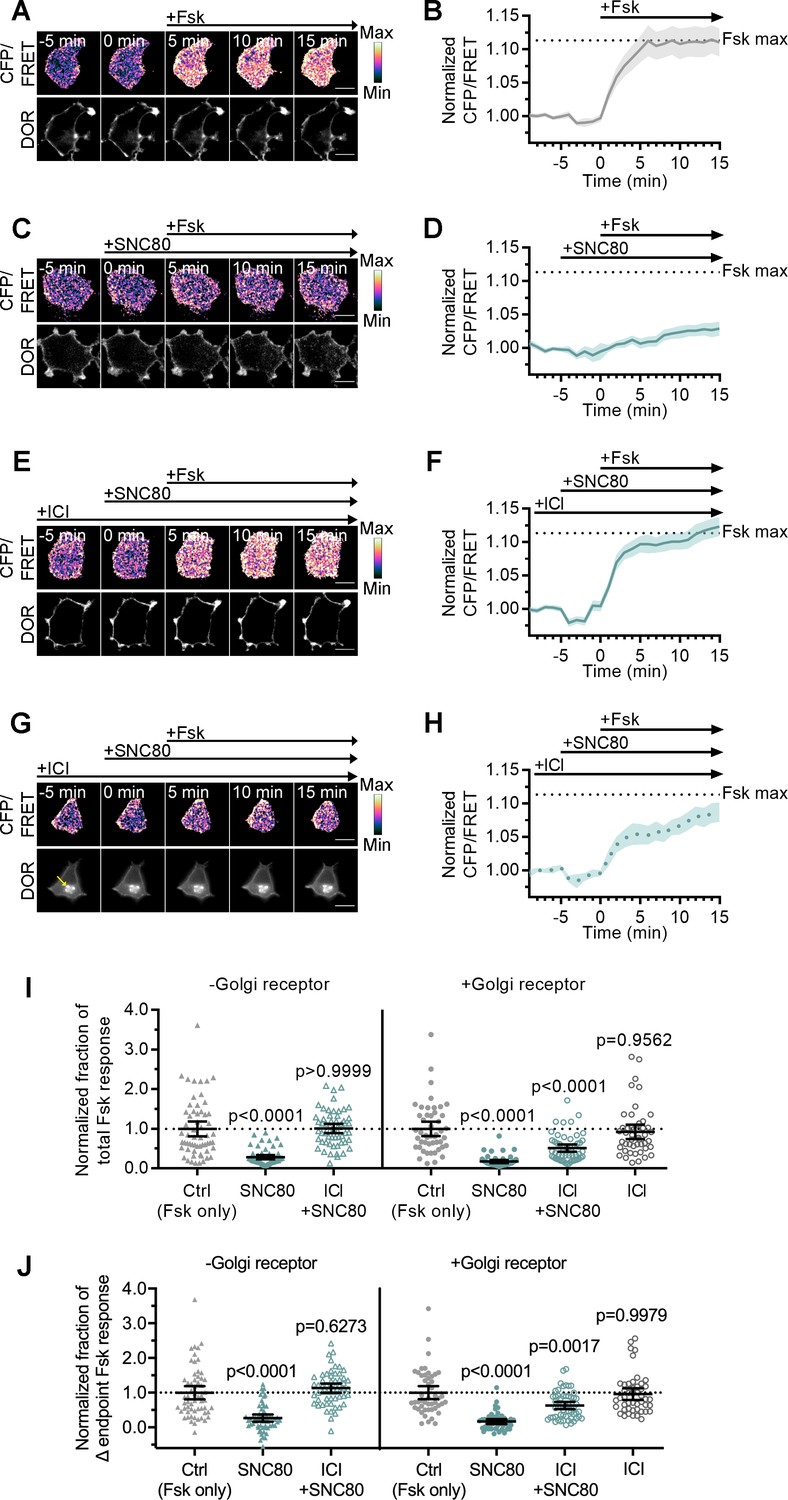
(A–H) Ratiometric CFP/Forster resonance energy transfer (FRET) and receptor images, along with corresponding trace of mean cellular CFP/FRET ratios (solid line indicates mean, shading ± 95% CI), in PC12 cells expressing the ICUE3 cAMP FRET sensor and SNAP-DOR (scale bar = 10 µm). Calibration bars indicate relative fluorescence values in scaled images. (A–B) In cells without intracellular δ-opioid receptor (DOR), CFP/FRET ratio increased over baseline upon treatment with 2 µM forskolin (Fsk), consistent with increase in cellular cAMP levels. (C–D) Treatment with DOR agonist SNC80 (100 nM) decreased Fsk-stimulated increase in CFP/FRET ratio. (E–F) In cells without intracellular DOR, SNC80-dependent decrease in Fsk-stimulated CFP/FRET ratio was reversed when peptide inverse agonist ICI174864 (ICI) (100 µM) was present in media. (G–H) In cells containing intracellular DOR (G, yellow arrow), SNC80 decreased Fsk-stimulated CFP/FRET ratio even when ICI was present in media. (I–J) Fsk-stimulated total cAMP levels (area under the curve) (I) and endpoint CFP/FRET ratios (J), normalized to mean of control treated cells within -Golgi receptor and +Golgi receptor groups. Treatment with 100 nM SNC80 significantly decreased total Fsk-stimulated cAMP and endpoint ratios. ICI and SNC80 treatment of cells without Golgi DOR did not significantly decrease total cAMP or endpoint ratios. In contrast, ICI and SNC80 treatment of cells with Golgi DOR significantly decreased total cAMP and endpoint ratios. ICI treatment alone in cells with Golgi DOR did not significantly decrease total cAMP and endpoint ratios (-Golgi receptor: control, n = 59 cells; SNC80, n = 58; ICI + SNC80, n = 57; +Golgi DOR: control, n = 48; SNC80, n = 50; ICI + SNC80, n = 55; ICI, n = 47; all across two biological replicates; one-way ANOVA (total cAMP, p<0.0001; endpoint cAMP, p<0.0001) with p-values reported in the figure from Sidak’s multiple comparisons test for each condition compared to control cells within –Golgi receptor and +Golgi receptor groups).
Figure 4—figure supplement 1
Golgi DOR inhibits cellular cAMP.
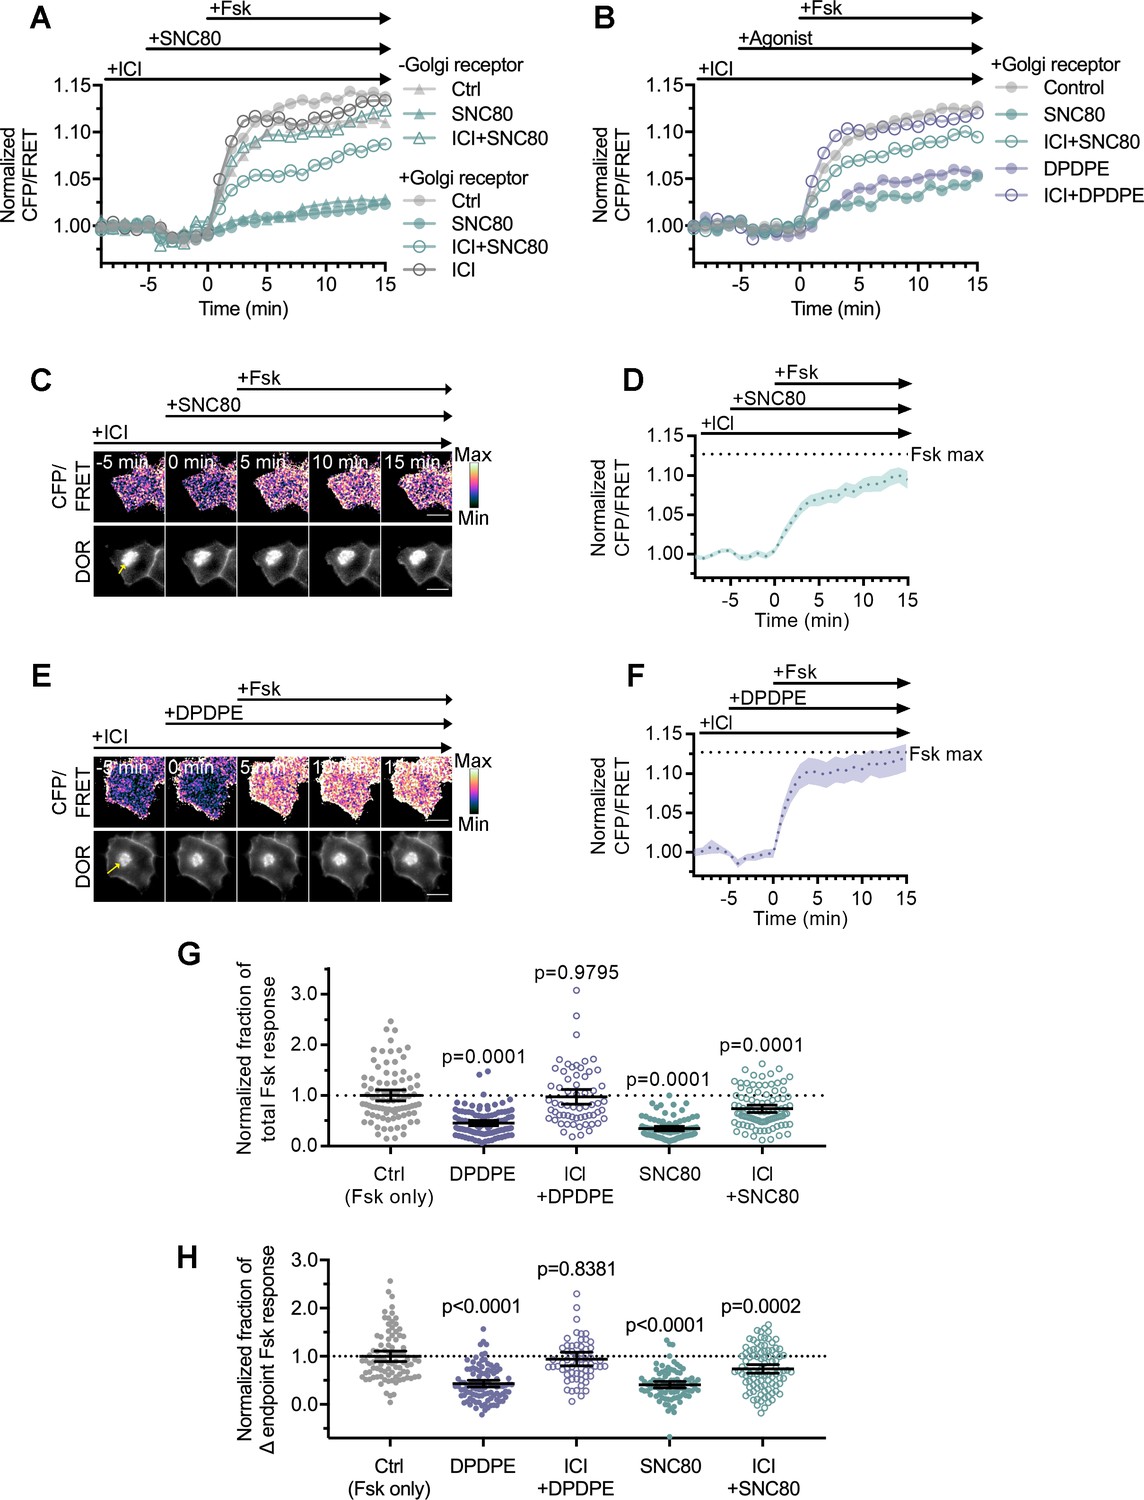
(A) Trace of mean cellular cAMP levels in PC12 cells expressing SNAP-DOR and cAMP Forster resonance energy transfer (FRET) sensor ICUE3 with and without Golgi receptor (-Golgi receptor: control, n = 59 cells; SNC80, n = 58; ICI + SNC80, n = 57; +Golgi DOR: control, n = 48; SNC80, n = 50; ICI + SNC80, n = 55; ICI, n = 47). (B) Trace of mean cellular cAMP levels in PC12 cells expressing SNAP-DOR and ICUE3 with Golgi receptor and treated with either small molecule agonist SNC80 or peptide agonist DPDPE (control, n = 89 cells; DPDPE, n = 101; ICI + DPDPE, n = 62; SNC80, n = 87; ICI + SNC80, n = 95). (C–F) Ratiometric CFP/FRET and receptor images, along with corresponding trace of mean cellular CFP/FRET ratios (solid line indicates mean, shading ± 95% CI), in PC12 cells expressing the ICUE3 cAMP FRET sensor and SNAP-DOR (scale bar = 10 µm). Calibration bars indicate relative fluorescence values in scaled images. (C–D) In cells containing Golgi δ-opioid receptor (DOR) (E, yellow arrow), SNC80 (100 nM) decreased Fsk-stimulated cAMP levels even when peptide inverse agonist ICI174864 (ICI) (100 µM) was present in media. (E–F) In cells containing Golgi DOR (C, yellow arrow), peptide agonist DPDPE (100 nM) did not decrease Fsk-stimulated cAMP levels when peptide inverse agonist ICI (100 µM) was present in media. (G–H) Fsk-stimulated total cAMP levels (area under the curve) (G) and endpoint CFP/FRET ratios (H), normalized to the mean of control treated cells. Cells in all conditions had intracellular DOR. Total and endpoint cAMP responses were significantly decreased in cells treated with 100 nM peptide agonist DPDPE or small molecule agonist SNC80. Total and endpoint cAMP responses were significantly decreased only in cells treated with membrane-permeable agonist SNC80 and not DPDPE when 100 µM ICI was present in media (Ctrl, n = 89 cells; DPDPE, n = 101; ICI + DPDPE, n = 62; SNC80, n = 87; ICI + SNC80, n = 95; all across three biological replicates; one-way ANOVA (total, p<0.0001; endpoint, p<0.0001) with p-values reported in the figure from Dunnett’s multiple comparisons test for each condition compared to control (Fsk only) condition).
Videos
Video 1
PC12 cells expressing SNAP-DOR (magenta) and Nb39 (green) imaged live after addition of 10 µM SNC80 (scale bar = 5 µm).
Nb39 was rapidly recruited to intracellular δ-opioid receptor (DOR) (seen as white due to colocalization) upon SNC80 addition.
Video 2
PC12 cells expressing SNAP-DOR (magenta) and miniGsi (green) imaged live after addition of 10 µM SNC80 (scale bar = 5 µm).
In contrast to Nb39, miniGsi was not recruited to intracellular δ-opioid receptor (DOR) upon SNC80 addition.
Tables
Key resources table
| Reagent type (species) or resource | Designation | Source or reference | Identifiers | Additional information |
|---|---|---|---|---|
| Cell line (Rattus norvegicus, male) | PC12 | ATCC | CRL-1721 | |
| Recombinant DNA reagent | SNAP-DOR | This paper | pcDNA3.1 backbone; see ‘Materials and methods’ | |
| Recombinant DNA reagent | SSF-DOR | Kim and von Zastrow, 2003; PMID:12657666 | ||
| Recombinant DNA reagent | Nb39-mVenus | Che et al., 2020; PMID:32123179 | ||
| Recombinant DNA reagent | Venus-miniGsi | Wan et al., 2018; PMID:29523687 | ||
| Recombinant DNA reagent | Venus-miniGs | Wan et al., 2018; PMID:29523687 | ||
| Recombinant DNA reagent | β-arrestin-1-mScarlet | This paper | pcDNA3.1 backbone; see ‘Materials and methods’ | |
| Recombinant DNA reagent | β-arrestin-2-tdTomato | Weinberg et al., 2017; PMID:28153854 | ||
| Recombinant DNA reagent | ICUE3 | Addgene; DiPilato and Zhang, 2009; PMID:19603118 | Plasmid #61622 | |
| Antibody | Anti-FLAG M1 (mouse monoclonal) | Sigma-Aldrich | #S3040 | (1:1000) |
| Antibody | Anti-TGN-38 (rabbit polyclonal) | Sigma-Aldrich | #T9826 | (1:1000) |
| Chemical compound, drug | SNAP-Cell 647 SiR | New England BioLabs | #S9102S | 1 μM; membrane -permeable SNAP tag substrate |
| Chemical compound, drug | SNAP-Surface 649 | New England BioLabs | #S9159S | 500 nM; membrane -impermeable SNAP tag substrate |
| Chemical compound, drug | Nerve growth factor (NGF) | Gibco | #13257 | 100 ng/ml; induces retention of newly synthesized DOR in the Golgi |
| Chemical compound, drug | LY294002 | Tocris | #1130 | 10 μM; PI3K inhibitor; induces retention of newly synthesized DOR in the Golgi |
| Chemical compound, drug | MI 14 | Tocris | #5604 | 20 μM |
| Chemical compound, drug | SNC80 | Tocris | #0764 | Small molecular DOR agonist |
| Chemical compound, drug | DPDPE | Tocris | #1431 | Peptide DOR agonist |
| Chemical compound, drug | ICI174864 | Tocris | #0820 | 100 μM; Peptide DOR inverse agonist |
| Chemical compound, drug | β-chlornaltrexamine (CNA) | Sigma-Aldrich | #O001 | 10 μM; irreversible antagonist |
| Chemical compound, drug | Cycloheximide (CHX) | Tocris | #0970 | 3 μg/ml; protein synthesis inhibitor |
| Chemical compound, drug | Forskolin | Sigma-Aldrich | #F3917 | 2 μM; adenylyl cyclase activator |
Additional files
-
Source data 1
Numerical data file.
- https://cdn.elifesciences.org/articles/67478/elife-67478-data1-v2.xlsx
-
Transparent reporting form
- https://cdn.elifesciences.org/articles/67478/elife-67478-transrepform-v2.pdf
Download links
A two-part list of links to download the article, or parts of the article, in various formats.
Downloads (link to download the article as PDF)
Open citations (links to open the citations from this article in various online reference manager services)
Cite this article (links to download the citations from this article in formats compatible with various reference manager tools)
Conformational specificity of opioid receptors is determined by subcellular location irrespective of agonist
eLife 10:e67478.
https://doi.org/10.7554/eLife.67478


