Dual mechanisms of opioid-induced respiratory depression in the inspiratory rhythm-generating network
- Center for Integrative Brain Research, Seattle Children’s Research Institute, United States
- Department of Pediatrics, University of Washington, United States
- Department Neurological Surgery, University of Washington, United States
Figures
Figure 1 with 1 supplement

Characterization of Oprm1+ neuron discharge identities and spatial distributions in the preBötC.
(A) Image (left) and schematic (right) illustrating the approach to optotag functionally identified single units in horizontal brainstem slices. (B) Discharge identities of n=223 preBötC neurons (from n=73 horizontal slices) and quantification of Oprm1 expression among each type demonstrating that (C) Oprm1 is evenly expressed in ~50% of all preBötC neuron types (one-way ANOVA [p=0.82]). (D) Image of ChR2:EYFP (cyan) and AlexaFluor568 (magenta) fluorescence in an Oprm1Cre; Rosa26ChR2 (Ai32) horizontal brainstem slice following an intracellular recording experiment. Note the enriched Oprm1− driven expression of ChR2:EYFP within the nucleus ambiguus (NA). (E) Quantified locations of n=58 recorded preBötC neurons from n=35 horizontal slices, caudal and slightly medial to the compact region of the NA, and 2-dimentional distributions in the horizontal plane of Oprm1+ and Oprm1− neurons and pre-inspiratory (pre-insp), inspiratory (insp), expiratory (exp), and tonic neurons. Data shown as means ± SE; ns=not significant.
-
Figure 1—source data 1
Characterization of Oprm1+ neurons.
- https://cdn.elifesciences.org/articles/67523/elife-67523-fig1-data1-v2.xlsx
Figure 1—figure supplement 1
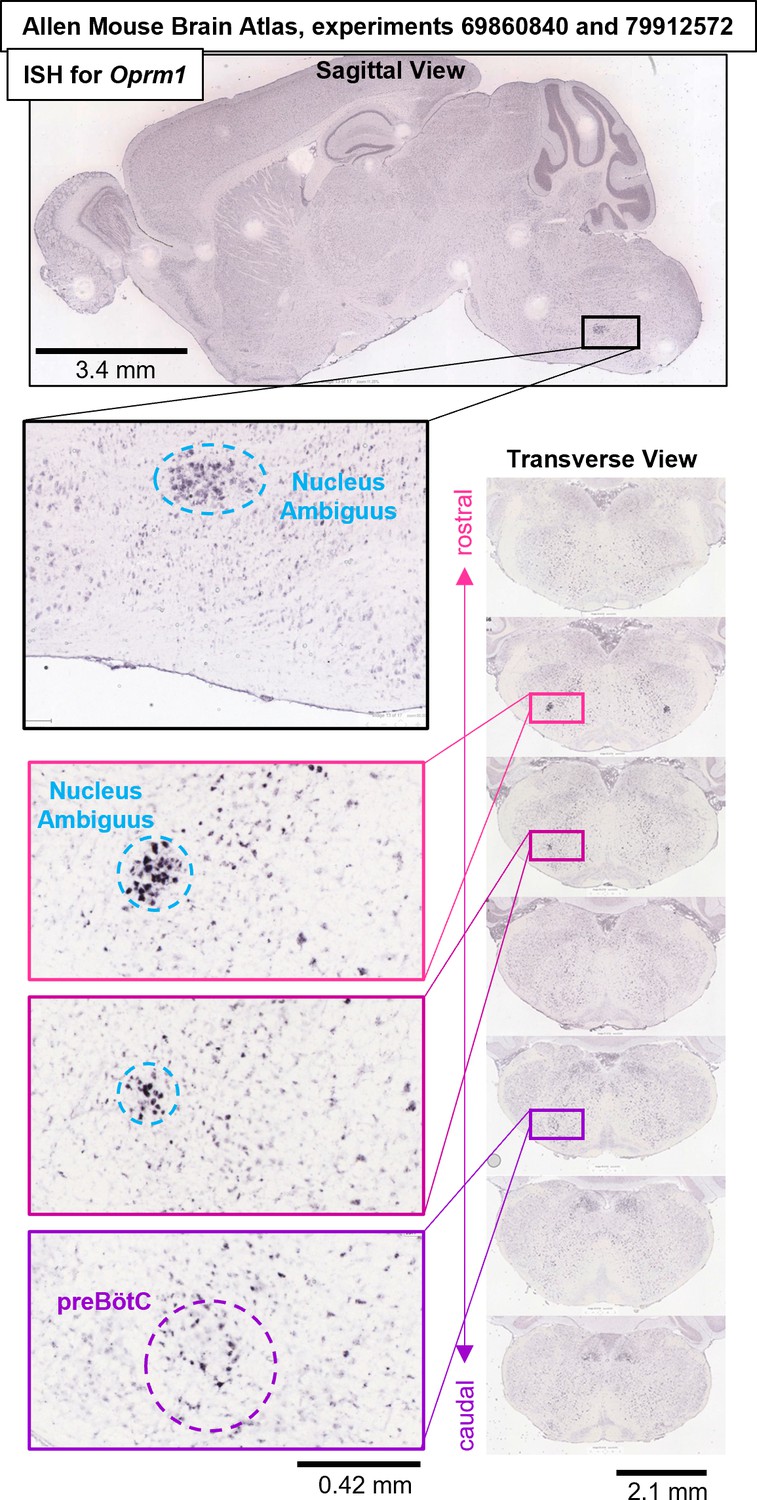
Oprm1 in situ hybridization experiments #69860840 and #79912572 from the Allen Mouse Brain Atlas (Lein et al., 2007) (https://mouse.brain-map.org/search/show?page_num=0&page_size=25&no_paging=false&exact_match=false&search_term=Oprm1&search_type=gene) showing diffuse expression of Oprm1 gene transcripts within the preBötC region and adjacent Nucleus Ambiguus.
Figure 2
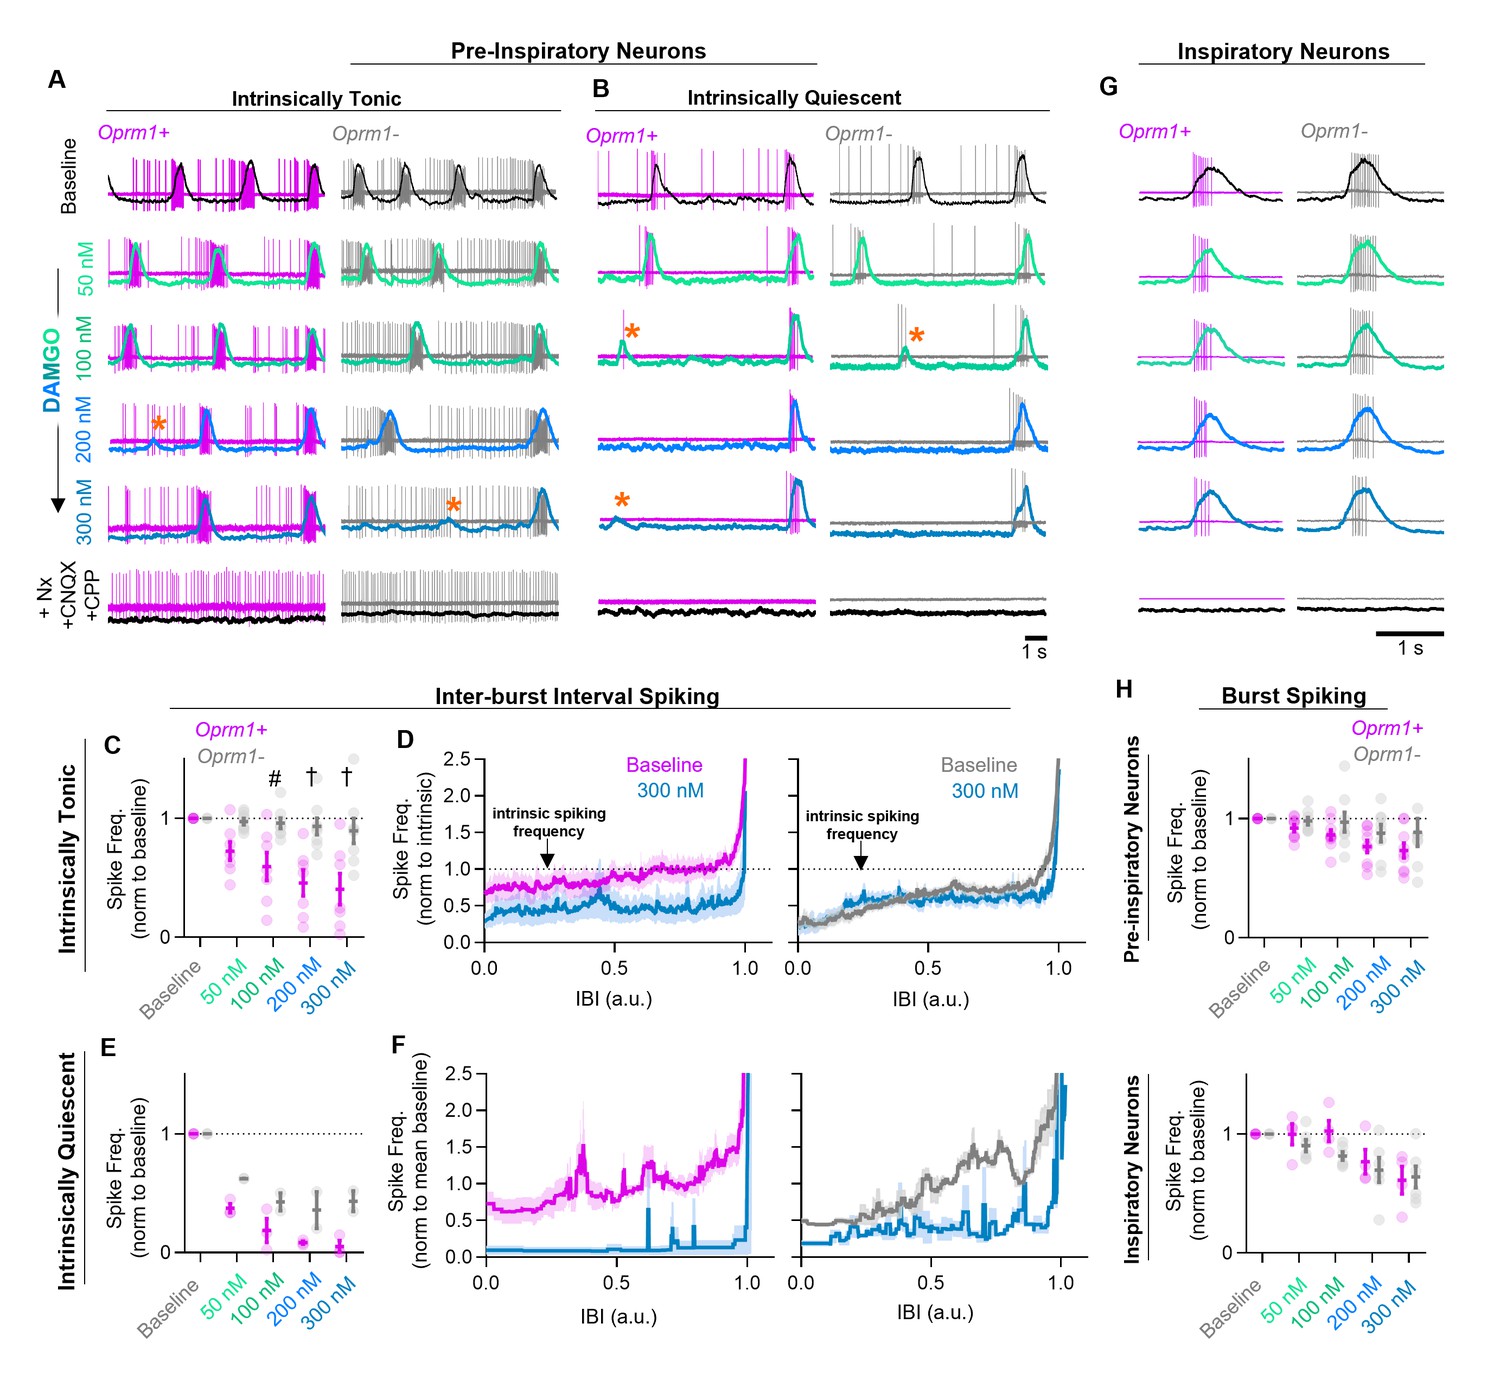
Effects of MOR activation on spiking activity of pre-inspiratory and inspiratory preBötC neurons.
Example cell-attached recordings from Oprm1+ and Oprm1− intrinsically tonic (A) and intrinsically quiescent (B) pre-inspiratory neurons during increasing concentrations of DAMGO (50–300 nM) and following subsequent blockade of MOR activation (5 µM Naloxone, Nx) and excitatory synaptic transmission (20 µM CNQX and CPP). Overlayed traces show integrated population activity from the contralateral preBötC. Orange asterisks indicate burst failures. (C) Comparison of average IBI spiking frequency from intrinsically tonic Oprm1+ (n=7) and Oprm1− (n=8) pre-inspiratory neurons during increasing concentrations of DAMGO (RM two-way ANOVA [p=0.003] and [Bonferroni post hoc tests]). A single neuron was recorded from each slice preparation. (D) Instantaneous spike frequency normalized to intrinsic spiking activity (dotted line) of Oprm1+ and Oprm1− neurons during the IBI at baseline and in 300 nM DAMGO. (E) Average IBI spiking frequency from intrinsically quiescent Oprm1+ (n=3) and Oprm1− (n=2) pre-inspiratory neurons during increasing concentrations of DAMGO (RM two-way RM ANOVA [p=0.045] and Bonferroni post hoc tests). (F) Instantaneous spike frequency normalized to mean baseline IBI spike rate of Oprm1+ and Oprm1− neurons during the IBI at baseline and in 300 nM DAMGO. (G) Example cell-attached recordings from Oprm1+ and Oprm1− inspiratory neurons during increasing concentrations of DAMGO and following subsequent application of Naloxone and blockade of excitatory synaptic transmission. (H) Comparison of average spike frequencies during inspiratory bursts (norm to baseline) in Oprm1+ and Oprm1− pre-inspiratory neurons (top) (RM two-way ANOVA, p=0.187) and inspiratory neurons (bottom) (Oprm1+, n=4; Oprm1−, n=6) (RM two-way ANOVA, p=0.41) during increasing concentrations of DAMGO. Data presented as means± SE; significance of post hoc tests: *p<0.05, #p<0.01, †p<0.001, ‡p<0.0001 compared to baseline.
-
Figure 2—source data 1
Changes in neuronal spiking during OIRD.
- https://cdn.elifesciences.org/articles/67523/elife-67523-fig2-data1-v2.xlsx
Figure 3 with 3 supplements

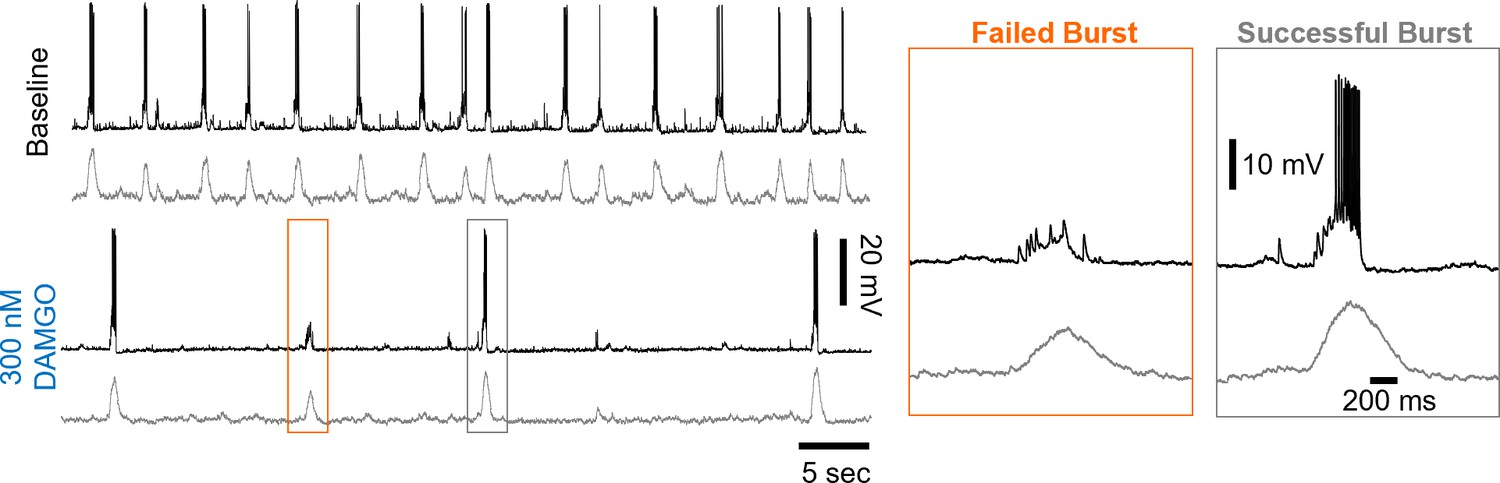
Network-level effects of MOR activation on spiking activity in the preBötC in vitro and in vivo.
(A) Representative ʃpreBötC activity from a horizontal slice during increasing concentrations of DAMGO. Orange asterisks indicate burst failures. (B) Averaged inter-burst intervals at baseline and in DAMGO demonstrating changes in IBI spiking. (C) Quantified ʃIBI spiking (RM one-way ANOVA [p<0.0001] with Bonferroni post hoc tests), burst frequency (RM one-way ANOVA [p<0.0001] with Bonferroni post hoc tests), frequency irregularity (RM mixed-effects analysis [p=0.01] with Dunnett’s post hoc tests), and amplitude irregularity (RM mixed-effects analysis [p=0.16] with Dunnett’s post hoc tests) from n=30 slices. (D) Averaged successful bursts compared to burst failures (top) and example intracellular recording during a failed burst (bottom). (E) Quantified fraction of burst failures during increasing concentrations of DAMGO (RM mixed-effects analysis [p<0.0001] with Bonferroni post hoc tests). (F) Schematic of in vivo experimental preparation with example simultaneous ʃXII and ʃpreBötC recordings. (G) Representative ʃXII and ʃpreBötC activity at baseline and following i.p. morphine. (H) Averaged ʃIBI spiking at baseline and following morphine. (I) Quantified ʃIBI spiking, breathing frequency, inter-burst interval, and inspiratory time (TI) (n=6; ratio paired t-tests). (J) Example changes in preBötC burst morphology in response to morphine administration in vivo. Data presented as means ± SE; significance of post hoc tests: *p<0.05, #p<0.01, †p<0.001, ‡p<0.0001 compared to baseline.
-
Figure 3—source data 1
Network effects of MOR activation.
- https://cdn.elifesciences.org/articles/67523/elife-67523-fig3-data1-v2.xlsx
Figure 3—figure supplement 1
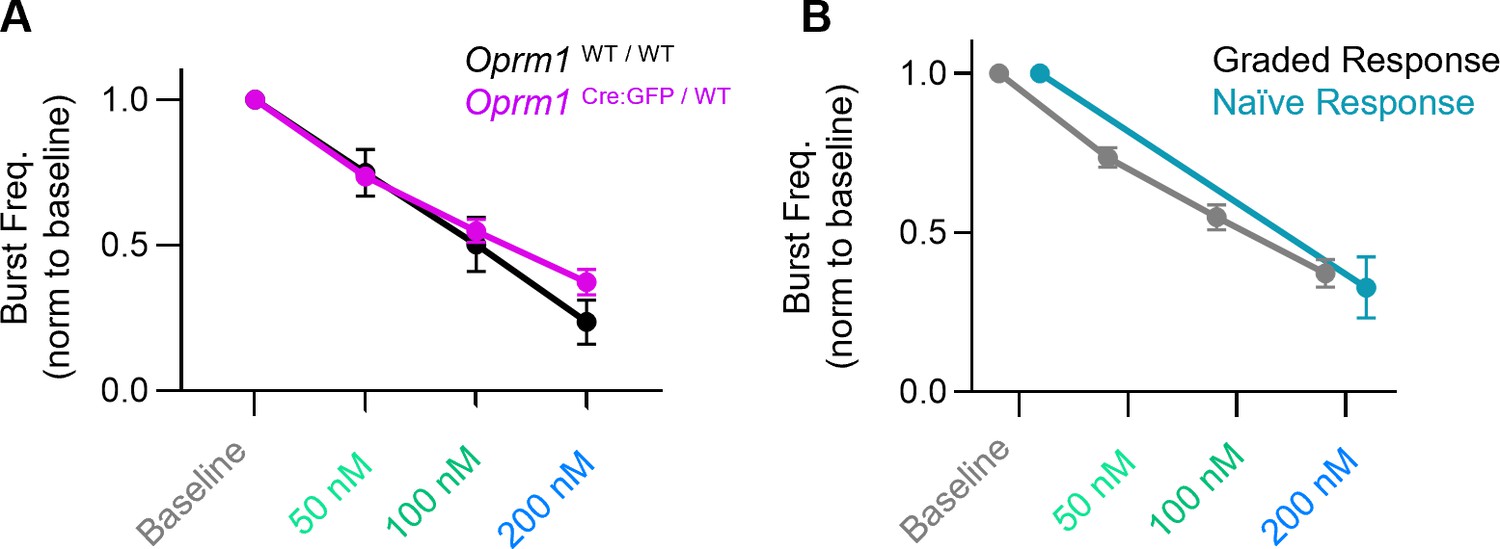
DAMGO dose responses.
(A) DAMGO has similar effects on inspiratory burst frequency generated by wild-type (Oprm1WT / WT) and heterozygous (Oprm1Cre:GFP/WT) horizontal brainstems slices. Two-way RM ANOVA (p=0.47). (B) Naïve horizontal slices never exposed to DAMGO have a similar change in inspiratory burst frequency in 200 nM DAMGO compared to slices previously exposed to increases in (DAMGO) (two-tailed t-test at 200 nM DAMGO, p=0.63). Data shown and means ± SE.
-
Figure 3—figure supplement 1—source data 1
DAMGO dose responses.
- https://cdn.elifesciences.org/articles/67523/elife-67523-fig3-figsupp1-data1-v2.xlsx
Figure 3—figure supplement 2
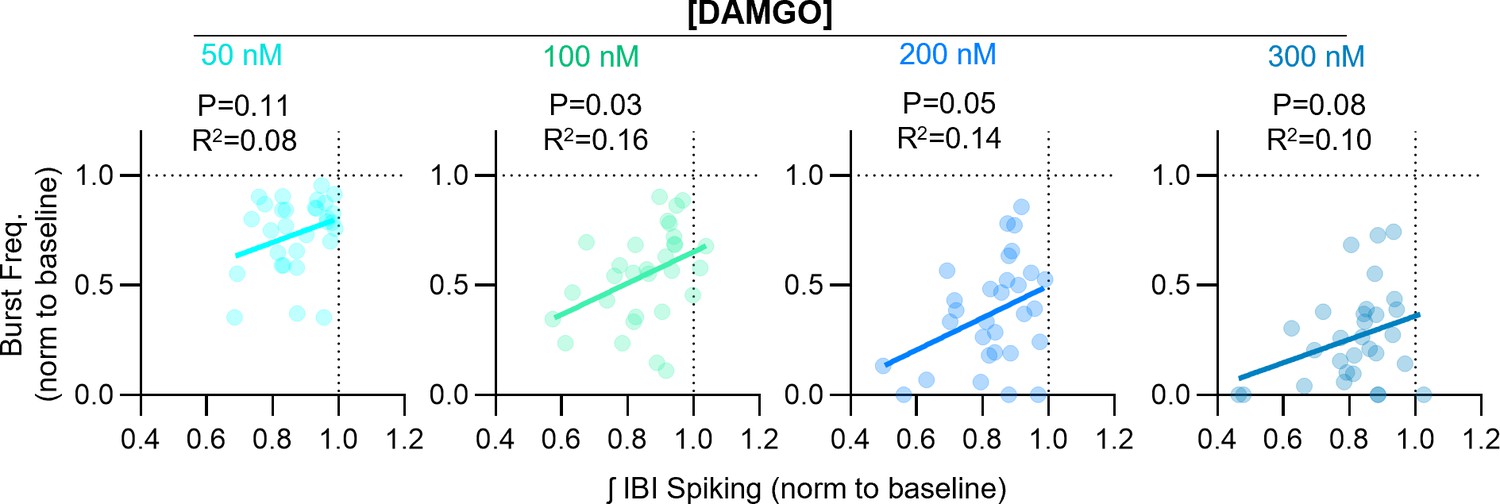
Relationships between DAMGO-induced changes in inspiratory burst frequency and integrated inter-burst interval spiking in horizontal brainstem slice preparations.
Linear regression analysis.
-
Figure 3—figure supplement 2—source data 1
Network effects of MOR activation.
- https://cdn.elifesciences.org/articles/67523/elife-67523-fig3-figsupp2-data1-v2.xlsx
Figure 3—figure supplement 3
Example whole-cell recording from an inspiratory neuron (top) and corresponding rhythmic multi-unit activity from the contralateral preBötC at baseline and in 300 nM DAMGO.
Note that during failed population bursts in 300 nM DAMGO, the inspiratory neuron receives synaptic inputs that are not sufficient to recruit the neuron to spike.
Figure 4 with 1 supplement

Mimicking opioid-induced changes in preBötC spiking does not phenocopy OIRD.
(A) Schematic of experimental design using Oprm1Cre;Rosa26ArchT horizontal brainstem slices. (B) Example ʃpreBötC recordings during bilateral photoinhbition of preBötC Oprm1+ neurons at baseline and following OIRD. Note the continued ability to suppress preBötC spiking activity despite silencing of rhythmogenesis with DAMGO. (C) Quantification of ʃIBI spiking, burst frequency, and the burst frequency/ʃIBI spiking ratio in n=9 slices during baseline photoinhibition of Oprm1+ preBötC neurons (RM one-way ANOVA of ʃIBI spiking [p≤0.0001], RM one-way ANOVA of frequency [p=0.0003], RM one-way ANOVA of frequency/ʃIBI spiking ratio [p=0.410]) during increasing concentrations of DAMGO (RM one-way ANOVA of ʃIBI spiking [p<0.0003], RM one-way ANOVA of frequency [p<0.0001], RM one-way ANOVA of frequency/ʃIBI spiking ratio [p<0.0001]), and during photoinhibition in 300 nM DAMGO (RM one-way ANOVA of ʃIBI spiking [p=0.0001]). (D) Comparison of changes in ʃIBI spiking, burst frequency, and the burst frequency/IBI spiking ratio during 2 mW photoinhibition and 300 nM DAMGO. Data corresponds to gray highlighted regions in (C) (two-tailed paired t-tests). (E) Schematic of anesthetized in vivo experimental preparation and (F) example ʃXII and ʃpreBötC recordings during bilateral photoinhibition of Oprm1+ preBötC neurons. (G) Average ʃIBI spiking activity at baseline (OFF) and during photoinhibition. (H) Example single unit recording (top left) and rasters from each recording site (bottom left), normalized spike frequency (middle) from n=6 preBötC neurons during a 10 s pulse of 598 nm 6 mW light, and average pre-, during-, and post-light spike frequency (right) (RM one-way ANOVA [p=0.003]). (I) Comparison of changes in ʃIBI spiking, burst frequency, and the burst frequency/IBI spiking ratio elicited during 6 mW bilateral photoinhibition and following i.p. morphine (two-tailed paired t-tests). ns=not significant, *p<0.05, #p<0.01, †p<0.001, ‡p<0.0001 compared to baseline.
-
Figure 4—source data 1
Optogenetic hyperpolarization of Oprm1+ neurons.
- https://cdn.elifesciences.org/articles/67523/elife-67523-fig4-data1-v2.xlsx
Figure 4—figure supplement 1
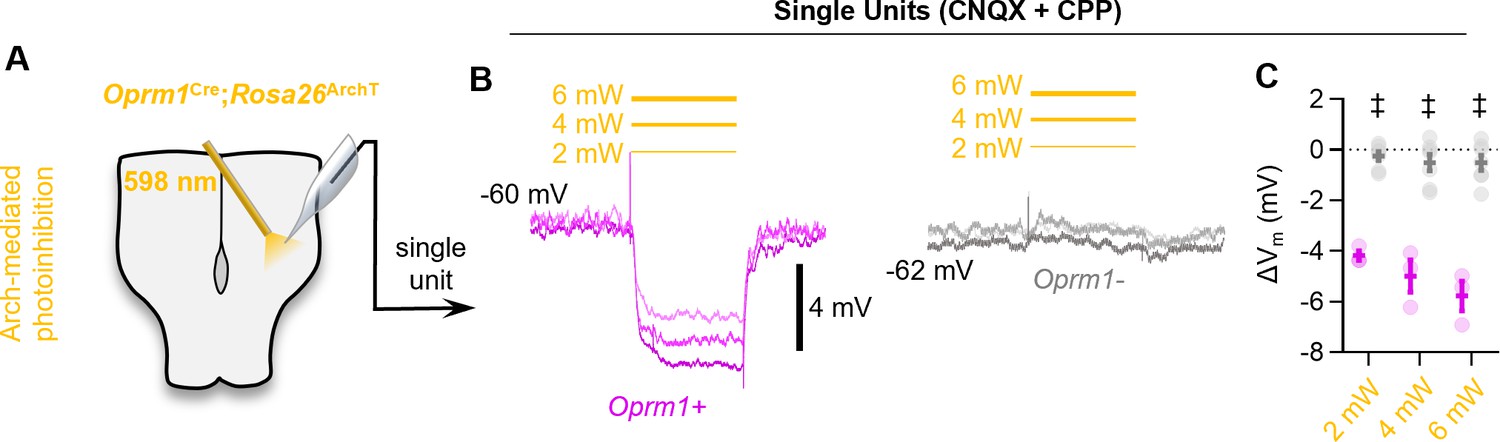
Optogenetic hyperpolarization of Oprm1+ preBötC neurons.
(A) Schematic of experiments in Oprm1Cre; Rosa26ArchT horizontal brainstem slices. (B) Example average membrane potential of an Oprm1+ and an Oprm1− preBötC neuron during 2 mW, 4 mW, and 6 mW 598 nm light pulses (three to five trials/power). (C) Quantified change in membrane potential (ΔVm) from Oprm1+ (n=3) and Oprm1− (n=7) neurons during photoinhibition (two-way RM ANOVA [p<0.0001] with Bonferroni’s multiple comparisons tests). Data shown as mean ± SE. Significance of post hoc tests: *p<0.05, #p<0.01, †p<0.001, ‡p<0.0001.
-
Figure 4—figure supplement 1—source data 1
Optogenetic hyperpolarization of Oprm1+ neurons.
- https://cdn.elifesciences.org/articles/67523/elife-67523-fig4-figsupp1-data1-v2.xlsx
Figure 5

MOR activation impairs synaptic transmission in the preBötC.
(A) Example responses of Oprm1+ and Oprm1− preBötC neurons to direct (ipsilateral) photostimulation. (B) Probability density histogram of spikes before, during, and after and 10 ms light pulse (1 ms bins). (C) Quantified number of spikes evoked per stimulation, latency to spike from light onset, and variability in spike latencies from n=22 Oprm1+ and n=6 Oprm1− neurons (unpaired two-tailed t-tests). (D) Example experiment showing averaged EPSPs evoked during contralateral photostimulation under baseline conditions and in 50 and 300 nM DAMGO (n=6 of 30 neurons exhibited EPSPs during contralateral stimulations). (E) Quantified evoked EPSP amplitudes and latencies from n=6 neurons (left: RM one-way ANOVA [p=0.011]; middle: RM two-way ANOVA [p=0.600]; right: RM one-way ANOVA [p=0.511]). Significance of Bonferroni post hoc tests * p<0.05, #p<0.01, †p<0.001, ‡p<0.0001.
-
Figure 5—source data 1
MOR activation impairs synaptic transmission.
- https://cdn.elifesciences.org/articles/67523/elife-67523-fig5-data1-v2.xlsx
Figure 6 with 3 supplements
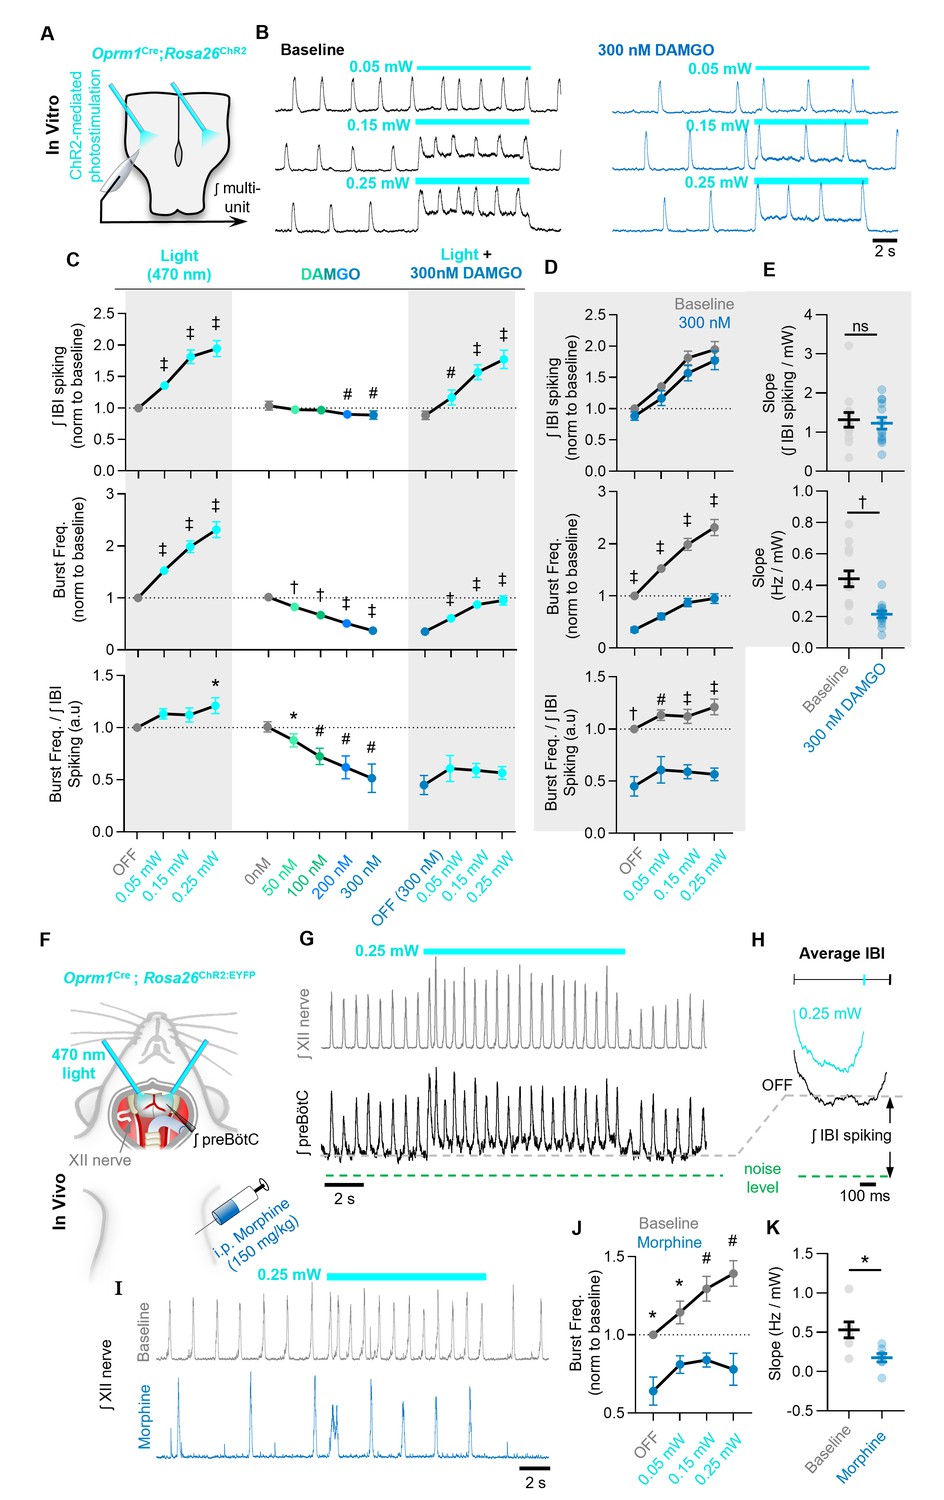
The ability of Oprm1+ neurons to drive preBötC activity is reduced by MOR activation.
(A) Experimental schematic and (B) example preBötC activity at baseline and in 300 nM DAMGO during bilateral photostimulation of Oprm1+ neurons. (C) Quantification of ʃIBI spiking, burst frequency, and the burst frequency/ʃIBI spiking ratio in n=13 slices during baseline photostimulation of Oprm1+ preBötC neurons (RM one-way ANOVA of ʃIBI spiking [p<0.0001], RM one-way ANOVA of frequency [p<0.0001], RM one-way ANOVA of frequency/ʃIBI spiking ratio [p=0.038]) during increasing concentrations of DAMGO (RM one-way ANOVA of ʃIBI spiking [p=0.0009], RM one-way ANOVA of frequency [p<0.0001], RM one-way ANOVA of frequency/ʃIBI spiking ratio [p=0.003]), and during photostimulation in 300 nM DAMGO (RM one-way ANOVA of ʃIBI spiking [p<0.0001], RM one-way ANOVA of frequency [p<0.0001], RM one-way ANOVA of frequency/ʃIBI spiking ratio [p=0.112]). (D) Comparison of light-induced changes in IBI spiking, burst frequency, and the burst frequency/IBI spiking ratio. Data corresponds to gray highlighted regions in (C) (RM two-way ANOVA of ʃIBI spiking [p=0.165], RM two-way ANOVA of frequency [p<0.0001], RM two-way ANOVA of frequency/ʃIBI spiking ratio [p<0.0001]). (E) Quantified slope of IBI spiking and burst frequency responses to increasing power of light stimulations (paired two-tailed t-tests). (F) Schematic of in-vivo preparation and (G) representative ʃXII and ʃpreBötC activity during 10 s bilateral photostimulation of Oprm1+ neurons. (H) Averaged ʃIBI activity at baseline (OFF) and during photostimulation. (I) Example inspiratory rhythm (XII) during bilateral photostimulation at baseline and following i.p. morphine. (J) Quantified changes in inspiratory frequency evoked by photostimulation at baseline and after morphine from n=five anesthetized mice (RM two-way ANOVA [p=0.0003]). (K) Quantified slope of burst frequency responses to increasing power of light stimulations (paired two-tailed t-test). Significance of post hoc tests: ns=not significant, *p<0.05, #p<0.01, †p<0.001, ‡p<0.0001.
-
Figure 6—source data 1
The ability of Oprm1+ neurons to drive inspiration is reduced by MOR activation.
- https://cdn.elifesciences.org/articles/67523/elife-67523-fig6-data1-v2.xlsx
Figure 6—figure supplement 1
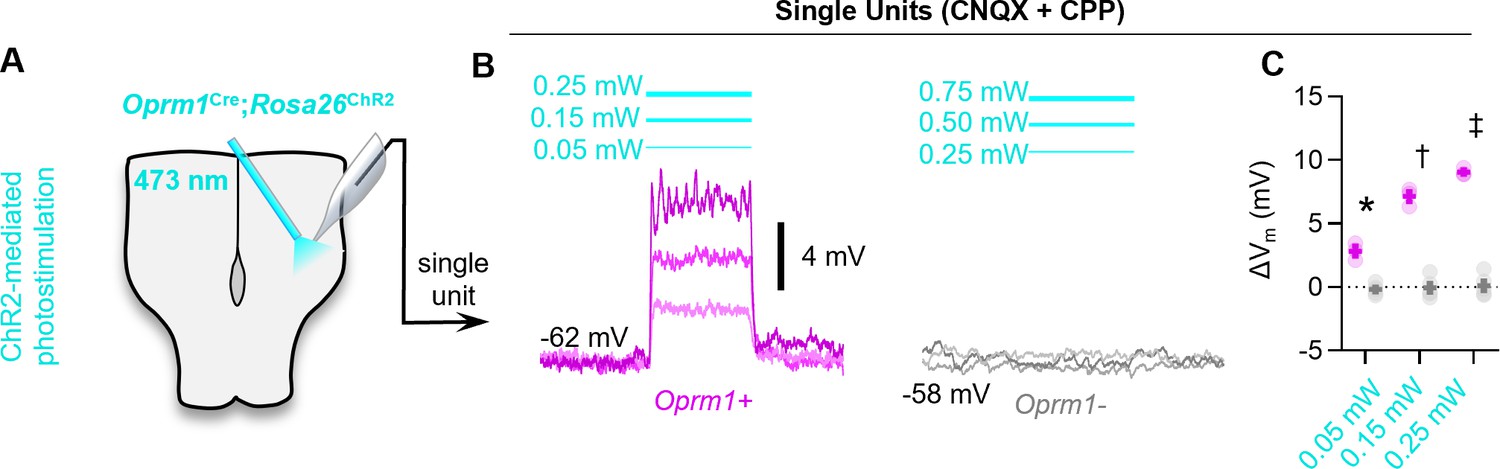
Optogenetic depolarization of Oprm1+ preBötC neurons.
(A) Schematic of Oprm1Cre; Rosa26ChR2 experiments. (B) Averaged membrane potential of example Oprm1+ and Oprm1− preBötC neurons during 0.05, 0.15, and 0.25 mW 473 nm light pulses (three to five trials/power). (C) Quantified ΔVm from Oprm1+ (n=3) and Oprm1− (n=5) neurons during photostimulation (two-way RM ANOVA [p<0.0001] with Bonferroni’s multiple comparisons tests). Data shown as mean ± SE. Significance of post hoc tests: *p<0.05, #p<0.01, †p<0.001, ‡p<0.0001.
-
Figure 6—figure supplement 1—source data 1
Optogenetic depolarization of Oprm1+ neurons.
- https://cdn.elifesciences.org/articles/67523/elife-67523-fig6-figsupp1-data1-v2.xlsx
Figure 6—figure supplement 2
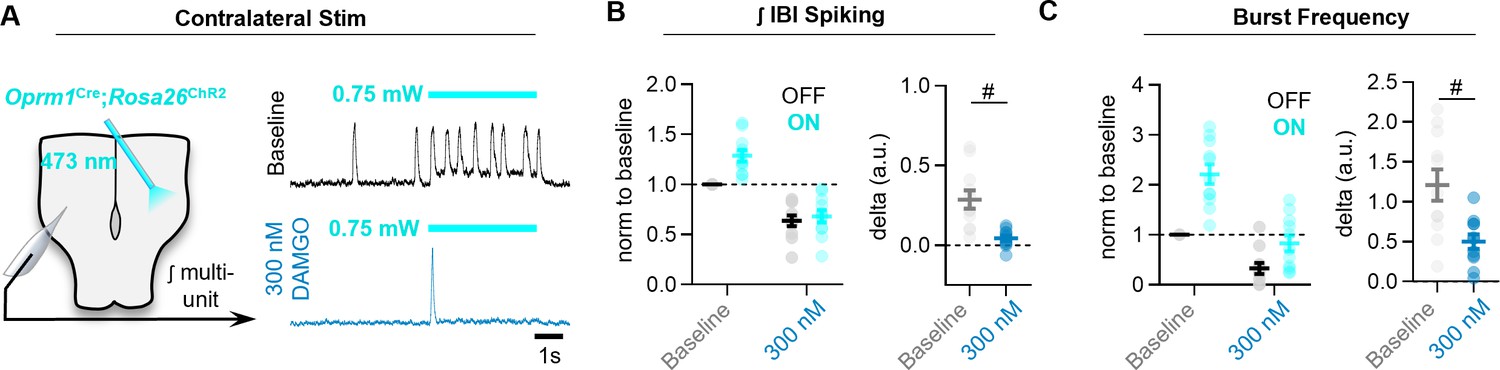
MOR activation limits the ability of commissural Oprm1+ neurons to drive activity in the contralateral preBötC.
(A) Experimental schematic and representative preBötC recordings at baseline and in 300 nM DAMGO during a 10 s photostimulaiton of contralateral Oprm1+ neurons. (B) Quantified effects on ʃIBI spiking, and (C) inspiratory burst frequency (two-tailed paired t-tests). Data shown as mean± SE. *p<0.05, #p<0.01, †p<0.001, ‡p<0.0001.
-
Figure 6—figure supplement 2—source data 1
Optogenetic depolarization of Oprm1+ neurons.
- https://cdn.elifesciences.org/articles/67523/elife-67523-fig6-figsupp2-data1-v2.xlsx
Figure 6—figure supplement 3
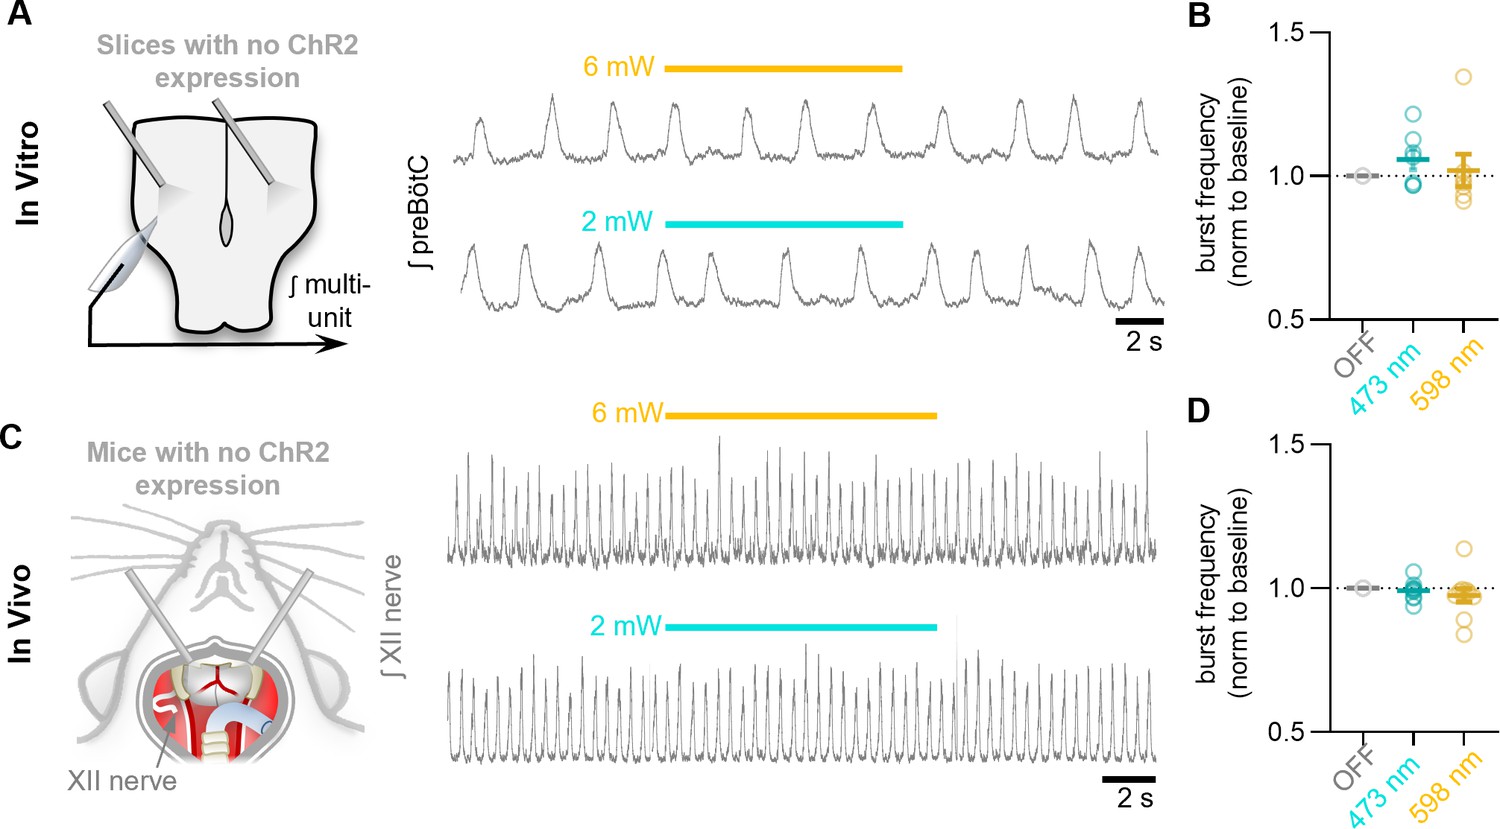
Control photostimulations in horizontal slices without ChR2 expression.
(A) Example control stimulation in vitro and (B) quantification of burst frequency (n=7 trials from two slices; one-way RM ANOVA [p=0.54]). (C) Example control photostimulations in anesthetized adult mice in vivo lacking ChR2 expression and (D) quantification of inspiratory frequency (n=10 trials from two mice; one-way RM ANOVA [p=0.62]). Data shown as mean ± SE.
-
Figure 6—figure supplement 3—source data 1
Optogenetic controls.
- https://cdn.elifesciences.org/articles/67523/elife-67523-fig6-figsupp3-data1-v2.xlsx
Figure 7 with 2 supplements
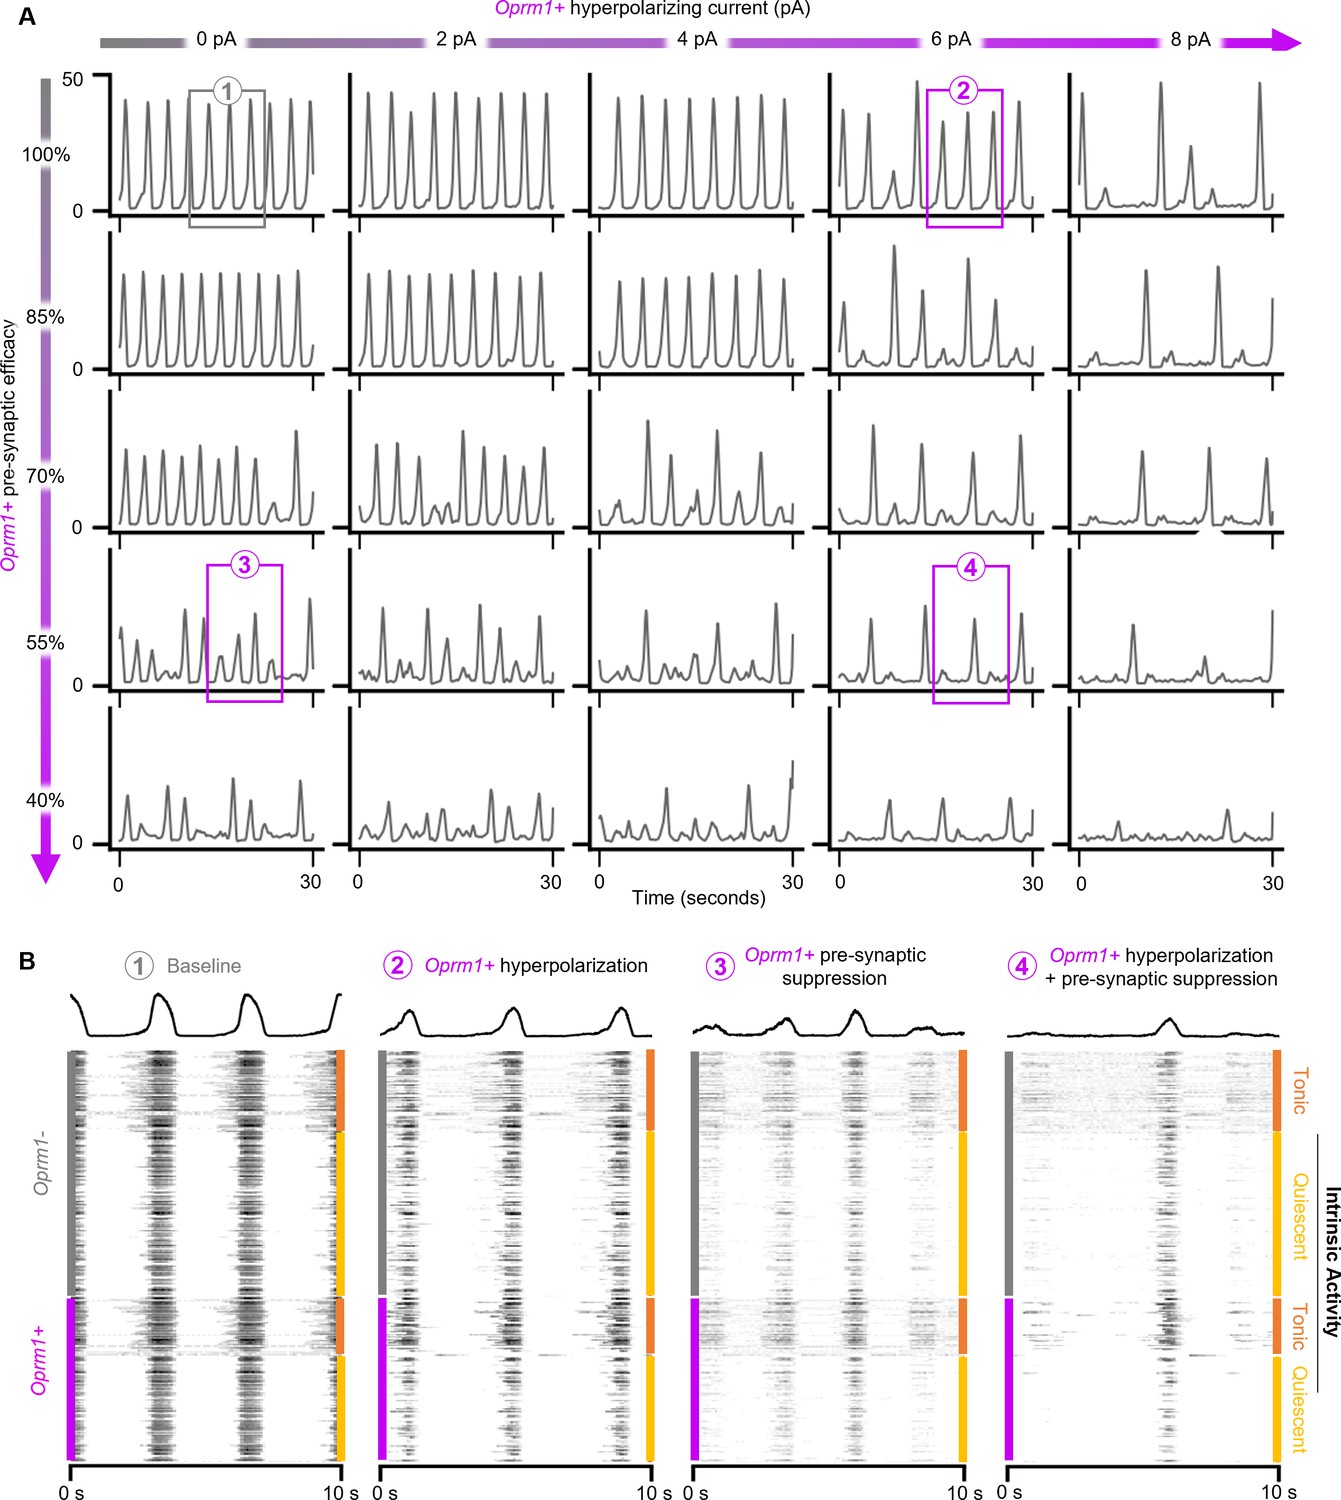
Modeling preBötC MOR activation in silico.
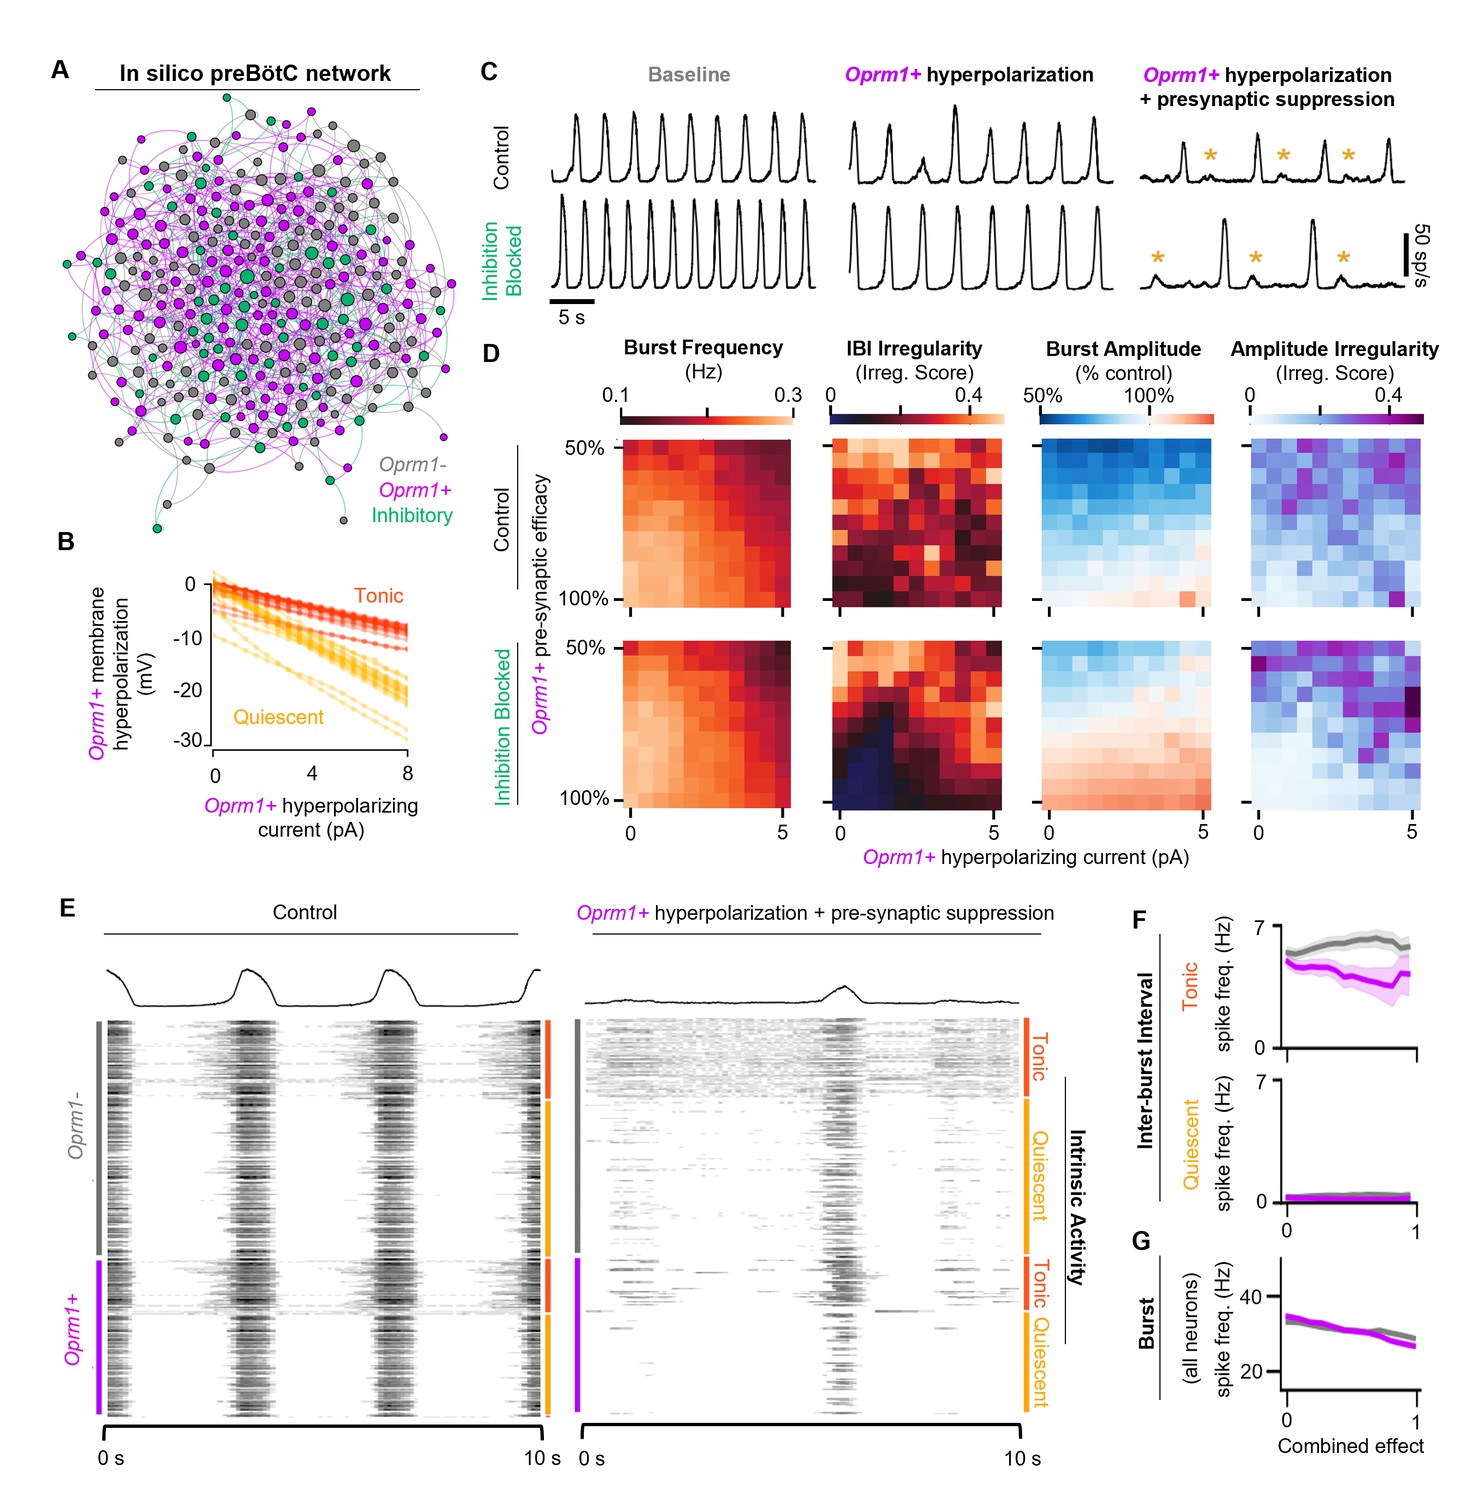
(A) Example model network structure. Model networks were connected randomly and contained excitatory (80%) and inhibitory neurons (20%) that were intrinsically tonic (35%) or quiescent (65%). Half of all excitatory neurons were designated as Oprm1+. Node size and centrality represent the number of synaptic connections. (B) Current/voltage plots for intrinsically tonic (n=17) and quiescent (n=31) Oprm1+ model neurons for the applied opioid-driven hyperpolarization. (C) Example rhythmic activity from the network shown in (A) at baseline, during 6 pA hyperpolarization of Oprm1+ neurons, and during 6 pA hyperpolarization and a 45% reduction in pre-synaptic efficacy of Oprm1+ neurons. Orange asterisks indicate burst failures. (D) Heat maps showing the isolated and combined effects of Oprm1+ neuron hyperpolarization and pre-synaptic suppression on characteristics of the network rhythm. (E) Example spiking activity of all 300 neurons in the model network at baseline and during simulated MOR activation (6 pA hyperpolarization and 45% pre-synaptic suppression of Oprm1+ neurons). (F) Quantified inter-burst interval (IBI) spike frequencies of intrinsically tonic and quiescent Oprm1+ and Oprm1− neurons during simulated MOR activation. (G) Spike frequency during network bursts for all Oprm1+ and Oprm1- model neurons during simulated MOR activation (combined effect of 1 designates 6 pA hyperpolarization and 55% pre-synaptic efficacy of Oprm1+ neurons). Data shown as mean± SE.
Figure 7—figure supplement 1
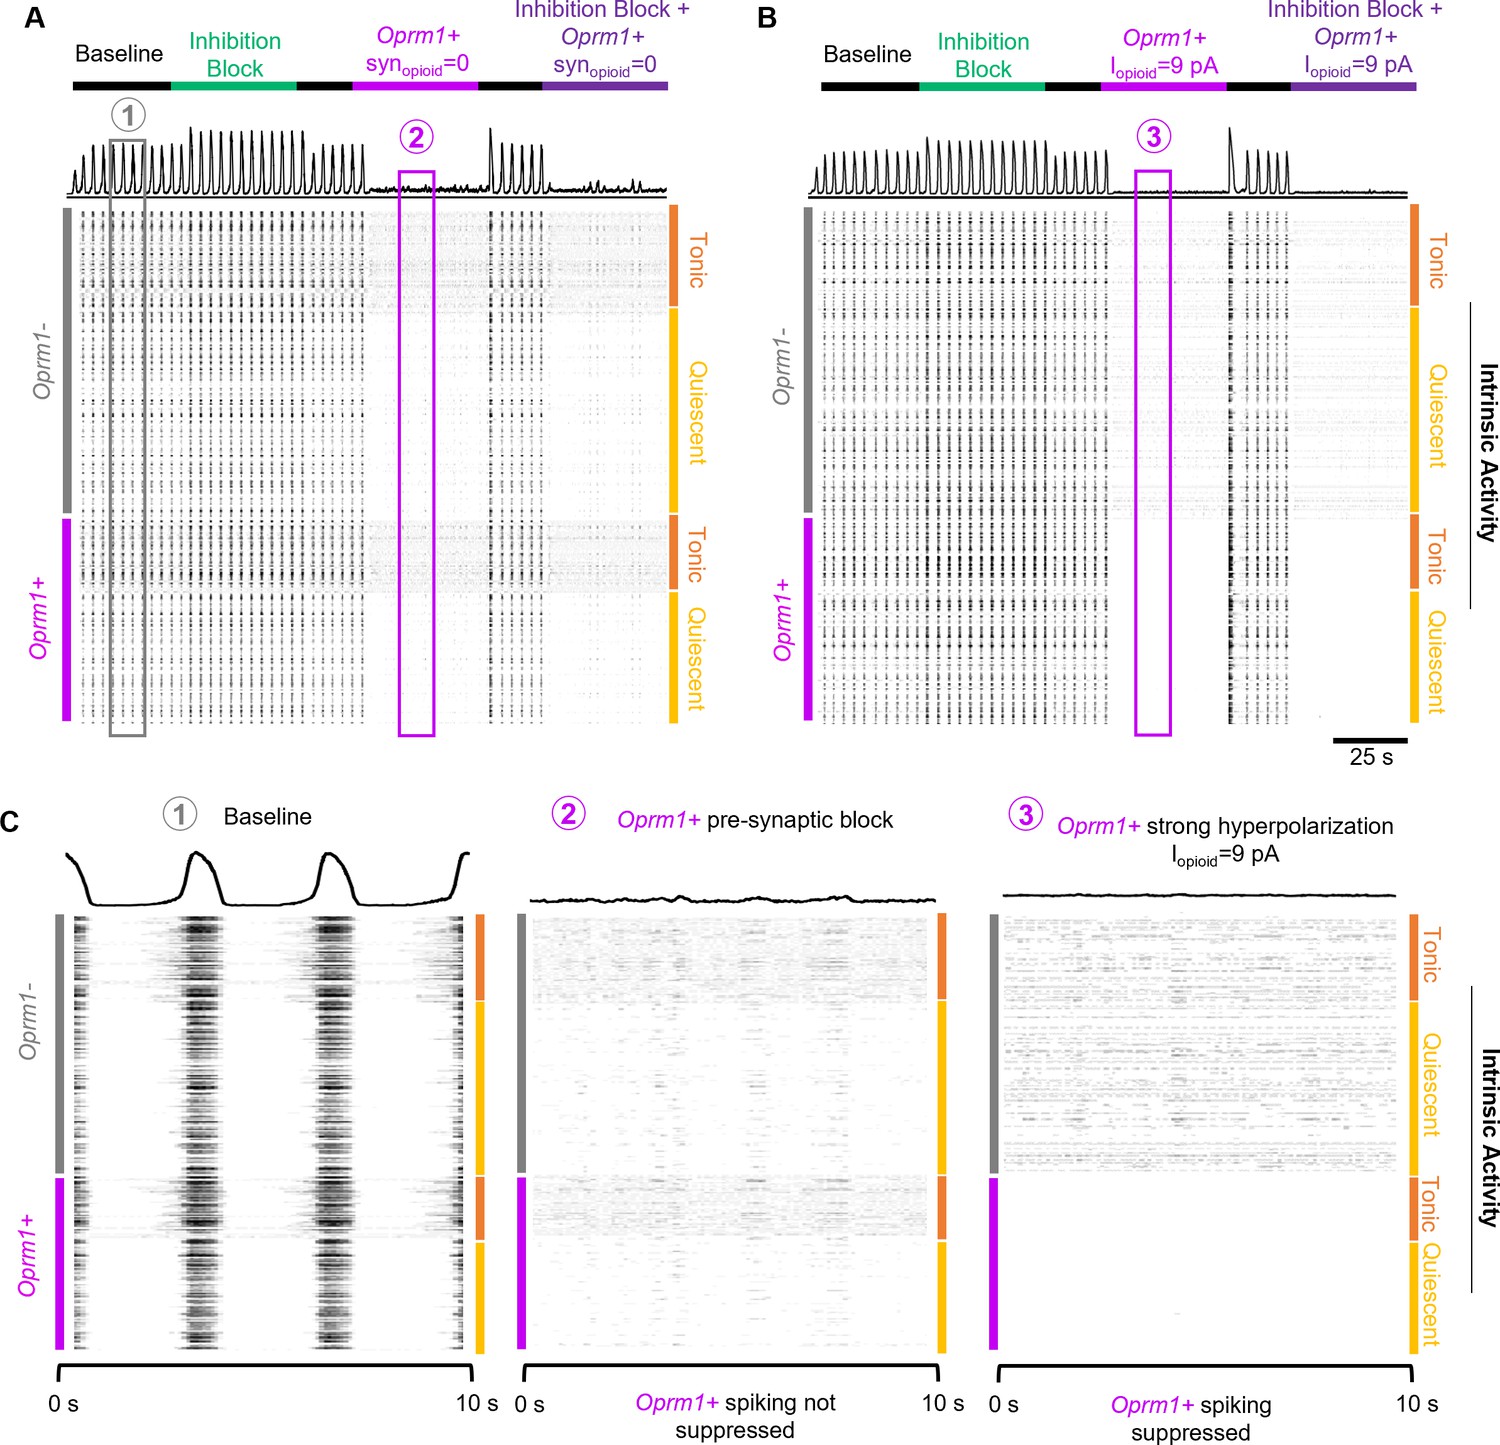
A simulated data-driven Oprm1+ subpopulation is necessary for rhythmogenesis in an in silico preBötC model network.
(A) Example integrated population activity and spike rasters at baseline and during blockade of pre-synaptic transmission from Oprm1+ neurons (=0) with and without inhibitory synaptic interactions (inhibition block). (B) Example integrated population activity and spike rasters at baseline and during a strong hyperpolarization (=9pA) of Oprm1+ neurons with and without concurrent blockade of inhibitory synapses. (C) Expanded view of integrated rhythmic activity and corresponding spike rasters of all 300 model neurons during baseline (left), Oprm1+ pre-synaptic block (middle), and strong Oprm1+ hyperpolarization (right). Note that in both cases the network rhythm is silenced despite distinct effects on the spiking activity of Oprm1+ neurons.
Figure 7—figure supplement 2
OIRD in the preBötC is best modeled by concurrent hyperpolarization and pre-synaptic suppression of a simulated Oprm1+ subpopulation.
(A) Rhythmic activity of a representative model network during independent or concurrent Oprm1+ neuron hyperpolarization and/or pre-synaptic suppression. (B) Expanded view of network activities shown in (A) and corresponding spiking activity from all 300 model neurons.
Figure 8
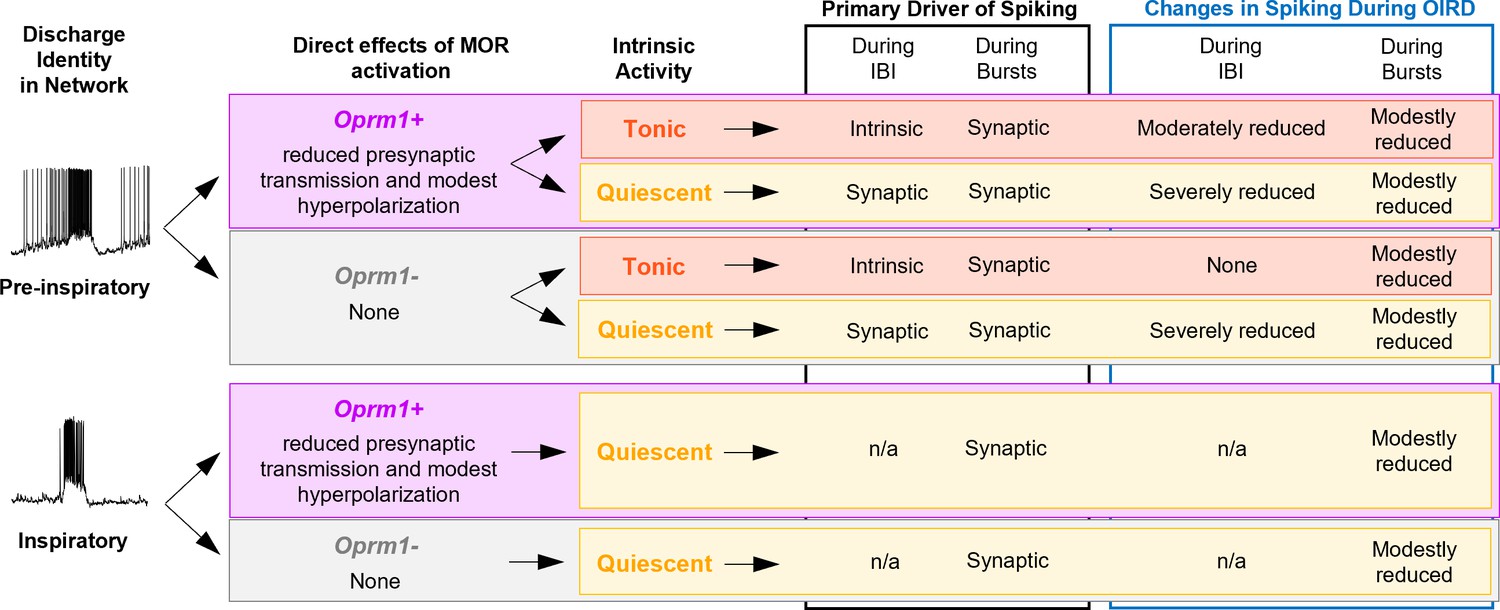
Summary of the effects of MOR activation on different types of pre-inspiratory and inspiratory preBötC neurons.
Additional files
-
Supplementary file 1
Network parameters for in silico preBötC network.
- https://cdn.elifesciences.org/articles/67523/elife-67523-supp1-v2.docx
-
Supplementary file 2
Cellular parameters for in silico preBötC neurons.
- https://cdn.elifesciences.org/articles/67523/elife-67523-supp2-v2.docx
-
Transparent reporting form
- https://cdn.elifesciences.org/articles/67523/elife-67523-transrepform-v2.pdf
Download links
A two-part list of links to download the article, or parts of the article, in various formats.
Downloads (link to download the article as PDF)
Open citations (links to open the citations from this article in various online reference manager services)
Cite this article (links to download the citations from this article in formats compatible with various reference manager tools)
Dual mechanisms of opioid-induced respiratory depression in the inspiratory rhythm-generating network
eLife 10:e67523.
https://doi.org/10.7554/eLife.67523


