Broad geographic sampling reveals the shared basis and environmental correlates of seasonal adaptation in Drosophila
- Department of Biology, Stanford University, United States
- Wellcome Sanger Institute, United Kingdom
- Department of Biology, University of Virginia, United States
- Department of Biology, University of Pennsylvania, United States
- Department of Genetics, University of Georgia, United States
- Institute of Population Genetics, Vetmeduni Vienna, Austria
- Centre for Pathogen Evolution, Department of Zoology, University of Cambridge, United Kingdom
- Department of Biology, University of Fribourg, Switzerland
- Institute of Evolutionary Biology, CSIC- Universitat Pompeu Fabra, Spain
- Department of Biology, University of Utah, United States
- Taras Shevchenko National University of Kyiv, Ukraine
- National Antarctic Scientific Centre of Ukraine, Taras Shevchenko Blvd., Ukraine
- Department of Entomology, Cornell University, United States
- Department of Chemistry & Biochemistry, Laurentian University, Canada
- Laboratory of Genetics, University of Wisconsin-Madison, United States
- Department of Ecology and Evolutionary Biology, University of Kansas, United States
- Department of Biology, The Pennsylvania State University, United States
Figures
Figure 1 with 2 supplements

Sampling times, localities, and basic population structure of samples used in this study.
(A) Distribution of collection times during the spring (red) and fall (blue) in relation to latitude. For samples where the collection month, but not day, was recorded, we specified the 15th of the month to calculate Julian Day. (B) Sampling localities for the primary seasonal analysis (‘Core20’: green) and the latitudinal cline analysis (‘Clinal’: red), distributed across North America and Europe. Numbers represent the number of years of spring/fall comparisons at that locality. The dotted circle shows the one locality (PA_li) with both Core20 and Clinal samples. (C) Principal component analysis of SNP allele frequencies. Circles are placed around samples from three geographic regions: Europe (EU), California (CA), and Eastern North America (East NA); points are colored by latitude and shapes represent seasons, as defined by collection time.
Figure 1—figure supplement 1
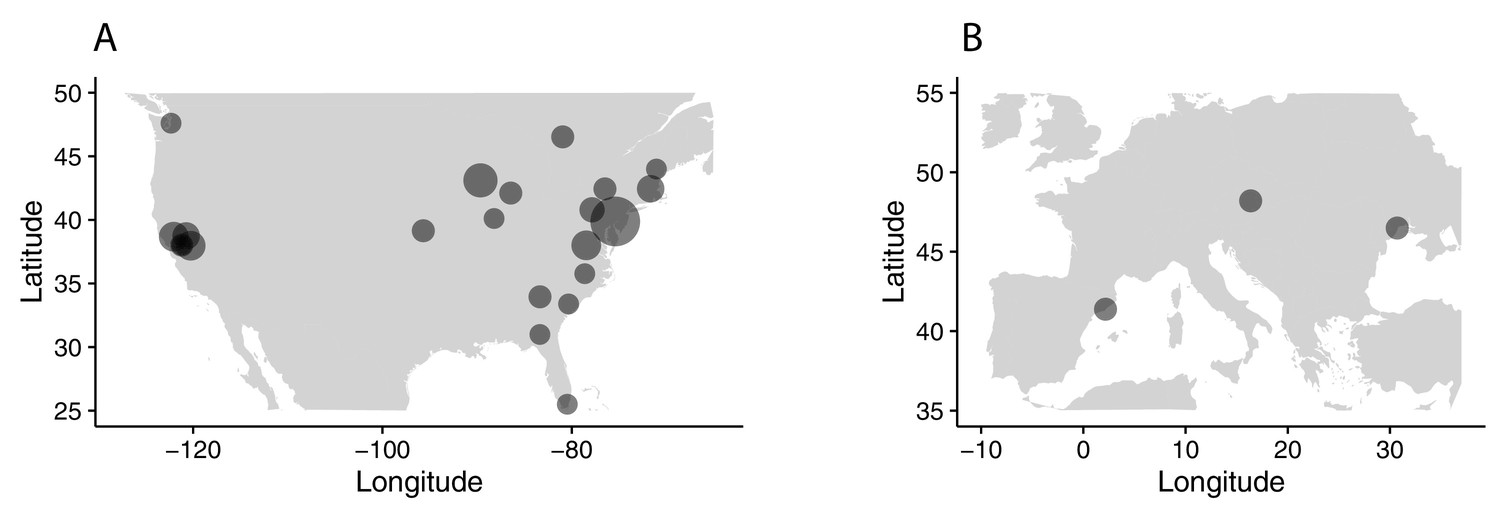
All sampling localities collected.
Sampling localities in (A) North America and (B) Europe for all samples collected, regardless of use in the present analysis. Sizes of circles reflect number of samples per locality.
Figure 1—figure supplement 2
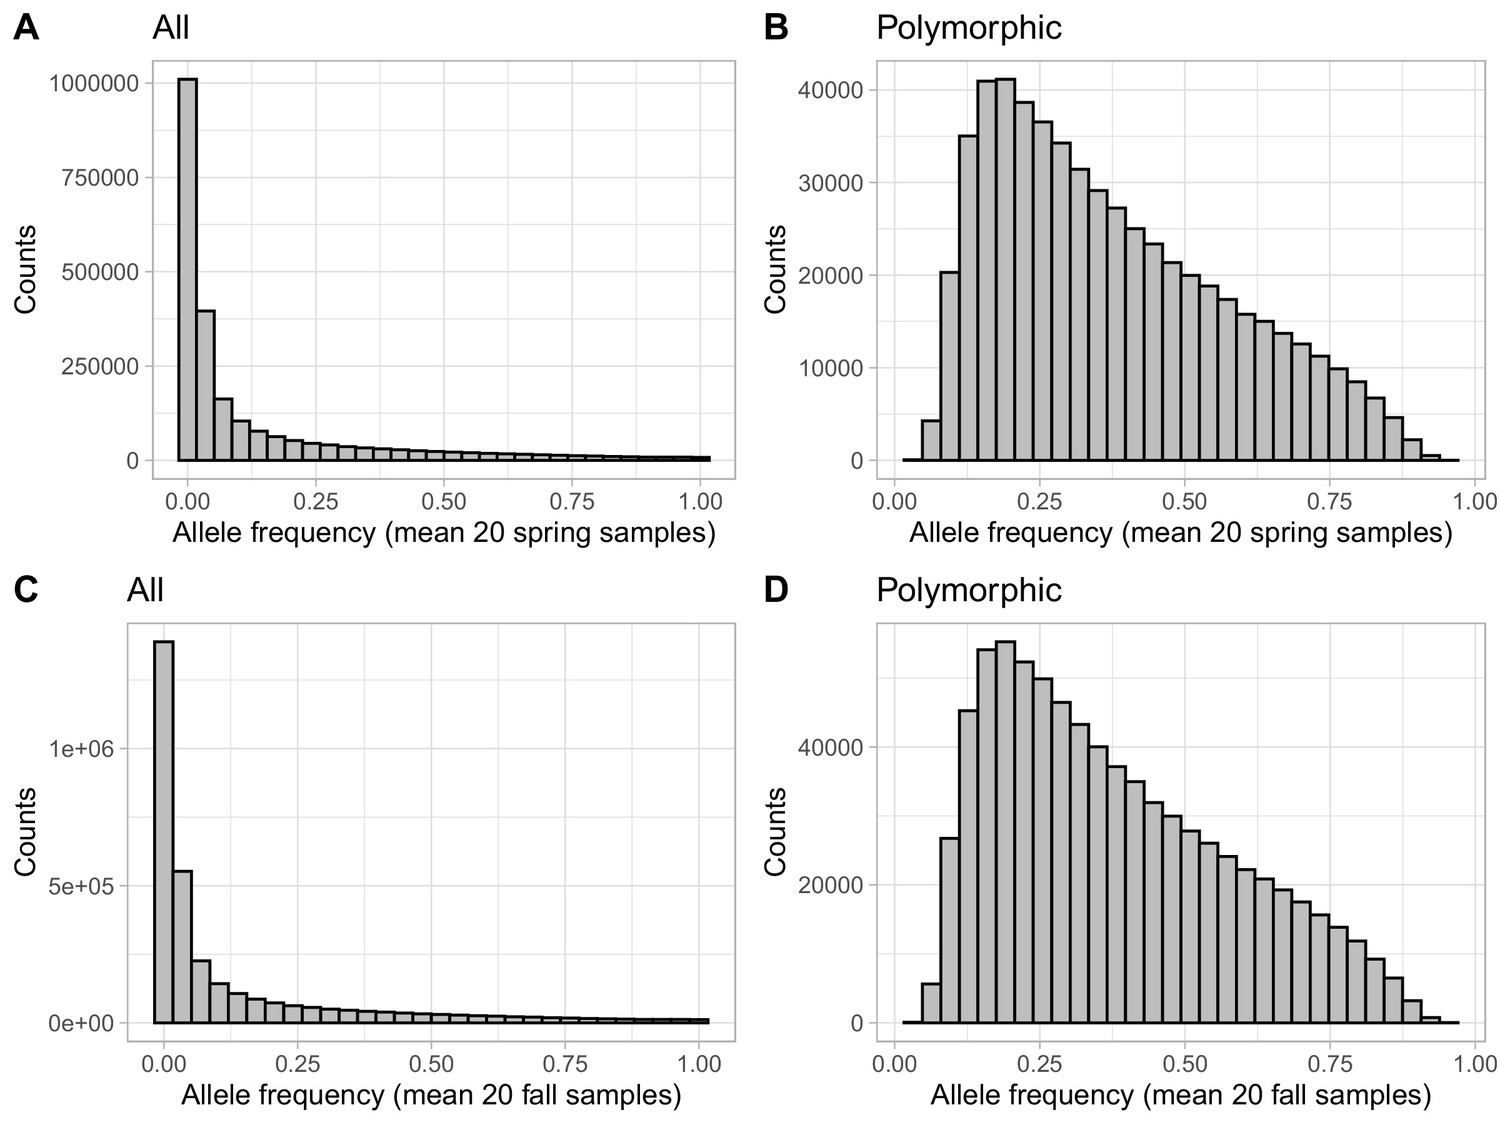
Effect of filtering monomorphic variants on allele frequency distributions.
Distributions of the mean spring (A, B) and mean fall (C, D) allele frequencies for the dataset before (A, C) and after (B, D) filtering SNP found to be monomorphic in any population.
Figure 2 with 4 supplements
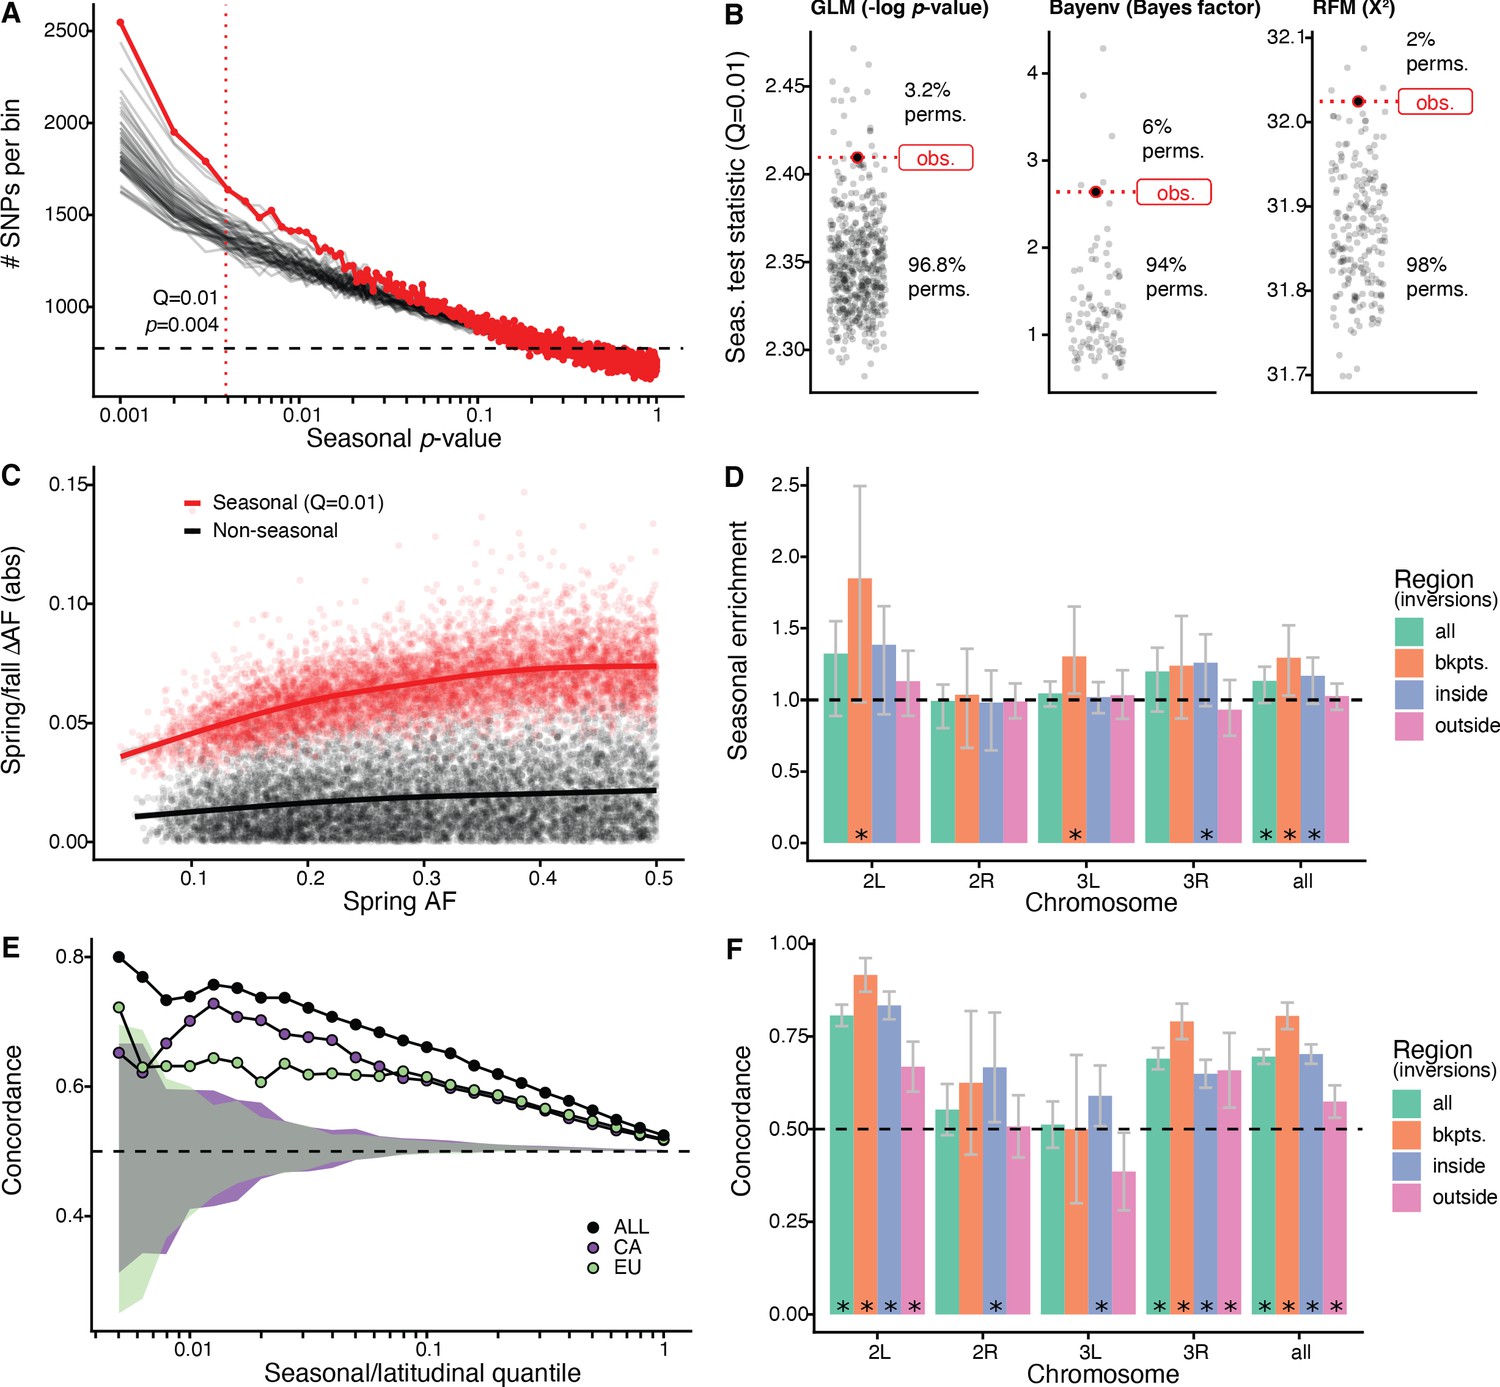
Signals of seasonal adaptation.
(A) p-value distribution of GLM seasonal regression (red line), permutations (solid black lines, 50/500 plotted), and expected values (dashed black line). (B) Comparison of seasonal test statistics (quantile = 0.01) for observed (red) and permuted (black) datasets, for the three analyses: i: GLM (−log p-value), ii: Bayenv (Bayes factor; outlier of a Bayes factor of 10 excluded from plotting), iii: RFM (X2). (C) Average spring/fall allele frequency change for each of the top 1% of seasonally varying SNPs (red) and non-seasonal, matched control SNPs (black), as a function of the folded spring allele frequency. Lines represent a moving average across SNPs with a given spring allele frequency. (D) Enrichment of seasonal SNPs (median of 500 permutations). Enrichment is calculated as the observed number of seasonal SNPs over the number of seasonal SNPs in each permutation at p<0.004. The genome is subset by chromosome and location relative to major cosmopolitan inversions (bkpts.: inversion breakpoints ± 1 Mb, inside: interior to the breakpoints excluding 1 Mb buffer, outside: exterior to the breakpoints excluding the 1 Mb buffers). Error bars are 95% confidence intervals and asterisks denote greater seasonal enrichment than more than 95% of permutations. (E, F) Concordance rates of seasonal and clinal polymorphisms by (E) geographic region and (F) genomic region. The y-axis represents the concordance rate of allele frequency change across time and space, assuming that the winter favored allele is the same as the allele favored in high latitudes. Clinal polymorphisms were identified along the East Coast of North America. Seasonal sites were identified using all populations not used in the clinal analysis (n = 18). (E) Seasonal sites were also identified using exclusively the California populations (purple: n = 3) or the Europe populations (green: n = 3). Shaded areas are the 95% confidence intervals of 100 matched control datasets for the Californian (purple) and European (green) analyses. (F) Concordance by genomic region. Error bars are 95% confidence intervals (binomial error) and asterisks denote concordance significantly greater than 0.5 (binomial test p<0.05).
Figure 2—figure supplement 1
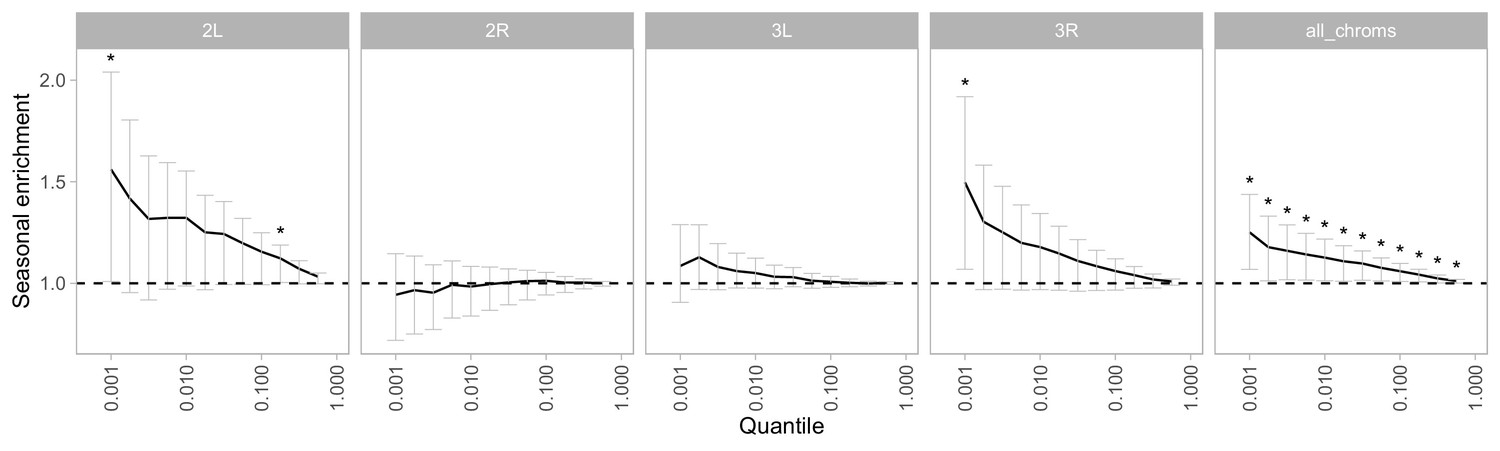
Enrichment of seasonal SNPs by chromosome and significance threshold.
Enrichment is calculated as the observed number of seasonal SNPs over the number of seasonal SNPs in each permutation (median of 500 permutations). Error bars are 95% confidence intervals, and asterisks denote greater seasonal enrichment than more than 95% of permutations.
Figure 2—figure supplement 2
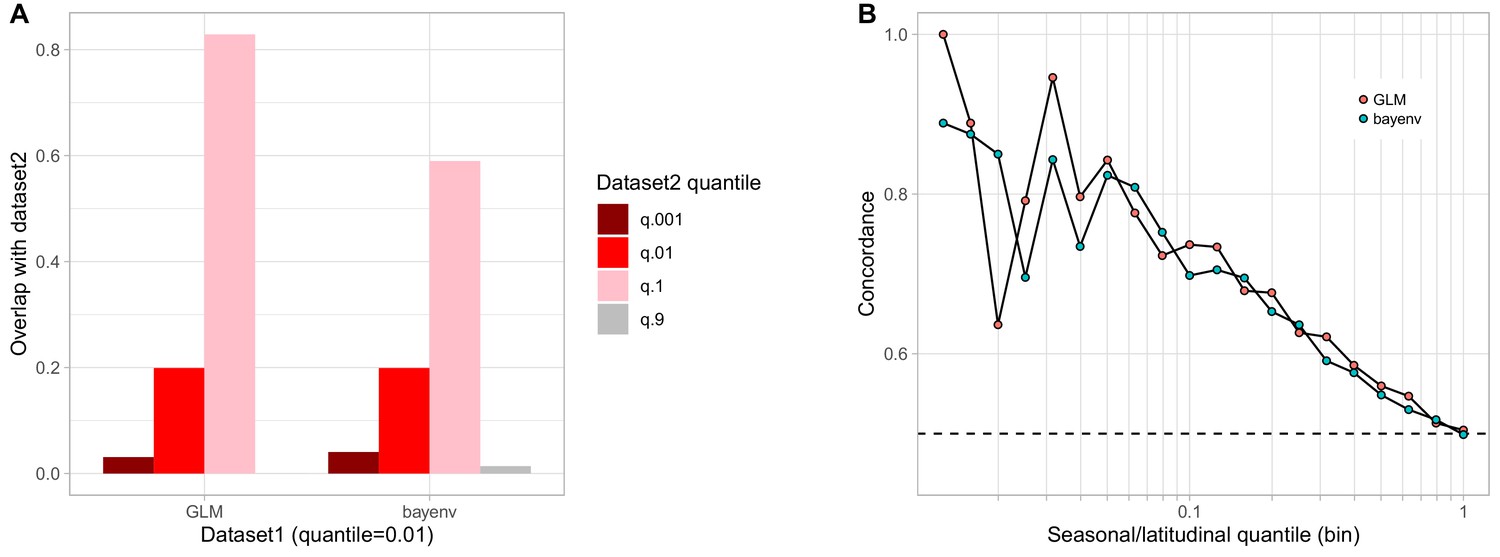
Comparison of bayenv and GLM seasonal analyses.
(A) Proportion of SNPs found highly seasonal in both the GLM and the bayenv seasonal analyses. (B) Seasonal and latitudinal concordance for both the GLM and the bayenv analyses.
Figure 2—figure supplement 3
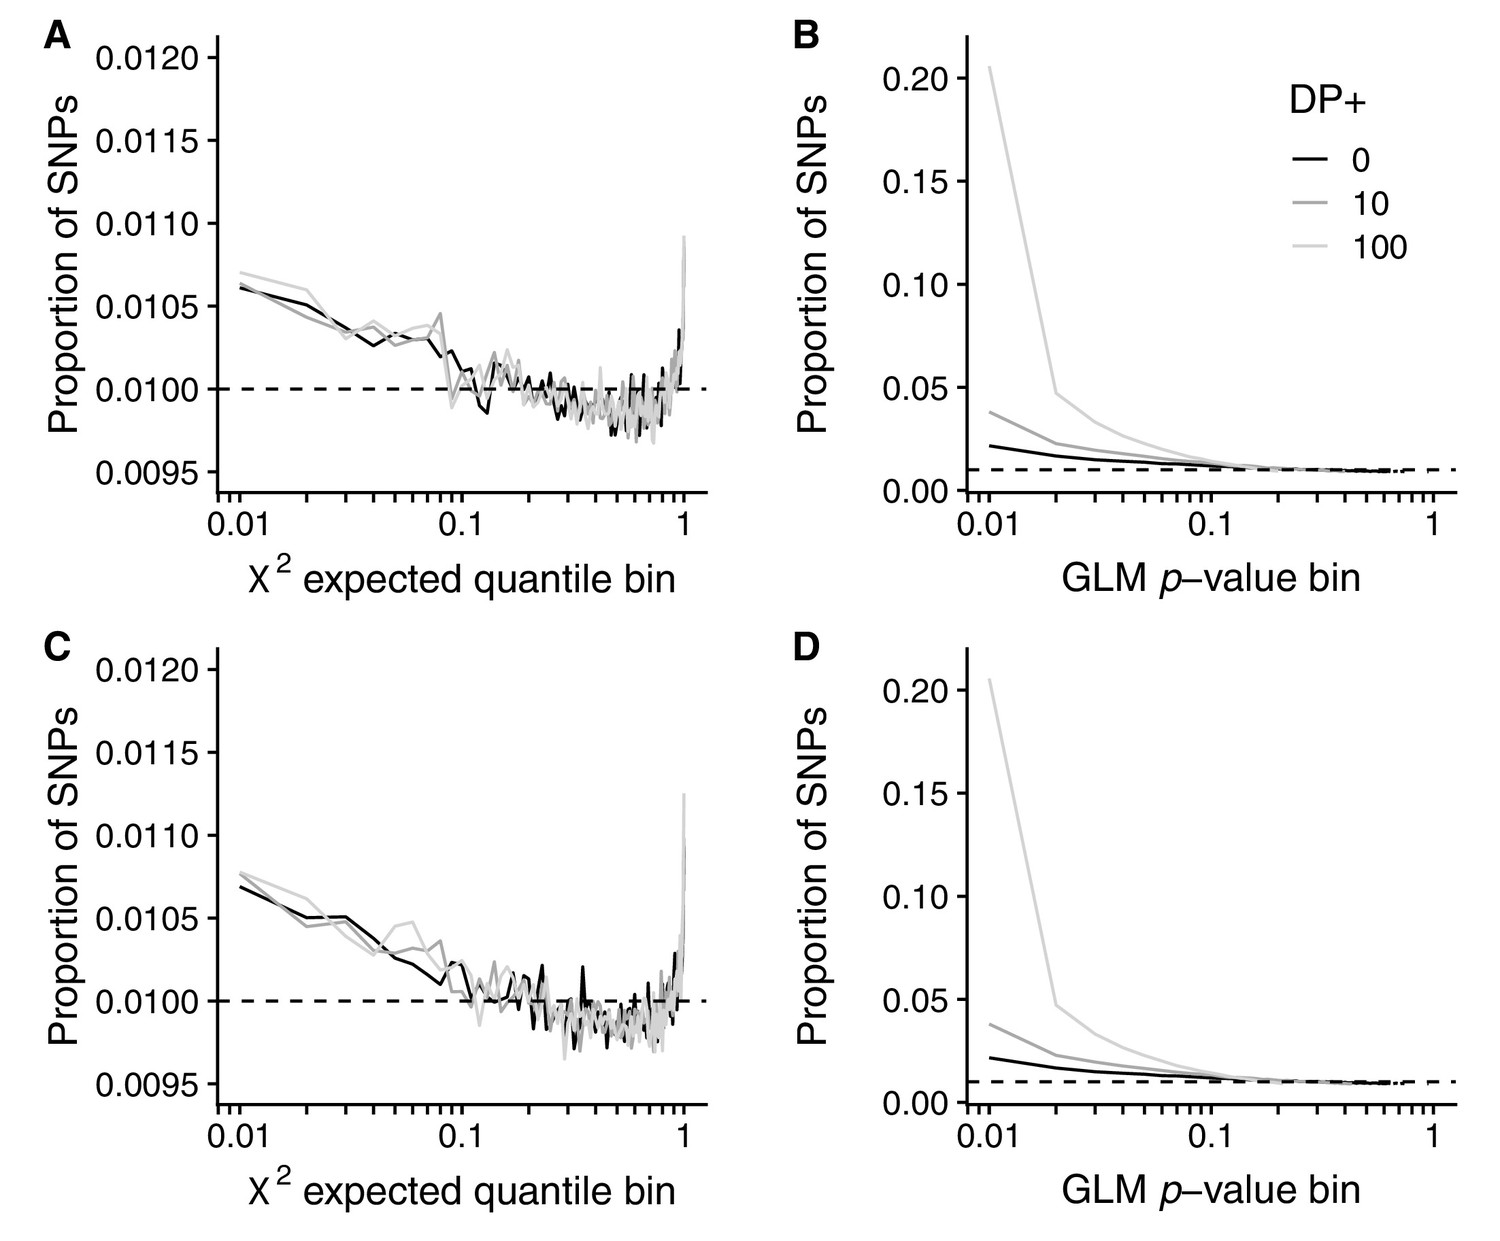
Artificial sample size increases for GLM and RFM methods.
The effect of artificial increases of sample size on the Core20 seasonal analysis using (A, C) the RFM and (B, D) the GLM analyses. Top row: sample size inflated by a fixed amount. Bottom row: sample size inflated by a Poisson sampled amount. Shown is the proportion of SNPs in each bin (solid lines) compared with the null expectation (dashed line). Black: original dataset. Dark gray: 10 reads added to each sample (same allele frequencies). Light gray: 100 reads added to each sample (same allele frequencies).
Figure 2—figure supplement 4
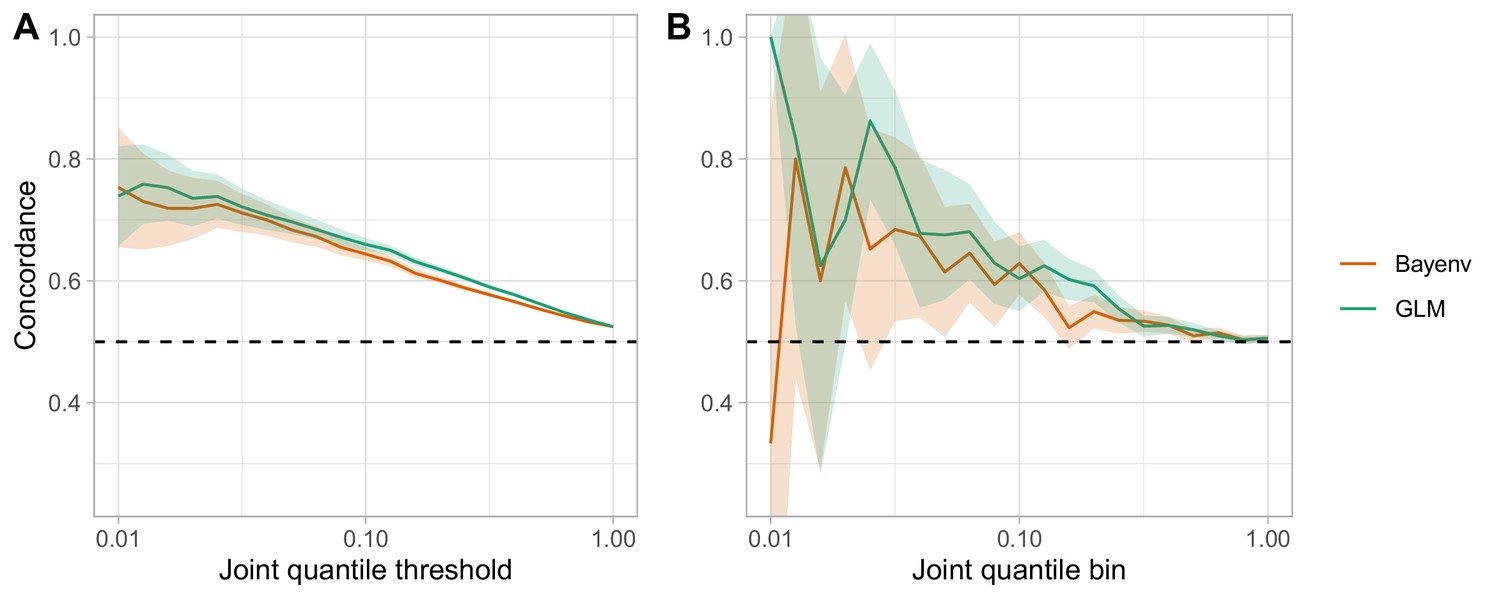
Comparison of the GLM and the Bayenv model for assessing clinal and seasonal concordance.
(A) The ‘joint quantile threshold’ is the quantile threshold for both the seasonal and the clinal analysis, and includes all SNPs at that quantile or less. (B) The ‘joint quantile bin’ includes only those SNPs at that specific quantile.
Figure 3
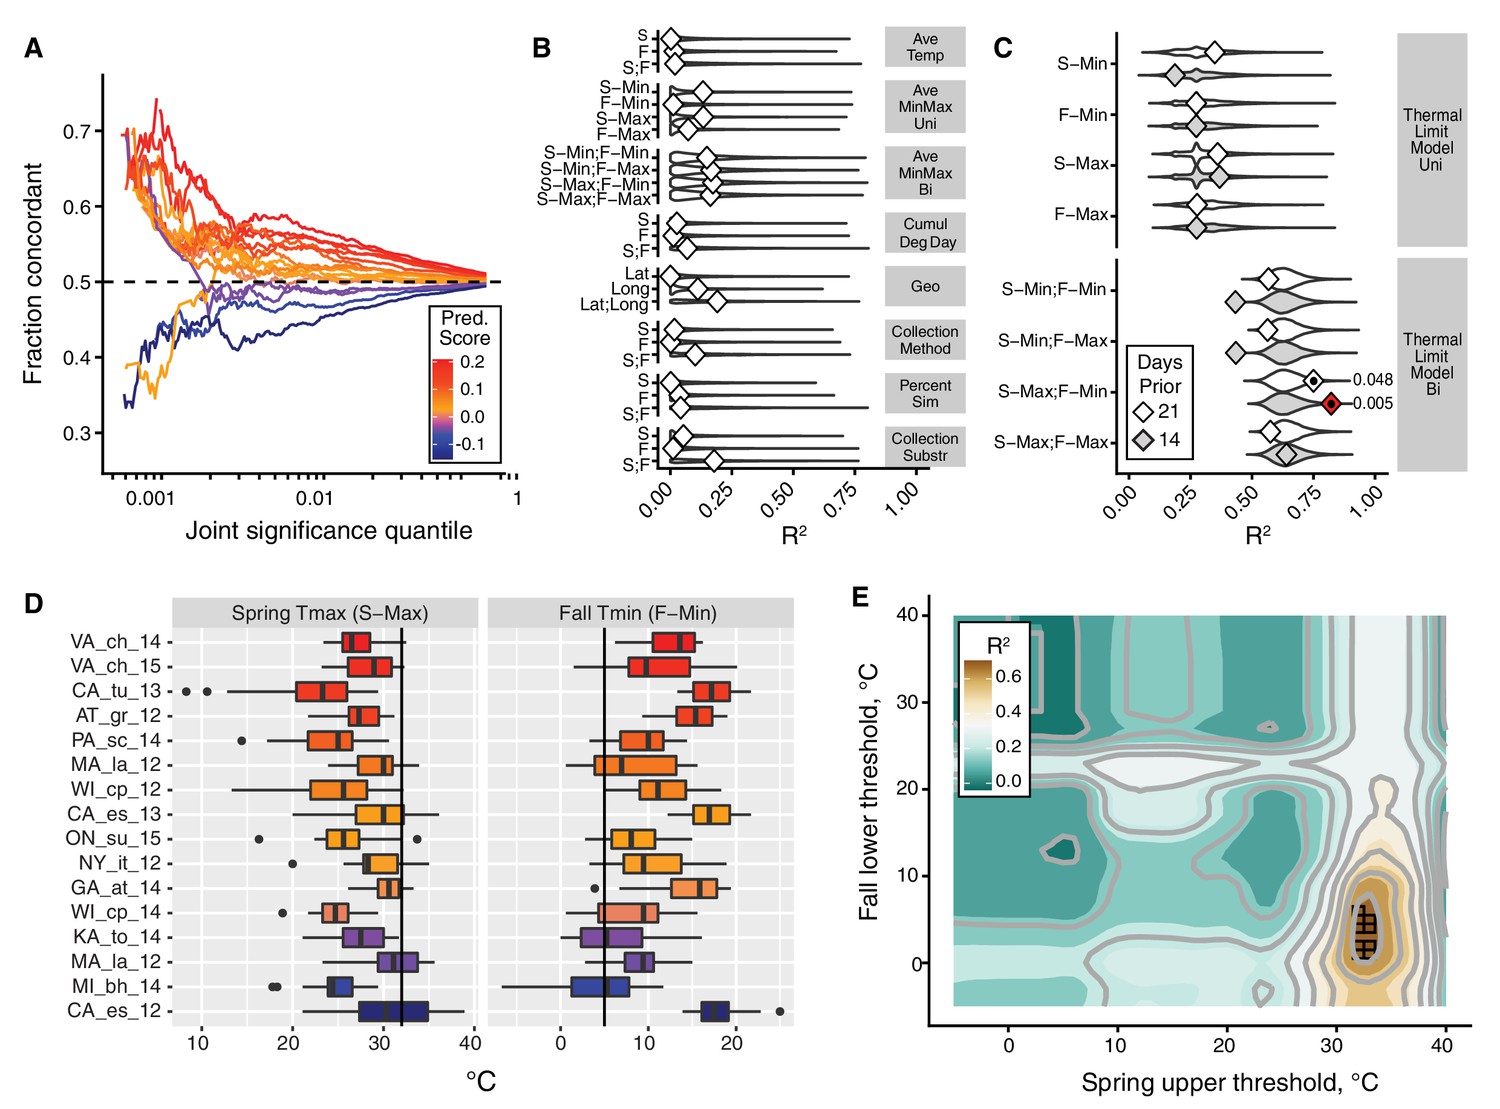
The thermal limit model.
The thermal limit model argues that weather in the weeks prior to sampling can explain variation in the predictability of allele frequency change. (A) Each line represents the comparison between one population and the remaining 19. The x-axis represents the upper threshold of quantile-ranked p-values from the single-population test (Fisher’s exact test) and the 19-population test (GLM), e.g., the top 1% in both tests. The y-axis is the fraction of SNPs where the sign of allele frequency change in the single population test matches the average sign change among the remaining 19. The color scheme represents the slope of this line and is used as a summary statistic for each population. (B, C). We regressed the summary score from (A) onto a number of characterizations of average temperature (B, first four rows), geography (B, fifth row), technical (B, sixth to 8th rows), and thermal extremes (C), considering weather 14. Diamonds represent the observed R2 for (B) and observed maximum R2 across all thermal limits for (C). Violin plots represent the expected distribution of R2 based on permutations. The red diamond represents the model with nominal p-value<0.01. The empirical p-values for these models are listed next to the corresponding red diamond. The 14 day model that uses the counts of hot spring days and cold fall days has a false discovery rate of 17% based on multiple testing correction across all environmental models. (D) The distribution of spring maximum (S-Max) daily temperature and fall minimum (F-min) daily temperature in the 2 weeks prior to sampling. Discordant (blue) populations do not cluster in time or space. Populations shown here are those in which we have weather data (15 populations, in total). (E) The stand-out model uses the number of hot spring days and cold fall days. To determine the optimal threshold for what defines hot and cold, we systematically varied the upper and lower thermal limits from 0°C to 40°C and used the count of hot spring (x1) and cold fall (x2) days as independent, additive variables in a regression model; the genome-wide predictability score was used as the dependent variable (y). The best-fit model uses a spring max (S-Max) temp of ~32°C and a fall min (F-Min) temp of ~5°C and explains ~82% of the variation in the population predictability scores.
Additional files
-
Supplementary file 1
Sample metadata.
(A) Population information. (B) Top 1% of seasonal SNPs (regression beta and p-values). Coordinates are in D. melanogaster reference v5.5.
- https://cdn.elifesciences.org/articles/67577/elife-67577-supp1-v2.xlsx
-
Transparent reporting form
- https://cdn.elifesciences.org/articles/67577/elife-67577-transrepform-v2.docx
Download links
A two-part list of links to download the article, or parts of the article, in various formats.
Downloads (link to download the article as PDF)
Open citations (links to open the citations from this article in various online reference manager services)
Cite this article (links to download the citations from this article in formats compatible with various reference manager tools)
Broad geographic sampling reveals the shared basis and environmental correlates of seasonal adaptation in Drosophila
eLife 10:e67577.
https://doi.org/10.7554/eLife.67577


