Distinct expression requirements and rescue strategies for BEST1 loss- and gain-of-function mutations
- Eye Center, Renmin Hospital of Wuhan University, China
- Department of Pharmacology and Physiology, University of Rochester, School of Medicine and Dentistry, United States
- Department of Ophthalmology, Vagelos College of Physicians & Surgeons, Columbia University, United States
- Department of Pharmacology, Columbia University, United States
- Eye Center, Medical Research Institute, Renmin Hospital, Wuhan University, China
- Jonas Children’s Vision Care, Departments of Ophthalmology and Pathology & Cell Biology, Edward S. Harkness Eye Institute, Institute of Human Nutrition and Columbia Stem Cell Initiative, New York Presbyterian Hospital/Columbia University Irving Medical Center, United States
Figures
Figure 1 with 2 supplements
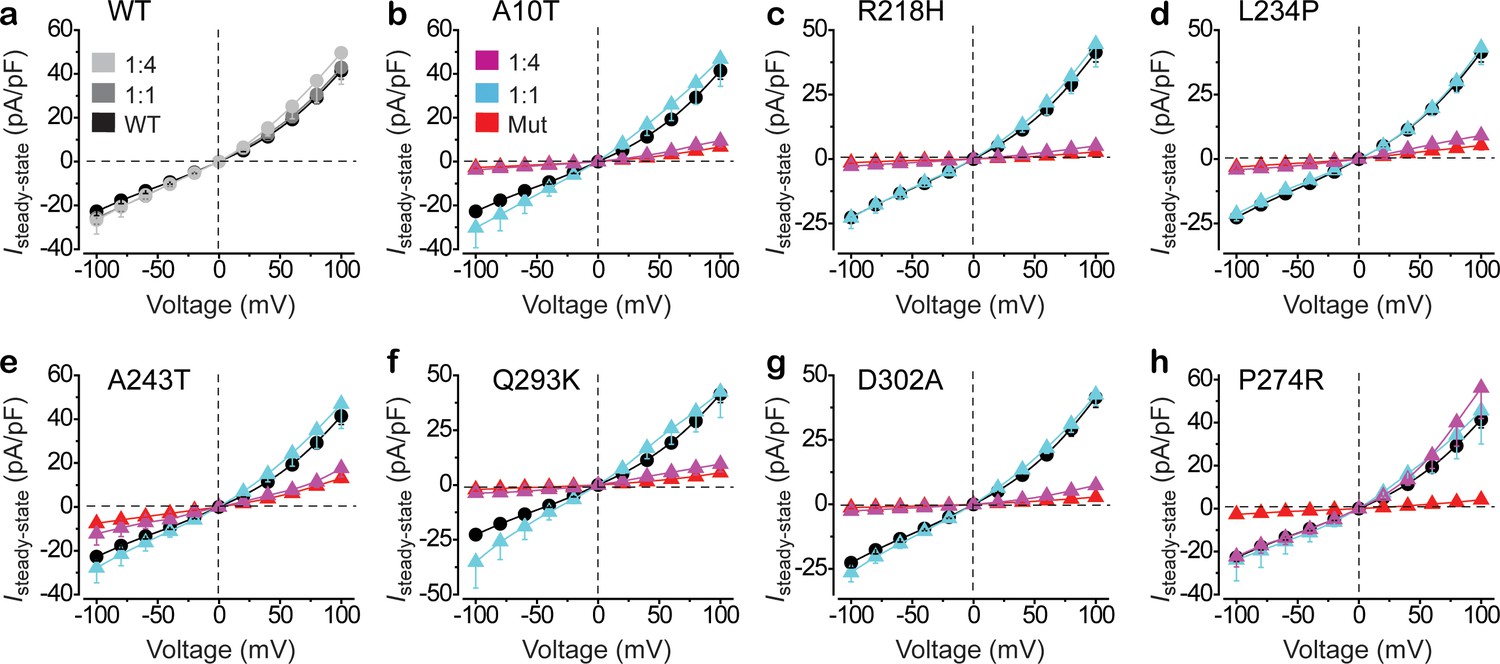
Functional influence of BEST1 loss-of-function mutants in HEK293 cells.
(a) Population steady-state current density-voltage relationships in HEK293 cells expressing BEST1 WT-CFP only (black), WT-CFP: WT-YFP = 1:1 (gray), or WT-CFP: WT-YFP = 1:4 (light gray), in the presence of 1.2 μM [Ca2+]i, n = 5–6 for each point. (b–h) Population steady-state current density-voltage relationships in HEK293 cells expressing BEST1 WT-CFP: mutant-YFP = 1:1 (cyan), WT-CFP: mutant-YFP = 1:4 (magenta), compared to mutant (red) or WT (black) only, in the presence of 1.2 μM [Ca2+]i, n = 5–6 for each point. The mutants are BEST1 A10T (b), R218H (c), L234P (d), A243T (e), Q293K (f), D302A (g), and P274R (h). All error bars in this figure represent s.e.m. See also Figure 1—figure supplements 1 and 2.
Figure 1—figure supplement 1

Electrophysiological analysis of BEST1 loss-of-function mutations.
(a) Bar chart showing population steady-state current densities at +100 mV for 1:1 co-expressed BEST1 WT-CFP and WT/mutant-YFP in HEK293 cells at 1.2 μM [Ca2+]i; n = 5–6 for each point. (b) Bar chart showing population steady-state current densities at +100 mV for 1:4 co-expressed BEST1 WT-CFP and WT/mutant-YFP in HEK293 cells at 1.2 μM [Ca2+]i; n = 5–6 for each point. *p<0.05 compared to WT only, using two-tailed unpaired Student’s t test. All error bars in this figure represent s.e.m.
Figure 1—figure supplement 2
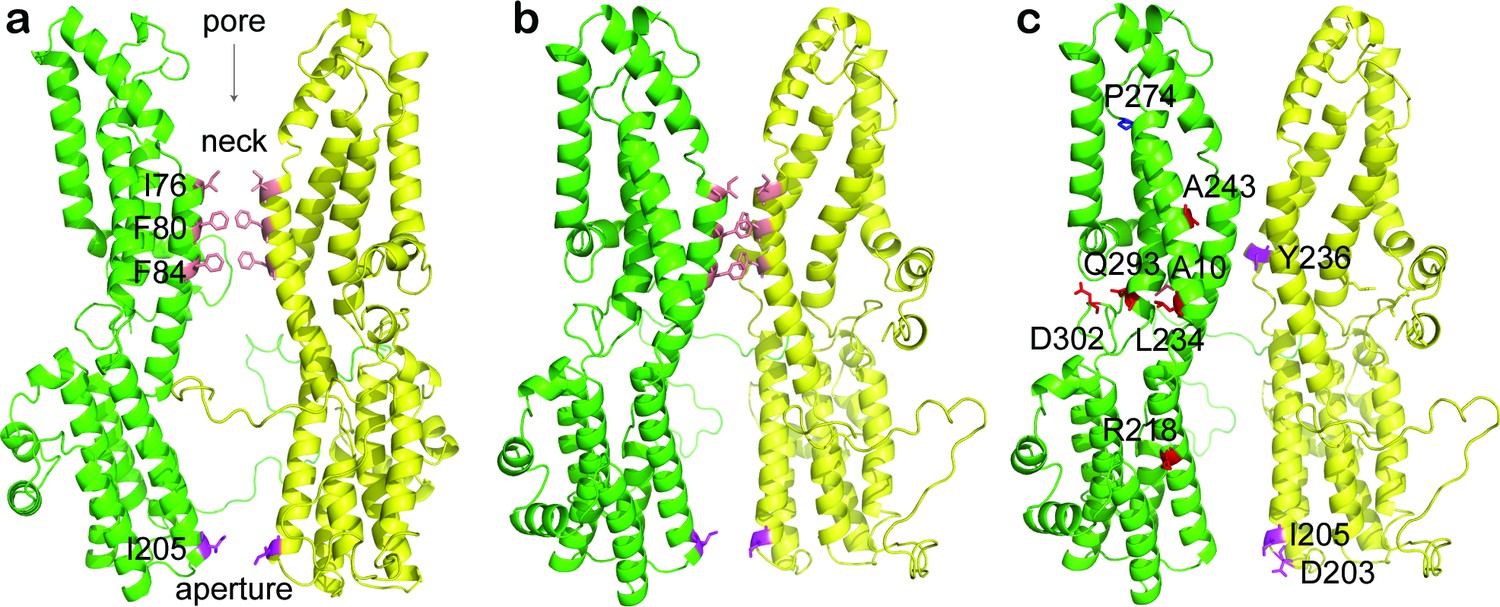
Patient-derived BEST1 mutations in a homology model.
Ribbon diagram of two oppositely facing (144°) protomers of a BEST1 pentamer is shown with the extracellular side on the top. (a) The side chains are shown and highlighted for residues at the neck (I76, F80, and F84, salmon) and aperture (I205, magenta). (b) The same diagram as a, rotated to the same degree as c. (c) The side chains are shown and highlighted for residues harboring loss-of-function (dominant: A10, R218, L234, A243, Q293, and D302, red; recessive: P274, blue) and gain-of-function (D203, I205, and Y236, magenta) mutations.
Figure 2 with 1 supplement
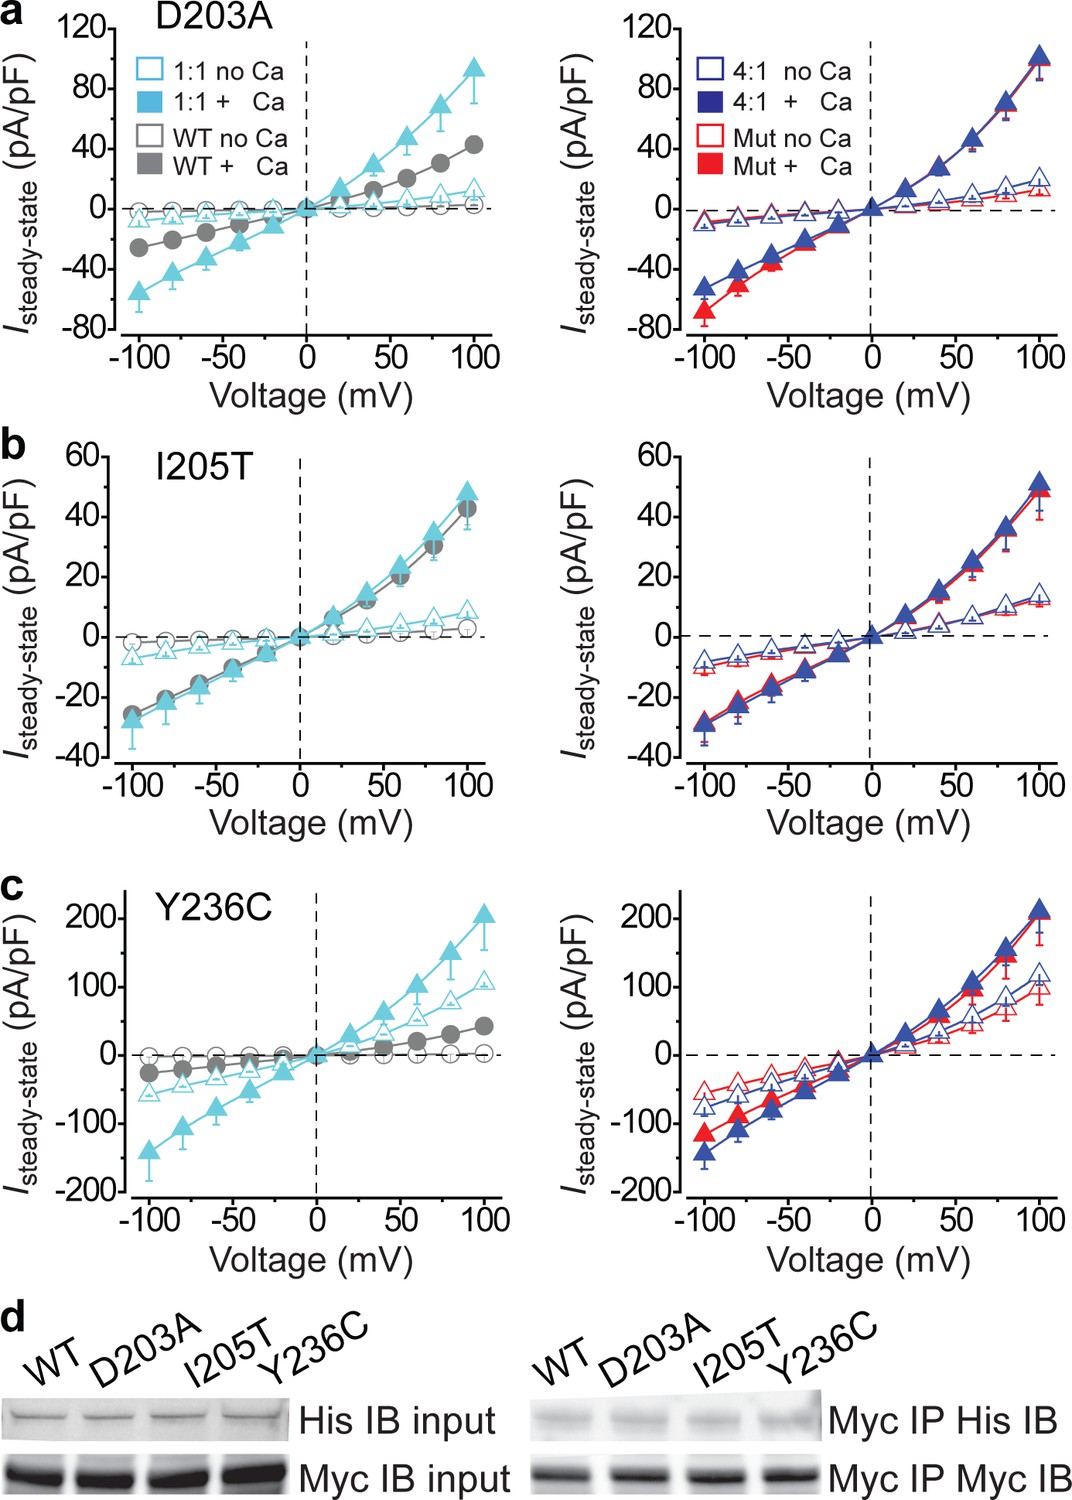
Functional influence of BEST1 gain-of-function mutants in HEK293 cells.
(a–c) Left, population steady-state current density-voltage relationships in HEK293 cells co-expressing WT-CFP: mutant-YFP = 1:1 (cyan) compared to WT only (WT-CFP: WT-YFP = 1:1, gray), in the absence (open) or presence (solid) of 1.2 μM [Ca2+]i, n = 5–6 for each point. Right, population steady-state current density-voltage relationships in HEK293 cells co-expressing WT-CFP: mutant-YFP = 4:1 (blue) compared to mutant only (red), in the absence (open) or presence (solid) of 1.2 μM [Ca2+]i, n = 5–6 for each point. The mutants are BEST1 D203A (a), I205T (b), and Y236C (c). All error bars in this figure represent s.e.m. (d) WT or mutant BEST1-YFP-His was co-expressed with WT BEST1-CFP-Myc in HEK293 cells, and detected by immunoblotting directly in cell lysate (input) or after co-immunoprecipitation. See also Figure 2—figure supplements 1 and Figure 2—source data 1.
-
Figure 2—source data 1
The uncropped blots in Figure 2d and Figure 3—figure supplement 1.
- https://cdn.elifesciences.org/articles/67622/elife-67622-fig2-data1-v1.docx
Figure 2—figure supplement 1
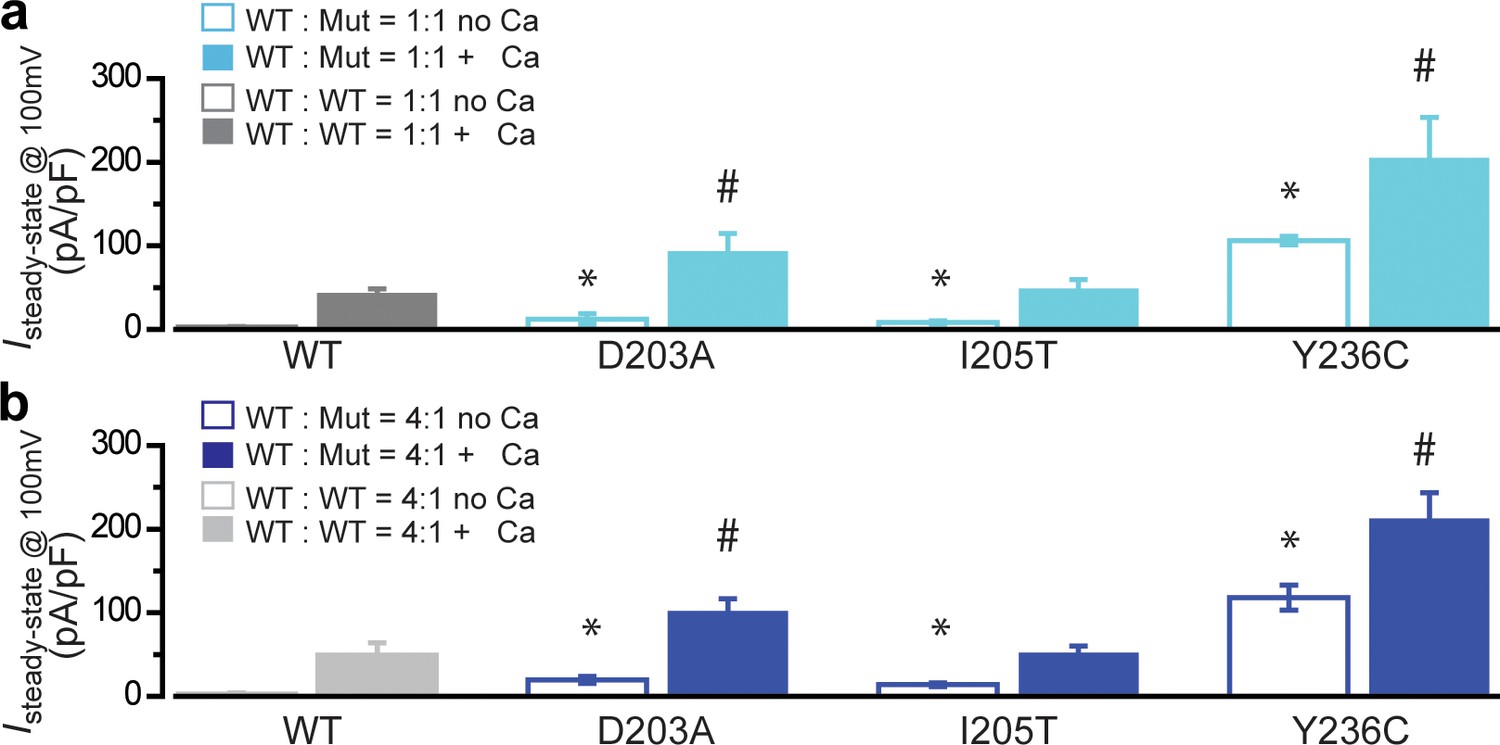
Electrophysiological analysis of BEST1 gain-of-function mutations.
(a) Bar chart showing population steady-state current densities at +100 mV for 1:1 co-expressed BEST1 WT-CFP and WT/mutant-YFP in HEK293 cells in the absence (open) or presence (solid) of 1.2 μM [Ca2+]i; n = 5–6 for each point. *#p<0.05 compared to WT only in the absence or presence of Ca2+, respectively, using two-tailed unpaired Student’s t test. (b) Bar chart showing population steady-state current densities at +100 mV for 4:1 co-expressed BEST1 WT-CFP and WT/mutant-YFP in HEK293 cells in the absence (open) or presence (solid) of 1.2 μM [Ca2+]i; n = 5–6 for each point. *#p<0.05 compared to WT only in the absence or presence of Ca2+, respectively, using two-tailed unpaired Student’s t test. All error bars in this figure represent s.e.m.
Figure 3 with 3 supplements
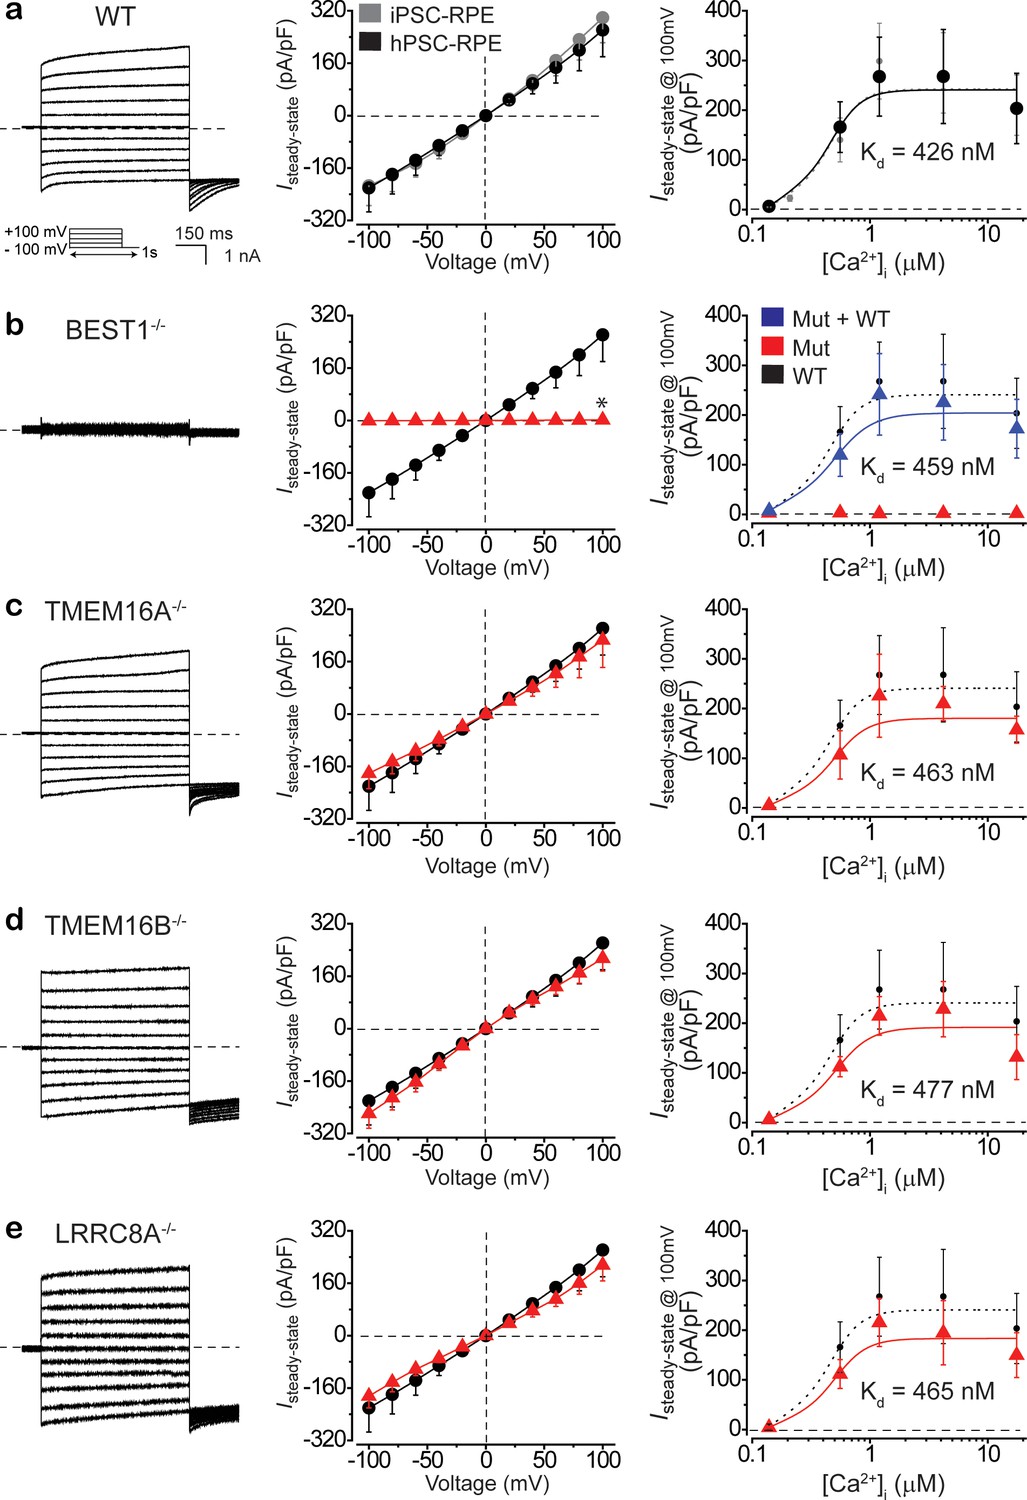
BEST1 is responsible for conducting Ca2+-dependent Cl- currents in hPSC-RPE.
(a) Ca2+-dependent Cl- currents measured by whole-cell patch clamp in WT hPSC-RPE. Left, representative current traces recorded at 1.2 μM [Ca2+]i. Inset, voltage protocol used to elicit currents. Middle, population steady-state current density-voltage relationship in WT hPSC-RPE (black) compared to that from WT iPSC-RPE (gray), at 1.2 μM [Ca2+]i, n = 5–6 for each point. Right, steady-state current density recorded at +100 mV plotted vs. [Ca2+]i from WT hPSC-RPE (black) compared to that from WT iPSC-RPE (gray), n = 5–6 for each point. The plot was fitted to the Hill equation. (b–e) Ca2+-dependent Cl- currents measured by whole-cell patch clamp in BEST1-/- (b), TMEM16A-/- (c), TMEM16B-/- (d), or LRRC8A-/- (e) hPSC-RPE cells, respectively. Left, representative current traces recorded at 1.2 μM [Ca2+]i. Middle, population steady-state current density-voltage relationship in knockout hPSC-RPE cells (red), compared to that from WT hPSC-RPE cells (black), at 1.2 μM [Ca2+]i, n = 5–6 for each point. Right, steady-state current density recorded at +100 mV plotted vs. [Ca2+]i from knockout (red) and WT BEST1 supplemented (blue in b) hPSC-RPE cells, compared to the plot from WT hPSC-RPE (dotted black), n = 5–6 for each point. Plots were fitted to the Hill equation. *p<0.05 (1.8 × 10⁻²) compared to WT cells, using two-tailed unpaired Student’s t test. All error bars in this figure represent s.e.m. See also Figure 3—figure supplements 1–3 and Figure 3—source data 1.
-
Figure 3—source data 1
gRNA sequences for CRISPR/Cas9.
- https://cdn.elifesciences.org/articles/67622/elife-67622-fig3-data1-v1.docx
Figure 3—figure supplement 1
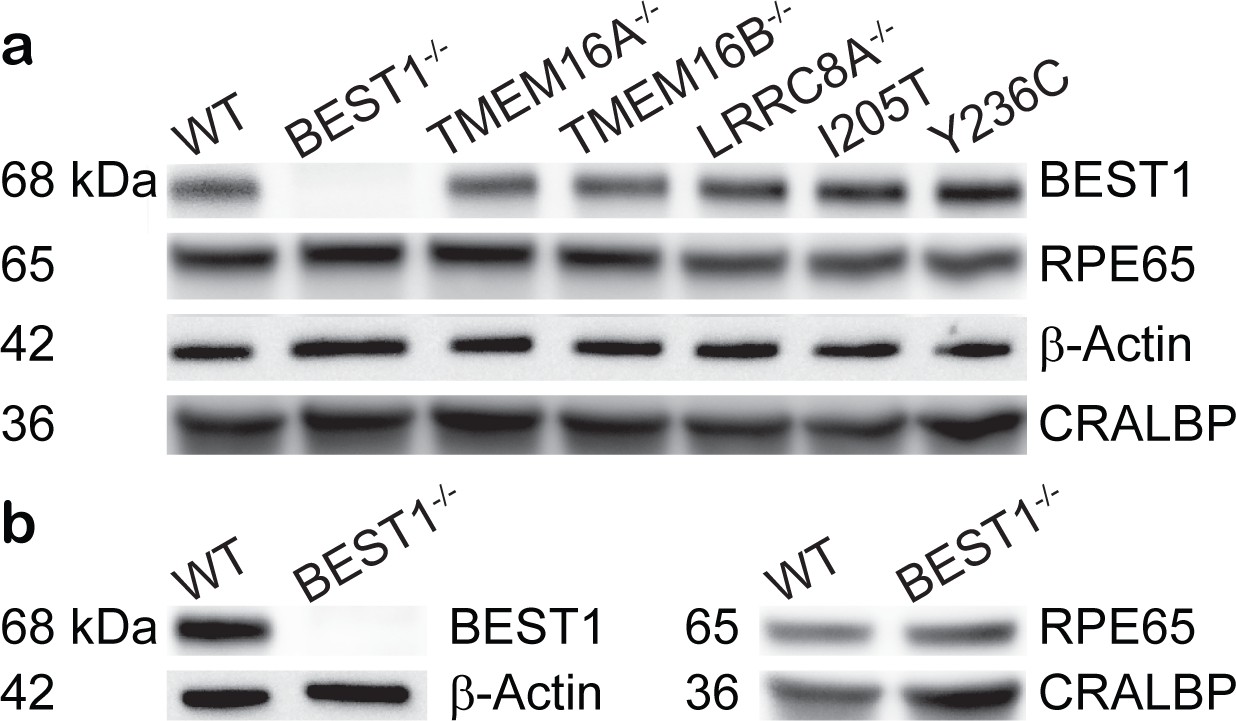
Expression of RPE-specific marker proteins in hPSC-RPE and iPSC-RPE cells.
(a–b) Immunoblotting showing the expression of RPE-specific proteins BEST1, RPE65, CRALBP, and the loading control β-Actin in hPSC-RPE (a) and iPSC-RPE (b) cells. Two gels/blots in the same panel were prepared from the same cell lysate of each PSC-RPE to detect BEST1 + β-Actin, and RPE65 + CRALBP, respectively.
Figure 3—figure supplement 2
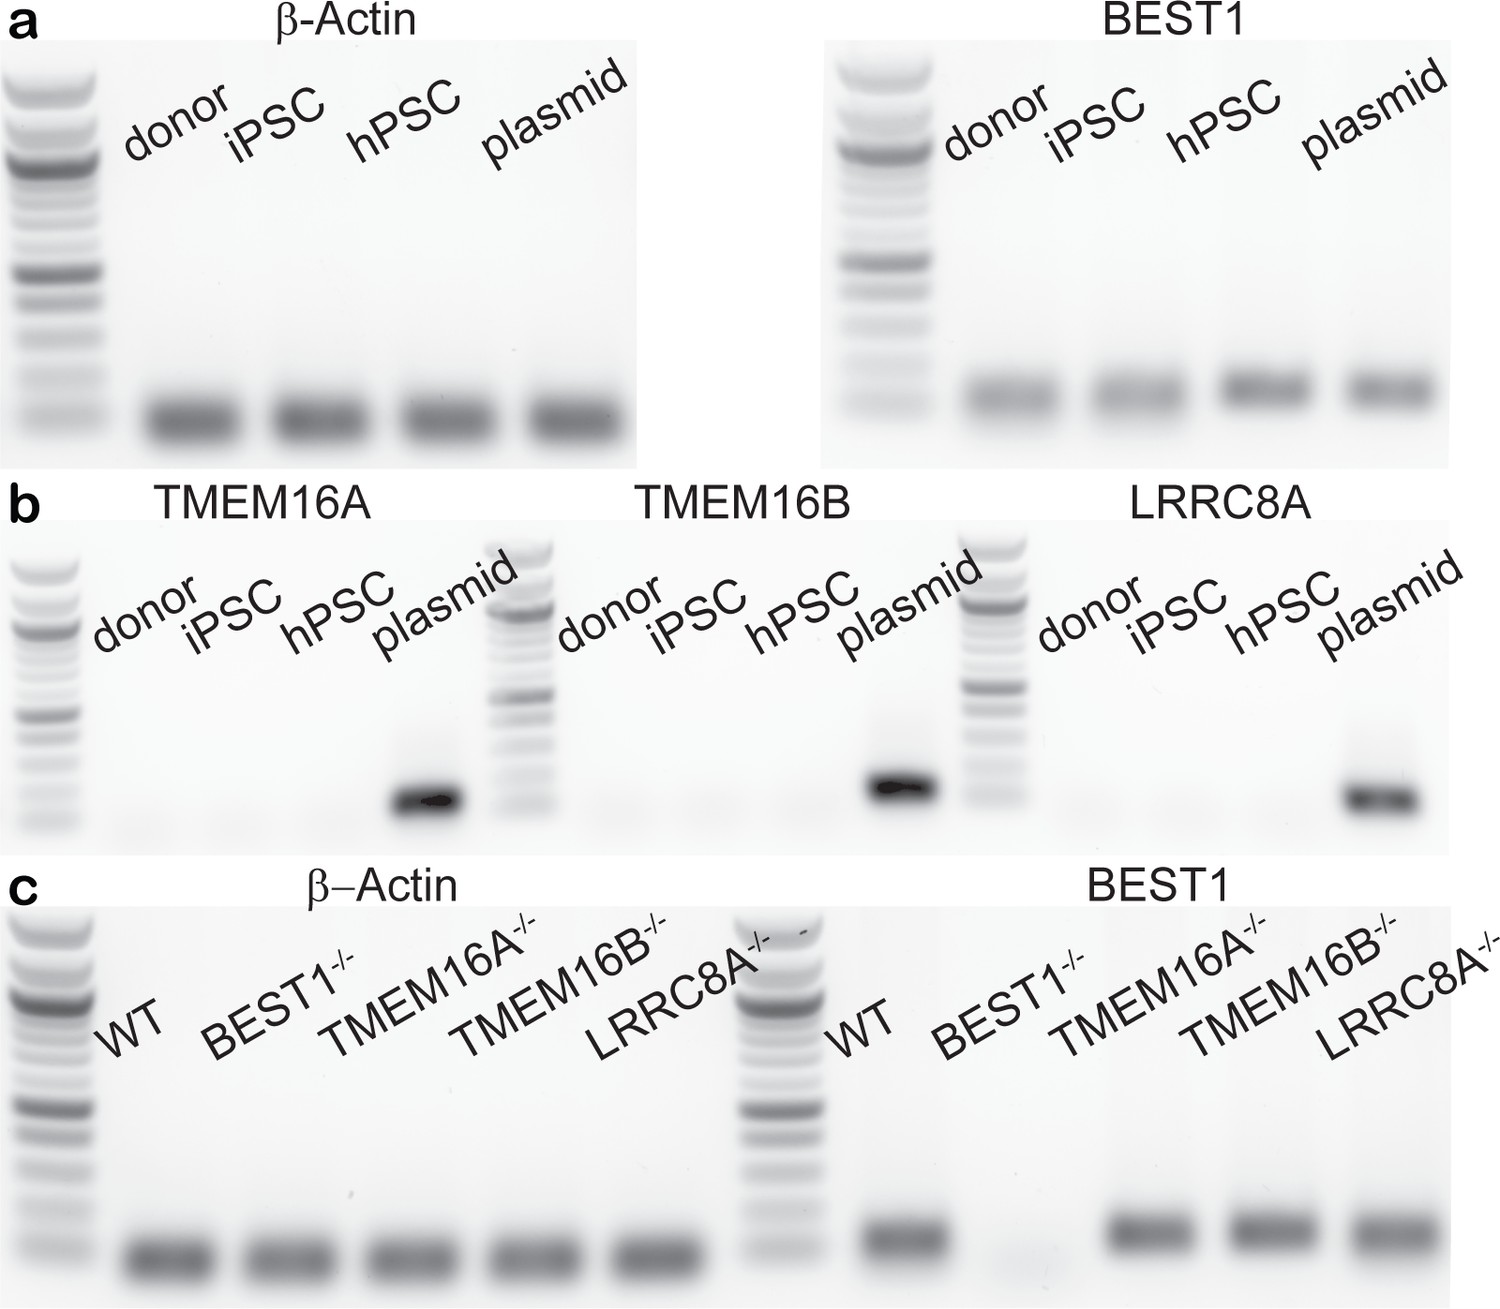
mRNA levels of Ca2+-activated Cl- channels (CaCCs) in hPSC-RPE cells.
(a) Reverse transcription polymerase chain reaction (RT-PCR) detecting BEST1 and control β-Actin mRNA in WT native RPE, iPSC-RPE and hPSC-RPE cells. Plasmids bearing the corresponding full-length cDNA were used as positive controls in PCR reactions. (b) RT-PCR detecting mRNA of TMEM16A, TMEM16B, and LRRC8A in WT native RPE, iPSC-RPE, and hPSC-RPE cells. Plasmids bearing the corresponding full-length cDNA were used as positive controls in PCR reactions. (c) RT-PCR detecting BEST1 and control β-Actin mRNA in WT and knockout hPSC-RPE cells.
Figure 3—figure supplement 3
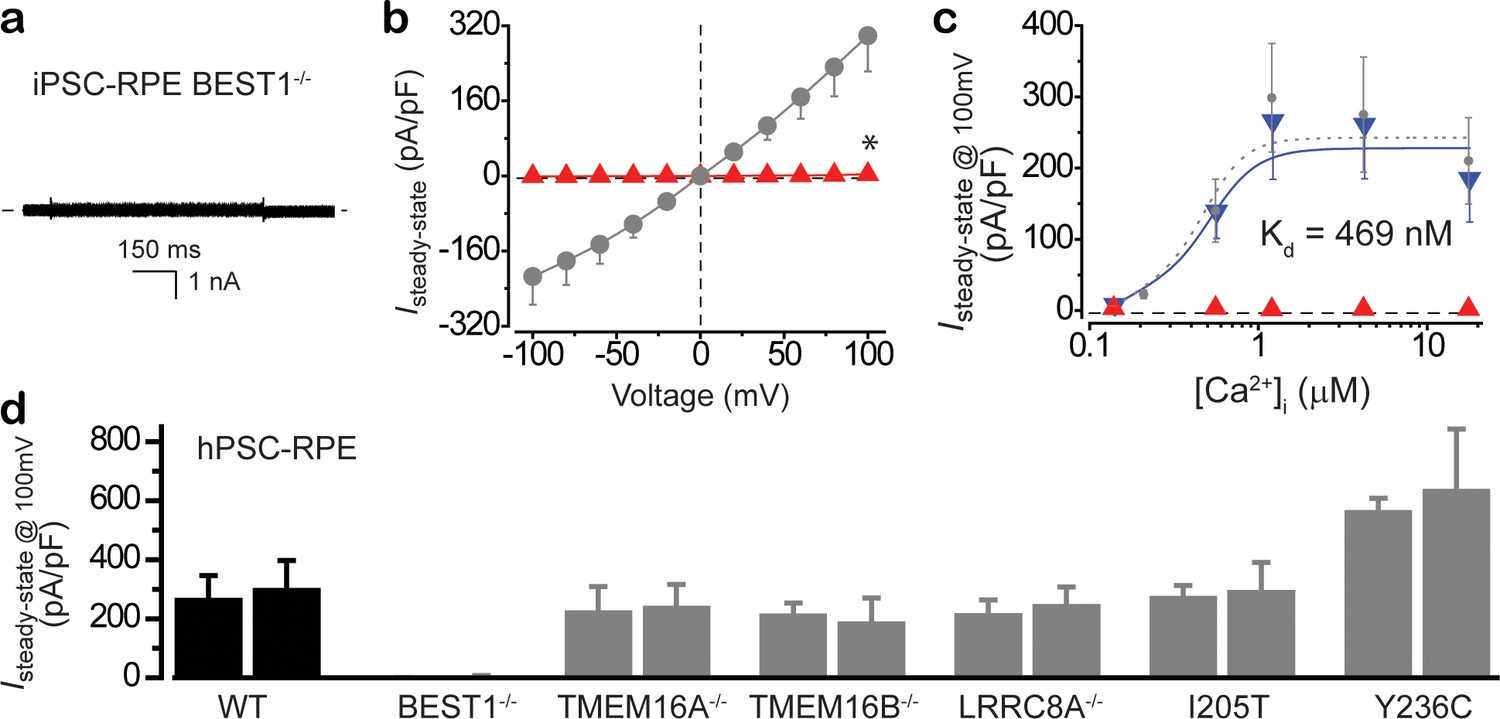
Ca2+-dependent Cl- currents in iPSC-RPE and hPSC-RPE cells.
(a) Ca2+-dependent Cl- currents measured by whole-cell patch clamp in patient-derived BEST1 null iPSC-RPE. Representative current traces recorded at 1.2 μM [Ca2+]i. (b) Population steady-state current density-voltage relationship in BEST1 null iPSC-RPE (red) compared to that in WT iPSC-RPE (gray), at 1.2 μM [Ca2+]i, n = 5–6 for each point. *p<0.05 compared to WT cells, using two-tailed unpaired Student’s t test. (c) Steady-state current density recorded at +100 mV plotted vs. [Ca2+]i from BEST1 null (red), and BEST1 null supplemented with WT BEST1 (blue), compared to WT iPSC-RPE (gray), n = 5–6 for each point. The plots were fitted to the Hill equation. (d) Bar chart showing population steady-state current densities at +100 mV in hPSC-RPE cells at 1.2 μM [Ca2+]i, n = 5–6 for each point. Two clonal hPSC-RPE cells from each genotype were recorded. Black, WT. Gray, knockout or knock-in mutants. All error bars in this figure represent s.e.m.
Figure 4 with 1 supplement
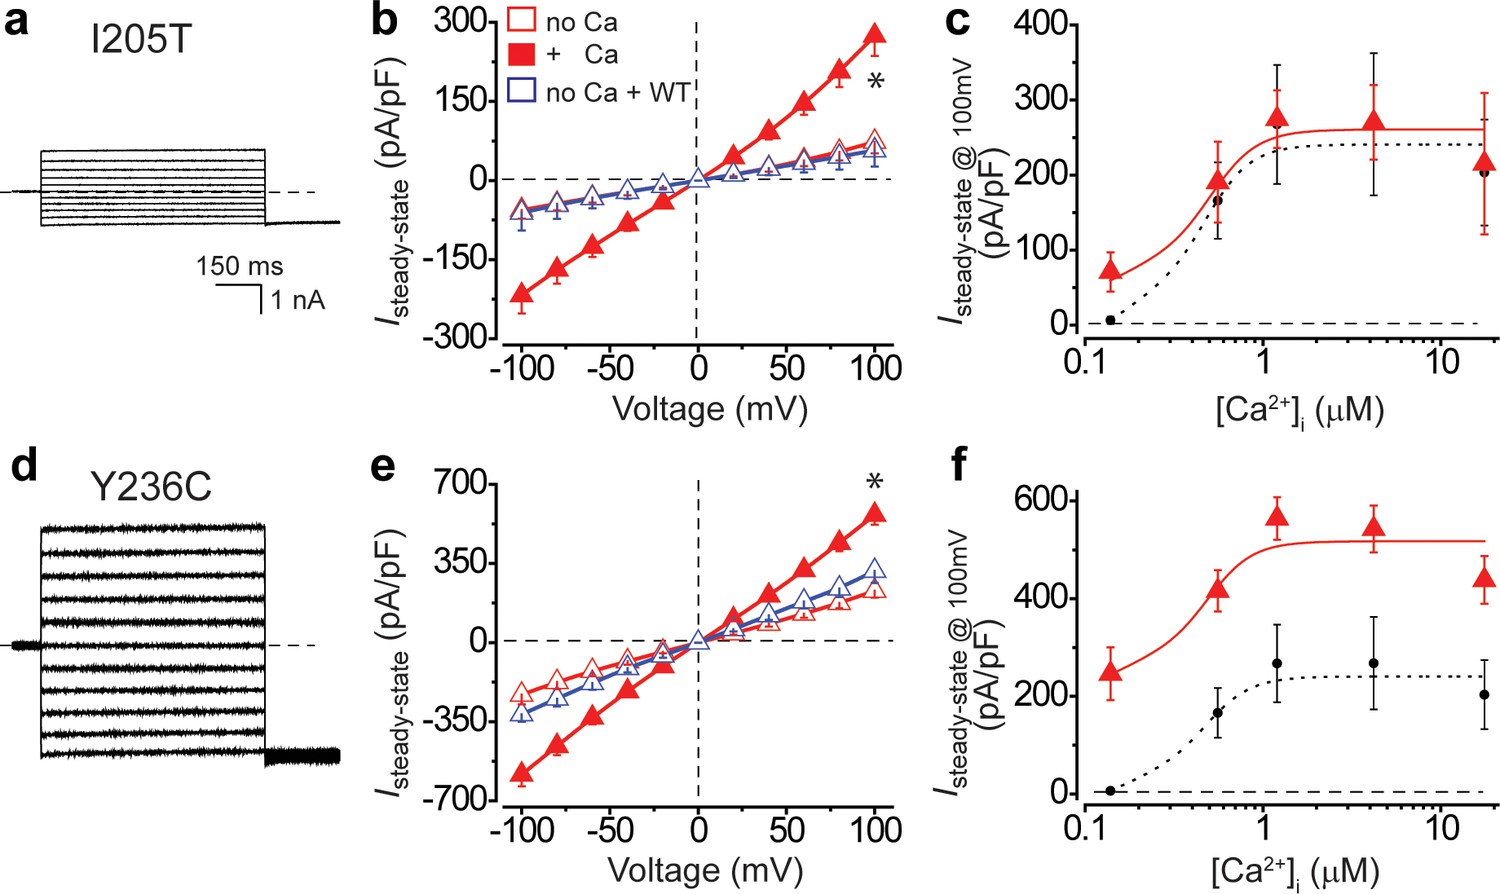
Ca2+-dependent Cl- currents in hPSC-RPE cells bearing BEST1 gain-of-function mutations.
(a) Representative current traces of BEST1I205T/WT hPSC-RPE in the absence of Ca2+. (b) Population steady-state current density-voltage relationships in BEST1I205T/WT hPSC-RPE, in the absence (open red) or presence (solid red) of 1.2 μM [Ca2+]i, compared to cells with WT BEST1 augmentation in the absence of Ca2+ (open blue), n = 5–8 for each point. *p<0.05 (1.3 × 10⁻³) compared to cells without augmentation in the absence of Ca2+, using two-tailed unpaired Student’s t test. (c) Steady-state current densities recorded at +100 mV plotted vs. [Ca2+]i in BEST1I205T/WT hPSC-RPE (red) compared to those in BEST1WT/WT hPSC-RPE cells (black), n = 5–6 for each point. (d–f) Data for BEST1Y236C/WT in the same format as (a–c), respectively. *p<0.05 (2.5 × 10⁻⁵) compared to cells without augmentation in the absence of Ca2+, using two-tailed unpaired Student’s t test. n = 5–10 for each point. All error bars in this figure represent s.e.m. See also Figure 4—figure supplement 1.
Figure 4—figure supplement 1

CRISPR/Cas9-mediated gene silencing in combination with augmentation.
(a) Augmented BEST1-GFP and endogenous BEST1 were detected by immunoblotting in hPSC-RPE cells. (b) Schematic of the baculovirus-based silencing (BVSi) vector. (c) Immunoblotting showing the knockdown of endogenous BEST1 expression with BVSi vectors and augmentation of wobble BEST1-mCherry in WT hPSC-RPE cells. (d) Immunoblotting showing the knockdown of endogenous BEST1 expression with BVSi 3–8 and augmentation of wobble BEST1-mCherry in hPSC-RPE cells carrying BEST1 gain-of-function mutations.
Figure 5
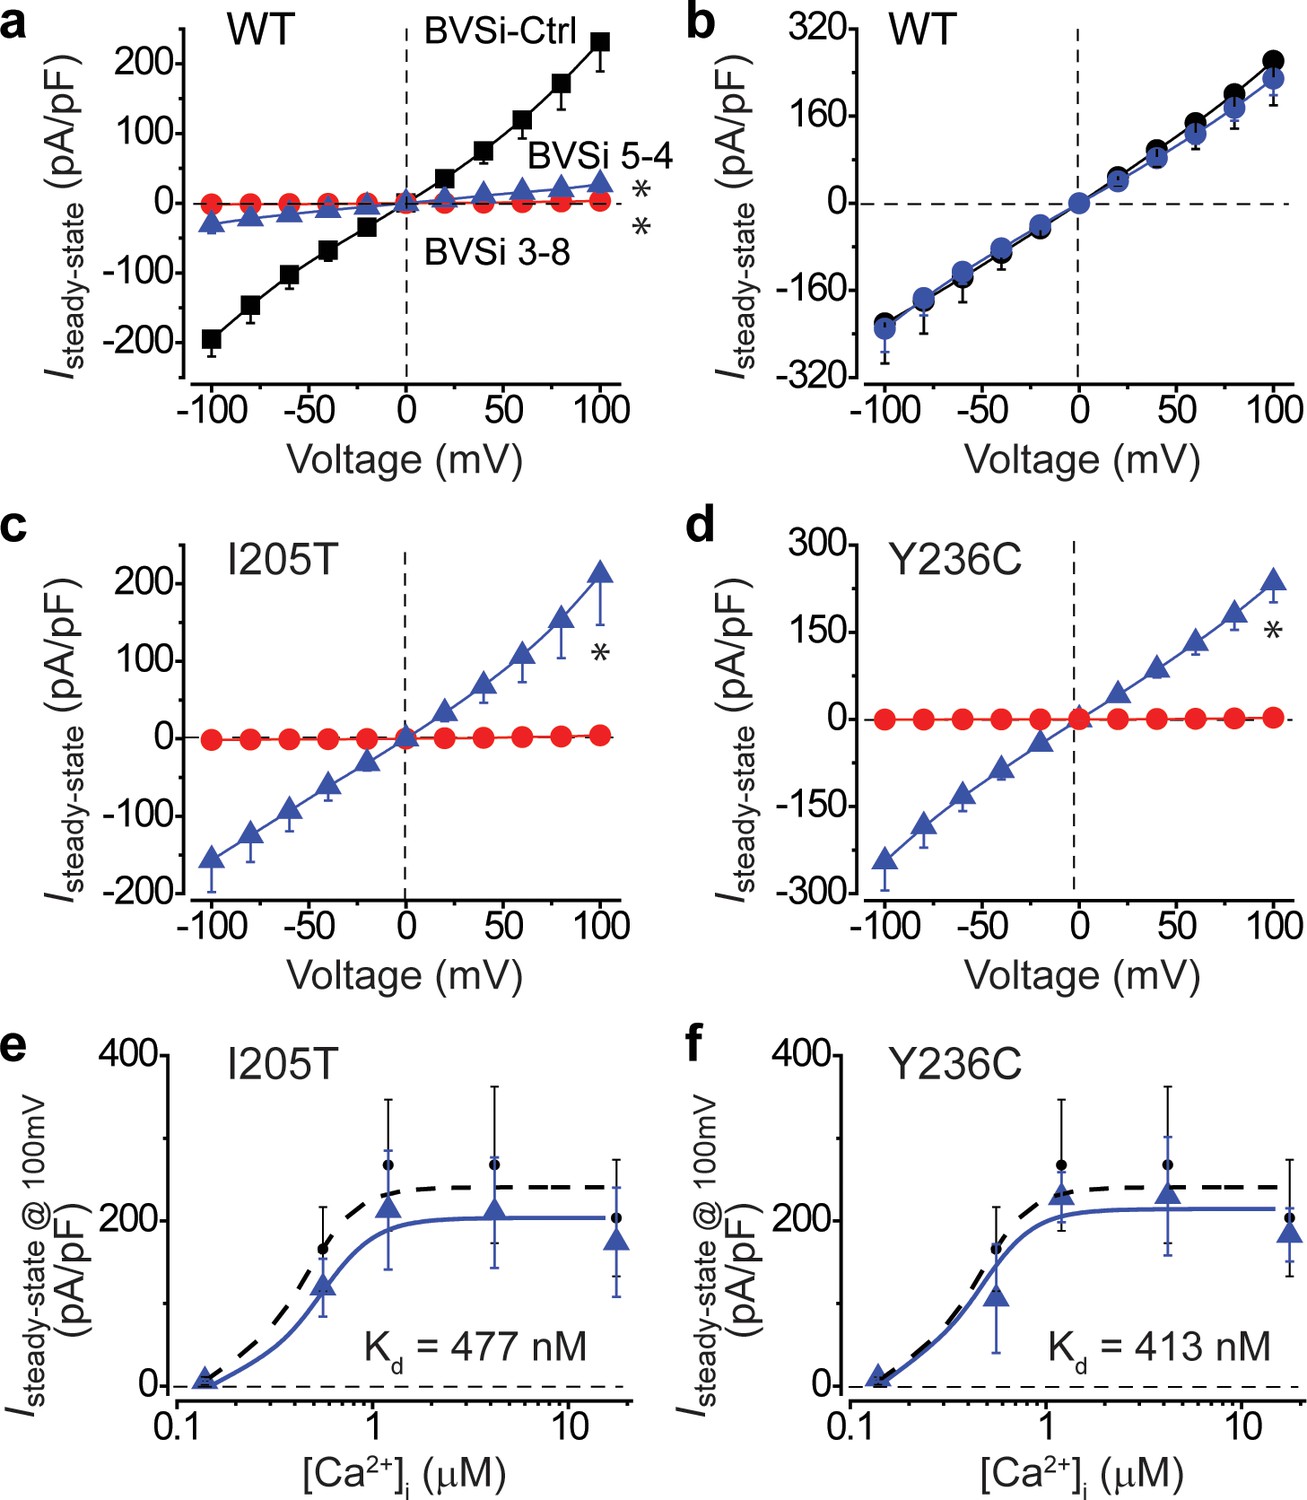
Knockdown and rescue of BEST1 gain-of-function mutations in hPSC-RPE cells.
(a) Population steady-state current density-voltage relationships in WT hPSC-RPE cells treated with BVSi-Ctrl (black) compared to those in BVSi 3–8 (red) or BVSi 5–4 (blue) treated cells, at 1.2 μM [Ca2+]i, n = 5–17 for each point. *p<0.05 (8.3 × 10⁻⁷ for BVSi 3–8 and 1.6 × 10⁻⁶ for BVSi 5–4) compared to BVSi-Ctrl treated cells, using two-tailed unpaired Student’s t test. (b) Population steady-state current density-voltage relationships in WT hPSC-RPE cells treated with BVSi 3–8 plus wobble WT BEST1 (blue) compared to those in untreated cells (black), at 1.2 μM [Ca2+]i, n = 5–6 for each point. (c–d) Population steady-state current density-voltage relationships in BEST1I205T/WT (c) or BEST1Y236C/WT (d) hPSC-RPE cells treated with BVSi 3–8 alone (red), or BVSi 3–8 plus wobble WT BEST1 (blue), at 1.2 μM [Ca2+]i, n = 5–9 for each point. *p<0.05 (3.8 × 10⁻³ for I205T and 2.7 × 10⁻⁴ for Y236C) compared to cells treated with BVSi 3–8 alone, using two-tailed unpaired Student’s t test. (e–f) Steady-state current densities recorded at +100 mV plotted vs. [Ca2+]i in BEST1I205T/WT (e) or BEST1Y236C/WT (f) hPSC-RPE cells treated with BVSi 3–8 plus wobble WT BEST1 (blue) compared to those in untreated WT hPSC-RPE (black), n = 5–6 for each point. The plots were fitted to the Hill equation. All error bars in this figure represent s.e.m.
Tables
Table 1
Sequencing of BEST1 transcripts in retinal pigment epithelium (RPE) cells.
#1–6 are patient-derived iPSC-RPE cells carrying the same set of BEST1 mutations as those analyzed in transiently transfected HEK293 cells in Figure 1. #7 is native human RPE cells from a healthy donor bearing a single nucleotide polymorphism (SNP) in the BEST1 gene.
| Donor # | Mutation | RPE type | Mutant/WT from clone #1 | Mutant/WT from clone #2 |
|---|---|---|---|---|
| 1 | A10T | iPSC-RPE | 72/23 | 51/12 |
| 2 | R218H | iPSC-RPE | 84/20 | 45/11 |
| 3 | L234P | iPSC-RPE | 77/19 | 42/20 |
| 4 | A243T | iPSC-RPE | 83/28 | 37/11 |
| 5 | Q293K | iPSC-RPE | 76/19 | 46/10 |
| 6 | D302A | iPSC-RPE | 78/18 | 35/14 |
| 7 | rs767552540 | Native | 74/23 | NA |
Key resources table
| Reagent type (species) or resource | Designation | Source or reference | Identifiers | Additional information |
|---|---|---|---|---|
| Strain, strain background (Escherichia coli) | HST08 (Stellar cells) | TaKaRa | 636766 | Chemical competent cells |
| Cell line (Spodoptera frugiperda) | Sf9 | Thermo Fisher Scientific | RRID:CVCL_0549 | Insect cell line for baculovirus production |
| Cell line (Homo sapiens) | HEK293 | ATCC | RRID:CVCL_0045 | Embryonic kidney cells |
| Cell line (Homo sapiens) | H1-iCas9 | Sloan Kettering Institute, González et al., 2014 | Embryonic stem cell line with an inducible CRISPR cassette | |
| Cell line (Homo sapiens) | H1-iCas9 BEST1-/- | This paper | BEST1-/- knockout generated from the H1-iCas9 line | |
| Cell line (Homo sapiens) | H1-iCas9 TMEM16A-/- | This paper | TMEM16A-/- knockout generated from the H1-iCas9 line | |
| Cell line (Homo sapiens) | H1-iCas9 TMEM16B-/- | This paper | TMEM16B-/- knockout generated from the H1-iCas9 line | |
| Cell line (Homo sapiens) | H1-iCas9 LRRC8A-/- | This paper | LRRC8A-/- knockout generated from the H1-iCas9 line | |
| Cell line (Homo sapiens) | H1-iCas9 BEST1I205T/WT | This paper | BEST1I205T/WT knock-in generated from the H1-iCas9 line | |
| Cell line (Homo sapiens) | H1-iCas9 BEST1Y236C/WT | This paper | BEST1Y236C/WT knock-in generated from the H1-iCas9 line | |
| Biological sample (Homo sapiens) | RPE cells | Li et al., 2017 | Human RPE cells from a post-mortem donor | |
| Biological sample (Homo sapiens) | iPSC-RPE cells | Ji et al., 2019a | iPSC-RPE cells derived from patient skin cells | |
| Antibody | Anti- RPE65 (Mouse monoclonal) | Novus Biologicals | Cat#: NB100-355, RRID:AB_10002148 | WB (1:1,000) |
| Antibody | Anti-CRALBP (mouse monoclonal) | Abcam | Cat#: ab15051, RRID:AB_2269474 | WB (1:500) |
| Antibody | Anti- BEST1 (mouse monoclonal) | Novus Biologicals | Cat#: NB300-164, RRID:AB_10003019 | WB (1:500) |
| Antibody | Anti-β-actin (rabbit polyclonal) | Abcam | Cat#: ab8227, RRID:AB_2305186 | WB (1:2,000) |
| Antibody | Anti- 6xHis (rabbit polyclonal) | Thermo Fisher Scientific | Cat#: PA1-983B, RRID:AB_1069891 | WB (1:1,000) |
| Antibody | Anti-Myc (rabbit polyclonal) | Thermo Fisher Scientific | Cat#: PA1-981, RRID:AB_325961 | WB (1:1,000) |
| Antibody | IRDye 680RD anti-mouse IgG (goat polyclonal) | LI-COR Biosciences | Cat#: 925–68070, RRID:AB_2651128 | WB (1:10,000) |
| Antibody | IRDye 800CW anti-rabbit IgG (donkey polyclonal) | LI-COR Biosciences | Cat#: 925–32213, RRID:AB_2715510 | WB (1:10,000) |
| Recombinant DNA reagent | pEG BacMam | Goehring et al., 2014 | Baculoviral vector for gene expression | |
| Recombinant DNA reagent | pBacMam-BEST1-GFP (plasmid) | Li et al., 2017 | To express exogenous BEST1 in HEK293 cells | |
| Recombinant DNA reagent | pBacMam-BEST1-mCherry (plasmid) | This paper | Made from pEG BacMam by inserting BEST1-mCherry | |
| Recombinant DNA reagent | dCas9-KRAB-MeCP2 (plasmid) | Addgene | RRID :Addgene_110821 | Improved dCas9 repressor-dCas9-KRAB-MeCP2 |
| Recombinant DNA reagent | pSpCas9(BB)−2A-GFP (PX458) (plasmid) | Addgene | RRID :Addgene_48138 | Cas9 from Streptococcus pyogenes with 2A-EGFP, and cloning backbone for sgRNA |
| Recombinant DNA reagent | BVSi 5–4-GFP (plasmid) | This paper | Made from pEG BacMam, dCas9-KRAB-MeCP2 and pSpCas9(BB)−2A-GFP, for BEST1 silencing | |
| Recombinant DNA reagent | BVSi 3–8-GFP (plasmid) | This paper | Made from pEG BacMam, dCas9-KRAB-MeCP2 and pSpCas9(BB)−2A-GFP, for BEST1 silencing | |
| Recombinant DNA reagent | BVSi ctrl-GFP (plasmid) | This paper | Made from pEG BacMam, dCas9-KRAB-MeCP2 and pSpCas9(BB)−2A-GFP, serving as a control for BEST1 silencing | |
| Sequence-based reagent | hBest1-I205T-ssDNA | This paper | Knock-in ssDNA template | GCCCTGGGTGTGGTTTGCCAACCTGTCAATGAAGGCGTGGCTTGGAGGTCGAATTCGGGACCCTACCCTGCTCCAGAGCCTGCTGAACGTGAGCCCACTGTACAGACAGGGCTGCCGCAG |
| Sequence-based reagent | hBest1-Y236C-ssDNA | This paper | Knock-in ssDNA template | TCAGTGTGGACACCTGTATGCCTACGACTGGATTAGTATCCCACTGGTGTGTACACAGGTGAGGACTAGTCTGGTGAGGCTGCCCTTTTGGGAAACTGAGGCTAGAAGGACCAAGGAAGC |
| Commercial assay or kit | CytoTune-iPS 2.0 Sendai reprogramming kit | Thermo Fisher Scientific | Cat#: A16517 | To generate iPSC |
| Commercial assay or kit | In-Fusion HD Cloning | Clontech | Clontech:639647 | For molecular cloning |
| Commercial assay or kit | PolyJet In Vitro DNA Transfection Reagent | SignaGen Laboratories | SL100688 | For cell transfection |
| Software, algorithm | Patchmaster | HEKA | RRID:SCR_000034 | Patch clamp data collection and analysis |
| Software, algorithm | PyMOL | PyMOL | RRID:SCR_000305 | Structural analysis |
Additional files
Download links
A two-part list of links to download the article, or parts of the article, in various formats.
Downloads (link to download the article as PDF)
Open citations (links to open the citations from this article in various online reference manager services)
Cite this article (links to download the citations from this article in formats compatible with various reference manager tools)
Distinct expression requirements and rescue strategies for BEST1 loss- and gain-of-function mutations
eLife 10:e67622.
https://doi.org/10.7554/eLife.67622


