High and stable ATP levels prevent aberrant intracellular protein aggregation in yeast
- Gunma University Initiative for Advanced Research (GIAR), Gunma University, Japan
- Institute for Molecular and Cellular Regulation (IMCR), Gunma University, Japan
- Graduate School of Biostudies, Kyoto University, Japan
- School of International Liberal Studies, Waseda University, Japan
- Japan Science and Technology Agency, PREST, Japan
Figures
Figure 1 with 4 supplements
Interconversion and active synthesis of adenine nucleotides are important for adenosine triphosphate (ATP) homeostasis.
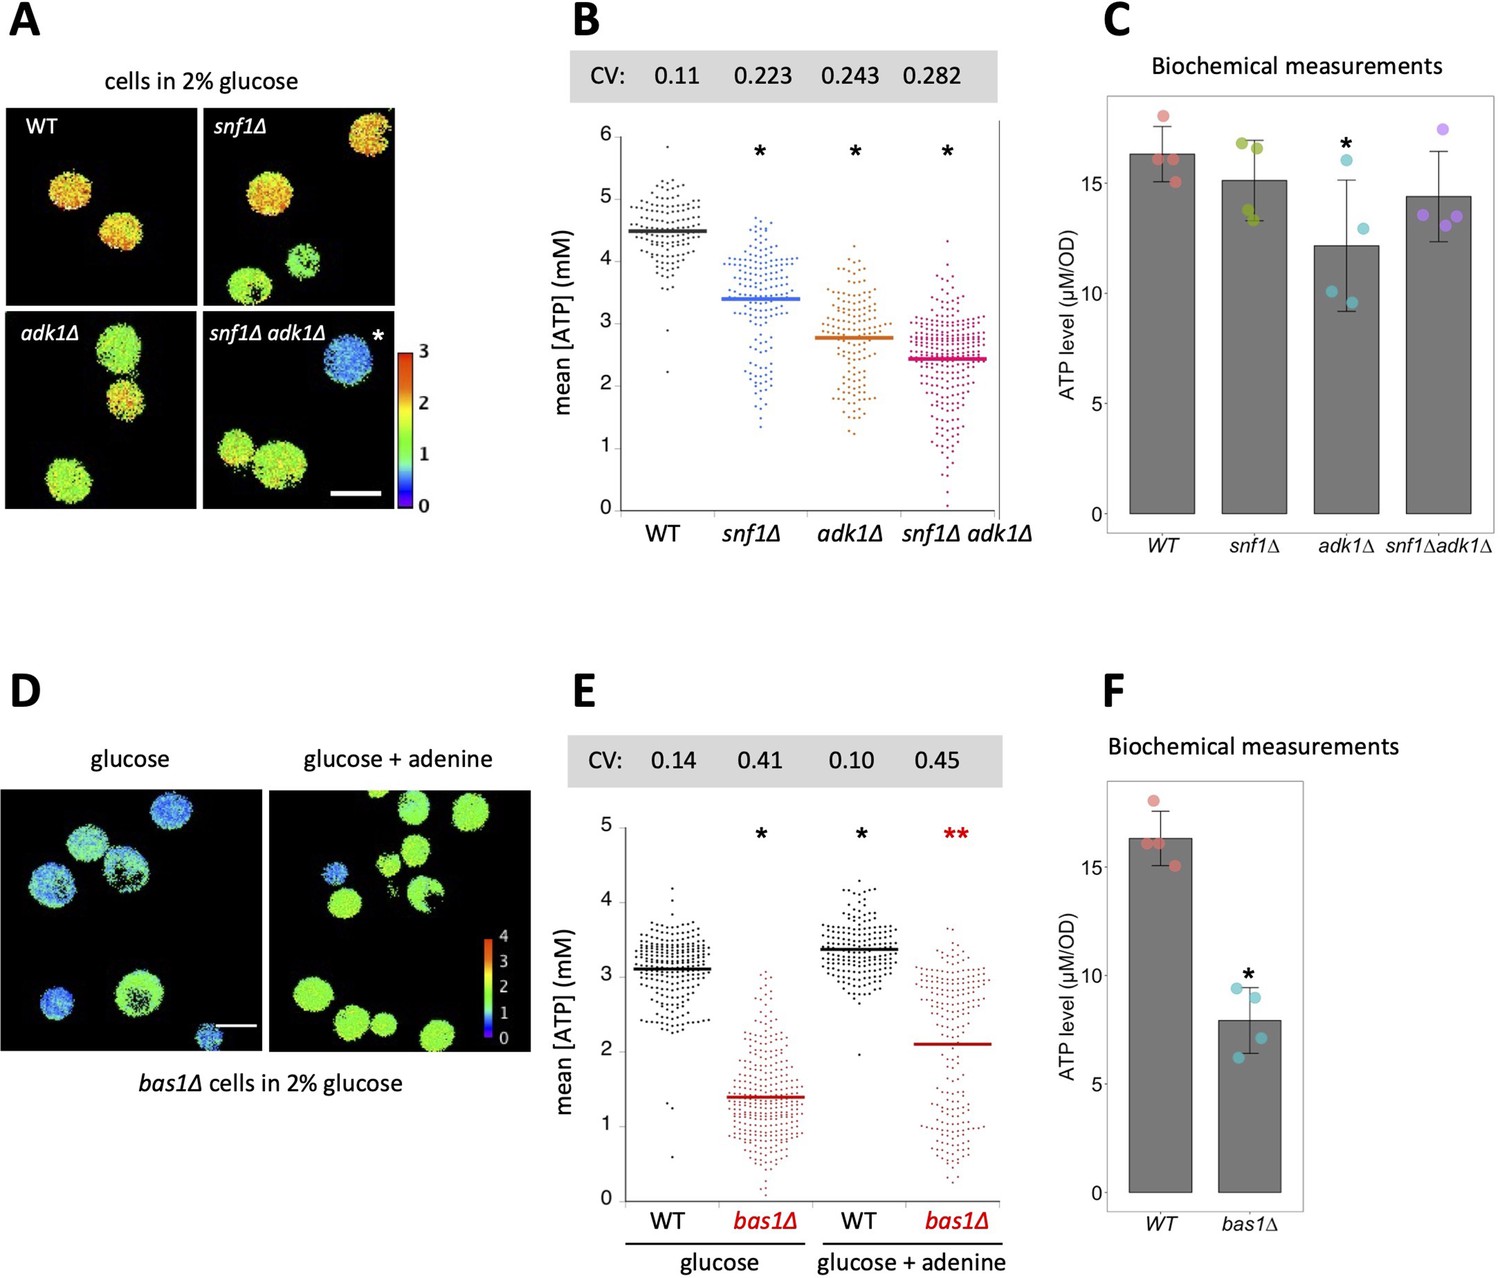
(A) Adk1 and Snf1 synergistically control cellular ATP levels. QUEEN ratio images of ATP homeostasis mutant cells grown in medium containing 2% glucose. The asterisk indicates an example of cells with significantly reduced ATP levels. (B) The mean QUEEN ratios of cells were translated to ATP levels and shown in a dot plot. The horizontal bar indicates the mean of each population. Asterisks indicate p values less than 0.0001 versus WT (Dunnett’s multiple comparison). CV: coefficient of variance. N = 134–276 cells were scored. (C) Biochemical measurements of cellular ATP levels. ATP levels in cells of the indicated genotypes were measured as described in Materials and methods. Data are the mean ± 1SD (error bars) (N = 4). An asterisk indicates a p value of 0.022 versus WT (Dunnett’s multiple comparison). (D) QUEEN ratio images of bas1∆ cells grown in 2% glucose medium. Growth in media supplemented with 0.11 mg/ml adenine partially restored the low ATP phenotype of bas1∆. (E) ATP levels in cells shown in D were plotted. Asterisks indicate p values: *p < 0.0001 (versus WT in glucose, Dunnett’s multiple comparison); **p = 3.6 × 10⁻²⁰ (versus bas1∆ in glucose). N = 186–296 cells were scored. (F) ATP levels in WT and bas1∆ cells were measured as described in C. Data are the mean ± 1SD (error bars) (N = 4). An asterisk indicates a p value of 8.5 × 10⁻⁵ versus WT.
-
Figure 1—source data 1
Raw data for Figure 1.
- https://cdn.elifesciences.org/articles/67659/elife-67659-fig1-data1-v1.xlsx
Figure 1—figure supplement 1
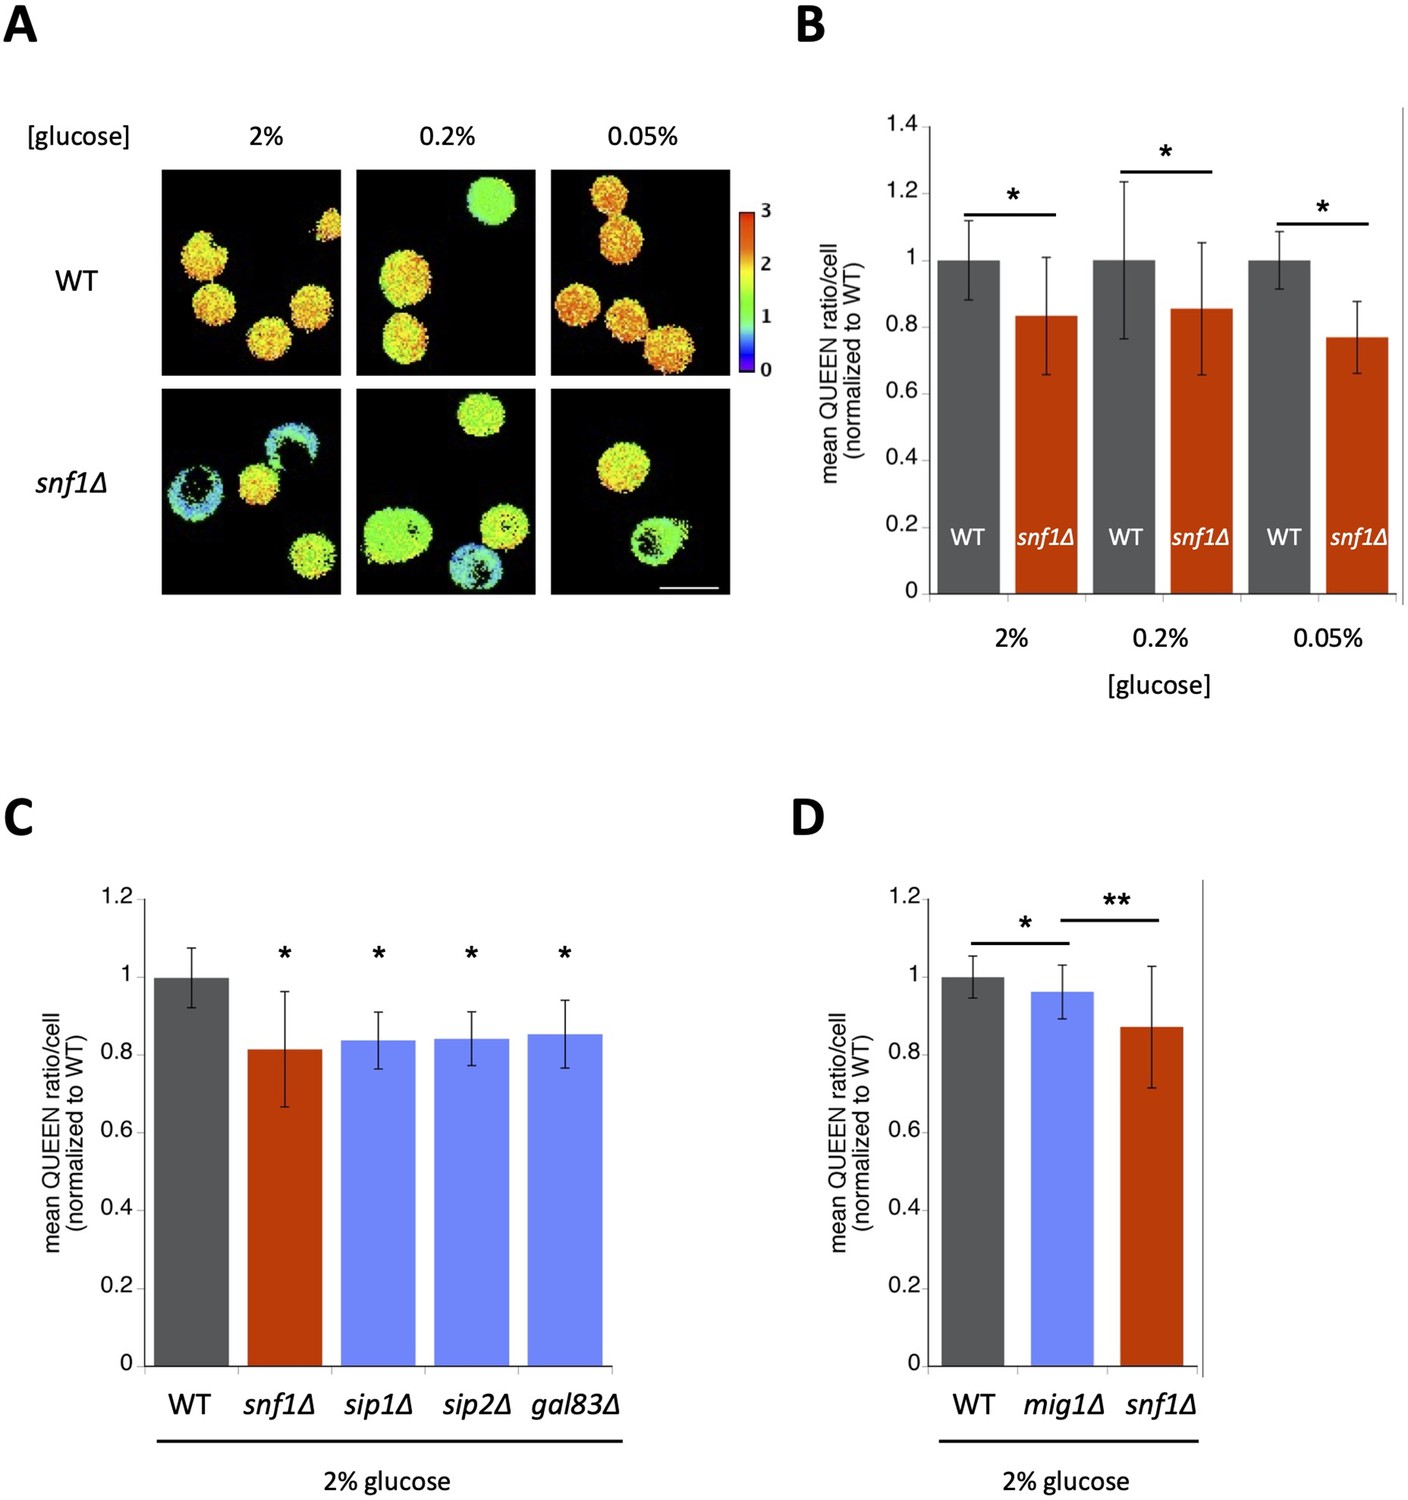
AMP-activated protein kinase (AMPK) is involved in the maintenance of cellular adenosine triphosphate (ATP) levels in nonstarving cells.
(A) Visualization of intracellular ATP levels in wild-type (WT) and snf1∆ cells using the ATP sensor QUEEN. Cells were grown to the mid-log phase in SC-H medium containing the indicated levels of glucose and then imaged. White scale bar = 5 µm. (B) snf1∆ cells had lower ATP levels than wild-type cells. The mean QUEEN ratio inside a single cell (mean QUEEN ratio/cell), which represents the intracellular ATP level of the cell, was quantified for each cell from the ratio image. Data are the mean of the cell population ± 1SD (error bar) normalized to wild-type cells. N = 105–193 cells were scored. Asterisks indicate a significant difference from WT (p < 0.05). (C) ATP levels in single-deletion mutants of AMPK β subunits. Data are the mean of the cell population ± 1SD (error bar) normalized to wild-type cells. N = 177–223 cells were scored. Asterisks indicate a significant difference (p < 0.0001 versus WT, Dunnett’s multiple comparison). (D) mig1∆ cells had slightly lower ATP levels than wild-type cells. Data are the mean of the cell population ± 1SD (error bar) normalized to wild-type cells. N = 190–231 cells were scored. Asterisks indicate p values versus mig1∆: *p = 0.0003; **p < 0.0001, Dunnett’s multiple comparison.
-
Figure 1—figure supplement 1—source data 1
Raw data for Figure 1—figure supplement 1.
- https://cdn.elifesciences.org/articles/67659/elife-67659-fig1-figsupp1-data1-v1.xlsx
Figure 1—figure supplement 2

Adenylate kinase Adk1 is involved in the maintenance of cellular adenosine triphosphate (ATP) levels.
(A) QUEEN ratio images of wild-type and adk1∆ cells grown in 2% glucose or 2% galactose. White scale bar = 5 µm. (B) Quantification of data shown in (A). The mean QUEEN ratio/cell was quantified for each cell from ratio images. Values are the mean of the cell population ± 1SD (error bar). N = 182–236 cells were scored. Asterisks indicate a significant difference from WT (p < 0.05).
-
Figure 1—figure supplement 2—source data 1
Raw data for Figure 1—figure supplement 2.
- https://cdn.elifesciences.org/articles/67659/elife-67659-fig1-figsupp2-data1-v1.xlsx
Figure 1—figure supplement 3
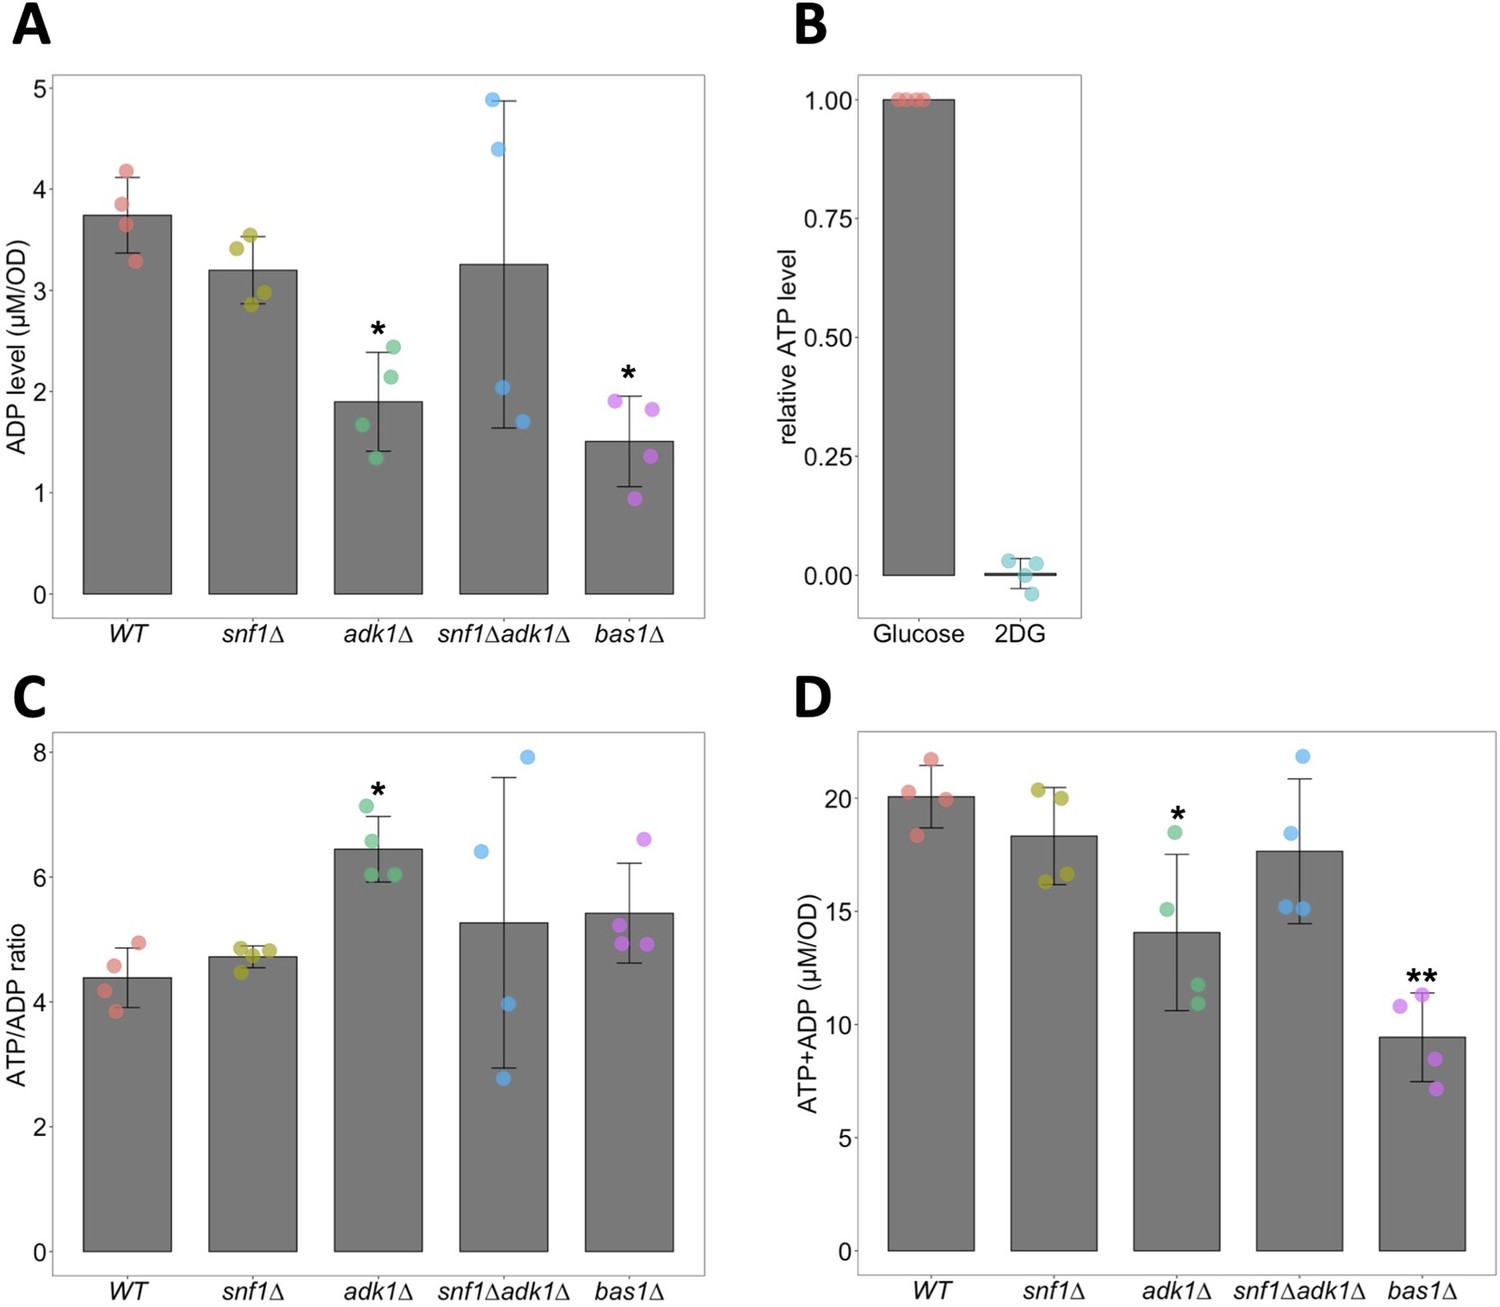
Biochemical measurements of adenosine triphosphate (ATP) and ADP.
(A) Biochemical measurements of cellular ADP levels. ADP levels in cells of the indicated genotypes were measured as described in Materials and methods. Data are the mean ± 1SD (error bars) (N = 4). Asterisks indicate p values less than 0.01 versus WT (Dunnett’s multiple comparison). (B) 2-Deoxyglucose (2DG) depletes cellular ATP. ATP levels in WT cells incubated with medium containing 2% glucose or 40 mM 2DG for 10 min were biochemically measured. Relative ATP levels were expressed as the ratios of ATP levels in glucose-treated cells. Data are the mean ± 1SD (error bars) (N = 4). (C) ATP/ADP ratios in WT and ATP-mutant cells. ATP/ADP ratios were calculated from ATP and ADP levels measured using biochemical assays. Data are the mean ± 1SD (error bars) (N = 4). An asterisk indicates a p value of 0.036 versus WT (Dunnett’s multiple comparison). (D) The sums of ATP and ADP levels in WT and ATP-mutant cells were calculated from ATP and ADP levels measured using biochemical assays. Data are the mean ± 1SD (error bars) (N = 4). Asterisks indicate p values versus WT: *p < 0.01, **p < 0.001, Dunnett’s multiple comparison.
-
Figure 1—figure supplement 3—source data 1
Raw data for Figure 1—figure supplement 3.
- https://cdn.elifesciences.org/articles/67659/elife-67659-fig1-figsupp3-data1-v1.xlsx
Figure 1—figure supplement 4
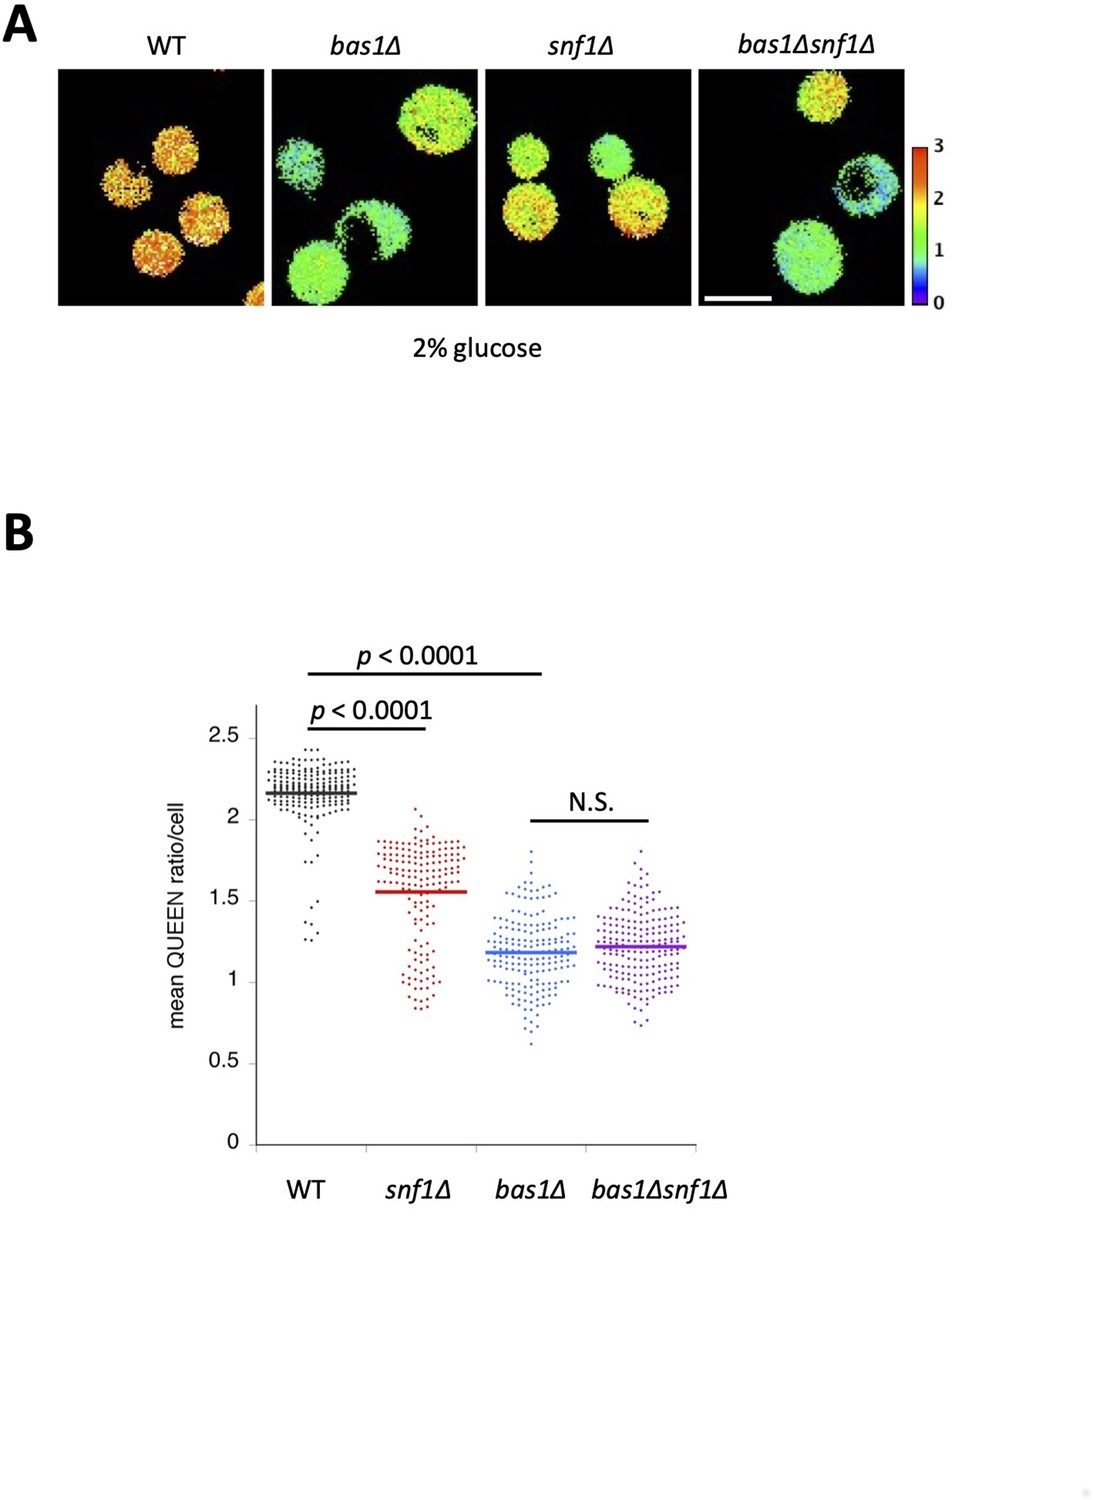
Adenosine triphosphate (ATP) levels in bas1∆ snf1∆ cells.
(A) QUEEN ratio images of wild-type, bas1∆, snf1∆, and bas1∆ snf1∆ cells. (B) Quantification of data shown in (A). The mean QUEEN ratio/cell was quantified for each cell from ratio images. Data are shown as a dot plot. The horizontal bar in the plot indicates the mean of each population. Significance between two sets of data was tested using the Dunnett’s multiple comparison test and indicated by p values. N.S., no significance (p value >0.3).
-
Figure 1—figure supplement 4—source data 1
Raw data for Figure 1—figure supplement 4.
- https://cdn.elifesciences.org/articles/67659/elife-67659-fig1-figsupp4-data1-v1.xlsx
Figure 2 with 7 supplements
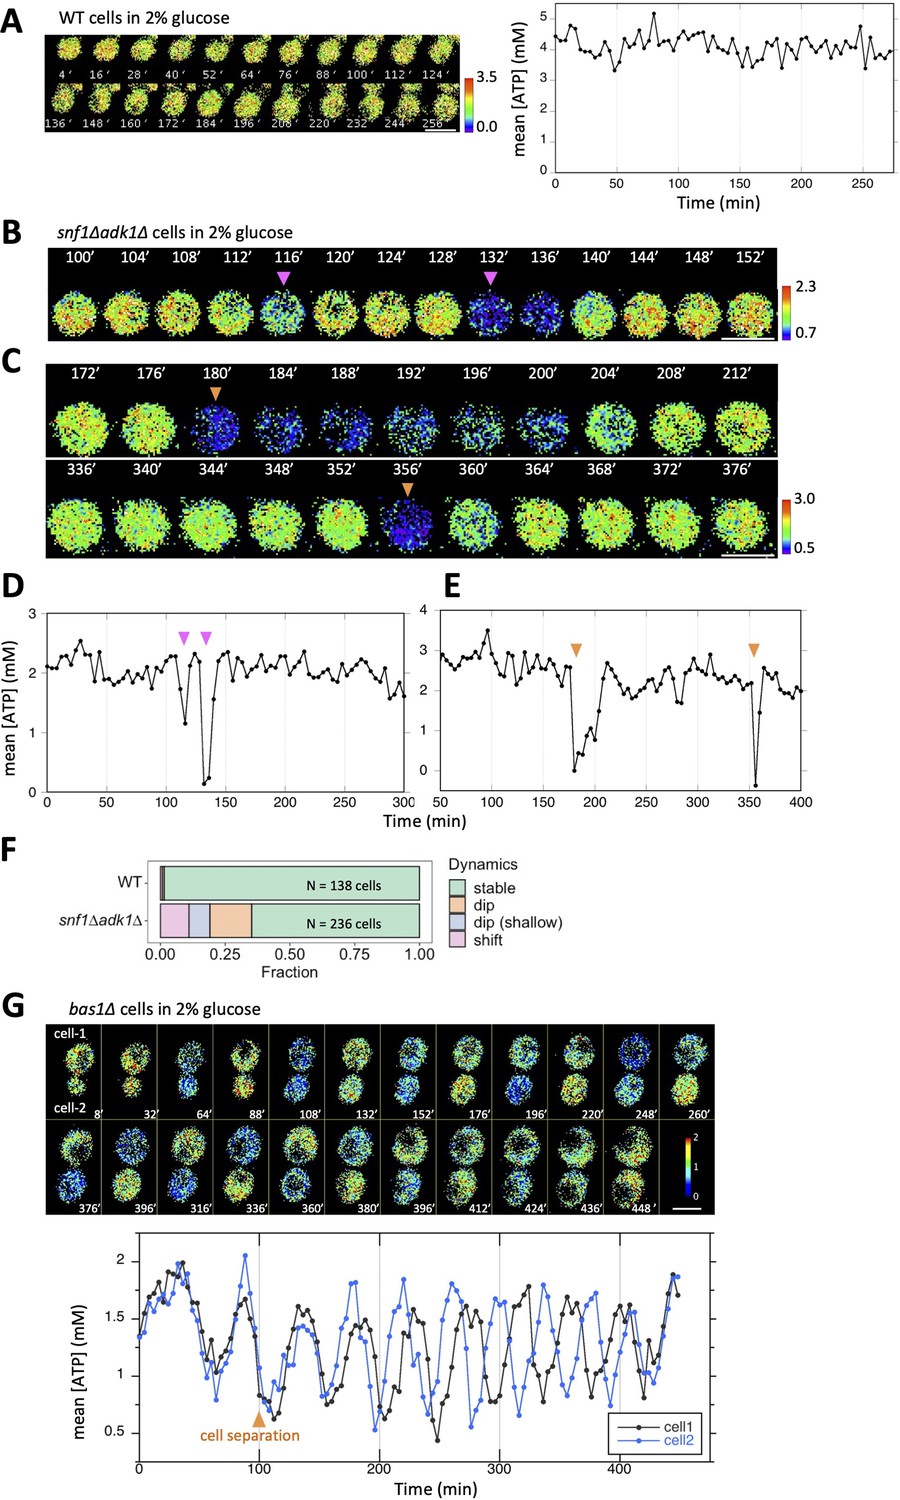
Temporal fluctuations in adenosine triphosphate (ATP) levels in snf1∆ adk1∆ and bas1∆ cells.
(A) Time-lapse imaging of QUEEN in wild-type cells cultured in 2% glucose medium. QUEEN ratios were converted into intracellular ATP levels in cells and plotted (right panel). (B, D) Time-lapse imaging of QUEEN in snf1∆ adk1∆ cells. Images at the representative time points were shown. The QUEEN ratio decreased twice (indicated by arrowheads) within a short interval. See also Figure 2—video 1. Data were converted into ATP levels and plotted in (D). (C, E) Another example of the time-lapse imaging of QUEEN in snf1∆ adk1∆ cells in 2% glucose medium. The QUEEN ratio decreased twice (indicated by arrowheads) with a long interval (a rare event). See also Figure 2—video 2. Data were converted into ATP levels and plotted in (E). (F) Some snf1∆ adk1∆ cells showed unstable ATP levels. Wild-type and snf1∆ adk1∆ cells were classified and scored according to the indicated ATP dynamics. Data were pooled from three independent experiments for each strain. (G) Time-lapse imaging of QUEEN in bas1∆ in 2% glucose medium. ATP levels in the mother (cell-1) and daughter (cell-2) were plotted at the bottom. Images at the representative time points were shown on the top. Note that the QUEEN ratio is synchronized until cells undergo separation at the time point of 76 min indicated by an arrow. After separation, each cell has a unique periodic cycle of ATP. The movie is available in Figure 2—video 3. White scale bar = 5 µm.
-
Figure 2—source data 1
Raw data for Figure 2.
- https://cdn.elifesciences.org/articles/67659/elife-67659-fig2-data1-v1.xlsx
Figure 2—figure supplement 1
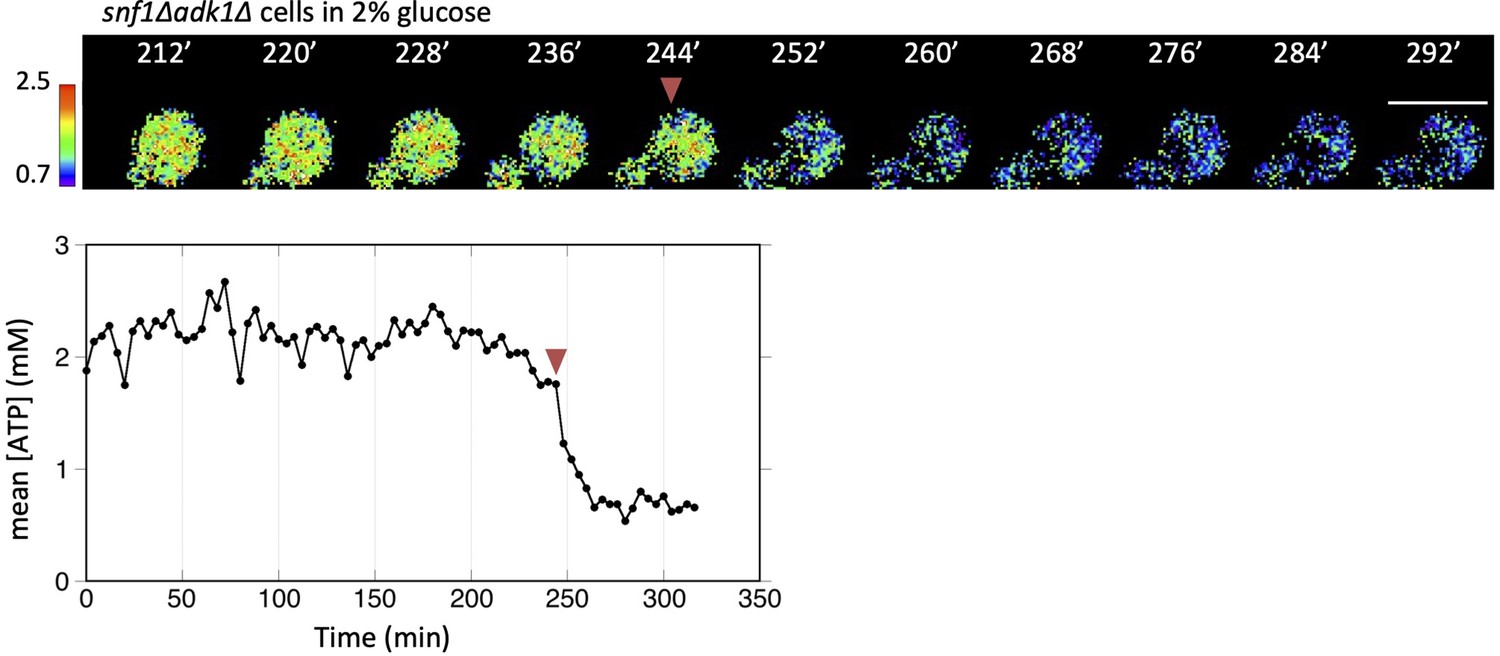
Time-lapse imaging of QUEEN in an snf1∆ adk1∆ cell showing the adenosine triphosphate (ATP) shift.
Time-lapse imaging of QUEEN in snf1∆ adk1∆ cells in 2% glucose medium. An example of a snf1∆ adk1∆ cell showing the ATP shift, an irreversible decrease in the QUEEN ratio (indicated by an arrowhead). Images at the representative time points were shown. The ATP level was plotted at the bottom. White scale bar = 5 µm.
-
Figure 2—figure supplement 1—source data 1
Raw data for Figure 2—figure supplement 1.
- https://cdn.elifesciences.org/articles/67659/elife-67659-fig2-figsupp1-data1-v1.xlsx
Figure 2—figure supplement 2
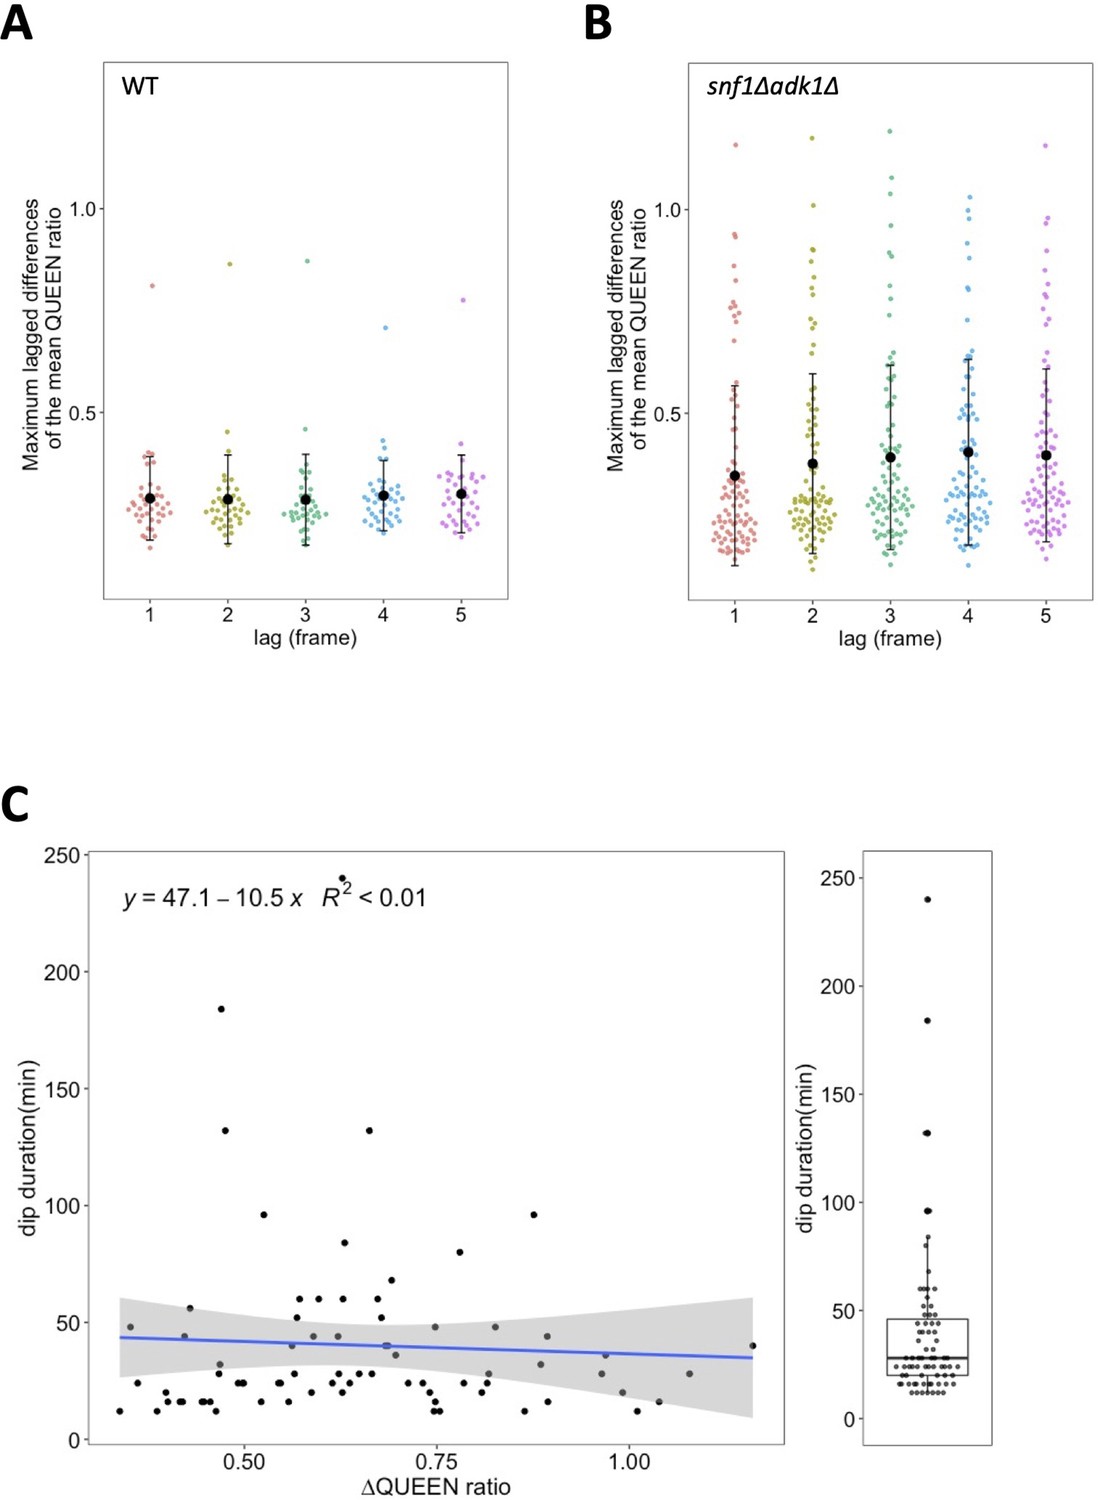
Temporal fluctuations in the QUEEN ratio in wild-type and snf1∆ adk1∆ cells.
(A, B) Maximum lagged differences in the mean QUEEN ratio in a cell in single time-course data were plotted versus the lag. Time course data from 39 wild-type (A) cells and 88 snf1∆ adk1∆ (B) cells were used for calculations. Black dots and whiskers indicate the mean ± 1SD. See Materials and methods for more details about the calculation. (C) Scatter plot between the maximum amounts of decreases in the QUEEN ratio during the adenosine triphosphate (ATP) dip and the dip duration (N = 75). A blue line and gray shaded area indicate the linear regression line and the 95% confidence interval, respectively. Dip durations were also box plotted in the right.
-
Figure 2—figure supplement 2—source data 1
Raw data for Figure 2—figure supplement 2.
- https://cdn.elifesciences.org/articles/67659/elife-67659-fig2-figsupp2-data1-v1.xlsx
Figure 2—figure supplement 3
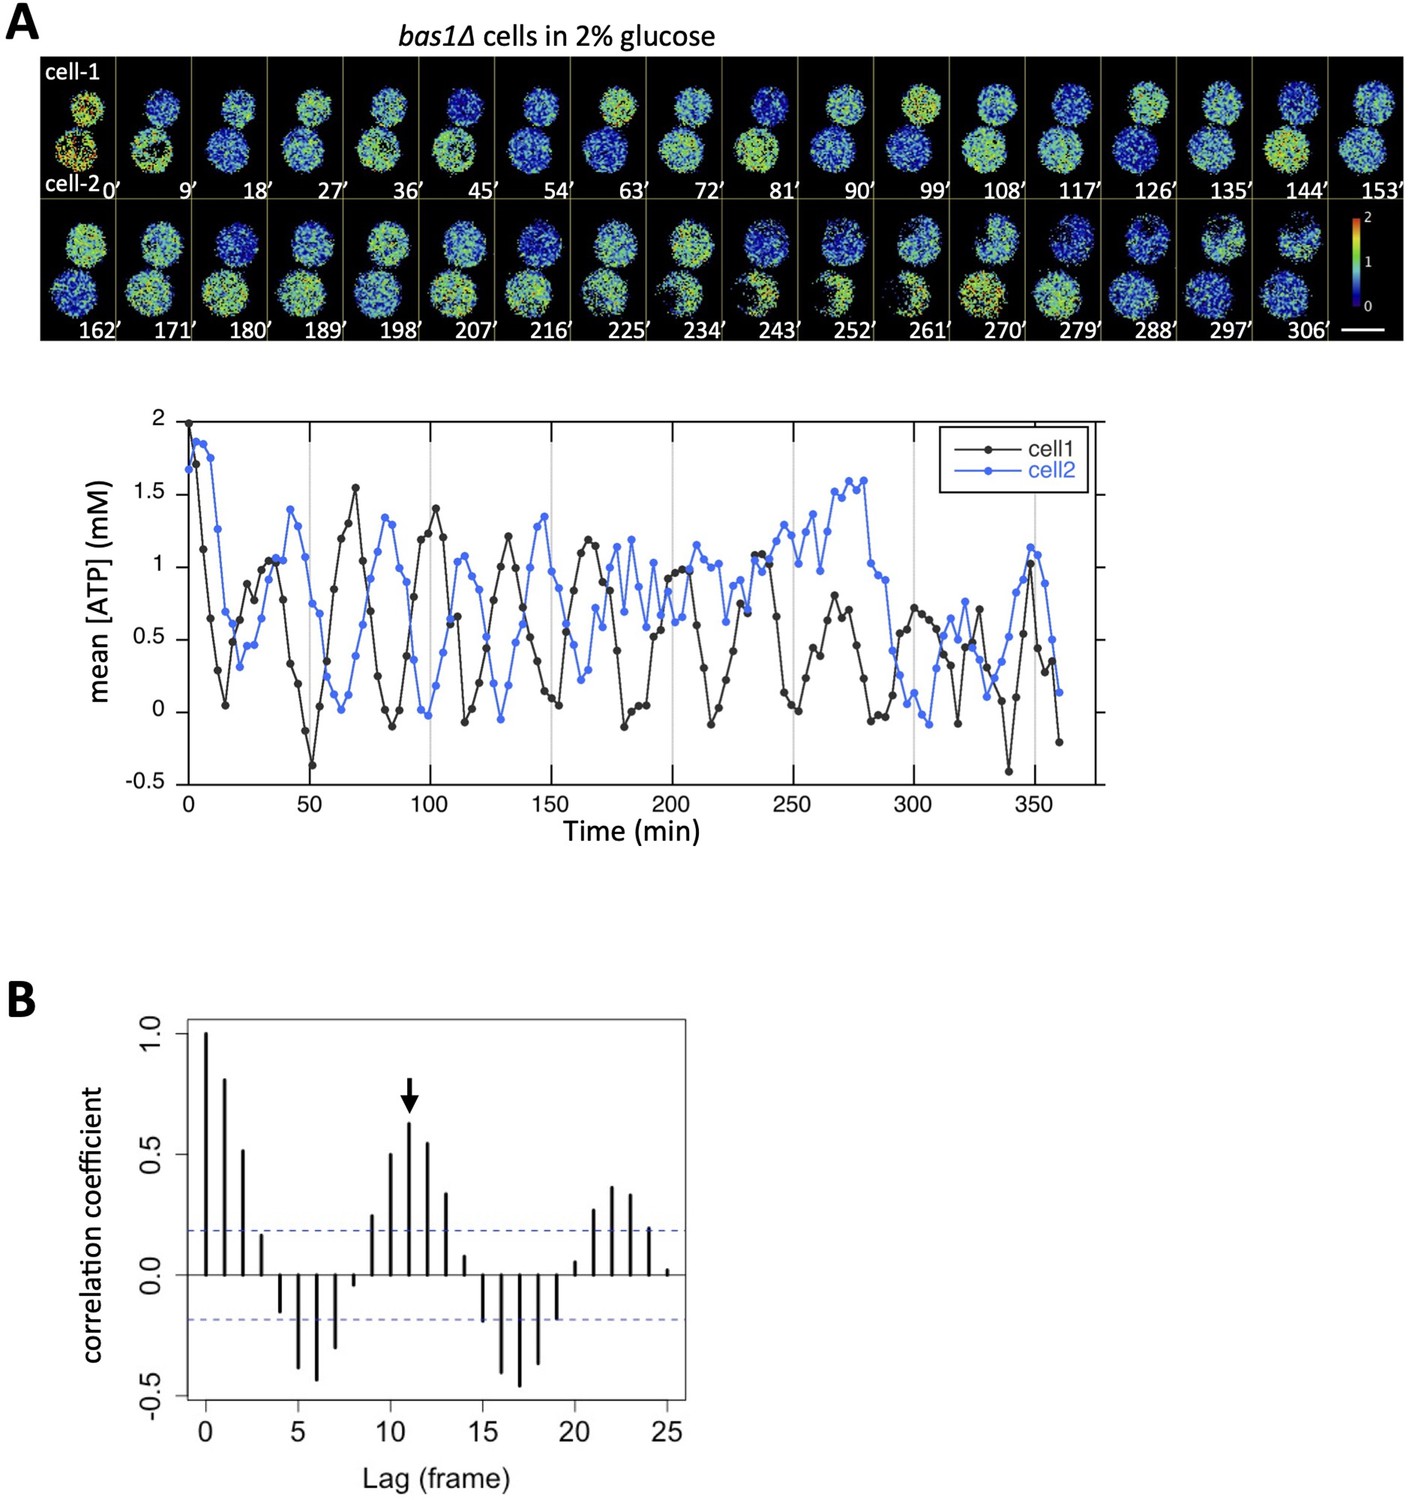
Oscillatory behavior of the adenosine triphosphate (ATP) level visualized in bas1∆ cells.
(A) Another example of bas1∆ cells showing an oscillating QUEEN ratio. In this case, cytokinesis had just been completed at t = 0 min. ATP levels in cell-1 and cell-2 were plotted at the bottom. See also Figure 2—video 4. White scale bar = 5 µm. (B) Autocorrelation function of the QUEEN ratio calculated from the data on cell-1 in Figure 2G. Blue dotted lines indicate the 95% confidence interval. An arrow indicates the second peak of the correlation and corresponds to the apparent period.
-
Figure 2—figure supplement 3—source data 1
Raw data for Figure 2—figure supplement 3.
- https://cdn.elifesciences.org/articles/67659/elife-67659-fig2-figsupp3-data1-v1.xlsx
Figure 2—video 1
Time-lapse imaging of QUEEN in snf1∆ adk1∆ cells in 2% glucose medium.
Corresponding to the data shown in Figure 2B. The QUEEN ratio decreased twice (116 and 132 min) within a short interval. White scale bar = 5 µm.
Figure 2—video 2
Another example of snf1∆ adk1∆ cells showing a sudden decrease in the QUEEN ratio.
Corresponding to the data shown in Figure 2C. The QUEEN ratio decreased twice (180 and 356 min) with a long interval. White scale bar = 5 µm.
Figure 2—video 3
Oscillatory behavior of the QUEEN ratio in bas1∆ cells.
Corresponding to the data shown in Figure 2G. Left, the QUEEN ratio image; middle, Myo1-mCherry (inverted grayscale image); right, bright-field image. Images were taken every 4 min. White scale bar = 5 µm.
Figure 2—video 4
Another example of bas1∆ cells showing an oscillating QUEEN ratio.
Corresponding to the data shown in Figure 2—figure supplement 3A. Left, the QUEEN ratio image; right, bright-field image. In this case, cytokinesis had already been completed at t = 0 min. Images were taken every 3 min. White scale bar = 5 µm.
Figure 3 with 1 supplement
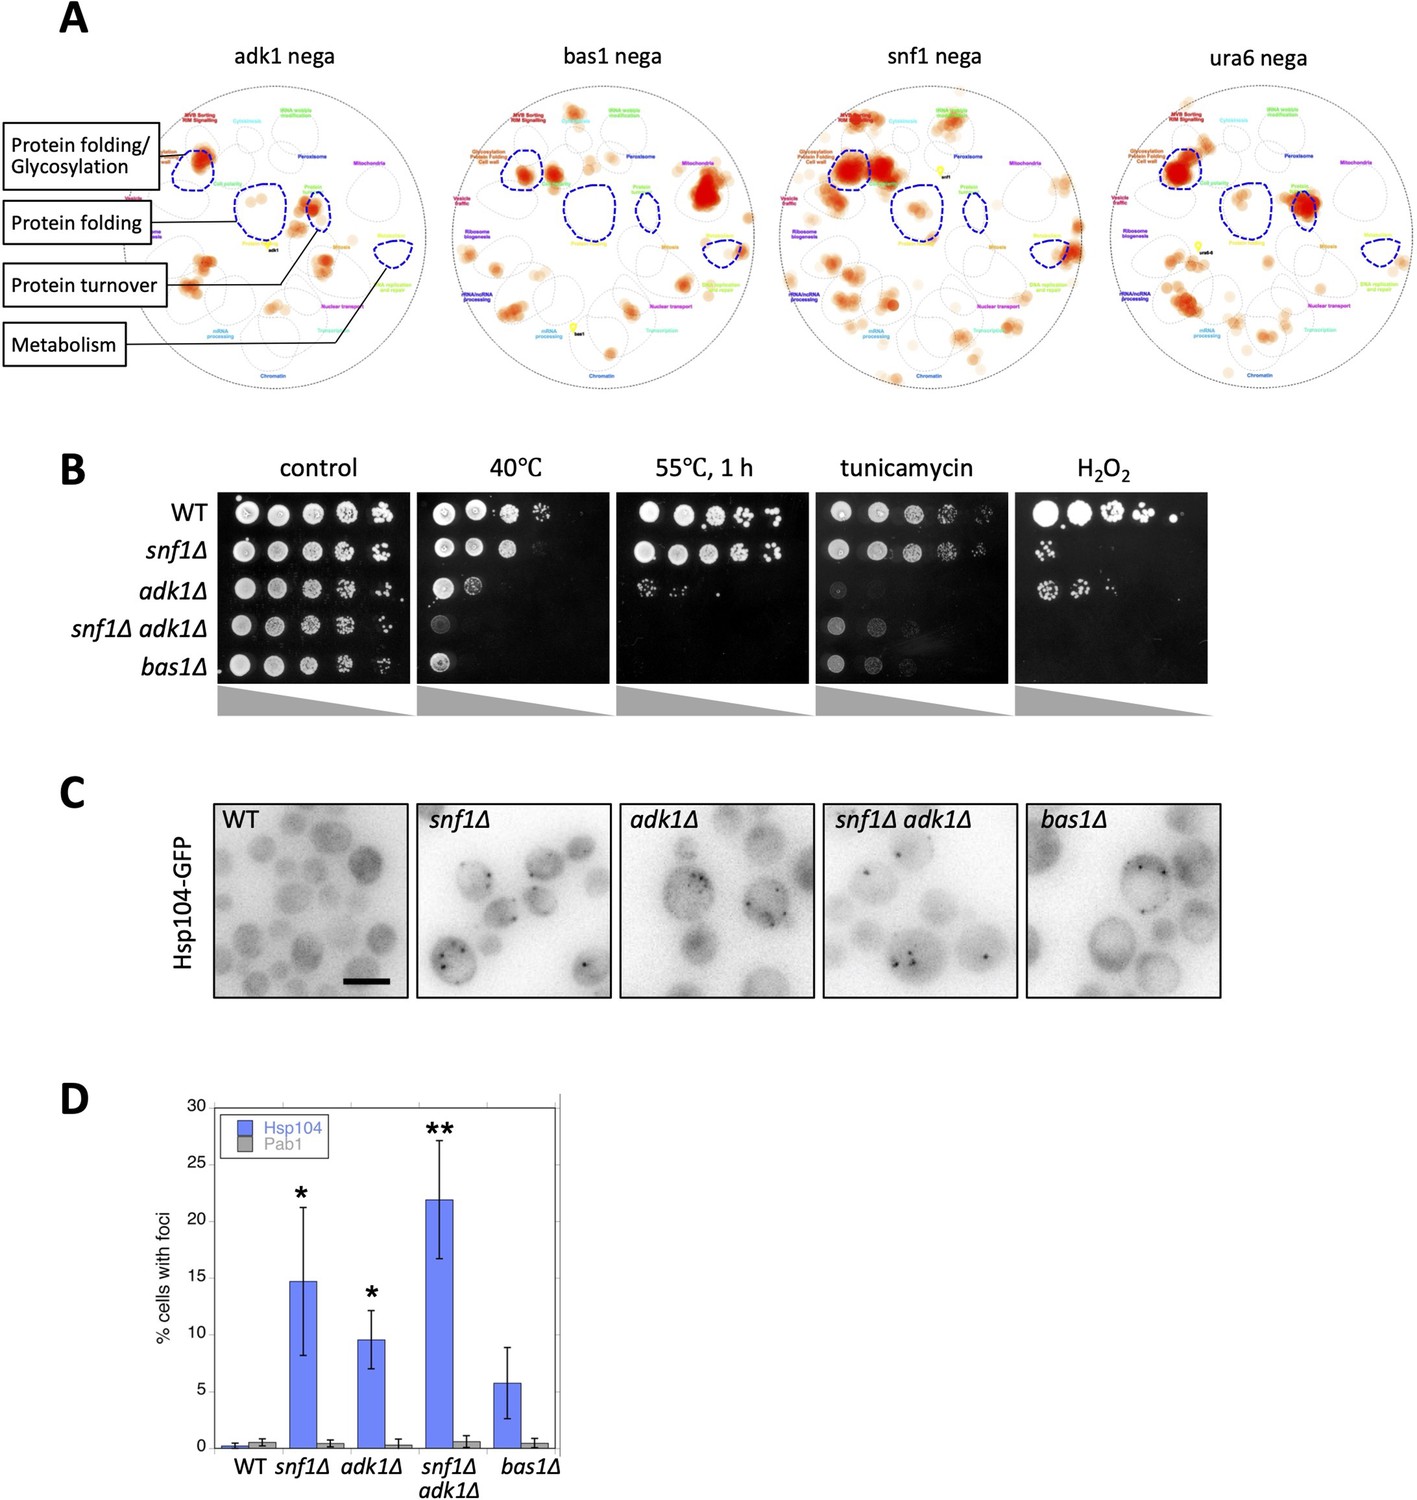
Adenosine triphosphate (ATP) homeostasis is required to prevent protein aggregation.
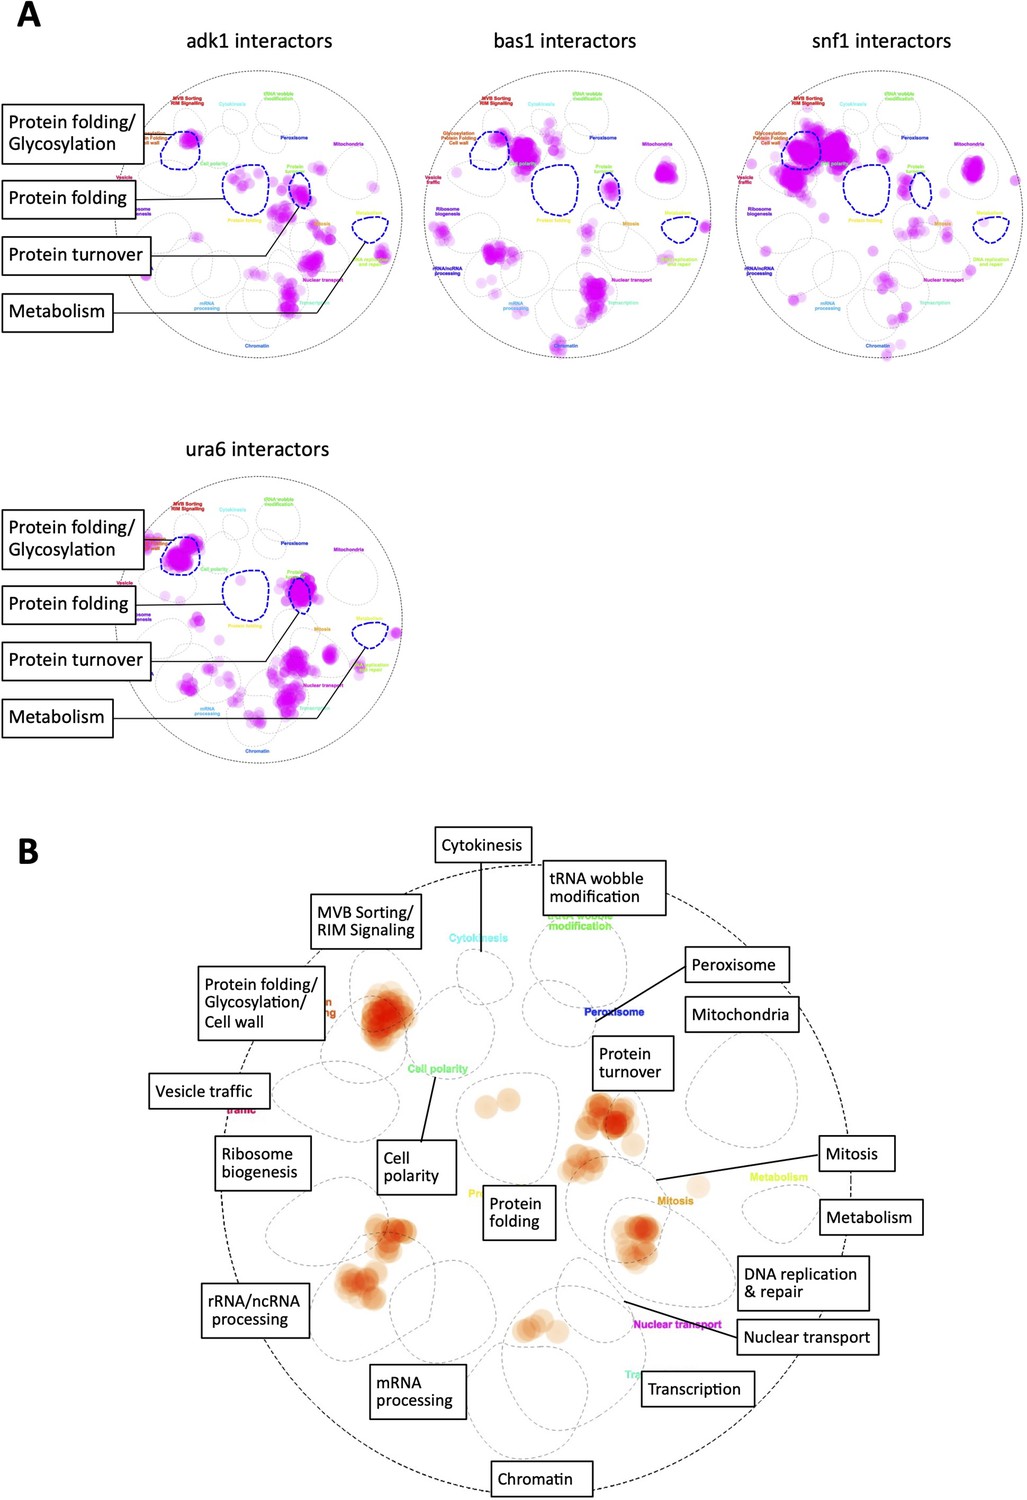
(A) Functional landscape of known interactors of ATP mutants. Negative genetic interactors of the indicated gene were derived from the SGD database (https://www.yeastgenome.org/; Cherry et al., 2012) and overlaid on a functional map based on the global genetic interaction network of the yeast genome (Baryshnikova, 2016; Usaj et al., 2017). URA6 encodes an uridylate kinase that is essential for viability, which also exhibits adenylate kinase activity. Regarding information on all the categories of functions, refer to Figure 3—figure supplement 1B. (B) Each strain of the indicated genotype was serially diluted (fivefold), spotted on SC + 2% glucose medium, and grown under the indicated stress conditions. Photos were taken after 2–3 days. (C) Formation of Hsp104-GFP foci in ATP homeostasis mutants. The GFP signal (inverted grayscale) was imaged in the log-phase culture of the indicated mutant cells expressing Hsp104-GFP at 35°C. (D) Quantification of data shown in (C). Data from similar experiments using strains expressing Pab1-GFP, instead of Hsp104-GFP, were also plotted. Values are the mean ± 1SD (error bars) (N = 4). Asterisks indicate a significant difference from WT: *p < 0.05; **p < 0.001, Dunnett’s multiple comparison. White scale bar = 5 µm.
-
Figure 3—source data 1
Raw data for Figure 3.
- https://cdn.elifesciences.org/articles/67659/elife-67659-fig3-data1-v1.xlsx
Figure 3—figure supplement 1
In silico analysis of interactors of adenosine triphosphate (ATP) mutants.
(A) Genetic and physical interactors of the indicated genes were derived from the SGD database (https://www.yeastgenome.org/; Cherry et al., 2012) and overlaid on a functional map based on the global genetic interaction network of the yeast genome (Baryshnikova, 2016; Usaj et al., 2017). URA6 encodes an uridylate kinase essential for viability, which also exhibits adenylate kinase activity. (B) A magnified version of the functional map of ADK1 shown in Figure 3A. All the categories of functions are labeled for reference.
Figure 4 with 1 supplement
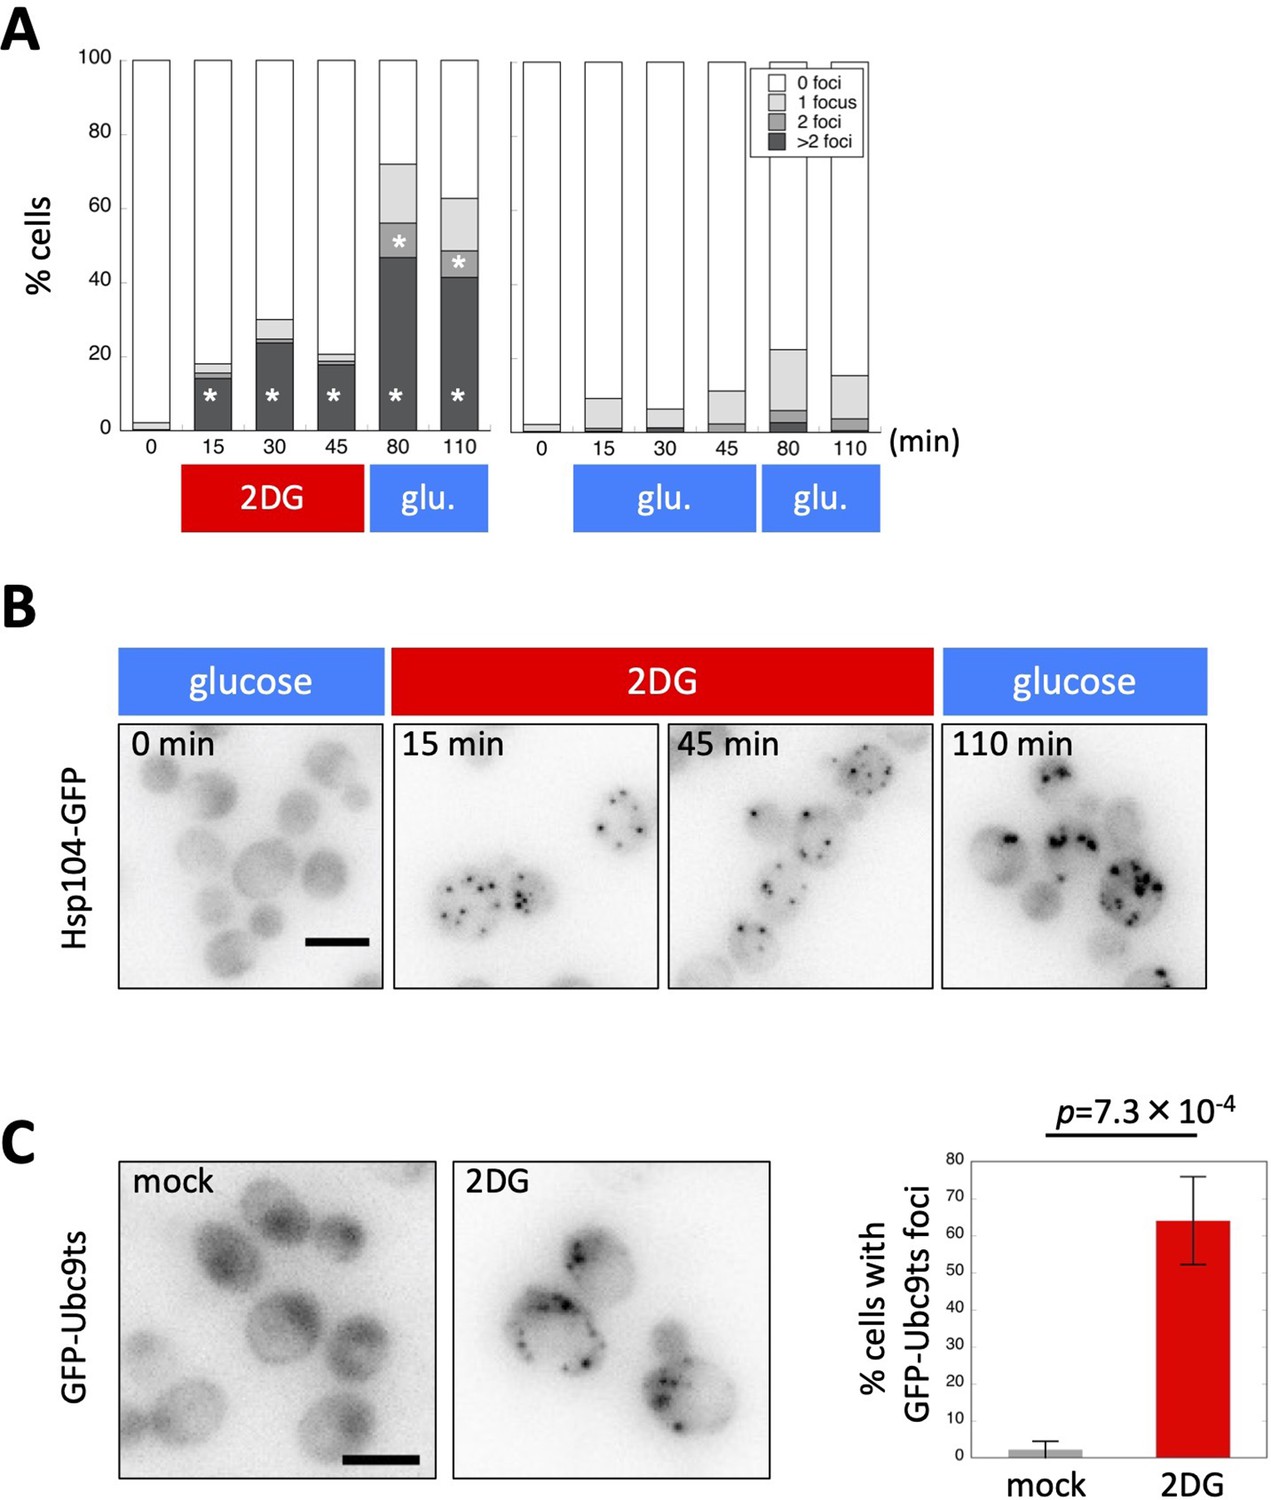
Adenosine triphosphate (ATP) depletion triggers protein aggregation in living yeast cells.
(A) The formation of Hsp104-GFP foci after ATP depletion. Wild-type cells expressing Hsp104-GFP were grown to the log phase at 35°C in medium containing 2% glucose. At the time point of 0 min, medium was replaced with 20 mM 2-deoxyglucose (2DG; red) or 2% glucose (as a control; blue). Cells were released back to media containing 2% glucose at the time point of 50 min. Cells were imaged at the indicated time points, classified, and scored according to the number of Hsp104-GFP foci. Values are the mean (N = 3). Asterisks indicate a significant difference from the 2% glucose treatment (p < 0.05). (B) Representative images of cells analyzed in (A). (C) Formation of Ubc9-ts foci after ATP depletion. Cells expressing GFP-Ubc9-ts under an inducible GAL promoter were grown in medium containing 2% galactose (SC-gal) at 33°C, and medium was then exchanged with 2DG or SC-gal. After 30 min, cells were imaged and scored for the number of GFP-Ubc9-ts foci. Representative images (inverted grayscale) are shown on the left and summarized on the right. Values are the mean ± 1SD (error bars) (N = 4). White scale bar = 5 µm.
-
Figure 4—source data 1
Raw data for Figure 4.
- https://cdn.elifesciences.org/articles/67659/elife-67659-fig4-data1-v1.xlsx
Figure 4—figure supplement 1

Simultaneous observation of Hsp104 and Pab1 foci wild-type cells expressing Hsp104-GFP and Pab1-RedStar2 were grown to the log phase at 37°C in medium containing 2% glucose.
Cells were washed and released either in medium containing 20 mM 2-deoxyglucose (2DG; top) or in medium lacking glucose (bottom), and then imaged after 30 and 60 min. White scale bar = 5 µm.
Figure 5 with 1 supplement
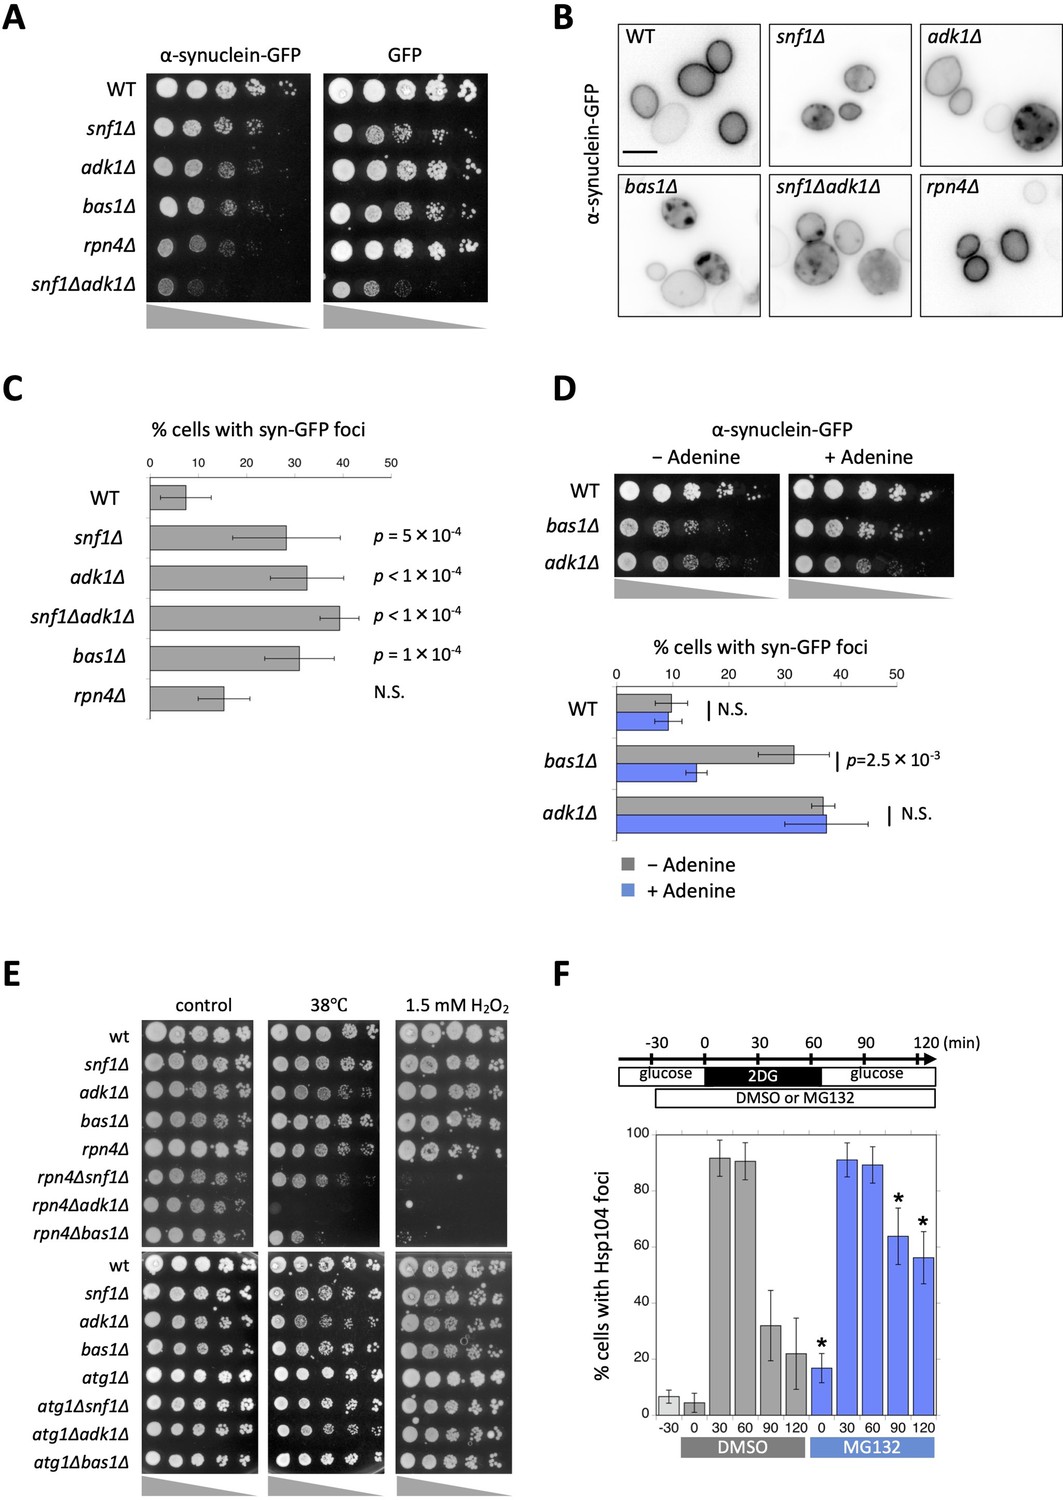
Aggregation and cytotoxicity of α-synuclein depend on adenosine triphosphate (ATP) homeostasis.
(A) Each strain of the indicated genotype was transformed with an expression vector carrying α-synuclein-GFP or GFP, serially diluted (fivefold), spotted on SC + 2% galactose plates, and then grown at 30°C for 3 days. (B) The localization of α-synuclein-GFP in ATP mutants. Cells were grown on galactose plates at 30°C for more than 42 hr and then imaged. Representative images of α-synuclein-GFP (inverted grayscale) are shown. (C) Quantification of the data shown in (B). Cells were classified and scored for the localization pattern of α-synuclein-GFP. The percentage of cells showing α-synuclein-GFP foci are plotted. Data are the mean ± 1SD (error bars) from three to six independent observations. N = 33–380 cells were scored in each measurement. p values versus WT are shown (Dunnett’s multiple comparison). N.S., no significance (p value >0.05). (D) (Top) Each strain of the indicated genotype was transformed with an expression vector carrying α-synuclein-GFP and grown on galactose plates containing 0 mM (−Adenine) or 0.3 mM (+Adenine) adenine at 30°C for 3 days. (Bottom) Cells were grown on galactose plates in the absence or presence of adenine at 30°C for 41–45 hr and then imaged. The percentage of cells showing α-synuclein-GFP foci was plotted. Data are the mean ± 1SD (error bars) from five independent transformants. N = 53–258 cells were scored in each measurement. Statistical significance was tested using the unpaired two-tailed Welch’s t-test. p values versus ‘−Adenine’ are shown. (E) Each strain of the indicated genotype was serially diluted (fivefold), spotted on SC + 2% glucose medium, and grown under the indicated stress conditions. (F) Cells of the drug-sensitive strain Y13206 were grown to the log phase at 37°C in medium containing 2% glucose and supplemented with 0.1% dimethylsulfoxide (DMSO) or 0.1% DMSO plus 42 µM MG132 at t = −30 min. At t = 0 min, these cells were washed and released in medium containing 20 mM 2-deoxyglucose (2DG) ± MG132, and cells were then washed and released again in medium containing 2% glucose ± MG132. Cells were imaged at the indicated time points and scored for the number of Hsp104-GFP foci. Data are the mean ± 1SD (error bars). Asterisks indicate a significant difference from DMSO (p < 0.02) (N = 3).
-
Figure 5—source data 1
Raw data for Figure 5.
- https://cdn.elifesciences.org/articles/67659/elife-67659-fig5-data1-v1.xlsx
Figure 5—figure supplement 1
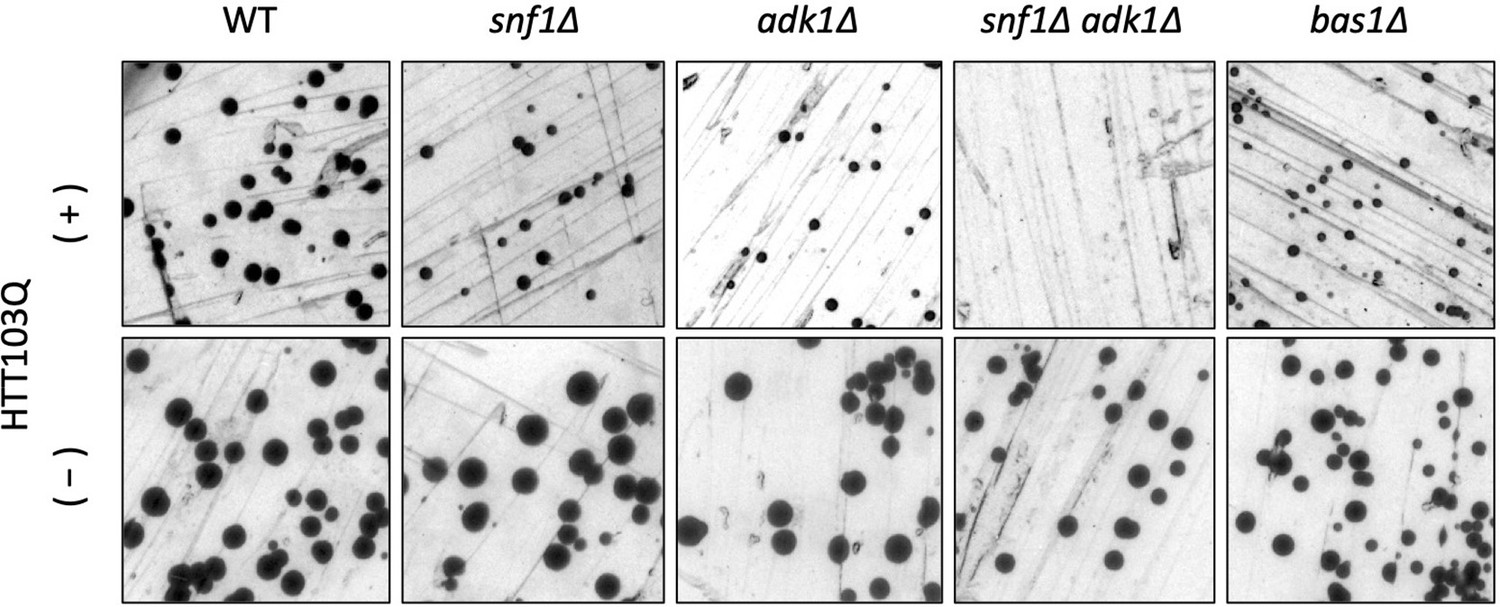
Cytotoxicity of polyQ containing the huntingtin protein in wild-type and adenosine triphosphate (ATP)-mutant yeast cells.
Each strain of the indicated genotype was transformed with an expression vector carrying Htt103Q and grown on glucose ((−), no induction) or raffinose ((+), leaky expression) plates at 30°C for 3 days.
Figure 6 with 2 supplements
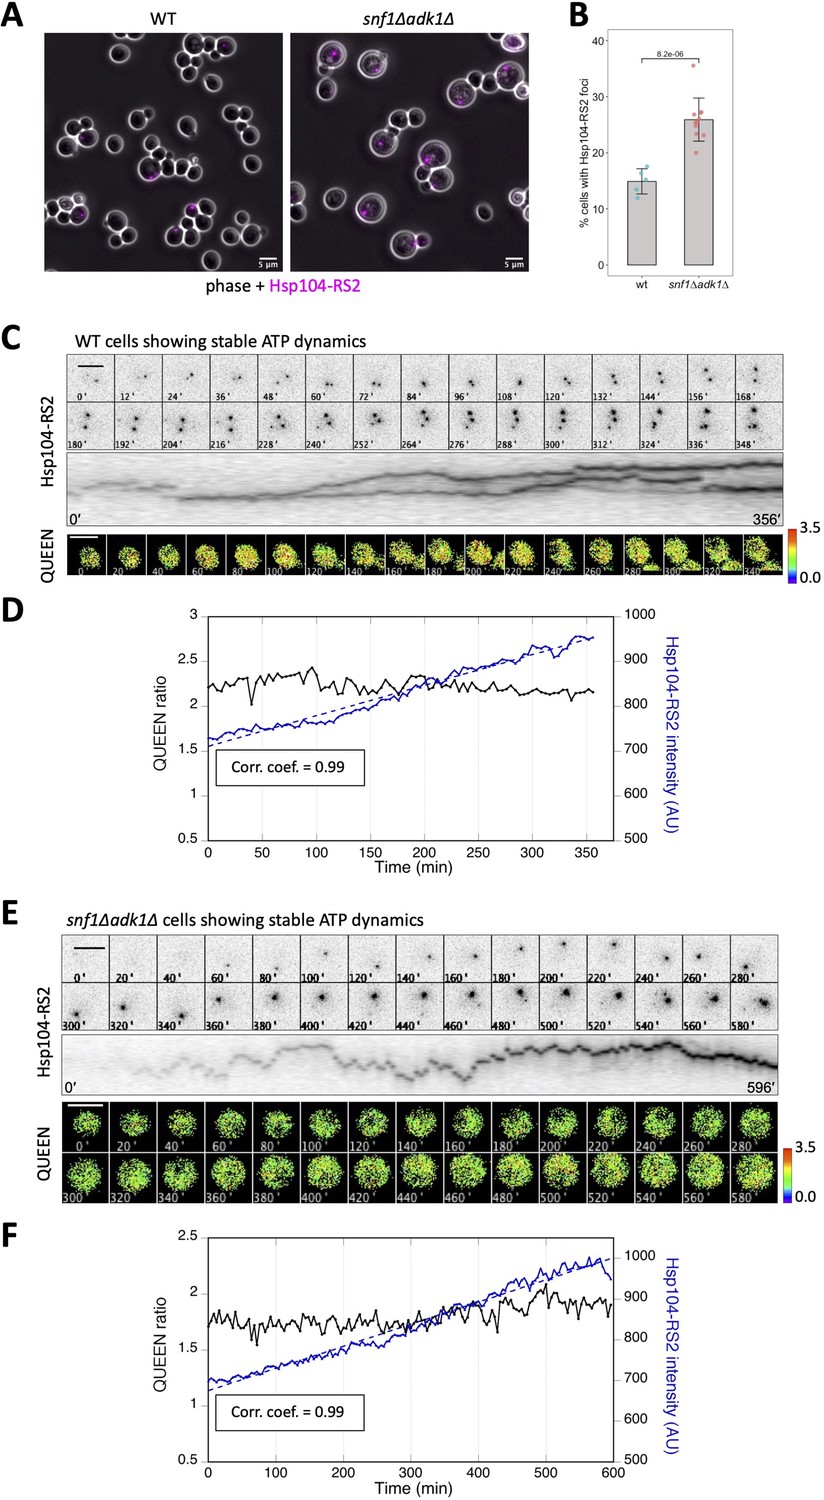
The intracellular fluorescence intensity of Hsp104-RS2 increased linearly and slowly in cells showing stable adenosine triphosphate (ATP) dynamics.
(A) Formation of Hsp104-RS2 foci in wild-type and snf1∆ adk1∆ cells. The RFP signal (magenta) was imaged in log-phase cells grown at 25°C in medium containing 2% glucose. (B) Fraction of cells showing Hsp104-RS2 foci. The percentages of cells with Hsp104-RS2 foci per one field of view (containing 70–342 cells) were plotted. Bars and error bars indicate the mean ± 1SD. The significance of differences was tested using the unpaired two-tailed Welch’s t-test and indicated by the p value. (C) Time-lapse imaging of QUEEN and Hsp104-RS2 in a wild-type cell. (Top) Images of the Hsp104-RS2 signal (inverted grayscale) in the cell at the indicated time points are shown. (Middle) Kymograph of the images shown in the top panel. (Bottom) QUEEN ratio images of the cell. (D) The mean QUEEN ratio and the mean fluorescence intensities of Hsp104-RS2 inside the cell were plotted over time. The dotted line indicates the best linear regression of Hsp104-RS2 intensities with a correlation coefficient of 0.99. (E) Time-lapse imaging of QUEEN and Hsp104-RS2 in an snf1∆ adk1∆ cell showing stable ATP dynamics. (Top) Images of the Hsp104-RS2 signal (inverted grayscale) in the cell at the indicated time points are shown. (Middle) Kymograph of the images shown in the top panel. (Bottom) QUEEN ratio images. (F) The mean QUEEN ratio and the mean fluorescence intensities of Hsp104-RS2 inside the cell were plotted over time. The dotted line indicates the best linear regression of Hsp104-RS2 intensities with a correlation coefficient of 0.99. Scale bar = 5 µm.
-
Figure 6—source data 1
Raw data for Figure 6.
- https://cdn.elifesciences.org/articles/67659/elife-67659-fig6-data1-v1.xlsx
Figure 6—figure supplement 1
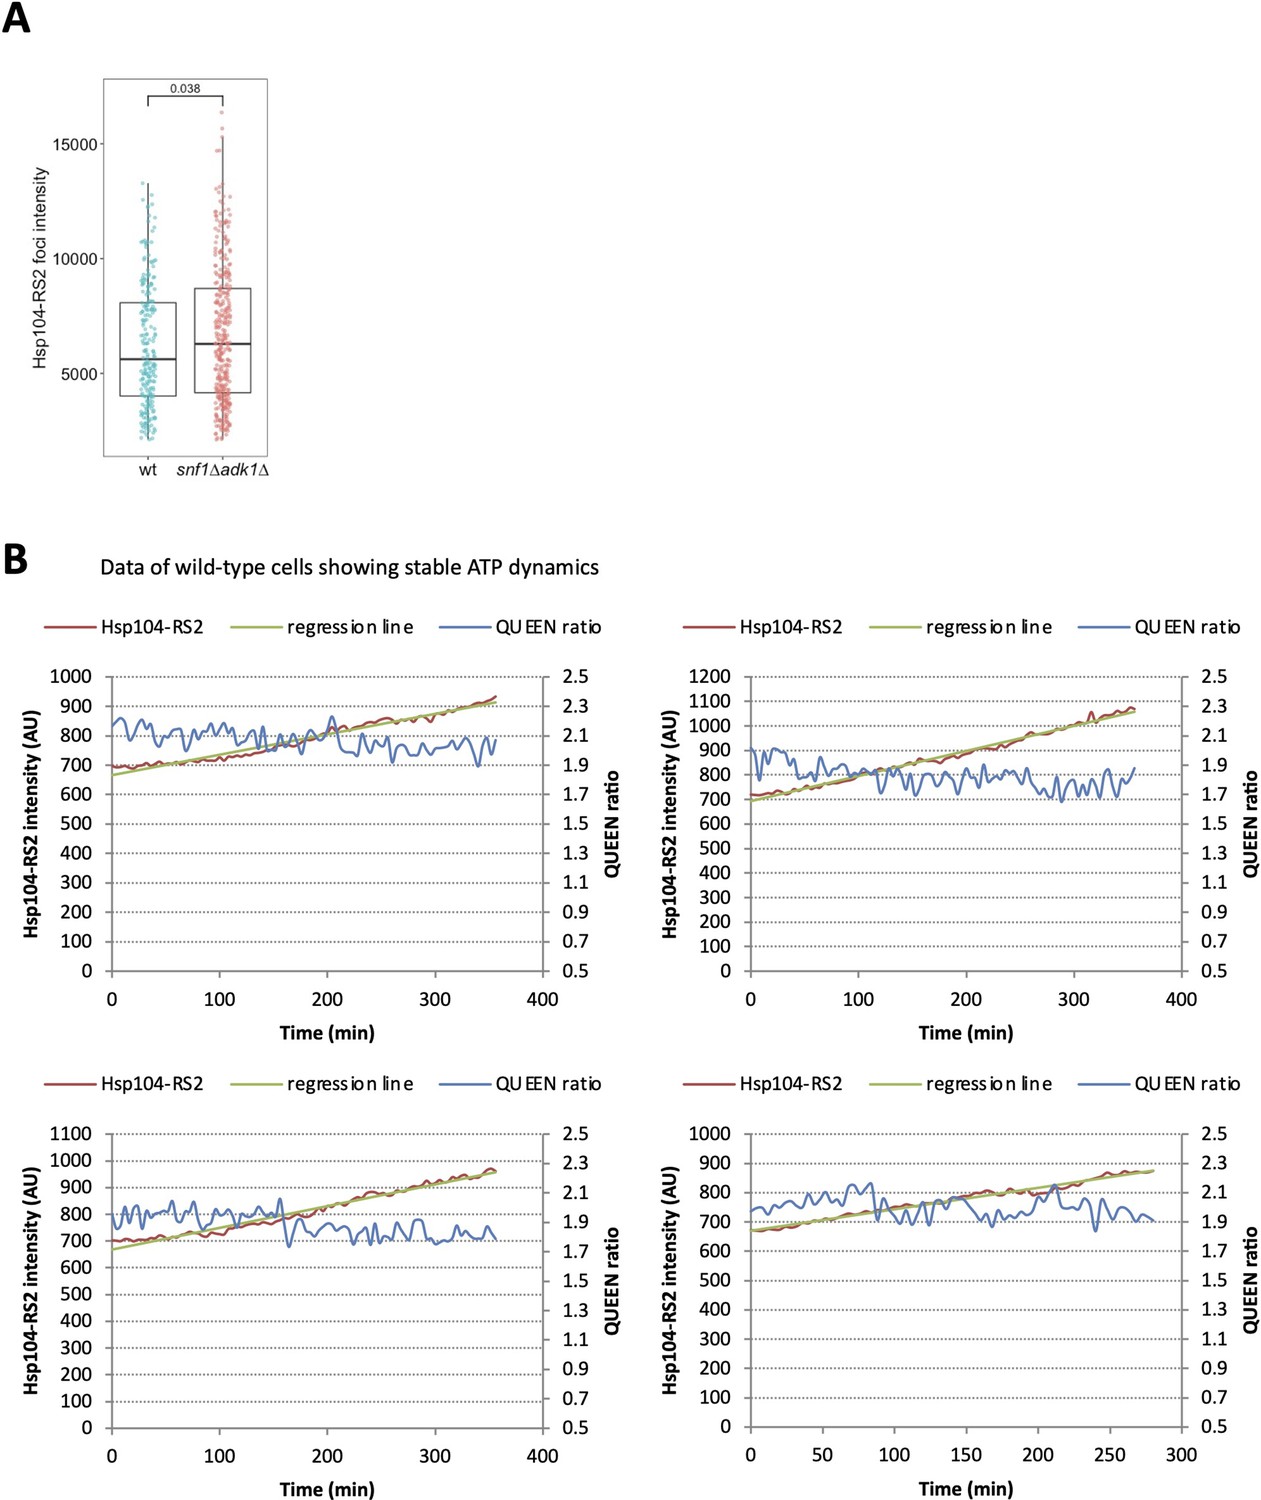
Simultaneous imaging of adenosine triphosphate (ATP) and protein aggregation in wild-type cells.
(A) The fluorescence intensities of Hsp104-RS2 foci in wild-type (230 foci) and snf1∆ adk1∆ (330 foci) cells grown at 25°C were plotted. The significance of differences was tested using the unpaired two-tailed Welch’s t-test. (B) Four other examples of the data shown in Figure 6D.
-
Figure 6—figure supplement 1—source data 1
Raw data for Figure 6—figure supplement 1.
- https://cdn.elifesciences.org/articles/67659/elife-67659-fig6-figsupp1-data1-v1.xlsx
Figure 6—figure supplement 2
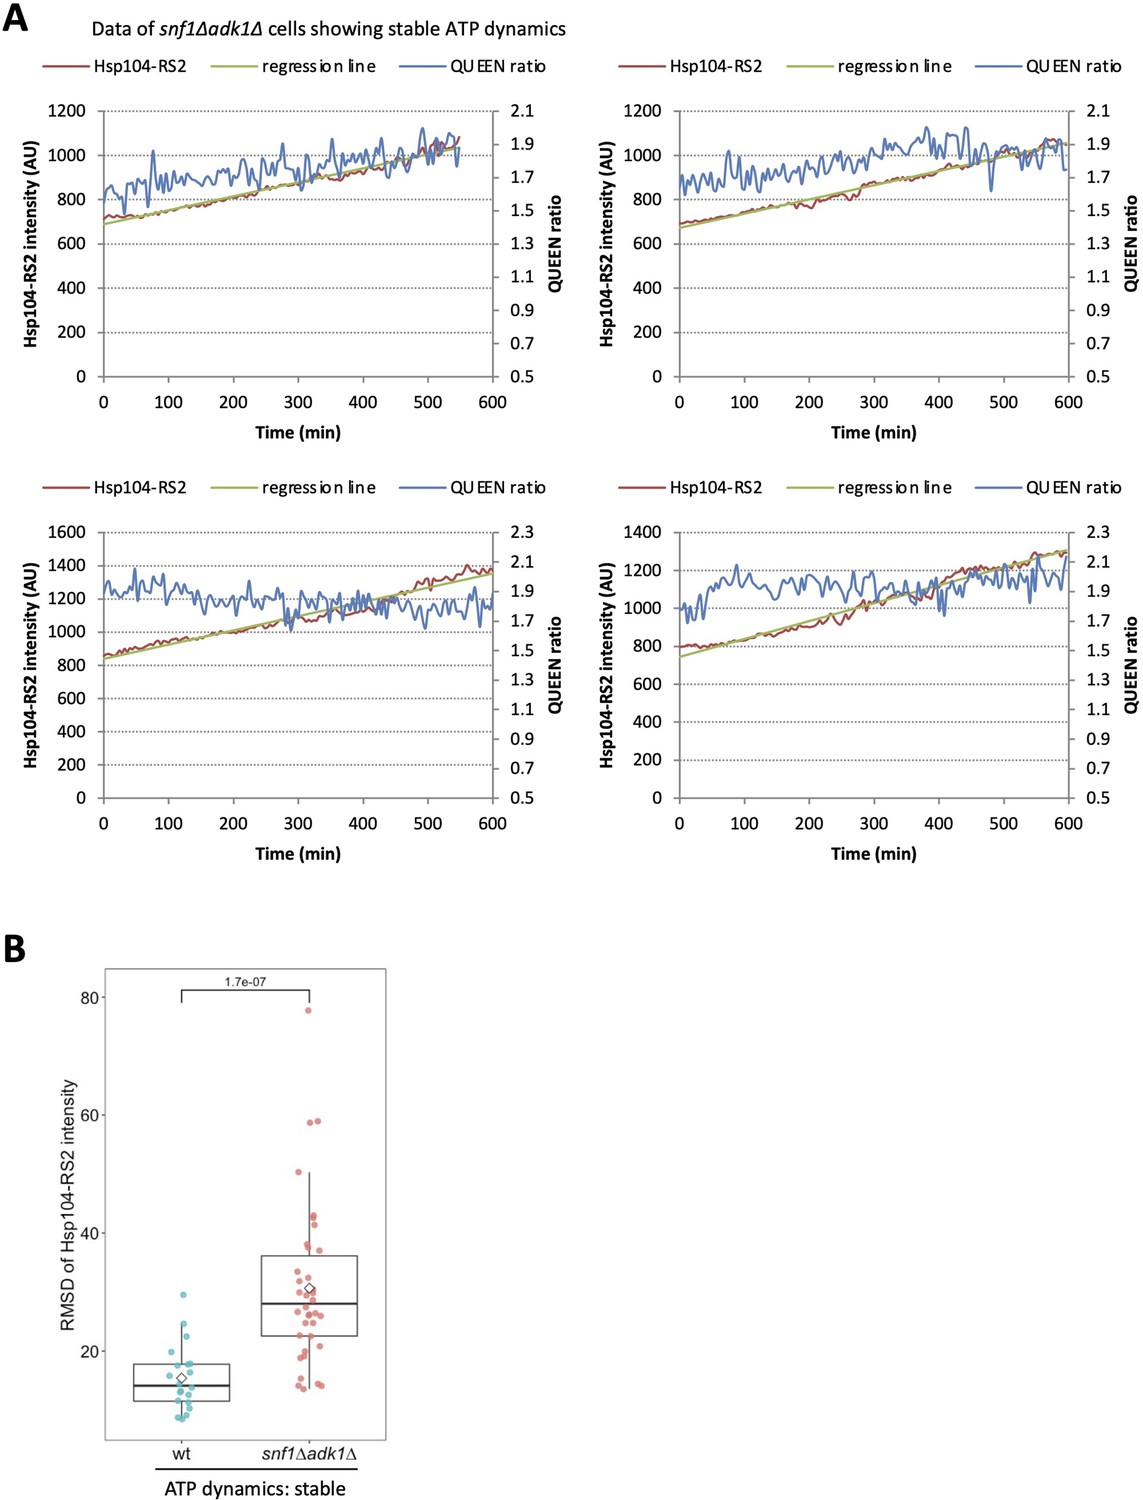
Simultaneous imaging of adenosine triphosphate (ATP) and protein aggregation in snf1∆ adk1∆ cells showing stable ATP levels.
(A) Four other examples of the data shown in Figure 6F. (B) Comparison of the root mean square deviation (RMSD) of the intracellular fluorescence intensity of Hsp104-RS2 in wild-type cells and snf1∆ adk1∆ cells that showed stable ATP dynamics. The significance of differences was tested using the unpaired two-tailed Welch’s t-test and indicated by a p value.
-
Figure 6—figure supplement 2—source data 1
Raw data for Figure 6—figure supplement 2.
- https://cdn.elifesciences.org/articles/67659/elife-67659-fig6-figsupp2-data1-v1.xlsx
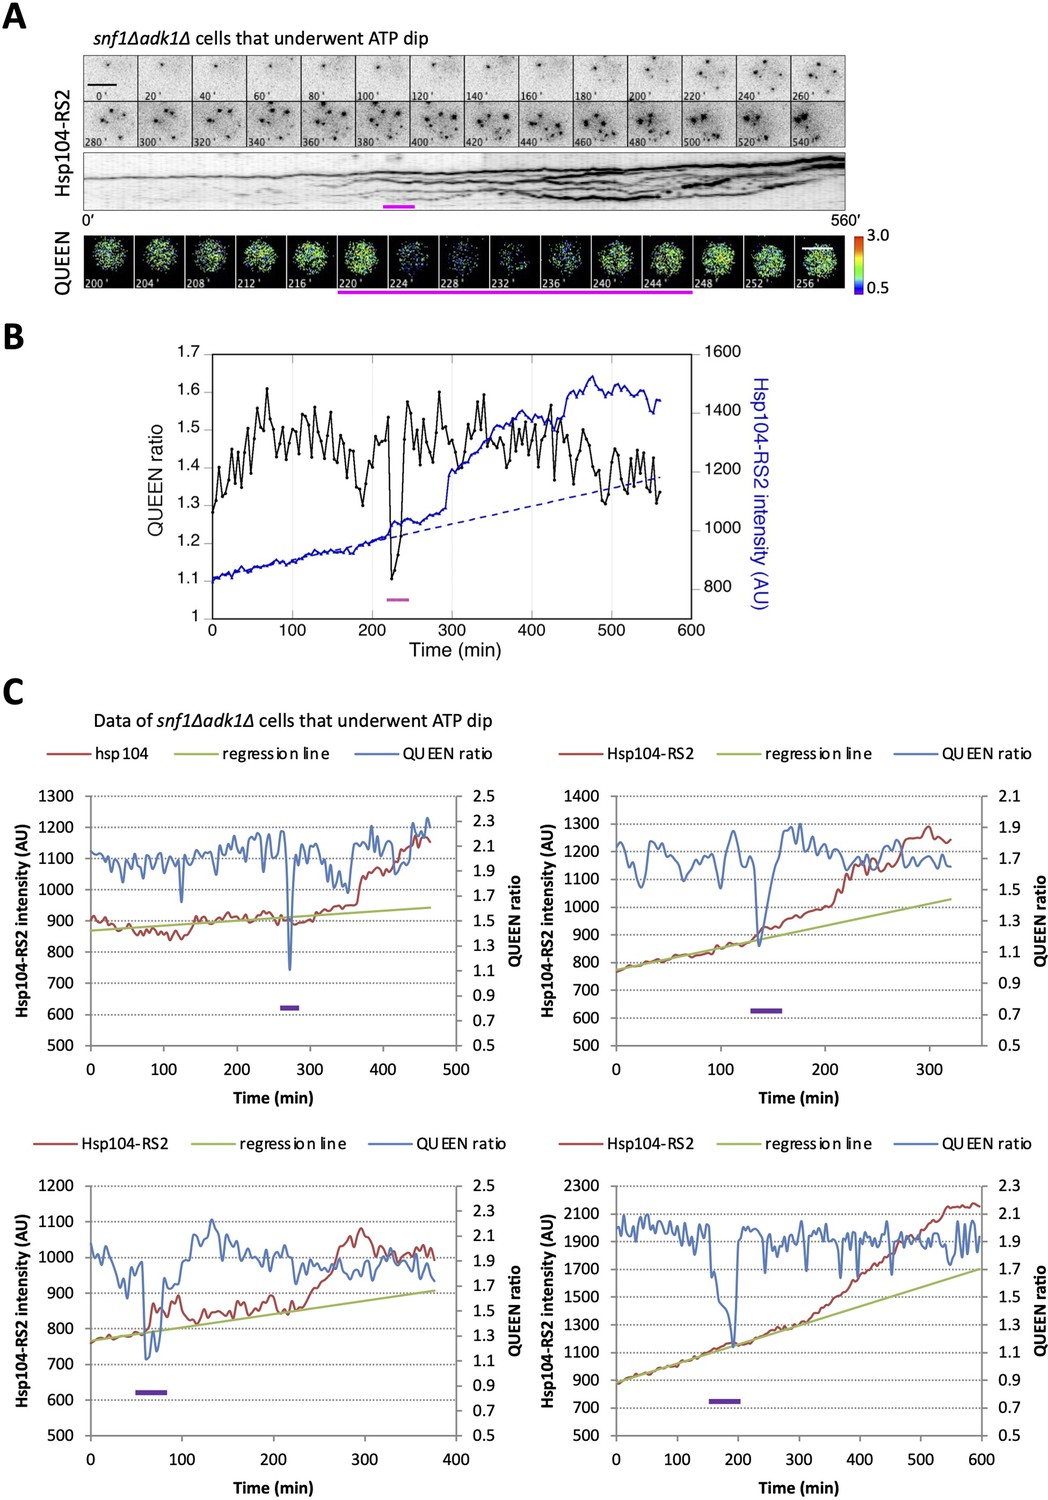
Figure 7 with 2 supplements

The transient decrease in adenosine triphosphate (ATP) levels is closely associated with the increased accumulation of protein aggregates in snf1∆ adk1∆ cells.
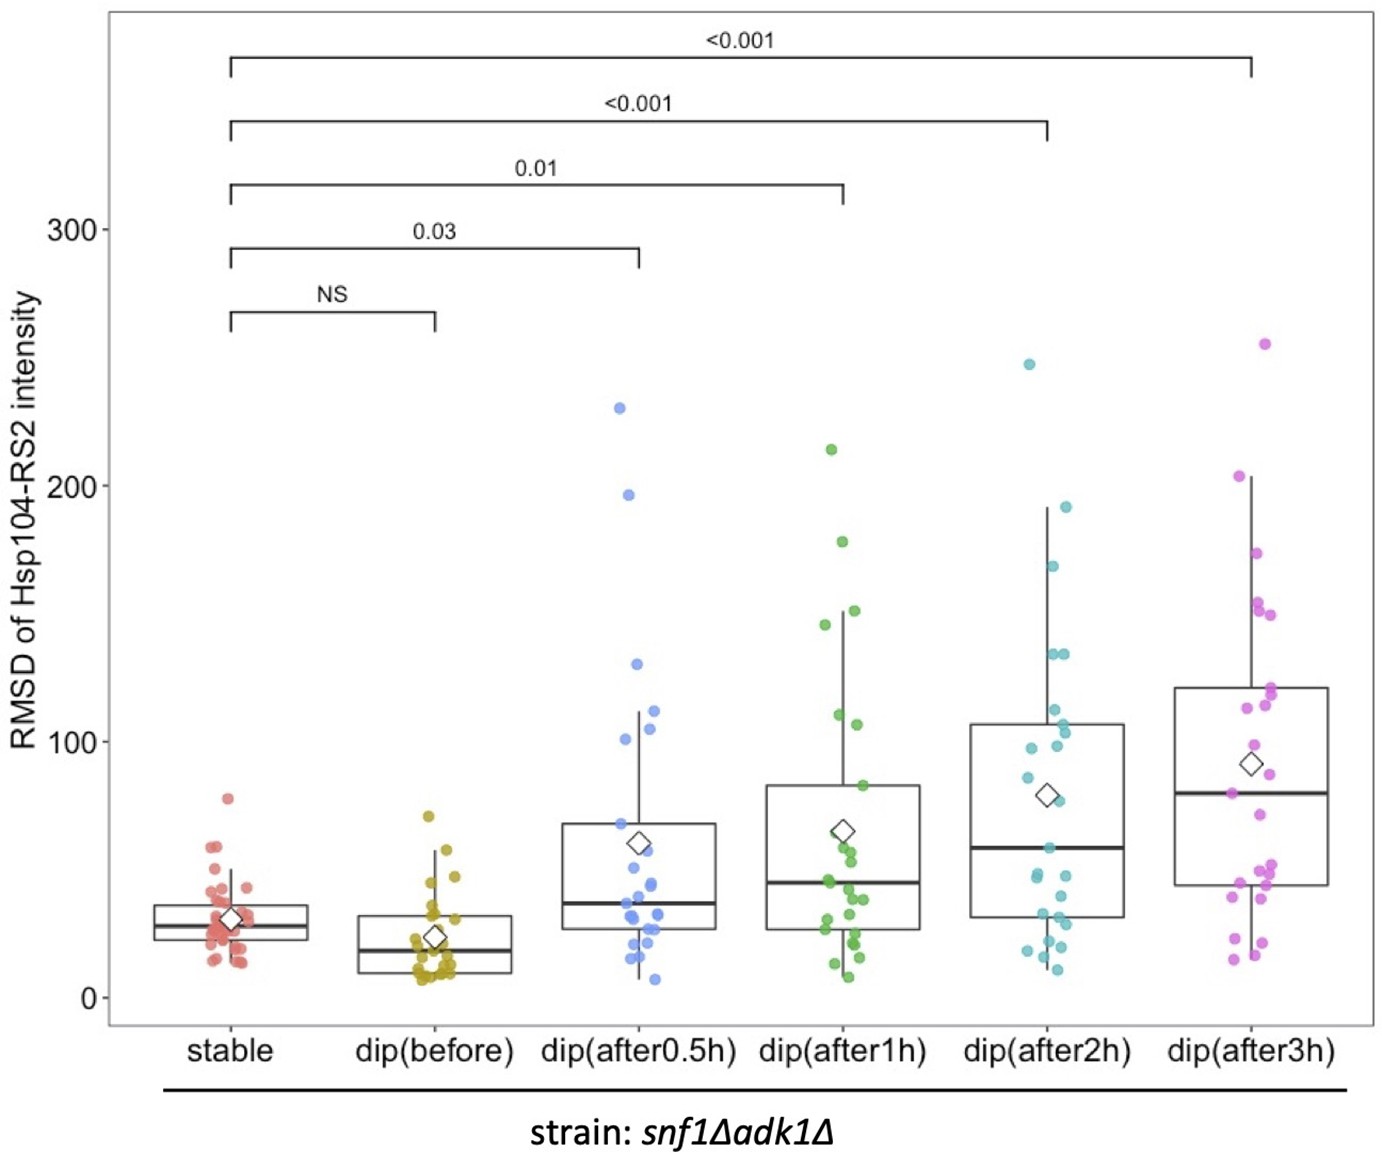
(A) Time-lapse imaging of QUEEN and Hsp104-RS2 in an snf1∆ adk1∆ cell that underwent a single ATP dip. (Top) Images of the Hsp104-RS2 signal (inverted grayscale) in the cell at the indicated time points are shown. (Middle) Kymograph of the images shown in the top panel. (Bottom) QUEEN ratio images of the cell during the ATP dip. (B) The mean QUEEN ratio and the mean fluorescence intensities of Hsp104-RS2 inside the cell were plotted over time. The dotted line indicates the best linear regression of Hsp104-RS2 intensities before the onset of the ATP dip (t = 200 min). Magenta bars indicate the duration of the ATP dip. Scale bar = 5 µm. (C) The root mean square deviation (RMSD) of the mean Hsp104-RS2 intensity of snf1∆ adk1∆ cells that underwent the ATP dip (N = 25 cells, pooled from four independent experiments) were plotted before and after the ATP dip. The RMSD was calculated from deviations from the linear regression before the ATP dip (see Materials and methods for more details). The size of a data point indicates the value normalized to its initial value. The significance of differences was tested using Dunnett’s multiple comparison test and indicated by p values. (D) Maximum fold changes in RMSD within 3 hr of the ATP dip were box plotted. The mean (a diamond) and median (the median line in the box) were 5.6 and 3.7, respectively.
-
Figure 7—source data 1
Raw data for Figure 7.
- https://cdn.elifesciences.org/articles/67659/elife-67659-fig7-data1-v1.xlsx
Figure 7—figure supplement 1
Simultaneous imaging of adenosine triphosphate (ATP) and protein aggregation in snf1∆ adk1∆ cells that underwent an ATP dip.
(A, B) Another example of a snf1∆ adk1∆ cell showing a sharp increase in the intensity of Hsp104-RS2 after a single ATP dip (as shown in Figure 7A, B). Magenta bars indicate the duration of the ATP dip. Scale bar = 5 µm. (C) Four other examples of the data shown in B. Magenta bars indicate the approximate duration of the ATP dip.
-
Figure 7—figure supplement 1—source data 1
Raw data for Figure 7—figure supplement 1.
- https://cdn.elifesciences.org/articles/67659/elife-67659-fig7-figsupp1-data1-v1.xlsx
Figure 7—figure supplement 2
Comparison of the root mean square deviation (RMSD) of the intracellular fluorescence intensity of Hsp104-RS2 in snf1∆ adk1∆ cells.
We compared the RMSD between mutant cells showing stable adenosine triphosphate (ATP) dynamics and those that exhibited the ATP dip. The former and latter data were identical to those used in Figure 6—figure supplement 2B and in Figure 7C, respectively. Diamonds and the median lines in the box indicate the mean and median, respectively. The significance of differences between the data was tested using Dunnett’s multiple comparison test and indicated by p values. NS, not significant (p value >0.96).
-
Figure 7—figure supplement 2—source data 1
Raw data for Figure 7—figure supplement 2.
- https://cdn.elifesciences.org/articles/67659/elife-67659-fig7-figsupp2-data1-v1.xlsx
Figure 8
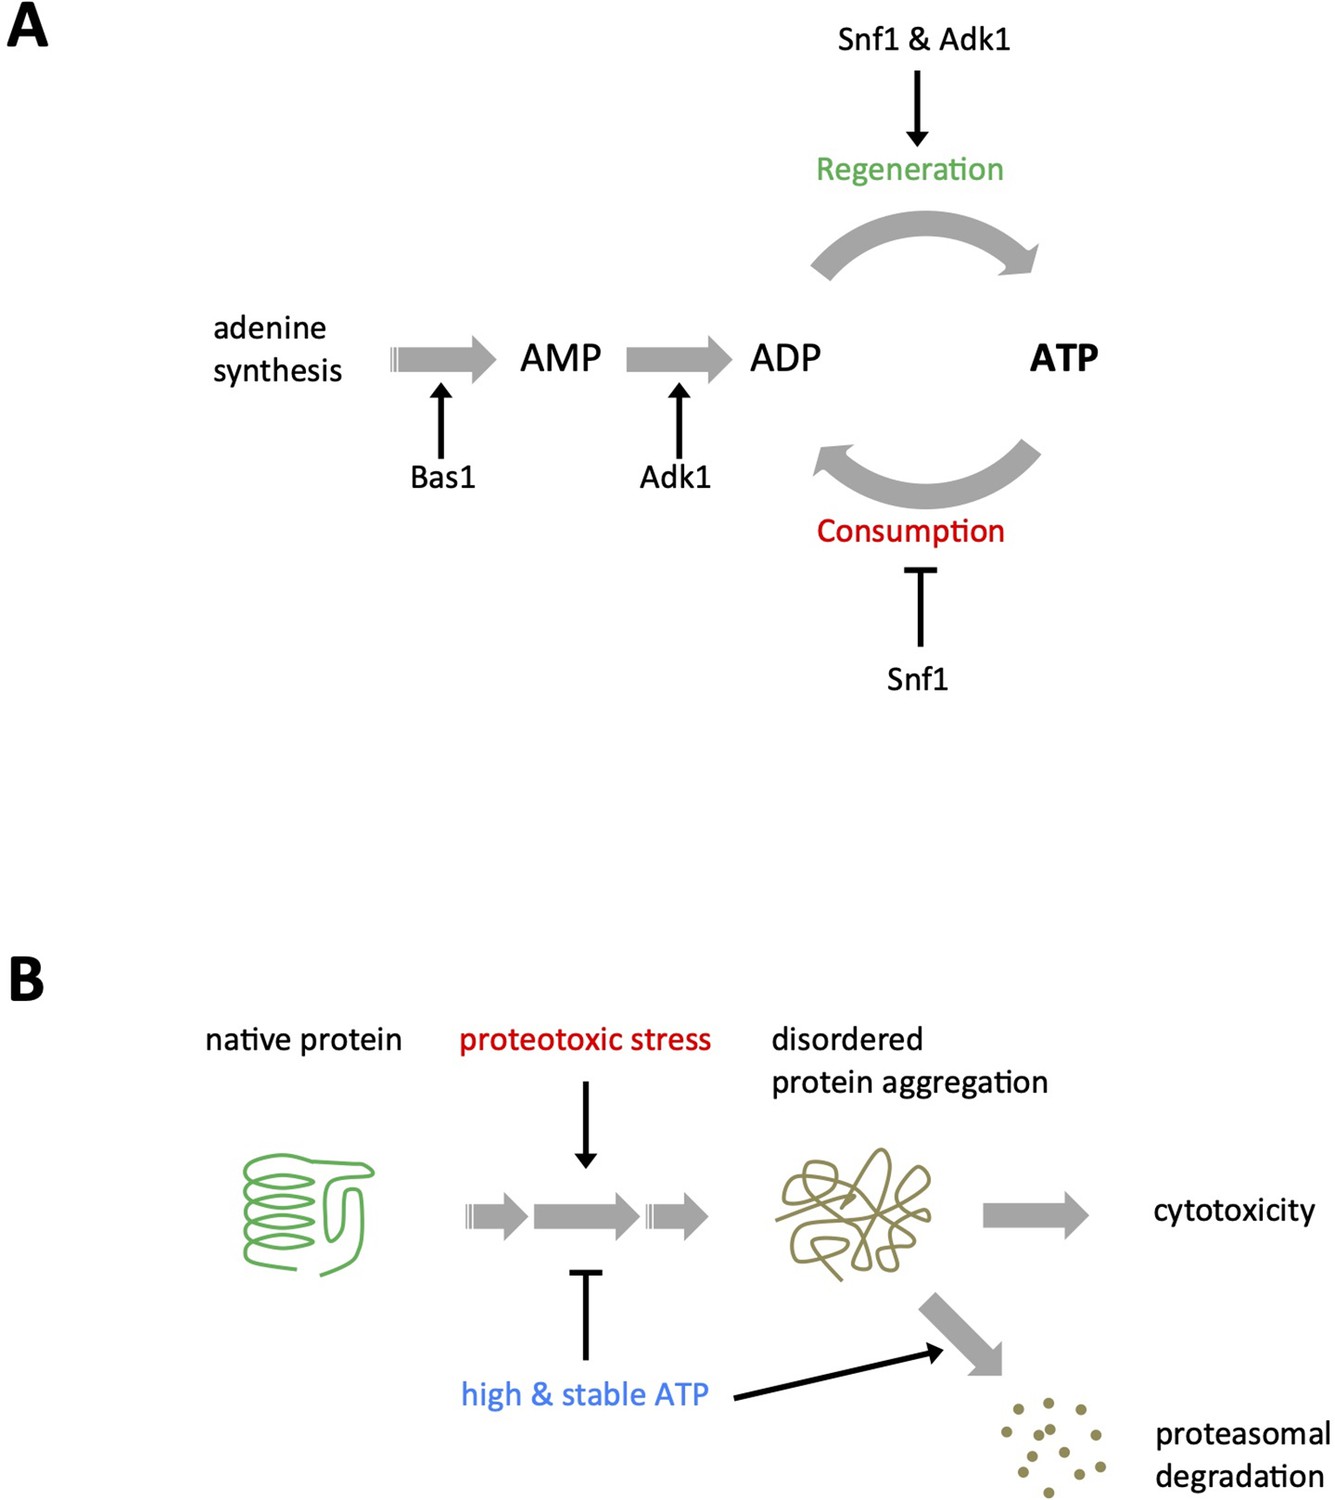
Models for adenosine triphosphate (ATP) homeostasis and its role in proteostasis.
(A) Schematic summary of the roles of Snf1, Adk1, and Bas1 in ATP homeostasis. (B) A schematic model for ATP homeostasis preventing cytotoxic protein aggregation.
Additional files
-
Transparent reporting form
- https://cdn.elifesciences.org/articles/67659/elife-67659-transrepform1-v1.docx
-
Supplementary file 1
Strains used in the present study.
- https://cdn.elifesciences.org/articles/67659/elife-67659-supp1-v1.docx
-
Supplementary file 2
Plasmids used in the present study.
- https://cdn.elifesciences.org/articles/67659/elife-67659-supp2-v1.docx
Download links
A two-part list of links to download the article, or parts of the article, in various formats.
Downloads (link to download the article as PDF)
Open citations (links to open the citations from this article in various online reference manager services)
Cite this article (links to download the citations from this article in formats compatible with various reference manager tools)
High and stable ATP levels prevent aberrant intracellular protein aggregation in yeast
eLife 11:e67659.
https://doi.org/10.7554/eLife.67659


