Ectocytosis prevents accumulation of ciliary cargo in C. elegans sensory neurons
- Laboratory of Neurophysiology, ULB Neuroscience Institute (UNI), Université Libre de Bruxelles(ULB), Belgium
Figures
Figure 1 with 1 supplement
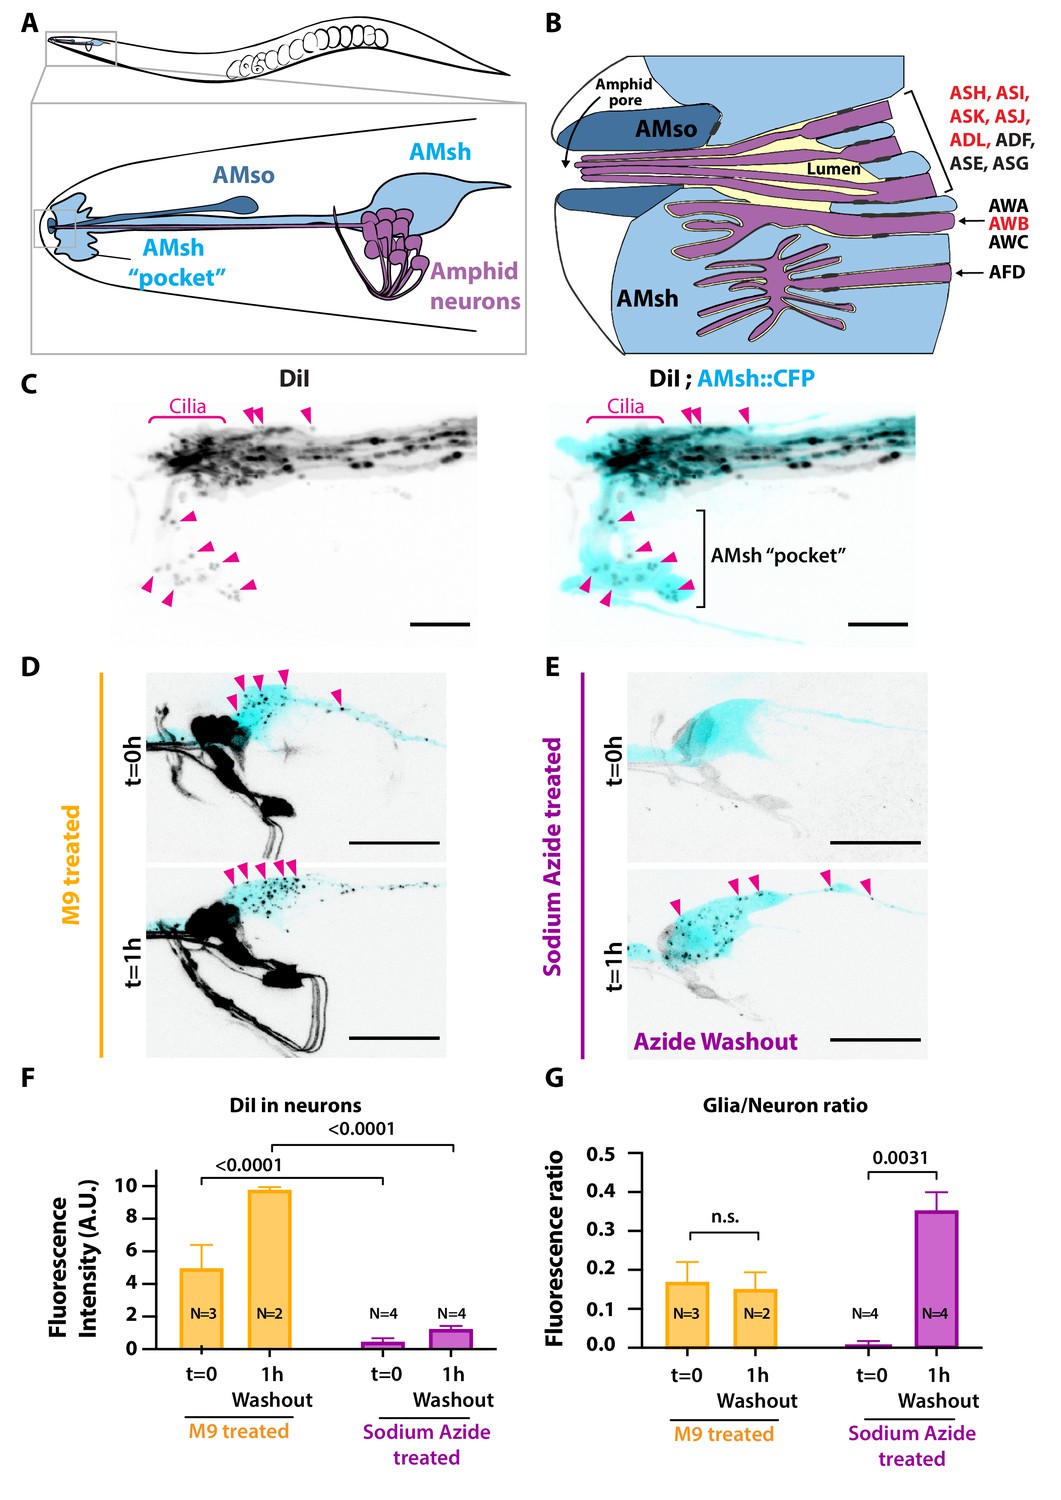
Ciliated amphid neurons transfer DiI-stained membrane to the ensheathing glia in an ATP-dependent manner within minutes.
(A) Anatomical organization of the amphid sensilla in C. elegans (top). Head close-up scheme shows AMsh and AMsh ‘pocket’ (light blue), AMso (dark blue), and the amphid neurons (magenta). (B) Schematic depicting the nerve receptive ending (NRE) of the 12 amphid neurons. Tight junctions between neurons and glia, or between AMsh and AMso, are depicted as dark gray discs between cells. The red labeled neurons are the DiI-stained subset. (C) Maximum intensity projection of the DiI-stained neurons in a strain expressing CFP in AMsh glia. Neuronally derived vesicles containing DiI can be observed within the AMsh cytoplasm and in the AMsh ‘pocket’ (magenta arrowheads) (D) DiI staining of the amphid neurons treated with M9 at t = 0 and after 1 hr of being washed with M9, amphid neurons strongly stained, and multiple vesicular puncta within AMsh cell body can be observed (magenta arrowheads). (E) In the presence of 25 mM sodium azide, DiI staining of the amphid neurons is fainter and no vesicles could be observed within AMsh cell body at t = 0. After 1 hr of being washed with M9 to remove sodium azide (azide washout), the AMsh staining is recovered. (F) Measurements of fluorescence intensity (in arbitrary units) quantified in neuronal cell bodies. Two-way ANOVA, Sidak’s correction for multiple comparison. (G) Glia/neuron fluorescence ratios. Glia fluorescence was normalized to the fluorescence intensity of neurons. AMsh normalized fluorescence is drastically reduced in the presence of sodium azide and increases after its removal (t = 1 hr). Unpaired t-test with Welch’s correction. Scale bars: 5 μm in (C), 20 μm in (D, E).
Figure 1—figure supplement 1
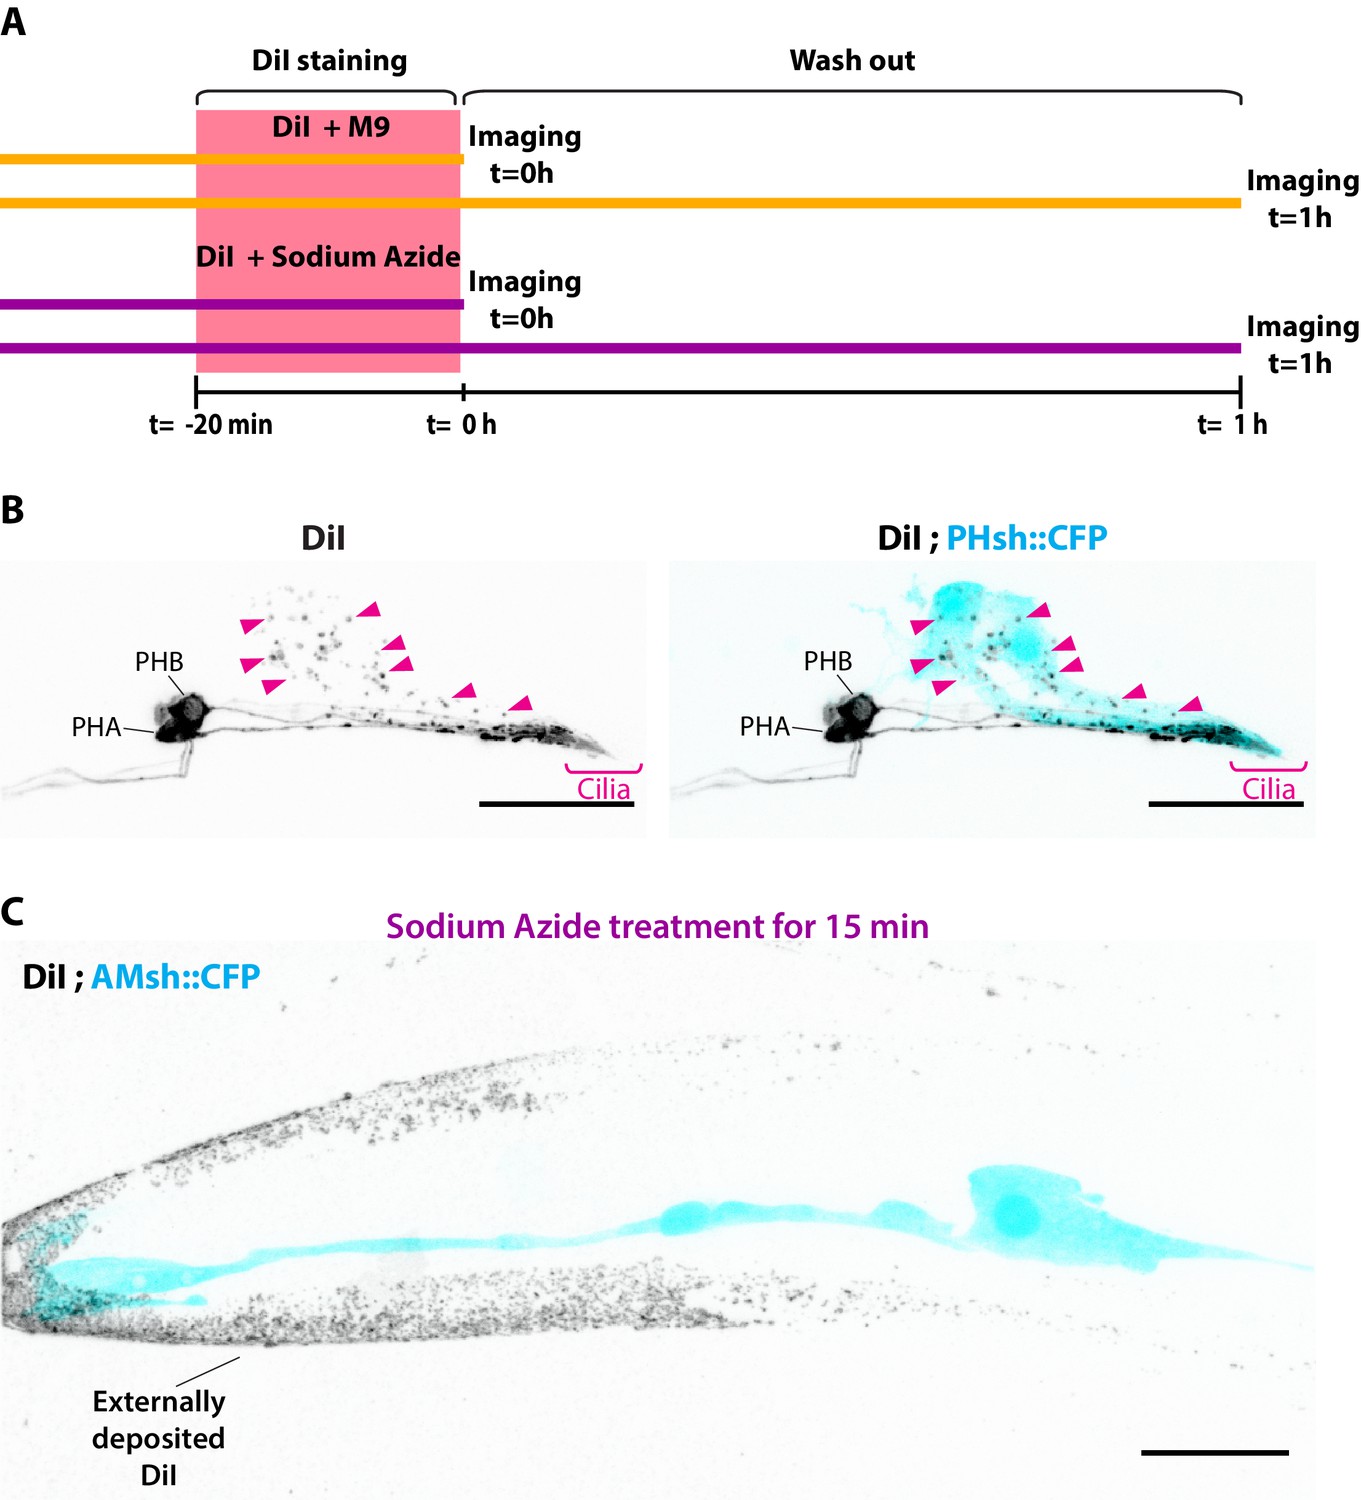
Experimental design for DiI experiment.
(A) Experimental scheme for Figure 1D and E: animals were stained for 20 min with a solution of DiI in M9 buffer or with DiI in M9 buffer supplemented with 25 mM sodium azide. The fluorescence intensity was quantified for neurons and for AMsh directly after staining (t = 0) or after 1 hr of worm recovery on regular plates in the absence of sodium azide (t = 1 hr washout). (B) Maximum intensity projection of DiI staining in the phasmid sensilla, PHA/B neurons show homogenous membrane staining, and phasmid sheath glia contain neuronally derived DiI vesicles (magenta arrowheads). (C) Maximum intensity projection of DiI-stained animal previously treated with 25 mM sodium azide 15 min prior to imaging. In these conditions, dye I is not incorporated in ciliated neurons nor in the glia. As these animals did not undergo de-staining in a plate with food (see Materials and methods), DiI is seen deposited in the animal cuticle. Scale bar: 20 μm.
Figure 2 with 2 supplements
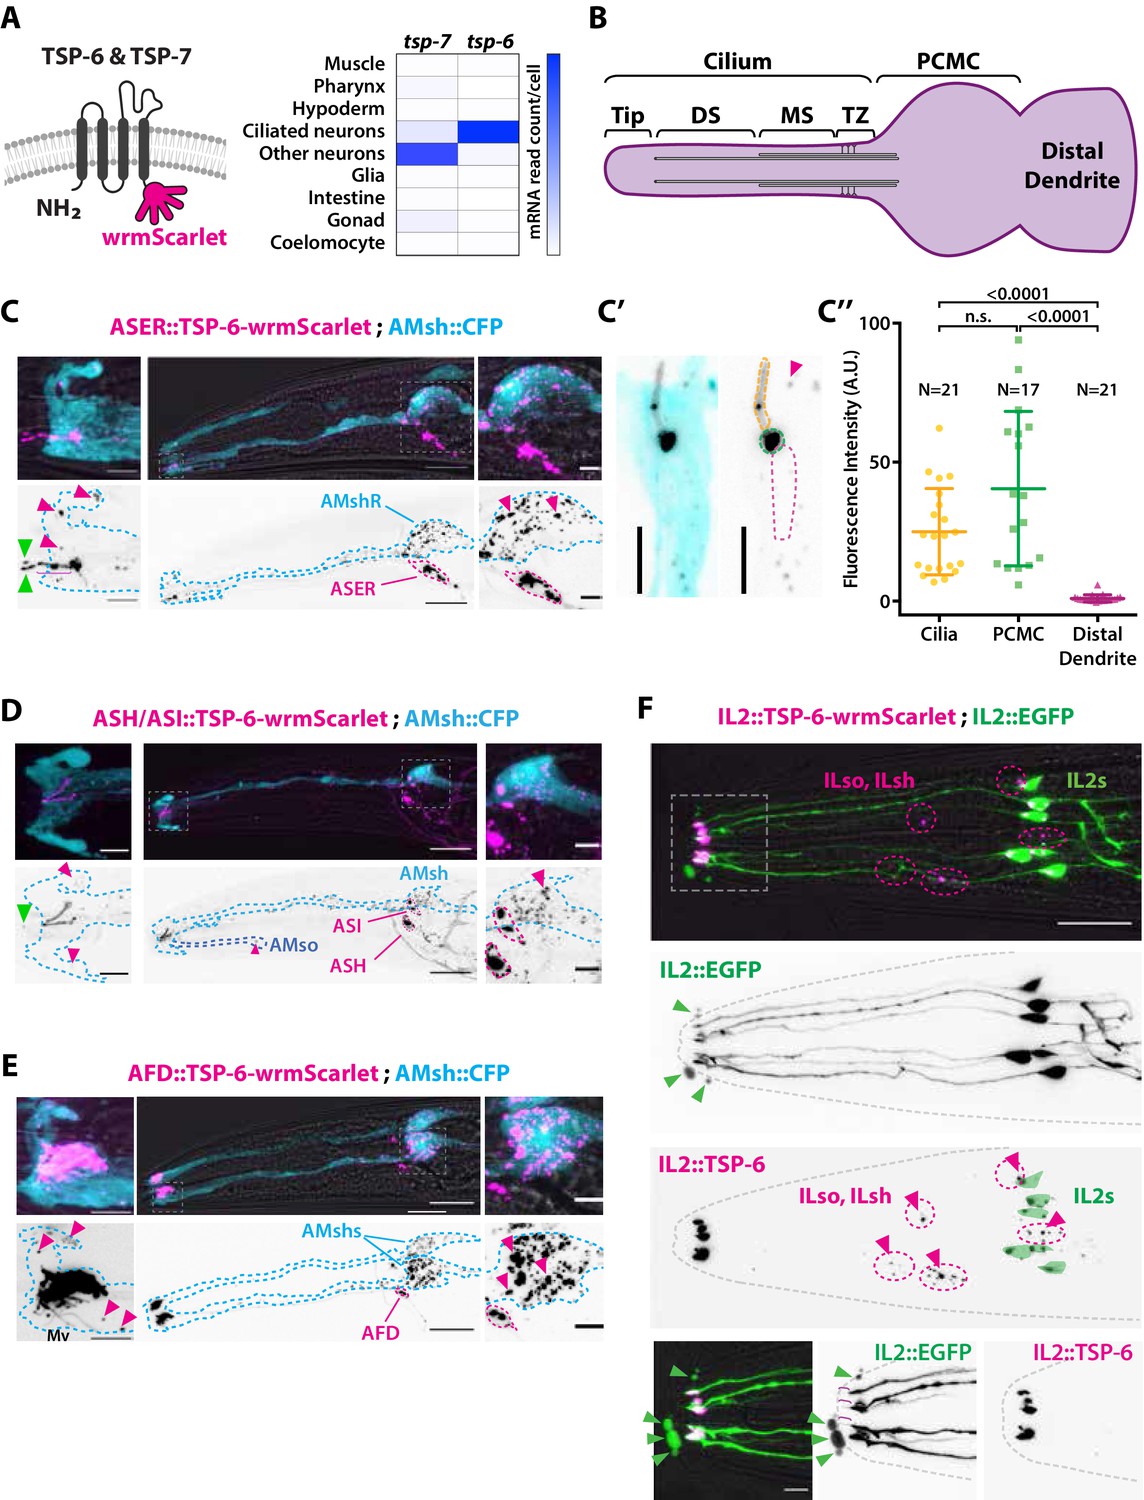
The extracellular vesicle (EV) marker TSP-6-wrmScarlet localizes to the cilia region, is loaded into EVs, and exported to surrounding glial cells.
(A) TSP-6 and TSP-7 were C-terminally tagged with wrmScarlet. Expression patterns based on molecular cell profiling show that tsp-6 and tsp-7 genes are enriched in ciliated or non-ciliated neurons, respectively. (B) Scheme of ciliary domains: ciliary tip, distal segment (DS), middle segment (MS), transition zone (TZ), and the periciliary membrane compartment (PCMC) located at the base of the cilia in contact with the distal dendrite. (C) Expression of TSP-6-wrmScarlet in ASER driven by gcy-5 promoter. TSP-6-wrmScarlet-carrying EVs exported from ASER are observed within the cytoplasm of AMsh. Left panels show a magnification of ASER cilium region, EVs are released in the cilia pore anterior to the ASER cilia tip (green arrowhead). Right panels show EVs within AMsh cell body (magenta arrowheads). Scale bar: 20 μm middle panel and 5 μm insets. (C′) TSP-6-wrmScarlet is enriched in ASER cilium: representative confocal projection showing TSP-6-wrmScarlet enrichment in PCMC and cilium. (C′′) Fluorescence quantification in animals expressing TSP-6-wrmScarlet in ASER neuron. Brown–Forsythe ANOVA, multiple comparisons corrected by Dunnett´s test. (D) Expression of TSP-6-wrmScarlet under the sra-6 promoter (driving expression in ASH and ASI neurons). TSP-6-wrmScarlet is enriched in both ASH and ASI cilia. Left panel shows TSP-6-wrmScarlet-carrying EVs released by ASI and/or ASH in the cilia pore (green arrowhead), EVs released by ASH/ASI were also seen within the cytoplasm of AMsh surrounding ASI/ASH cilia (magenta arrowheads). Few vesicles were also observed in AMso (blue dashed outline, middle panel). Right panel shows AMsh soma with multiple EVs (magenta arrowhead). Scale bar: 20 μm middle panel and 5 μm insets. (E) Expression of TSP-6-wrmScarlet in AFD neurons driven by gcy-8 promoter. TSP-6-wrmScarlet is enriched in AFD microvilli and PCMC. Left panel shows TSP-6-wrmScarlet-carrying EVs within the cytoplasm of AMsh that surrounds AFD terminals (magenta arrowheads). Right panel shows AMsh soma with multiple EVs (magenta arrowhead). Scale bar: 20 μm middle panel and 5 μm insets. (F) Co-expression of TSP-6-wrmScarlet and cytoplasmic mEGFP in IL2 neurons (driven by klp-6 promoter). mEGFP can be observed within EVs that are environmentally released (green arrowhead) while TSP-6-wrmScarlet is observed on EVs located within the cytoplasm of ILsh and ILso glial cells (magenta arrowheads). Theoretical position of ILsh and ILso was outlined (magenta dashed circles), IL2 neurons position was drawn with green filled outlines. Scale bar: 20 μm top panels and 5 μm insets.
Figure 2—figure supplement 1
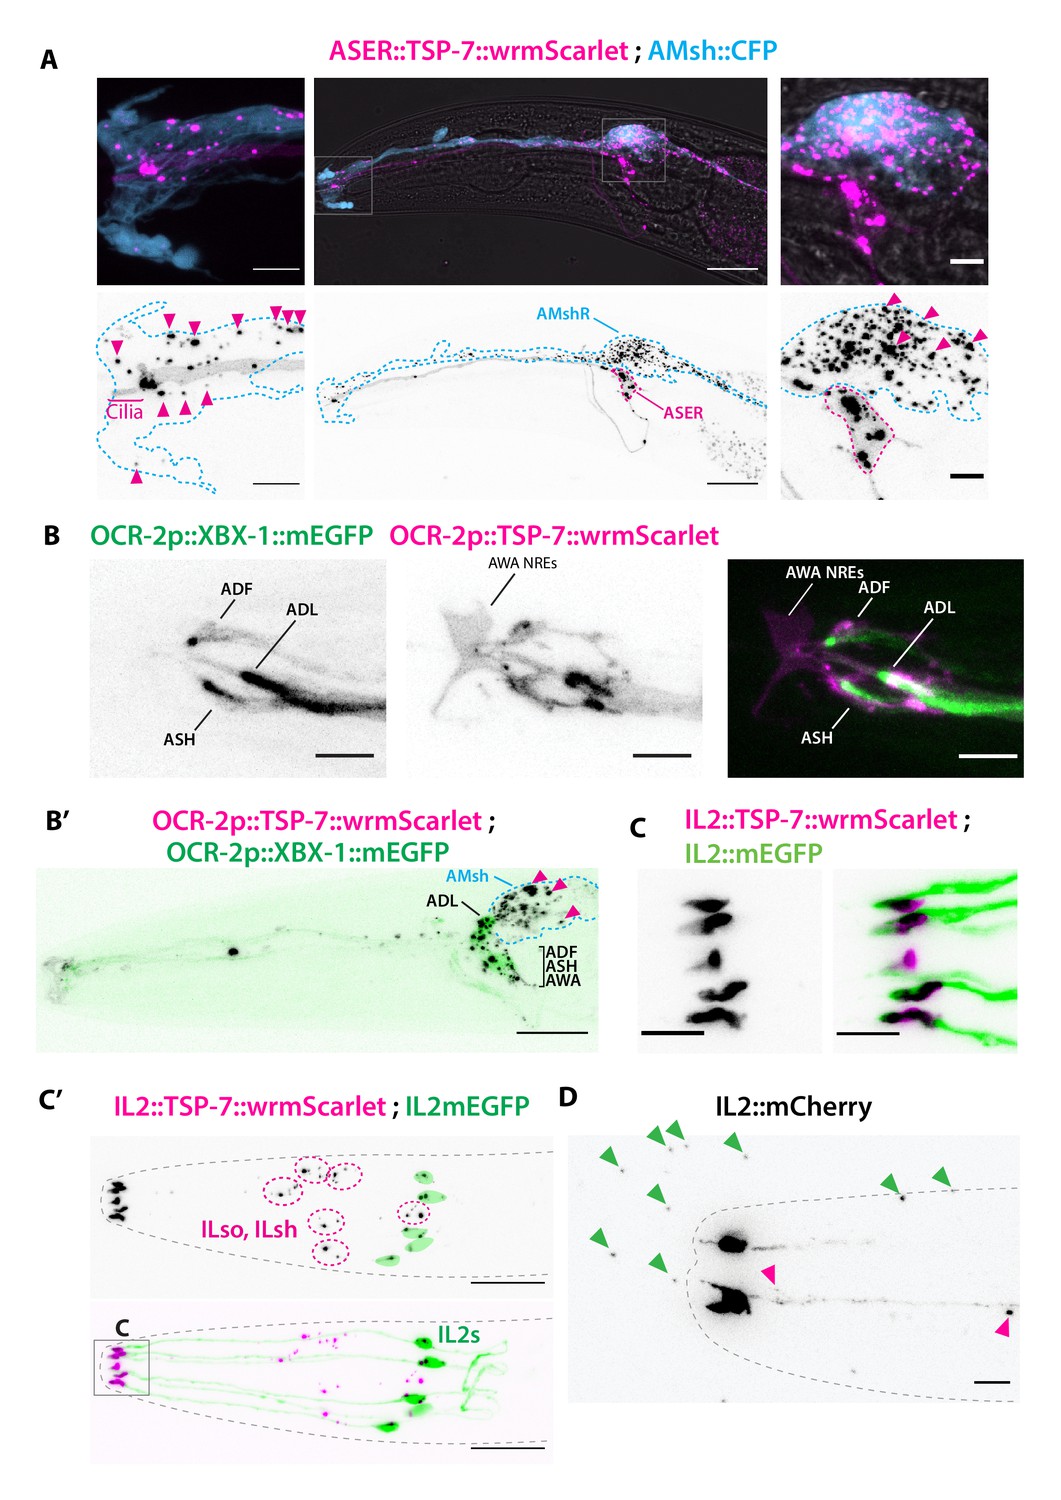
TSP-7-wrmScarlet also localizes to the cilia region, is loaded into extracellular vesicles (EVs), and exported to surrounding glial cells.
(A) Cell-specific expression of TSP-7-wrmScarlet in ASER: the fusion protein localizes to the cilia and is exported to EVs observed within the AMsh cytoplasm. Left panel shows EVs captured by AMsh glia in the surroundings of ASER cilia region (magenta arrowheads). Right panel shows TSP-7-wrmScarlet-carying EVs in the AMsh cell body (magenta arrowheads). Scale bar: 20 μm middle image and 5 μm insets. (B) TSP-7-wrmScarlet expressed driven by the ocr-2 promoter (expression in ADF, ADL, ASH, and AWA). TSP-7-wrmScarlet expression overlaps with the XBX-1-mEGFP marker in the cilium and PCMC of ADF, ADL, ASH, and AWA. Scale bar: 5 μm. (B′) In these animals, TSP-7-wrmScarlet-carrying EVs were also exported to AMsh cytoplasm (magenta arrowheads), XBX-1-mEGFP was not observed in these EVs. Theoretical position of AMsh was outlined (blue dashed line). Scale bar: 20 μm. (C, C′) Co-expression of TSP-7-wrmScarlet and cytoplasmic mEGFP in IL2 neurons: (C) mEGFP expression locates in all ciliary compartments while TSP-7-wrmScarlet is heavily enriched in IL2 PCMC. (C′) TSP-7-wrmScarlet carrying EVs are seen within the cytoplasm of ILsh and ILso (magenta arrowheads, ILsh and ILso are outlined in magenta dashed lines). On some occasions, mEGFP and/or TSP-7-wrmScarlet-carrying EVs were also released by cilia tip into the environment (Video 3). (D) Cytoplasmic mCherry expression in IL2 neurons shows EVs that have already been environmentally released (green arrowheads). Scale bar: 5 μm in (C), 20 μm in (C′), 5 μm in (D).
Figure 2—figure supplement 2
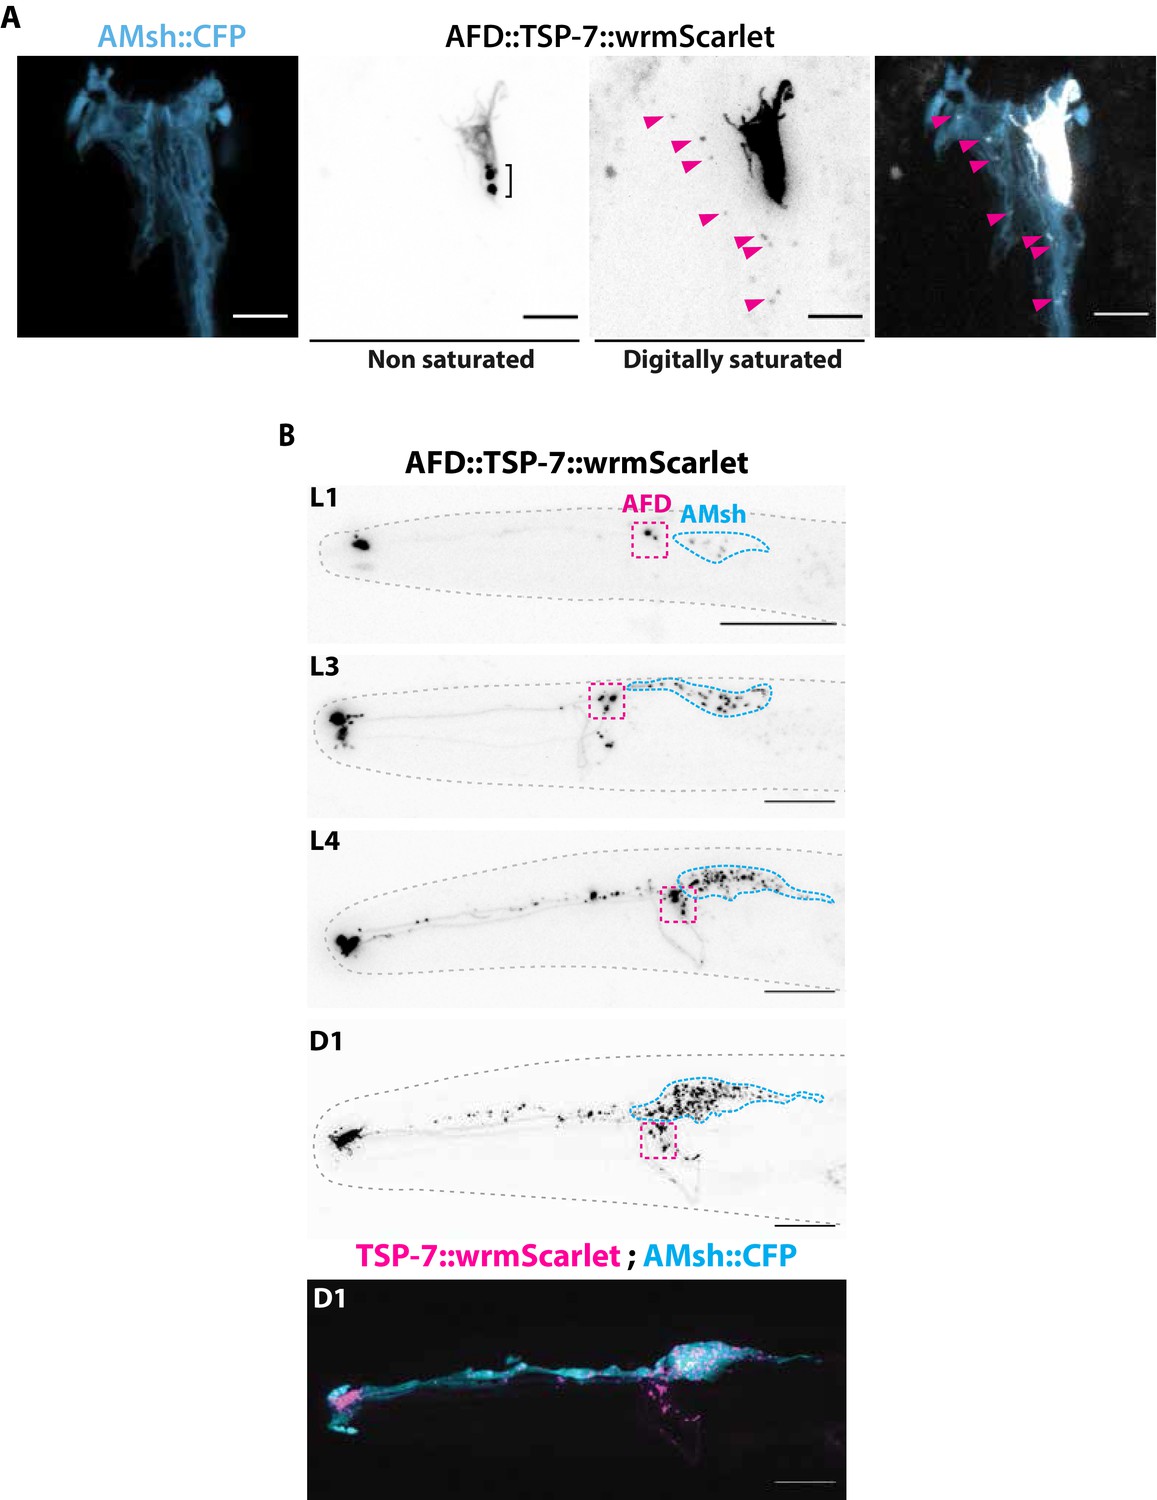
TSP-7-wrmScarlet localizes to AFD nerve receptive endings (NREs), is loaded into extracellular vesicles (EVs), and exported to embedding AMsh glia.
(A) Cell-specific expression of TSP-7-wrmScarlet in AFD shows TSP-7-wrmScarlet enrichment in the microvilli and periciliary membrane compartment (PCMC) of AFD. Non-saturated images show a TSP-7-wrmScarlet vesicular compartment within PCMC of AFD neuron, possibly corresponding to a membrane recycling compartment. TSP-7-wrmScarlet-carrying EVs are released and captured within the cytoplasm of AMsh in the vicinity of AFD microvilli (magenta arrowheads). Image was digitally saturated by increasing the TSP-7 channel brightness in order to display the fluorescence of released vesicles. Scale bar: 5 μm. (B) Longitudinal acquisitions across developmental stages from the first larval stage to day 1 adult show the amount of TSP-7-wrmScarlet fluorescent EVs observed within AMsh cell body progressively build up as the animal ages. Scale bar: 20 μm in top panels, 5 μm in bottom panels.
Figure 3
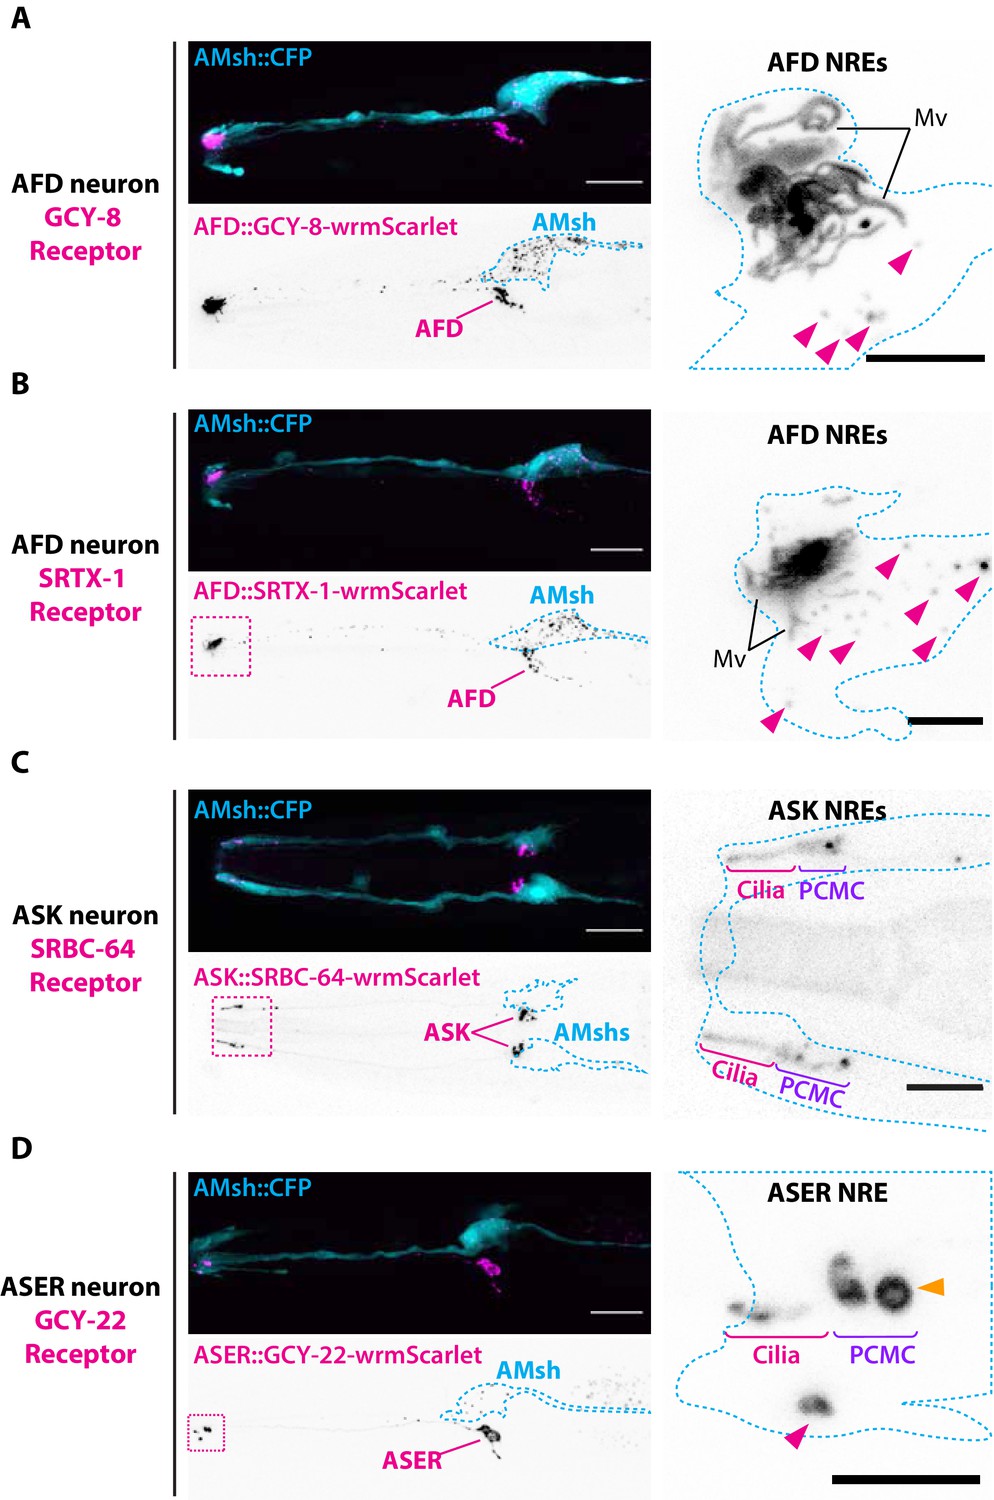
Endogenous ciliary membrane proteins are sorted to ectosomes and exported to AMsh.
(A) GCY-8-wrmScarlet was cell-specifically expressed in AFD (driven by gcy-8 promoter). GCY-8-wrmScarlet is enriched in AFD microvilli and AFD periciliary membrane compartment (PCMC). GCY-8-wrmScarlet-carrying extracellular vesicles (EVs) were also observed within AMsh cytoplasm, in the vicinity of the AFD nerve receptive endings and in AMsh cell body (magenta arrowheads). (B) SRTX-1-wrmScarlet was cell-specifically expressed in AFD (driven by gcy-8 promoter). SRTX-1-wrmScarlet is enriched in AFD microvilli and PCMC, similarly to GCY-8. Within AMsh cytoplasm, SRTX-1-wrmScarlet-carrying EVs are observed in the vicinity of the AFD neuron receptive endings and in AMsh cell body (magenta arrowheads). (C) SRBC-64-wrmScarlet was cell-specifically expressed in ASK neurons (driven by srbc-64 promoter). SRBC-64-wrmScarlet is observed in the ASK cilia proper (C) and PCMC but not in the cytoplasm of AMsh. (D) GCY-22-wrmScarlet was cell-specifically expressed in ASER (driven by gcy-5 promoter). GCY-22-wrmScarlet is observed in ASER cilium tip and in ASER PCMC. ASER PCMC shows a rounded protrusion, which we consider as a recently excised EV (orange arrowhead). Within AMsh cytoplasm, a GCY-22-wrmScarlet-containing ectosome is located in the vicinity of the ASER PCMC. Few but large GCY-22-wrmScarlet-carying EVs are observed in AMsh cell body. Scale bar: 20 μm in head images, 5 μm in insets.
Figure 4
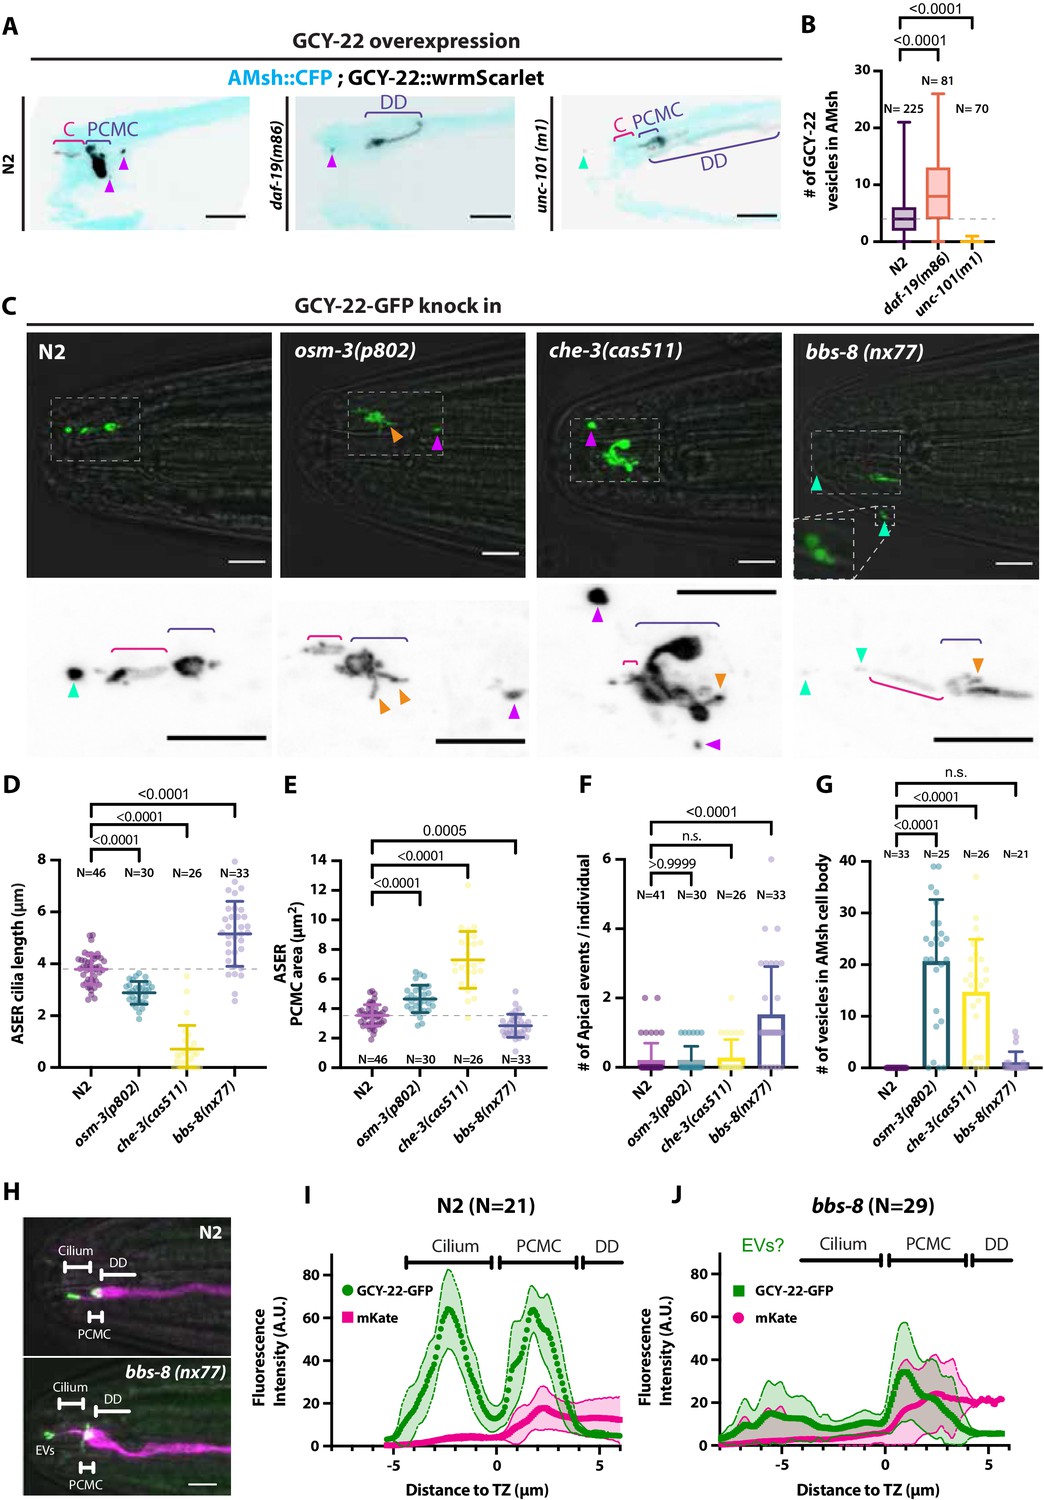
Ectocytosis of GCY-22-wrmScarlet is increased in daf-19, osm-3, che-3, bbs-8 but reduced in unc-101 mutants.
(A) Representative images depicting overexpressed GCY-22-wrmScarlet distribution in ASER ciliary region for N2, daf-19, and unc-101. In N2, overexpressed GCY-22-wrmScarlet accumulated in the cilium (C) and in the periciliary membrane compartment (PCMC); however, it was absent from distal dendrite (DD). In daf-19 mutants, ASER cilium was missing. GCY-22-wrmScarlet accumulated in an elongated ectopic compartment arising from ASER DD, an EV was observed in its vicinity within AMsh cytoplasm (magenta arrowhead). In unc-101 mutants, GCY-22-wrmScarlet was observed weakly along ASER DD membrane, PCMC, and cilium with no enrichment in cilium. The ASER cilium was shorter. We observed one extracellular vesicle (EV) outside the animal (cyan arrowheads). Scale bar: 5 μm. (B) Number of large ectosomes containing GCY-22-wrmScarlet within AMsh cell. Box and whiskers plot represents their median number, the interquartile range, and the min/max values in N2, daf-19, and unc-101. The number of vesicles was increased in daf-19 and decreased in unc-101 mutants. Brown–Forsythe ANOVA, multiple comparisons corrected by Dunnett´s test. (C) In GCY-22-GFP knocked in strain in N2 background, GCY-22-GFP accumulated in the cilium and PCMC. In osm-3, GCY-22-GFP accumulated in ASER PCMC. PCMC shape was disrupted and displayed multiple protrusions (orange arrowheads). We observed more EVs in AMsh in the vicinity of ASER cilium (magenta arrowhead). In che-3, the ASER cilium proper was strongly shortened. GCY-22-GFP strongly accumulated in heavily disrupted PCMC displaying multiple protrusions filled with GCY-22-GFP. In bbs-8 mutants, we observed more EVs in the amphid pore and outside (cyan arrowheads). ASER PCMC displayed abnormal shapes and often display protrusions. Scale bars: 5 μm. (D) The ASER cilium length was evaluated based on GCY-22-GFP staining of the cilium in 2D projections. Cilia length is shortened in osm-3 and che-3 and elongated and variable in bbs-8 mutants. Brown–Forsythe ANOVA, multiple comparisons corrected by Dunnett´s test. (E) PCMC is increased in osm-3 and che-3 and reduced in bbs-8 mutants. Brown–Forsythe ANOVA, multiple comparisons corrected by Dunnett´s test. (F) The number of apical EVs observed in each animals shows apical release occurs in N2, osm-3, and che-3 but is potentiated in bbs-8 mutant. Brown–Forsythe ANOVA, multiple comparisons corrected by Dunnett´s test. (G) The number of EVs observed in AMsh for each animal shows that basal release does not occur in N2. The number of EVs observed AMsh is increased in osm-3 and che-3 mutants. Kruskal–Wallis test, multiple comparisons corrected by Dunn´s test. (H) Fluorescence along the cilia was quantified in animals carrying GCY-22-GFP knock-in in N2 and bbs-8 genetic background and an extrachromosomal for expression of mKate in ASER. Scale bar: 5 μm. (I) Linescans were traced for 21 N2 cilia and aligned on the transition zone based on drop in mKate signal. Average fluorescence standard deviation is plotted for mKate and GCY-22-GFP fluorescence intensities. It shows the accumulation of GCY-22-GFP fluorescence in PCMC and distal cilia. (J) Linescans were traced for 29 bbs-8(nx77) cilia and aligned on the transition zone based on drop in mKate signal. Average fluorescence standard deviation is plotted for mKate and GCY-22-GFP fluorescence intensities. It shows reduced GCY-22-GFP fluorescence along the cilia of bbs-8(nx77) and a highly variable distal cilia, representing elongated cilia, cilia with EVs attached to it, and EV detached from cilia.
Figure 5 with 2 supplements
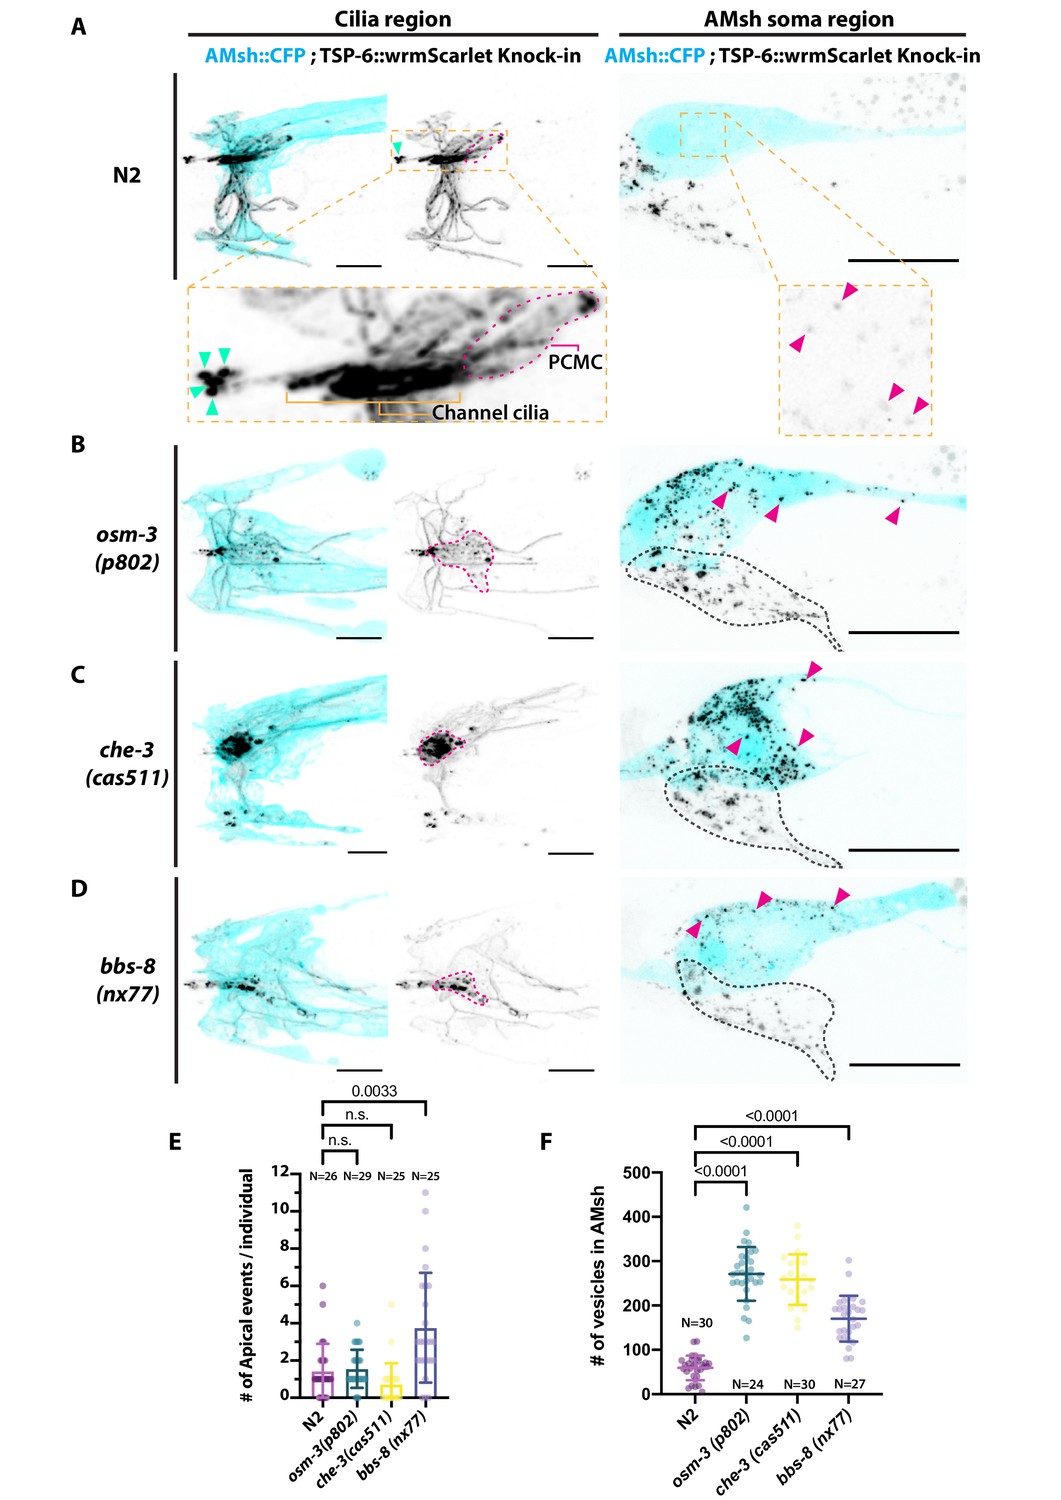
Ectocytosis of TSP-6-wrmScarlet to AMsh is increased in osm-3, che-3, and bbs-8 while ectocytosis of TSP-6-wrmScarlet to the amphid pore and outside is increased in bbs-8.
(A) In TSP-6-wrmScarlet knocked in strain in N2 background, TSP-6-wrmScarlet accumulated in the cilium and periciliary membrane compartment (PCMC) of the channel amphid neurons (Inset) as well as in AWC and AWA cilia. Several extracellular vesicles (EVs) were observed in amphid channel (cyan arrowheads). Left panel, scale bar: 5 μm. TSP-6-wrmScarlet was also observed in EVs located within the AMsh cytoplasm (magenta arrowheads). Right panel, scale bar: 20 μm. (B) In osm-3, TSP-6-wrmScarlet accumulated in PCMCs area (delimited by dashed magenta line). We observed more EVs in AMsh cell body (magenta arrowhead). The location of amphid neurons cell bodies is delimited by a black dashed line. (C) In che-3, TSP-6-wrmScarlet strongly accumulated in PCMCs. We observed more EVs in AMsh cell body (magenta arrowhead). (D) In bbs-8 mutants, we observed more EVs in the amphid pore (cyan arrowheads) and in the AMsh cell body (magenta arrowheads). (E) The number of apical EVs observed in each animals shows that apical release occurs in N2, osm-3, and che-3. Apical release is potentiated in bbs-8 mutants. Brown–Forsythe ANOVA, multiple comparisons corrected by Dunnett´s test. (F) The number of EVs observed in AMsh for each animals shows that TSP-6-wrmScarlet export to AMsh occurs in N2. This number of EVs observed AMsh is increased in osm-3, che-3, and bbs-8 mutants. Brown–Forsythe ANOVA, multiple comparisons corrected by Dunnett´s test.
Figure 5—figure supplement 1
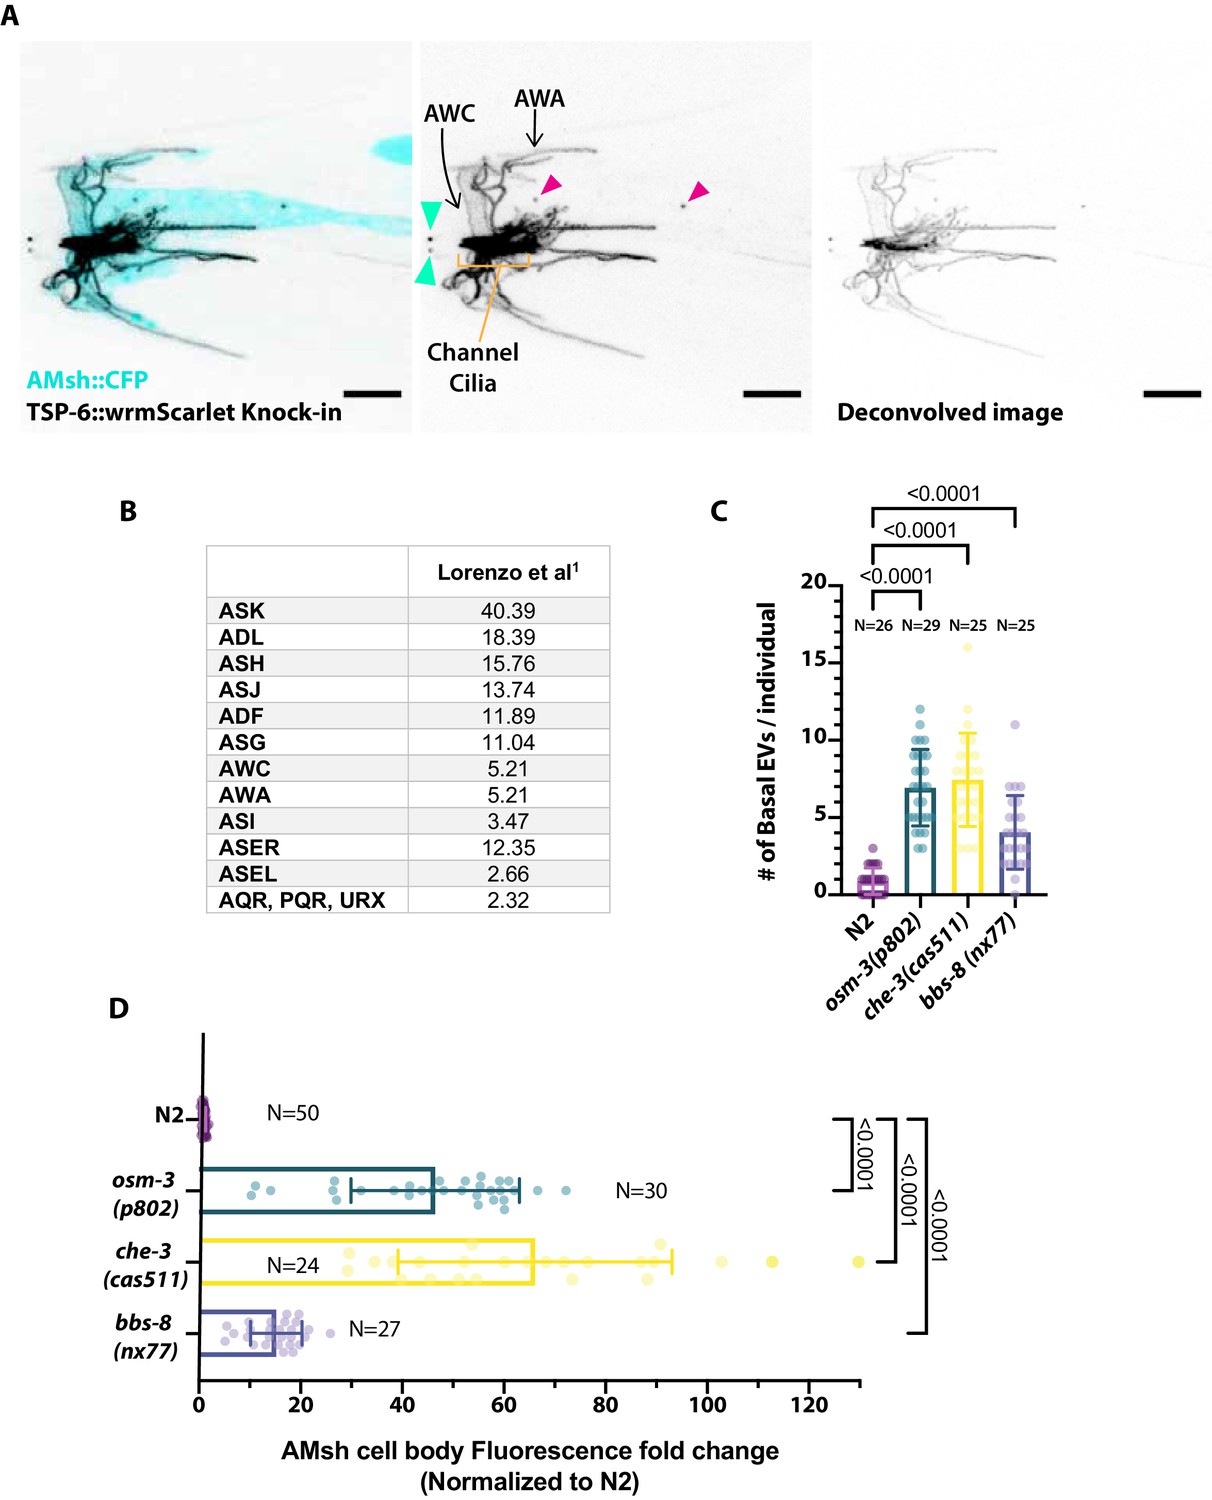
(A) Expression pattern of TSP-6-wrmScarlet in gene-edited strain and export of TSP-6-wrmScarlet to AMsh.
Focusing on the amphid channel area, we observed a strong staining of the amphid channel neurons as well as staining typical of AWA branched cilia and AWC wing cilia. Extracellular vesicles (EVs) released outside (cyan arrowheads) and EVs released to AMsh (magenta arrowheads) are highlighted. (B) Expression of tsp-6 predicted from single-cell RNA sequencing studies (Lorenzo et al., 2020; TPM: transcripts per million) suggests that tsp-6 is expressed strongly in ASK and more weakly in ASJ, ASH, ADL, ADF, ASG, ASI, ASER, AWA, and AWC. (C) Export of TSP-6-wrmScarlet was quantified by counting the number of EVs observed in AMsh close to the cilia region in each animal. It shows the number of EVs observed in distal AMsh is also increased in osm-3, che-3, and bbs-8 mutants compared to N2. Brown–Forsythe ANOVA, multiple comparisons corrected by Dunnett´s test. (D) EV fluorescence intensity within the AMsh region was quantified in each animal and strain. It shows that the total amount of TSP-6-wrmScarlet exported to AMsh is increased in osm-3, che-3, and bbs-8 mutants compared to N2. Brown–Forsythe ANOVA, multiple comparisons corrected by Dunnett´s test.
Figure 5—figure supplement 2
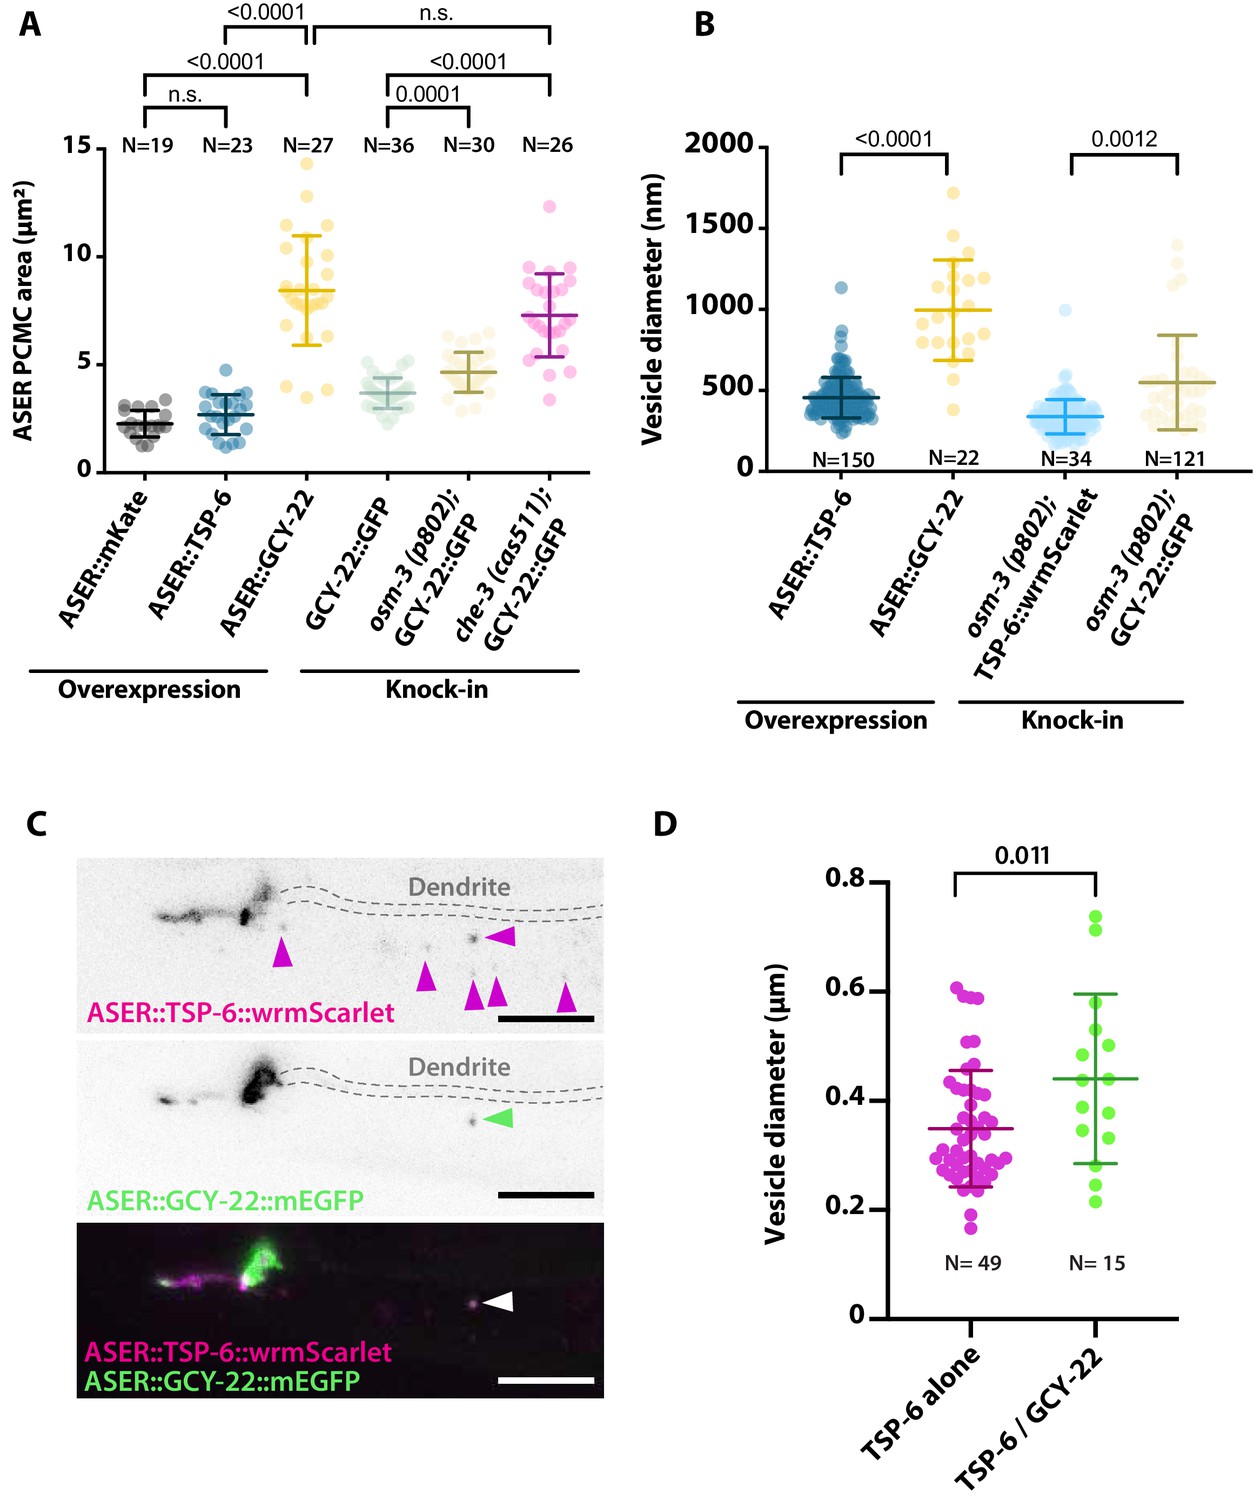
Periciliary membrane compartment (PCMC) and ectosome size are influenced by expression of TSP-6 and GCY-22.
(A) The PCMC area of ASER is enlarged by overexpression of GCY-22-wrmScarlet compared to the overexpression of cytoplasmic mKate or TSP-6-wrmScarlet. The size might be partially influenced by staining of the plasma membrane versus cytoplasm. For comparison, we display ASER PCMC enlargement observed in GCY-22-GFP knock-in strain in osm-3 and che-3 backgrounds. Brown–Forsythe ANOVA, multiple comparisons corrected by Dunnett´s test. (B) The diameter of exported extracellular vesicles (EVs) from ASER differs between TSP-6-wrmScarlet and GCY-22-wrmScarlet-containing vesicles in both overexpression strains and knocked in strains. Vesicles were only measured in the vicinity of ASER cilium. Brown–Forsythe ANOVA, multiple comparisons corrected by Dunnett´s test. (C) ASER cilium co-expressing TSP-6-wrmScarlet and GCY-22-mEGFP showed that both markers were enriched in ASER cilia, but their localization within ASER cilia was poorly correlated (r = 0.378 using Pearson’s coefficient, N = 10). Most of the ASER-derived vesicles observed in AMsh surroundings cilium carried TSP-6-wrmScarlet alone (65%, N = 10 animals, magenta arrowheads), 16% of vesicles carried TSP-6-wrmScarlet together with GCY-22-mEGFP (N = 10 animals, green arrowhead), and the remaining 19% carried GCY-22-mEGFP alone (N = 10 animals). Scale bar: 5 μm. (D) Vesicle diameter differences are observed for vesicles carrying TSP-6-wrmScarlet alone or TSP-6-wrmScarlet together with GCY-22-EGFP. All vesicles in these figures were measured in the vicinity of ASER cilium, representing recent ectocytic events. Unpaired t-test with Welch’s correction.
Figure 6 with 2 supplements
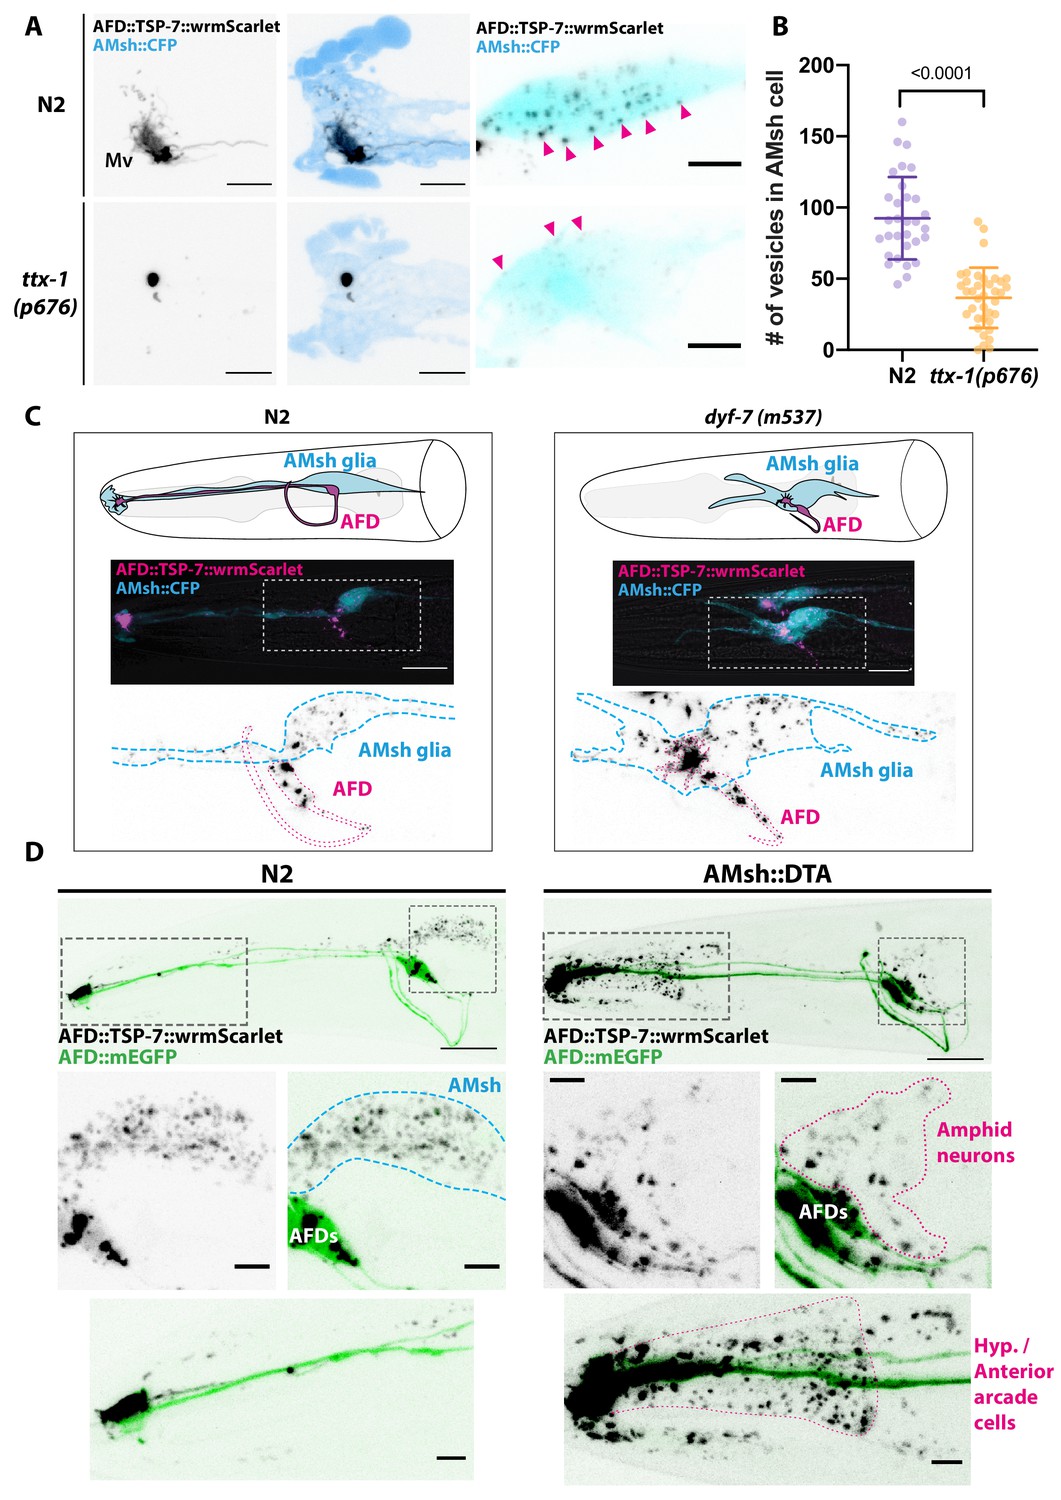
Position and presence of glia are not necessary for extracellular vesicle (EV) production and export to occur.
(A) In ttx-1(p767) mutants, the microvilli (Mv) disappeared but TSP-7-wrmScarlet remained enriched in the remaining AFD distal region. Scale bar: 5 μm. (B) Export of TSP-7-wrmScarlet from AFD to AMsh was quantified by counting the number of EVs exported to AMsh. TSP-7-wrmScarlet export is decreased in ttx-1(p767) mutants. Unpaired t-test. (C) In dyf-7(m537) mutants, TSP-7-wrmScarlet remained enriched in AFD receptive endings although the receptive ending was displaced posteriorly in the animal’s head but still embedded within AMsh. TSP-7-wrmScarlet was still exported to AMsh cell body in a similar manner to wild-type controls. Scale bar: 20 μm. (D) Representative images displaying differential tissue capture of EVs when glia is ablated genetically post-embryogenesis. Animals expressed AFD::mEGFP and AFD::TSP-7-wrmScarlet. TSP-7-wrmScarlet is enriched in AFD receptive end in both experimental conditions. EVs are exported to AMsh in control conditions. In the absence of glia, EVs containingTSP-7-wrmScarlet were still produced but were exported to large cells at the surface of the nose, likely the hypodermal cells. TSP-7-wrmScarlet was also exported to amphid sensory neurons. Scale bar: 20 μm for top head images, 5 μm for insets.
Figure 6—figure supplement 1

In addition to counting extracellular vesicles (EVs) in AMsh, we quantified export of TSP-7-wrmScarlet from AFD to AMsh by extracting the fluorescence of all EVs in AMsh.
(A) The averaged EV fluorescence per animals shows that TSP-7-wrmScarlet export is decreased in ttx-1(p767) mutants. Unpaired t-test with Welch’s correction. (B) The absolute TSP-7-wrmScarlet EV fluorescence per genotype shows an reduced fluorescence intensity of the EV population in ttx-1 mutants. Unpaired t-test with Welch’s correction.
Figure 6—figure supplement 2
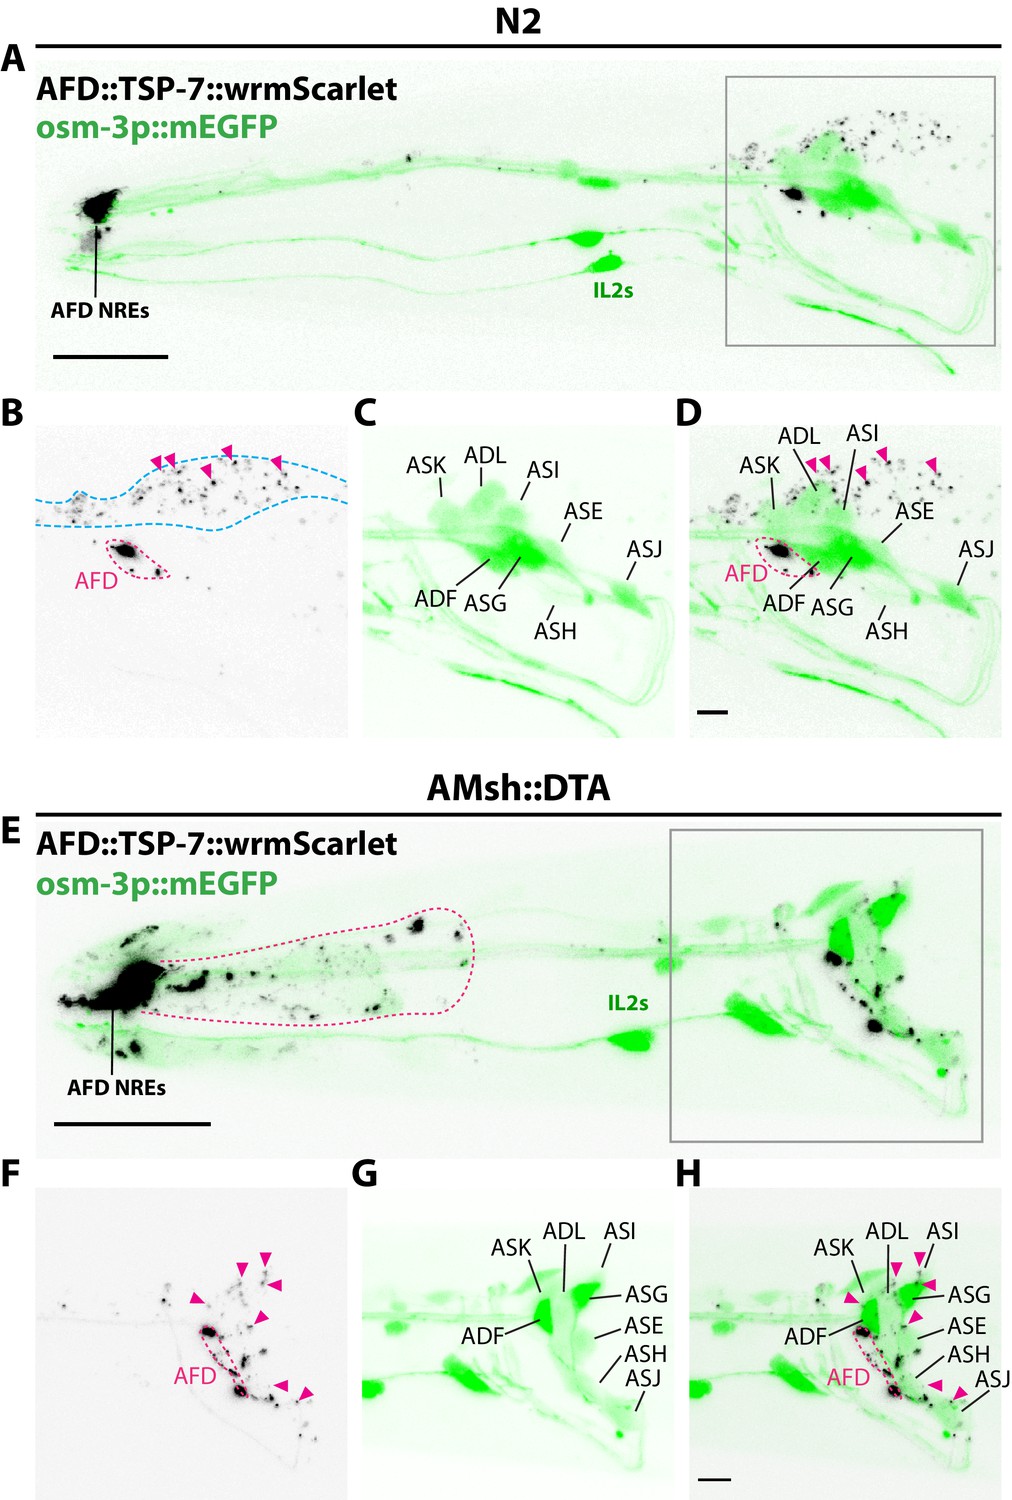
Amphid sheath ablation reroutes intake of extracellular vesicles (EVs) to nearby amphid neurons.
(A–D) Representative images of N2 animals expressing AFD::TSP-7-wrmScarlet and pOsm-3::mEGFP, driving expression in a subset of eight amphid neurons (ADF, ADL, ASE, ASG, ASH, ASI, ASJ, ASK). In wild-type animals, all the EVs exported from AFD (magenta arrowheads) end up in AMsh glia (blue dashed outline). AFD was outlined based on expression intensity of TSP-7-wrmScarlet. (E–H) Representative images of AMsh::DTA animals expressing AFD::TSP-7-wrmScarlet and pOsm-3::mEGFP. When glia is ablated, the EVs released from AFD (magenta arrowheads) are rerouted to nearby cells like hypoderm (magenta outline in E) and several amphid neurons. Overlap of TSP-7-wrmScarlet with GFP in the somata of the osm-3 neuronal subset allowed to confirm the presence of TSP-7-wrmScarlet EVs within ADF, ADL, ASE, ASH, ASI, and ASJ (magenta arrowheads in F–H), although we cannot discard the presence of TSP-7-wrmScarlet in non-mEGFP labeled amphid neurons. Scale bar: 20 μm for top head images, 5 μm for insets.
Figure 7 with 1 supplement

AMsh glia phagocytic activity is required to maintain a proper sensory cilia structure.
(A) We examined ASER cilia shape in N2 and in AMsh::DYN-1(K46A) transgenics animals expressing mKate in ASER. Three categories were made according to ASER cilia shape: animals displaying zero (WT), one, or two filopodia-like protrusions still connected to periciliary membrane compartment (PCMC) (C: cilium; P: filopodial-like protrusion). The percentage of each cilium shape category is given for each genotype. Expression of DYN-1(K46A) transgene in AMsh strongly increased the number of animals showing PCMC protrusions. (B) We examined ASH cilia shape in N2 and in AMsh::DYN-1(K46A) transgenic animals expressing mKate in ASH. Two categories were made according to ASH cilia shape: animals displaying, or not, filopodia-like protrusions still connected to PCMC. AMsh::DYN-1(K46A) strongly increased the number of animals showing PCMC protrusions. (C) We examined AWC wing cilia (WC) with their characteristic membranous expansions in N2 and in AMsh::DYN-1(K46A) transgenics animals expressing DsRed in AWC. Three categories were made according to AWC cilia shape: animals displaying two WC (as wild type), animals displaying one WC and branches instead of the second WC, and animals displaying only branches instead of two WC. In addition, filopodia-like protrusions still connected to PCMC were observed in 11 of 14 AWC animals expressing AMsh::DYN-1(K46A). AMsh::DYN-1(K46A) transgene strongly increased the number of animals showing abnormal AWC cilia; however, AWC cilia was always maintained. (D) Nerve receptive ending (NRE) shape of AFD in N2 and in AMsh::DYN-1(K46A) transgenics expressing mKate in AFD. Five categories were established: wild-type phenotype (WT), abnormal AFD PCMC, abnormal PCMC + elongated microvilli (PCMC + Long Mv), reduced number of microvilli (Less Mv#), and full loss of microvilli (Truncated). AMsh::DYN-1(K46A) transgene strongly increased the number of animals showing abnormal AFD cilia; however, AFD NREs are maintained in 90% of the animals. Scale bar: 5 μm.
Figure 7—figure supplement 1
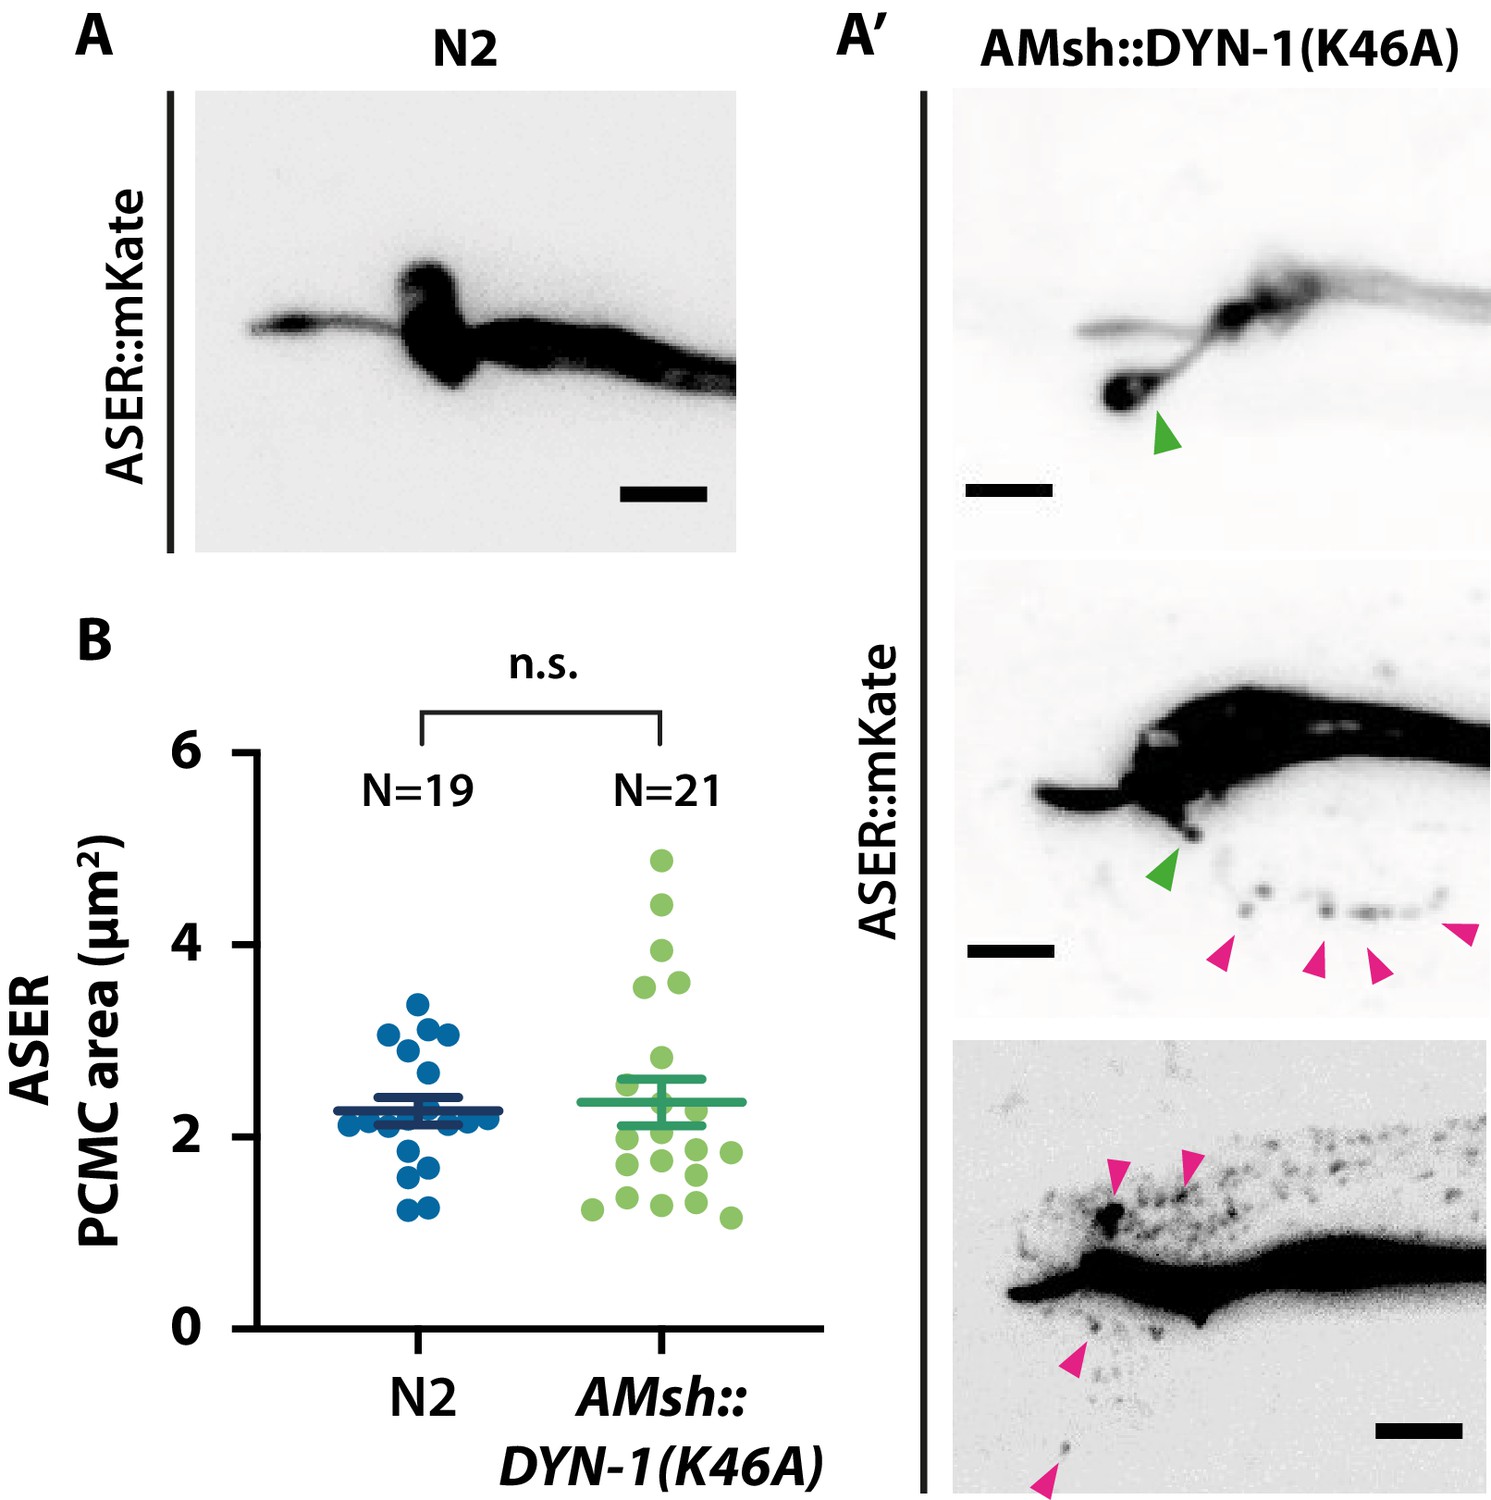
ASER sensory cilia structure is affected when AMsh phagocytic activity is disturbed.
(A) Cilia shape of ASER in transgenics controls expressing cytoplasmic mKate. (A′) Cilia shape of ASER in transgenics expressing cytoplasmic mKate and co-expressing AMsh::DYN-1(K46A). Filopodia-like protrusions can be observed protruding from periciliary membrane compartment (PCMC) (green arrowheads), and the number of ectosomes (magenta arrowheads) within AMsh cytoplasm is increased in the vicinity of ASER cilia in animals expressing AMsh::DYN-1(K46A). (B) The ASER PCMC area was evaluated based on 2D projections. PCMC area is not significantly modified in AMsh::DYN-1(K46A) transgenics. Unpaired t-test with Welch’s correction. Scale bar: 5 μm.
Figure 8 with 1 supplement
AMsh phagocytic activity affects ASER and ASH sensory functions.
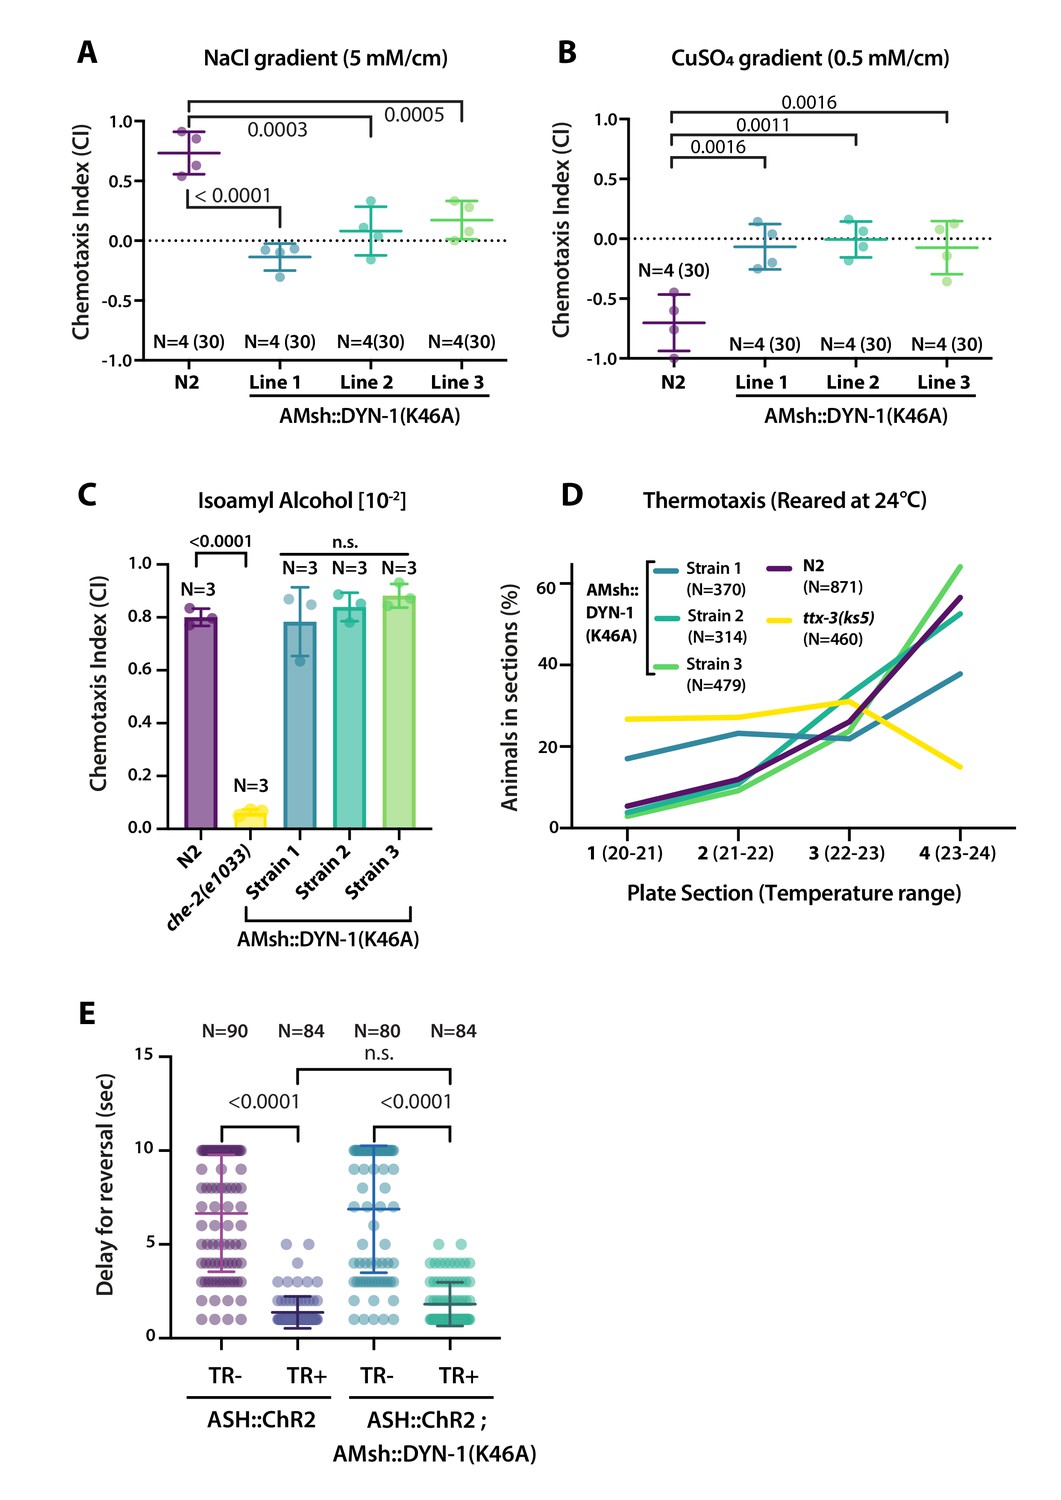
(A) Chemotactic indexes of four independent assays made with 30 N2 or AMsh::DYN-1(K46A) transgenics in linear 5 mM/cm NaCl gradients. The chemoattraction to NaCl was lost in transgenics expressing AMsh::DYN-1(K46A). One-way ANOVA, multiple comparisons corrected by Tukey test. (B) Chemotactic indexes of four independent assays made with 30 N2 or AMsh::DYN-1(K46A) transgenics in linear 5 mM/cm CuSO4 gradients. Animals expressing AMsh::DYN-1(K46A) did not show avoidance behavior to CuSO4. One-way ANOVA, multiple comparisons corrected by Tukey test. (C) Chemotactic indexes of three independent assays made with an average of >100 N2, che-2, or AMsh::DYN-1(K46A) transgenics in a gradient of the volatile attractant isoamyl alcohol (IAA). The top of the gradient was spotted with [10–2] IAA. AMsh::DYN-1(K46A) did not affect IAA chemotaxis. One-way ANOVA, multiple comparisons corrected by Dunnett’s test. (D) Thermotactic behavior in one temperature gradient assays made with >400 N2, ttx-3(ks5) or AMsh::DYN-1(K46A) transgenics. AMsh::DYN-1(K46A) did not consistently affect thermotaxis. (E) Transgenic animals expressing ChR2(H134R) in ASH sensory neurons (ASH::ChR2(H134R); lite-1) exhibit fast reversal (minimum 1–2 backward head swings) in response to blue light exposure (15 mw/mm2). This response was only observed when animals were raised in the presence of trans-retinal (TR+). Control groups were done using the same strain and same stimulation but were raised in the absence of trans-retinal (-TR). Expression of AMsh::DYN-1(K46A) does not modify this avoidance response. Kruskal–Wallis test, multiple comparison corrected by Dunn’s test.
Figure 8—figure supplement 1
Experimental procedure followed for chemotaxis and thermotaxis assays.
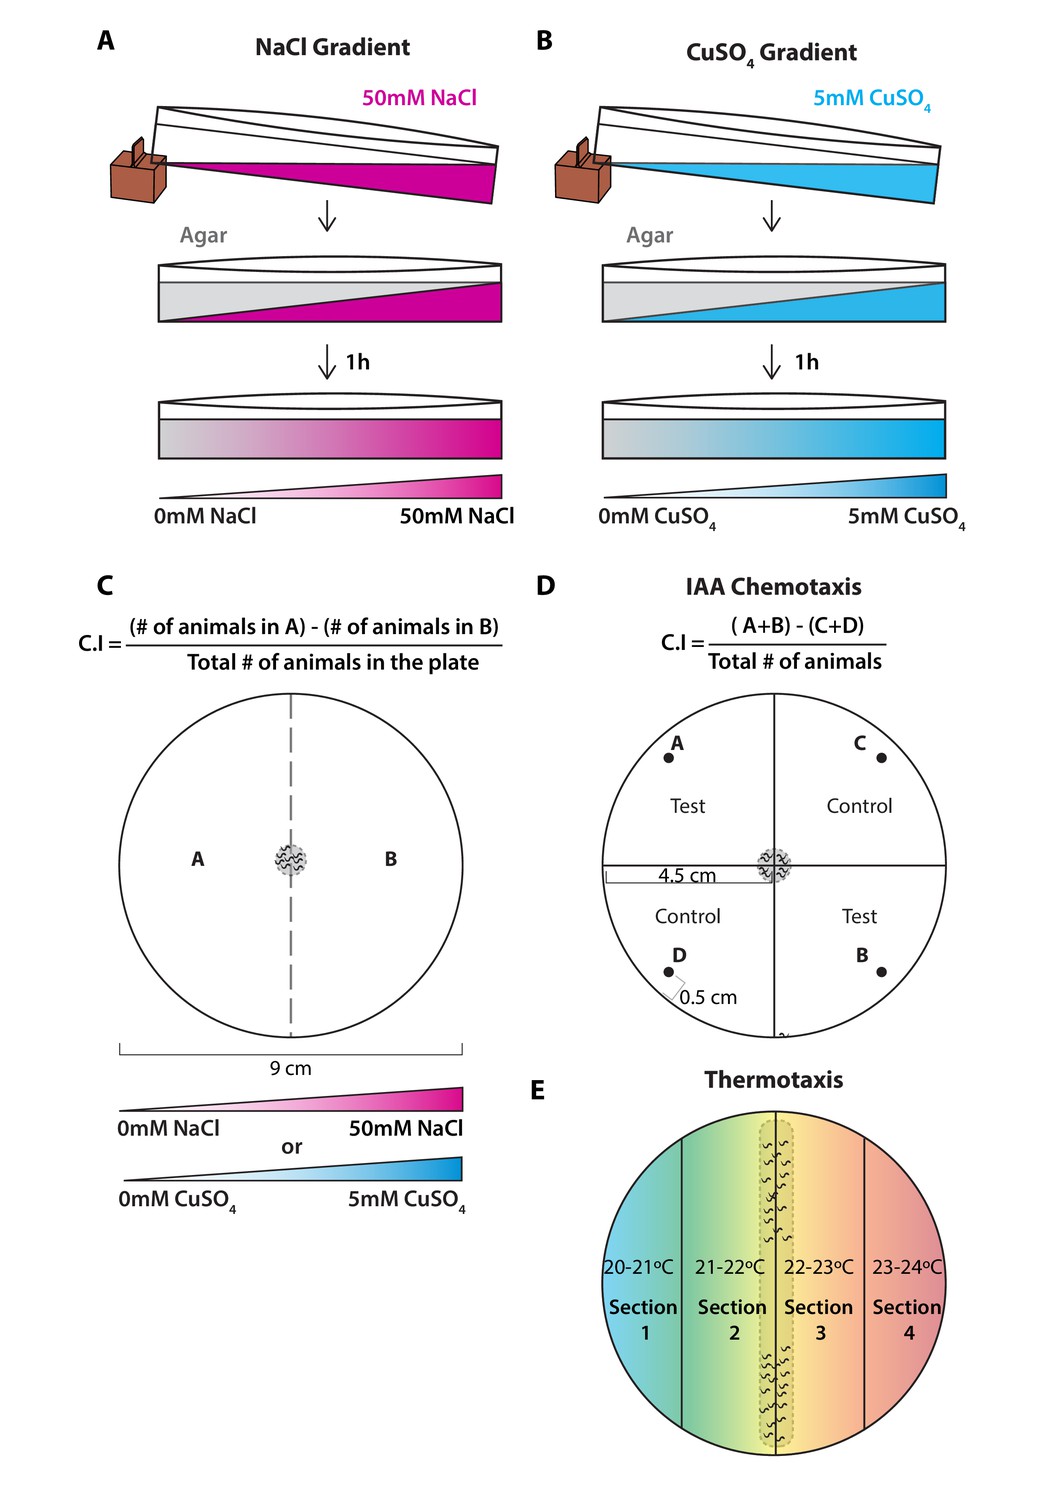
(A) NaCl chemotaxis gradient was generated by juxtaposition of two layers of agar solution, the bottom layer contained 50 mM NaCl and the top layer did not contain NaCl, effectively creating a 5 mM/cm linear gradient. (B) CuSO4 chemotaxis gradient was generated by juxtaposition of two layers of agar solution, the bottom layer contained 5 mM CuSO4 and the top layer did not contain CuSO4, effectively creating a 0.5 mM/cm linear gradient. (C) Scoring method used for both chemotaxis assays to soluble chemicals. Animal position was marked on the plate when the assay finished, then chemotaxis indexes (C.I.) were scored according to the formula shown above. (D) Scoring method used for chemotaxis to volatile odorant isoamyl alcohol (IAA). Animal position was marked on the plate when the assay finished, then chemotaxis indexes (C.I.) were scored according to the formula shown above. Spots A and B correspond to the test spots (IAA [10–2]) and spots C and D to the control spots (EtOH). Spot position was defined at 0.5 cm away from the plate edge. Animals were placed in the landing zone (gray dashed circle in the center), those that did not leave the landing zone were excluded from the scoring. (E) Thermotaxis assay was done in 9 cm plates divided into four sections each corresponding to an increasing temperature from left to right. Animals were initially positioned in the landing zone, indicated by a gray dashed rectangle in the center and allowed to navigate through the thermotactic gradient.
Figure 9

Mechanisms underlying ectocytosis from ciliated neurons.
Ectocytosis occurs from two different ciliary locations: the cilia tip and the periciliary membrane compartment (PCMC). When ectosomes are shed from the cilia tip, they are environmentally released. Sheath glia (light blue) embeds the ciliary base of ciliated neurons, when ectosomes bud from the base they are concomitantly phagocytosed by their associated sheath glia. Overexpression of ciliary membrane proteins or mutations in genes involved in cilia trafficking, like osm-3, bbs-8, and che-3, fail to balance import and removal of ciliary membrane proteins, leading to local accumulation of cargo in cilia proper and/or to PCMC. It results in increased ectocytosis events to the sheath glia in osm-3 and che-3 and/or to the outside in bbs-8. On the contrary, reduced cilia import of ciliary membrane protein in unc-101 – involved in sorting cilia cargo from Trans Golgi Network – reduced ectocytosis. Besides its crucial role in secretion of extracellular matrix content, we suggest that glia also plays an important function to maintain cilia structure and composition and to recycle ectocytosed material. Cell-specific manipulations of AMsh glia phagocytic activity by expression of DYN-1 dominant negative transgene suggest that a tight regulation of sheath glia phagocytosis contributes to shape the nerve receptive endings. We suggest a model where apical ectocytosis is inherent to most or all ciliated neurons of C. elegans and where neurons and glia cooperate to readily remove basal ectosome from ciliary membranes when cargoes accumulate in PCMC (magenta).
Author response image 1
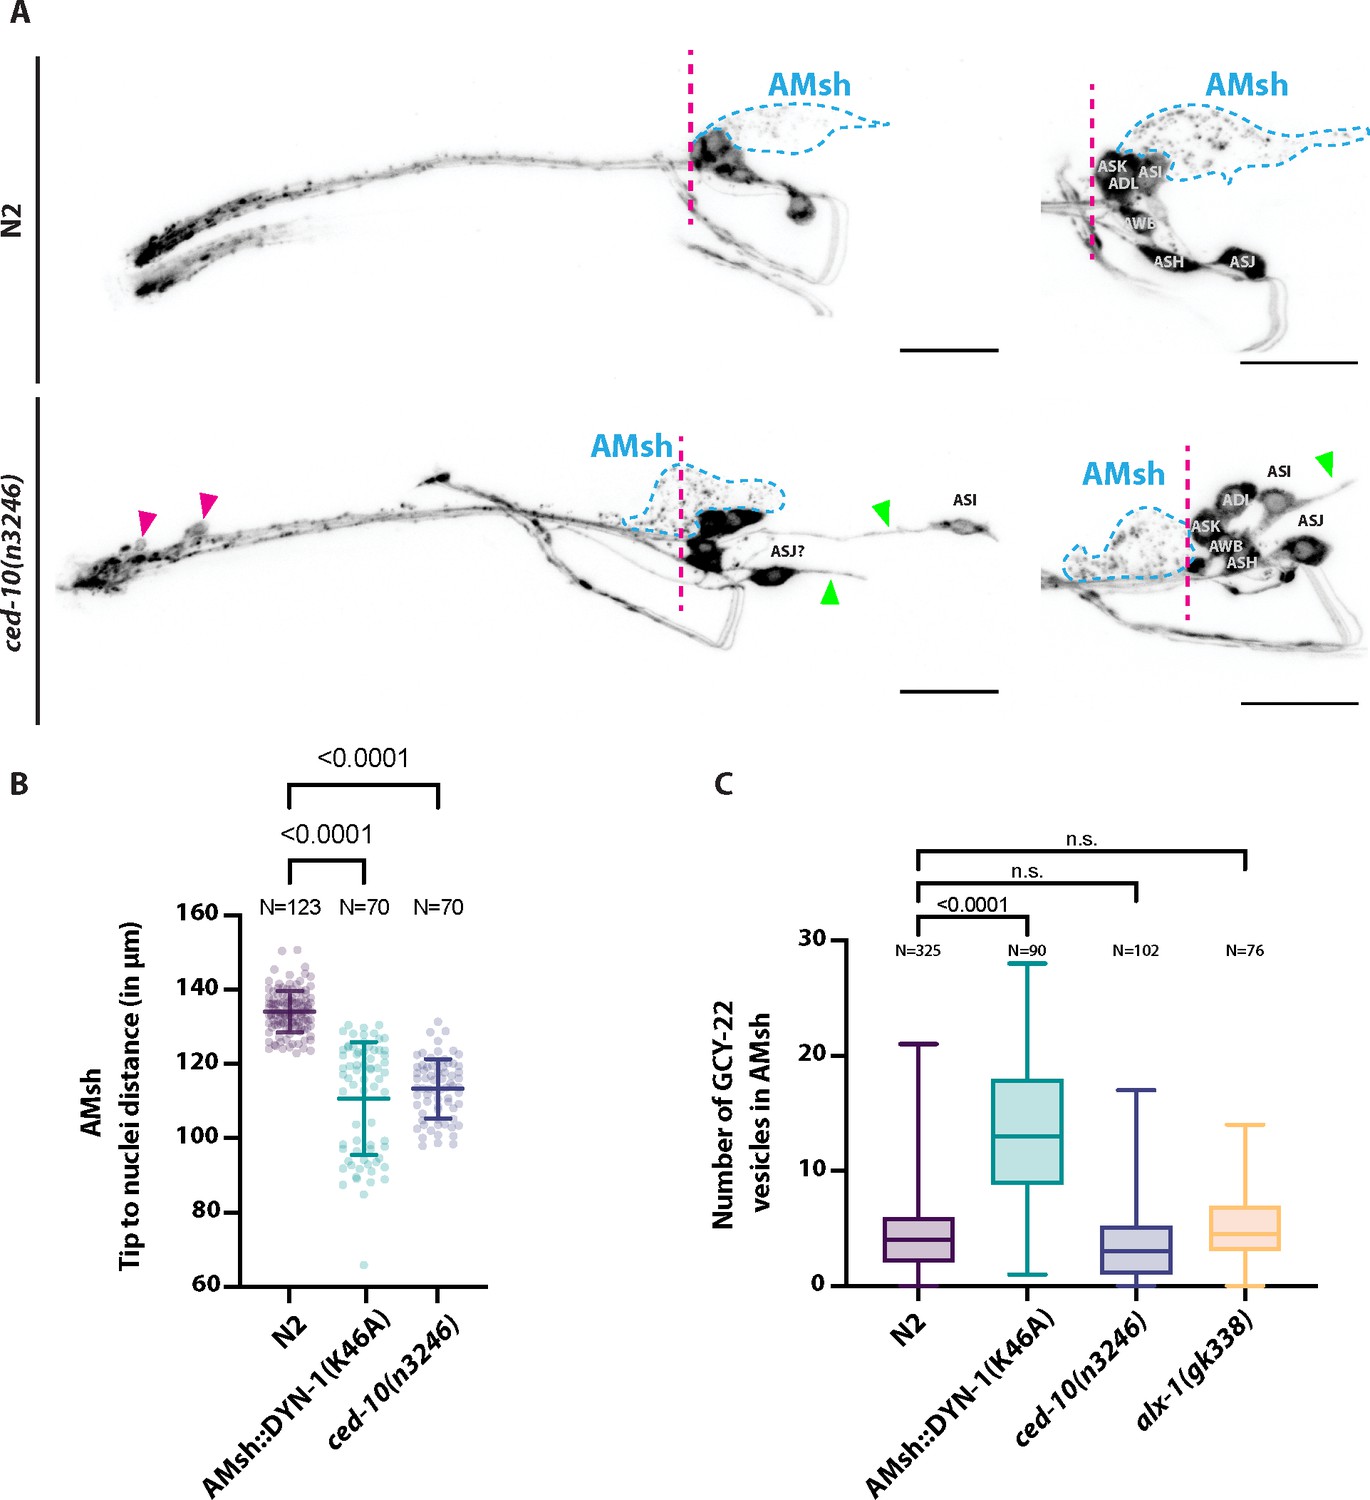
(A) DiI filling experiments were performed for controls and ced-10(n3246).
ced-10(n3246) did not affect neuronal uptake of DiI nor the DiI export from ciliated neurons to AMsh glia. AMsh cell body position (dashed line is aligned to the position of the head ganglia) and projections (green arrows) are modified in ced-10(n3246) mutants. In ced-10(n3246), neurons identified as ASI and ASJ are displaced posteriorly and/or show abnormal neurite extensions (B) The AMsh cell body position relative to the nose tip of the animals was measured for AMsh::DYN-1(K46A) and for ced-10(n3246). (C) We quantified the number of GCY-22-wrmScarlet carrying vesicles within AMsh in animals overexpressing GCY-22-wrmScarlet in ASER. Their number was increased in animals expressing AMsh::DYN-1(K46A) compared to controls. ced-10(n3246) and alx-1(gk338) did not modify the number of GCY-22-wrmScarlet carrying vesicles in AMsh.
Videos
Video 1
Extracellular vesicles (EVs) are released from the DiI-uptaking amphid neurons and are captured by the surrounding glia.
An animal expressing AMsh cytoplasmic CFP and stained with DiI was immobilized with 10 mM tetramisole and recorded during approximately 8 min. Membrane fragments become detached from ciliary regions; these DiI-carrying vesicles are sequentially trapped by glial cells (orange arrows). Dashed arrow indicates directional flow of vesicles towards AMsh cell body. AMsh ‘pocket’ is indicated and contains multiple already-exported vesicles. Scale bar: 5 μm.
Video 2
Apical ectosomes are released from the cilia tip of IL2.
An animal expressing cytoplasmic mEGFP and TSP-7-wrmScarlet in IL2 neurons was immobilized with 10 mM tetramisole and recorded during approximately 3 min. Two ectosomes grow from the cilia tip (yellow arrowheads), displayed ectosomes carry only mEGFP. Scission events occur at t = 160 s and t = 167 s. Scale bar: 5 μm.
Video 3
Apical ectosomes are released from the cilia tip of IL2.
An animal expressing cytoplasmic mEGFP and TSP-7-wrmScarlet in IL2 was immobilized with 10 mM tetramisole and recorded during approximately 3 min. Dynamics of a large distal ectosome (yellow arrow) growing from IL2 cilia tip carrying both mEGFP and TSP-7-wrmScarlet until the scission event occurs (at t = 164 s). Scale bar: 5 μm.
Video 4
Basal ectosomes are released from the periciliary membrane compartment (PCMC) of IL2s.
An animal expressing cytoplasmic mEGFP and TSP-7-wrmScarlet in IL2 neurons was immobilized with 10 mM tetramisole and recorded during 101 s. Basal ectosomes (yellow arrows) are released and flow towards the IL2 sheath/socket glia cell bodies. An already released apical ectosome can be observed attached to the animal’s nose (green arrowhead). Scale bar: 5 μm.
Video 5
Basal ectosomes are released from the periciliary membrane compartment (PCMC) of ASER.
An animal expressing TSP-6-wrmScarlet in ASER was immobilized with 10 mM tetramisole and recorded for 365 s. Small-sized ectosomes carrying TSP-6-wrmScarlet are released from ASER PCMC (yellow arrowhead), the released ectosomes are directed towards AMsh cell body (blue, CFP cytoplasmic expression, dashed arrow indicates directionality towards AMsh cell body). Scale bar: 5 μm.
Video 6
Budding of basal ectosomes containing GCY-22-wrmScarlet originating from ASER cilium.
An animal expressing GCY-22-wrmScarlet in ASER was immobilized with 10 mM tetramisole and recorded during 12 min. The acquisition plane corresponds to ASER periciliary membrane compartment (PCMC), for informative purposes ASER cilium location is indicated. Large basal ectosomes (∼1 μm diameter) carrying GCY-22-wrmScarlet (magenta) are observed being released from the PCMC of ASER, released material ends up in AMsh cell (blue, AMsh::CFP cytoplasmic expression). GCY-22-wrmScarlet channel is shown in inverted LUT on the left. Scission events occur at t = 4 s and t = 348 s (orange arrow indicates the start of each scission events). Scale bar: 5 μm.
Video 7
Budding of apical ectosomes containing GCY-22-GFP originating from ASER cilia tip.
Four examples of bbs-8(nx77) mutants expressing endogenously GCY-22-GFP. Each animal was immobilized with 10 mM tetramisole and recorded between 30 s and 4.5 min. Ectosomes shed continuously from ASER cilia tip (orange arrowheads) are sequentially released to the environment. Scale bar: 5 μm.
Video 8
Budding of apical ectosomes containing TSP-6-wrmScarlet originating from one or several cilia of ASK, ADF, ASJ, ASI, and ASH.
An animal expressing endogenous TSP-6 levels (tsp-6:wrmScarlet knock-in strain) was immobilized with 10 mM tetramisole and recorded during approximately 2,5 min. Ectosomes shed continuously from the cilia tip (white arrowheads) and are trapped within the pore channel occasionally being released to the environment. Scale bar: 5 μm.
Video 9
AFD microvilli fragments are released and subsequently captured by AMsh glia.
An animal expressing TSP-6-wrmScarlet in AFD was immobilized with 10 mM tetramisole and recorded during approximately 8 min. Microvilli tips sometimes get detached from AFD nerve receptive endings (NREs) and are subsequently captured by AMsh (blue, AMsh::CFP cytoplasmic expression). Scission events occur at t = 125 s (yellow arrowhead indicates the start of the scission event). Scale bar: 5 μm.
Additional files
-
Supplementary file 1
List of strains, plasmids, and primers used in this study.
- https://cdn.elifesciences.org/articles/67670/elife-67670-supp1-v2.docx
-
Transparent reporting form
- https://cdn.elifesciences.org/articles/67670/elife-67670-transrepform1-v2.docx
-
Source data 1
Source data related to this study.
- https://cdn.elifesciences.org/articles/67670/elife-67670-supp2-v2.zip
Download links
A two-part list of links to download the article, or parts of the article, in various formats.
Downloads (link to download the article as PDF)
Open citations (links to open the citations from this article in various online reference manager services)
Cite this article (links to download the citations from this article in formats compatible with various reference manager tools)
Ectocytosis prevents accumulation of ciliary cargo in C. elegans sensory neurons
eLife 10:e67670.
https://doi.org/10.7554/eLife.67670


