Neural excitability and sensory input determine intensity perception with opposing directions in initial cortical responses
- Department of Neurology, Max Planck Institute for Human Cognitive and Brain Sciences, Germany
- International Max Planck Research School NeuroCom, Germany
- Machine Learning Group, Technical University of Berlin, Germany
- Berlin School of Mind and Brain, Humboldt-Universität zu Berlin, Germany
- Clinic for Cognitive Neurology, University Hospital Leipzig, Germany
- Institute for Cognitive Neuroscience, National Research University Higher School of Economics, Russian Federation
Figures
Figure 1
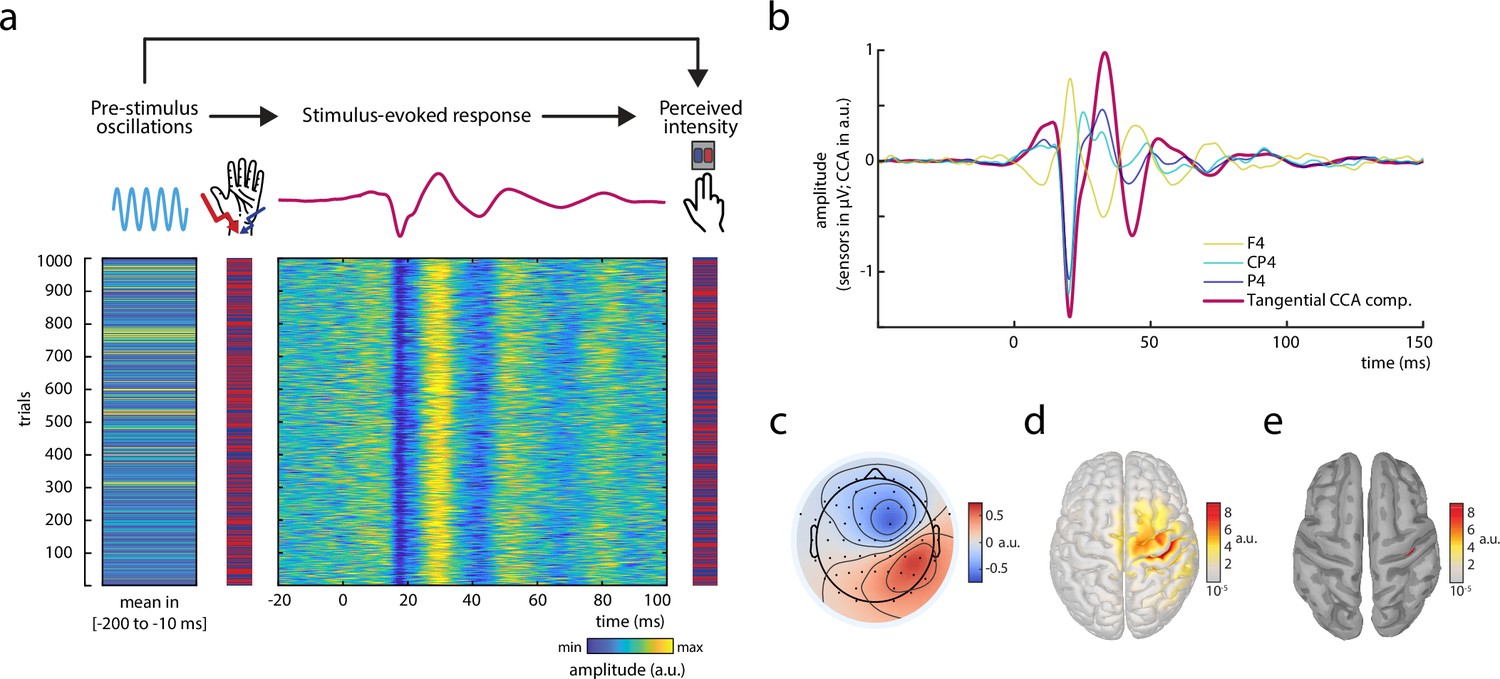
Experimental paradigm and main electrophysiological measures.
(a) The relationships between pre-stimulus alpha oscillations, stimulus-evoked responses, and perceived intensity of somatosensory stimuli were examined in a continuous sequence of median nerve stimuli of two intensities with inter-stimulus intervals of ISI = 1513 ± 50 ms. After every stimulus, participants were to rate the perceived intensity as either ‘strong’ or ‘weak’ as fast as possible by button press. The raster plots represent the data of an exemplary subject with the rows corresponding to single trials. Displayed from left to right: Average pre-stimulus alpha amplitude, intensity of the presented stimuli (red = strong; blue = weak intensity), short-latency somatosensory evoked potentials (SEPs), and the perceived intensity as reported by the participants (red = strong; blue = weak intensity). Alpha activity and the SEP were both retrieved from the same tangentially oriented canonical correlation analysis (CCA) component (displayed in panels b–e) and hence reflect activity of the same neuronal sources. (b) Grand average of the SEP (N = 32) in sensor space (electrodes F4, CP4, and P4) and for the tangential CCA component as derived from the single-trial extraction approach using CCA. (c) Activation pattern of the tangential CCA component displaying a tangential dipole contralateral to stimulation site over the central sulcus which is typical for the N20-P35 complex of the SEP. Averaged across participants (N = 32). (d) Neuronal sources (absolute values) underlying the activation pattern of the tangential CCA component, reconstructed using eLoreta inverse modeling. Averaged across participants (N = 32). (e) Same as d but applying an amplitude threshold of 95% in order to indicate the strongest generators of neural activity (displayed on a smoothed cortex surface).
Figure 2 with 3 supplements

Bivariate relationships between pre-stimulus alpha amplitude, N20 peak amplitude, and perceived stimulus intensity.
(a) Time course of the amplitude of pre-stimulus alpha band activity (8–13 Hz) displayed by behavioral response categories. Note that for statistical analyses, pre-stimulus epochs were cut at –5 ms relative to stimulus onset before filtering the data in the alpha band (8–13 Hz), in order to prevent contamination of the pre-stimulus window by stimulus-related activity. (b) Change in perception bias (i.e., signal detection theory [SDT] parameter criterion c) from the lowest to the highest alpha amplitude quintile (as measured between –200 and –10 ms). (c) Somatosensory evoked potential (SEP) derived from the tangential component of the canonical correlation analysis (CCA), sorted with respect to pre-stimulus alpha amplitude quintiles. Alpha quintiles were sorted in ascending order (i.e., first quintile = lowest alpha amplitude). (d) SEP (tangential CCA component) sorted according to behavioral response categories. (e) Change in perception bias (i.e., SDT parameter criterion c) from the most to the least negative N20 peak amplitude quintile. All panels show the grand average across all participants (N = 32). Shaded areas in panels a, c, and d, as well as error bars in panels b and e correspond to the standard errors of the mean based on the within-subject variances (Morey, 2008). Transparent circles in panels b and e reflect data of individual participants while black lines reflect the arithmetic mean on group level. Please refer to Figure 2—figure supplement 1 for a schematic of SDT, to Figure 2—source data 1 for details on the trial overlap between SDT analyses of pre-stimulus alpha activity and N20 amplitudes, to Figure 2—figure supplement 2 for time-frequency representations of the observed effects, and to Figure 2—figure supplement 3 for further control analyses using simulated SEP data.
-
Figure 2—source data 1
Trial overlap between extreme bins of N20 and pre-stimulus alpha amplitudes used for the SDT analyses.
Trial overlap between extreme bins of N20 and pre-stimulus alpha amplitudes used for the SDT analyses.
- https://cdn.elifesciences.org/articles/67838/elife-67838-fig2-data1-v2.pdf
Figure 2—figure supplement 1
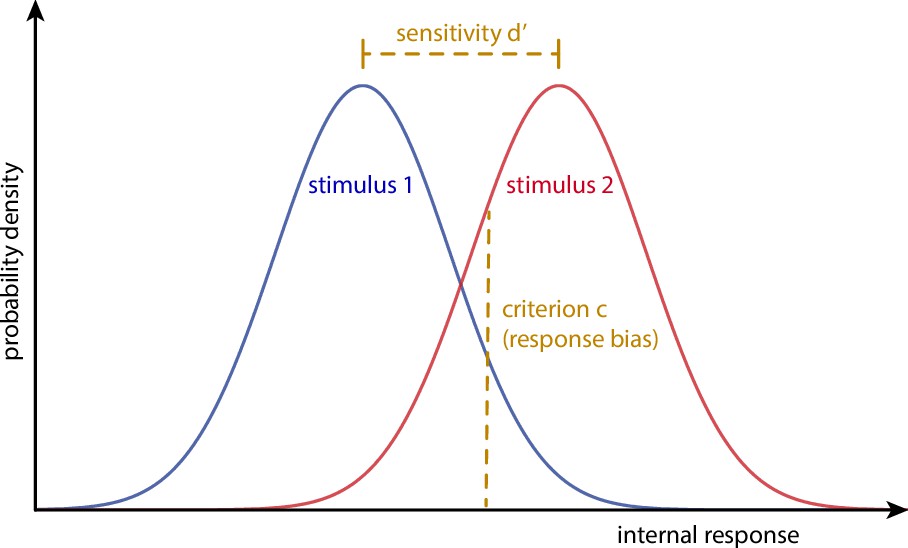
Schematic of the signal detection theory parameters sensitivity d’ and criterion c.
While sensitivity d’ describes the distance between the distributions of the internal responses to two distinct stimuli, criterion c reflects a general threshold above which any internal response is interpreted as stimulus 2. Thus, sensitivity d’ quantifies the ability to discriminate the two stimuli and criterion c corresponds to a stimulus-independent response bias.
Figure 2—figure supplement 2
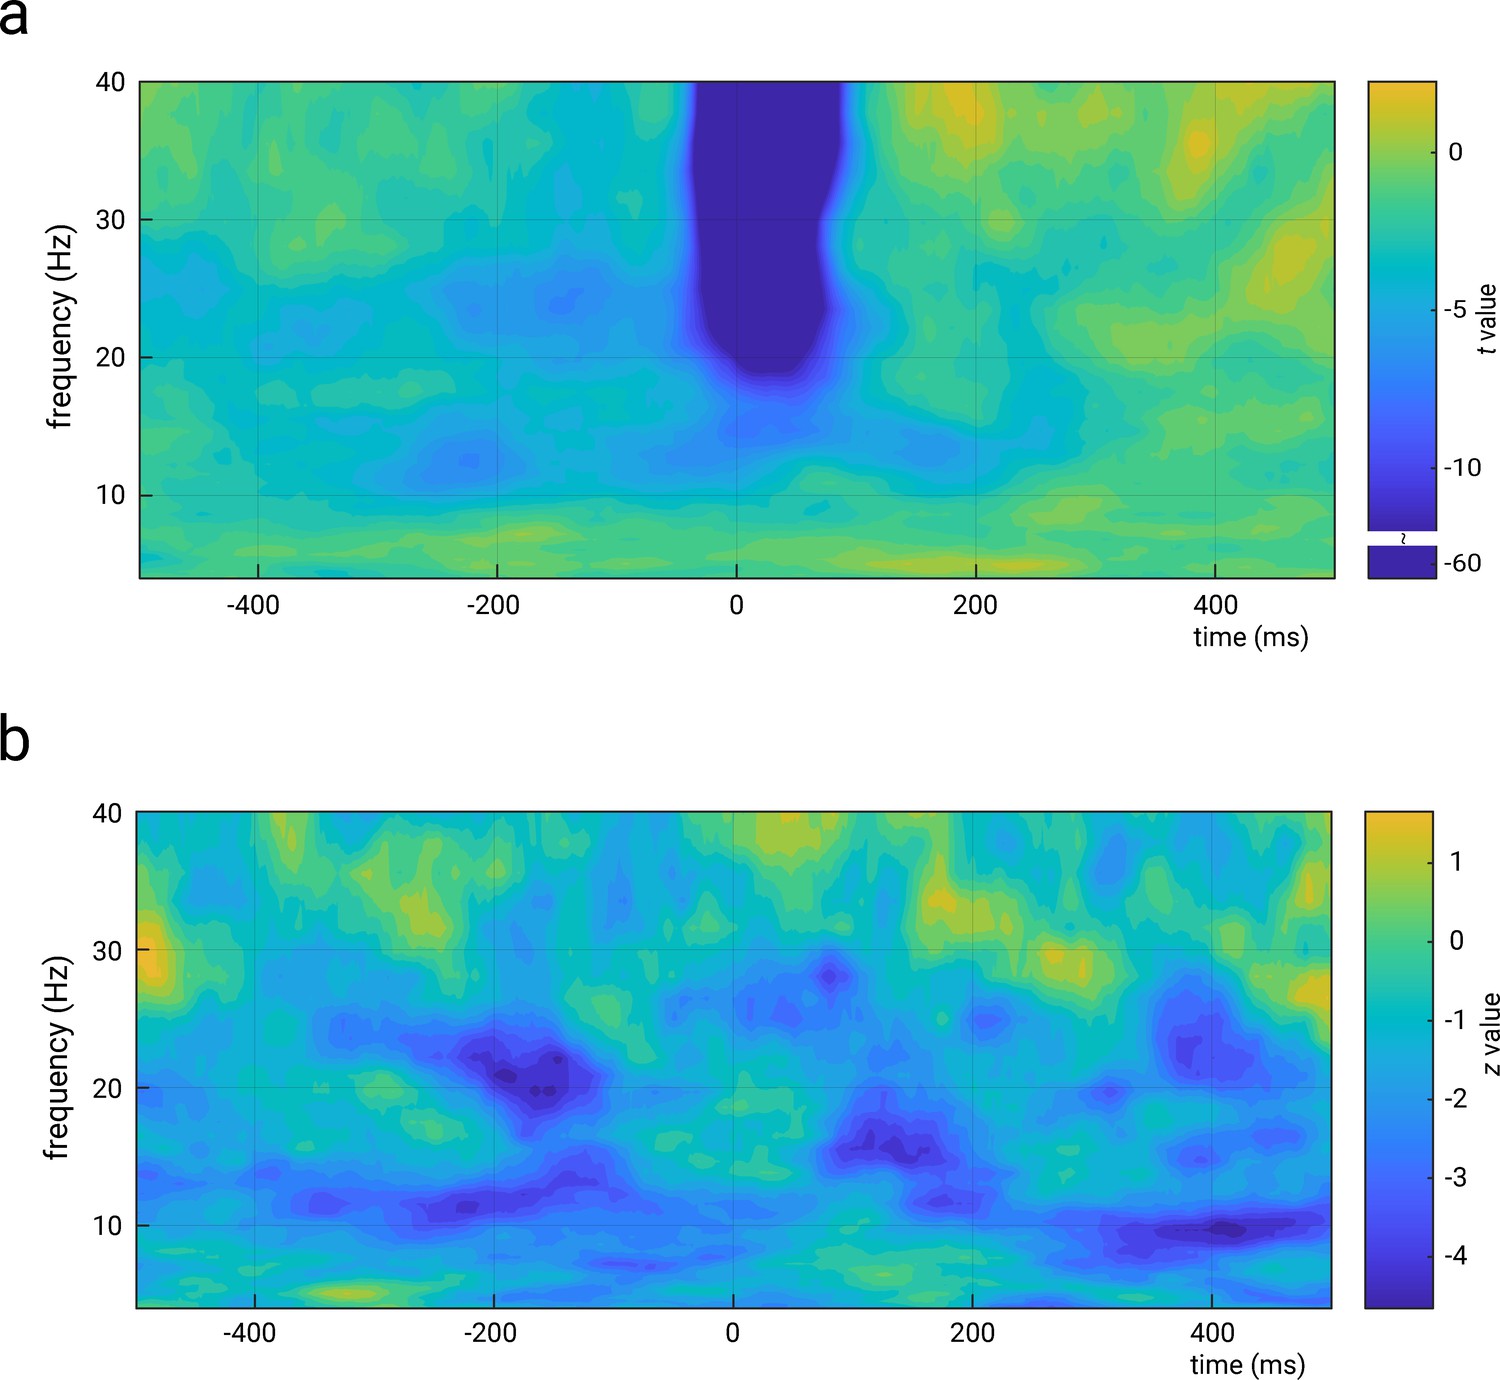
Representation of the relations between amplitude in the time-frequency domain and N20 amplitudes (panel a), as well as perceived stimulus intensity (panel b).
Both panels show unthresholded statistical values (t values in panel a and z values in panel b) of the effects of predictor t-f amplitude as calculated from random-intercept linear-mixed effects models of the forms: N20 amplitude ~ 1 + stimulus intensity + t f amplitude + (1|subject) and perceived intensity ~ 1 + stimulus intensity + t f amplitude + (1|subject), respectively. Please note that time-frequency amplitudes correspond here to the ‘total’ activity, that is, both evoked and induced activity, which explains the strong effects around the N20 peak latency in higher frequencies in panel a. The time-frequency decomposition was performed using complex Morlet wavelets from 4 to 40 Hz (3–10 cycles, logarithmically scaled). Please note the discontinued color bar for values above t = –12 in panel a (for visualization of the t value range of interest).
Figure 2—figure supplement 3
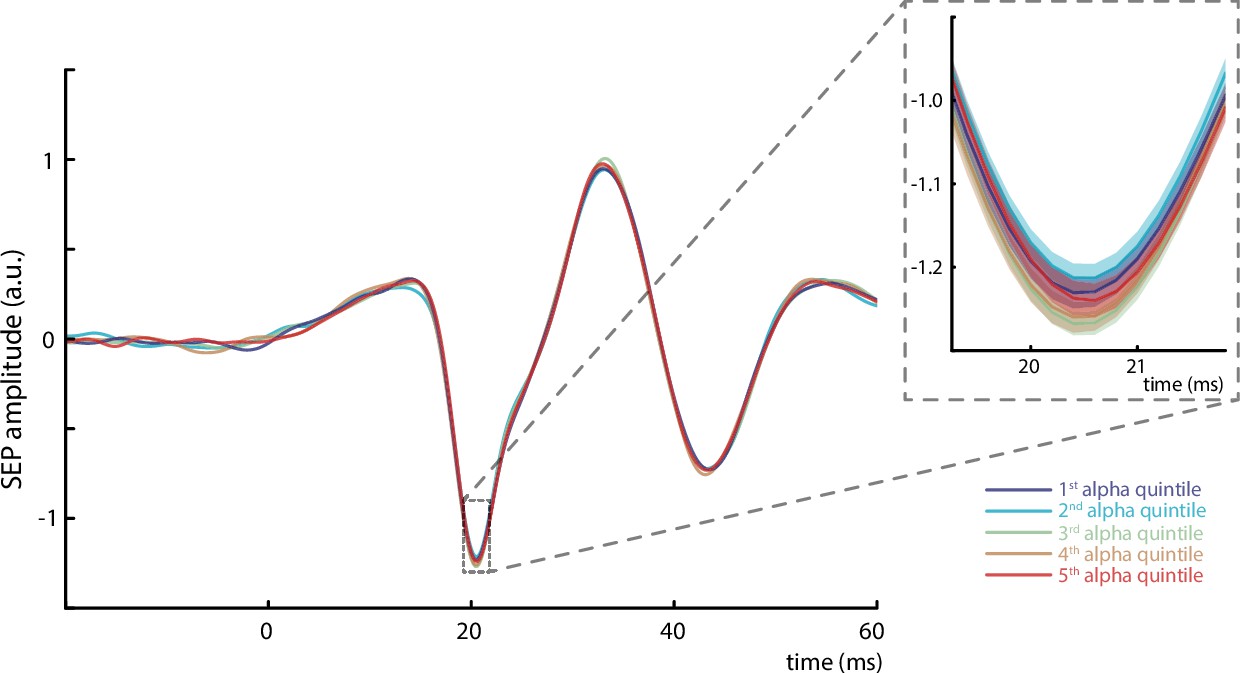
Simulation of filter effects on the relation between pre-stimulus alpha amplitude and early somatosensory evoked potential (SEP).
In order to exclude the possibility that the observed effects emerged due to data processing-related issues (such as filter artifacts or residual activity leaking in or from the alpha frequency band), we repeated our analysis pipeline with simulated data. For this, we mixed exemplary SEP responses with constant amplitudes (unfiltered; derived from within-participant averages), with simulated alpha band activity with randomized amplitude fluctuations, and pink noise, reflecting neural background activity as is typical for the human electroencephalogram. The SEP onsets were chosen according to our original experimental paradigm with inter-stimulus intervals of 1513 ms and a jitter of ±50 ms. Next, we filtered these mixed signals between 30 and 200 Hz in order to extract the single-trial SEPs, and estimated the pre-stimulus alpha amplitudes between –200 and –10 ms in the same way as was done in the analysis of the empirical data (i.e., by filtering the mixed signal between 8 and 13 Hz). This procedure was repeated for 32 generated data streams, containing 1000 SEPs each (corresponding to our empirical dataset of 32 participants). The resulting average SEPs did neither show a visually detectable effect across the five alpha amplitude quintiles nor indicated a random-slope linear-mixed-effects model any relation between pre-stimulus alpha amplitude and N20 amplitude on a single-trial level, βfixed = –0.0005, t(255.16) = –0.094, p = 0.925. Average plotted for all 32 simulated data streams containing 1000 SEPs each. Shaded areas in the inlay panel correspond to the standard errors of the mean based on the within-subject variances (Morey, 2008).
Figure 3
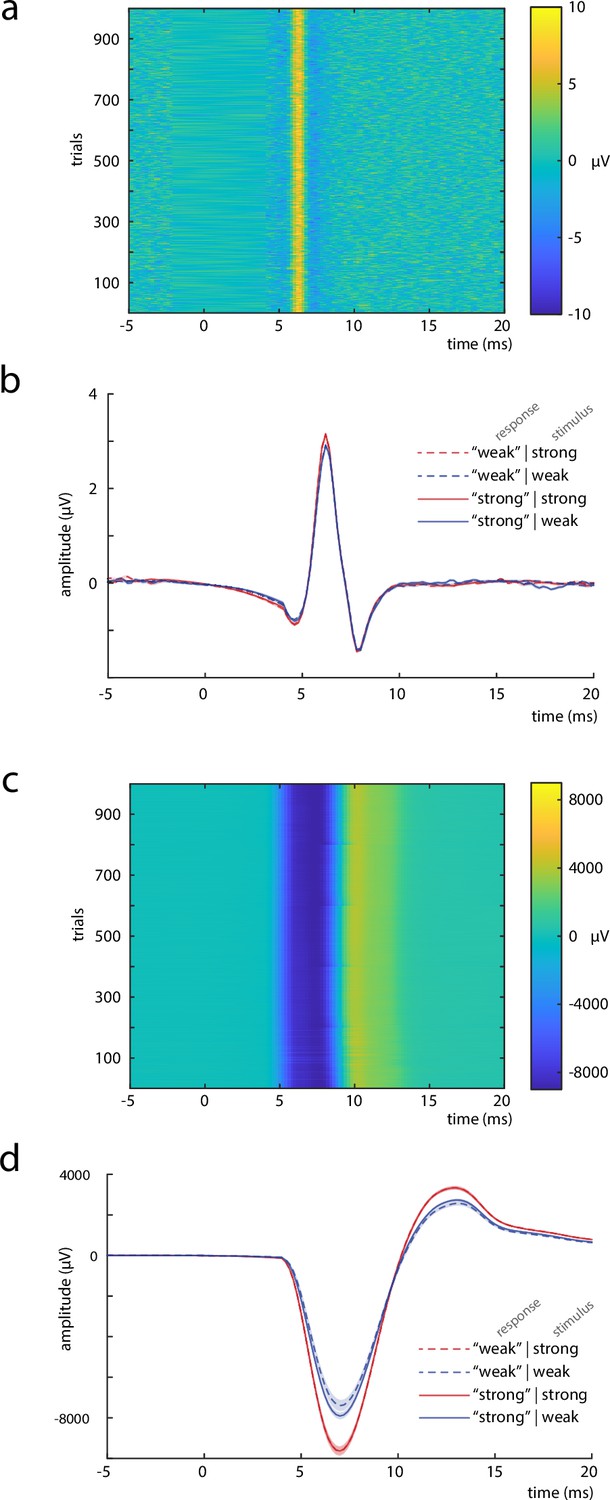
Measures to control for peripheral nerve variability.
(a) Single trials of the compound nerve action potential (CNAP) in response to the median nerve stimuli, measured at the inner side of the ipsilateral upper arm (shown for an exemplary subject). (b) Grand average across participants (N = 32) of the CNAP, displayed by stimulus and response types. (c) Single trials of the compound muscle action potential (CMAP), measured at the M. abductor pollicis brevis (shown for an exemplary subject). (d) Grand average across participants (N = 32) of the CMAP, displayed by stimulus and response types. Shaded areas in panels b and d correspond to the standard errors of the mean based on the within-subject variances (Morey, 2008).
Figure 4
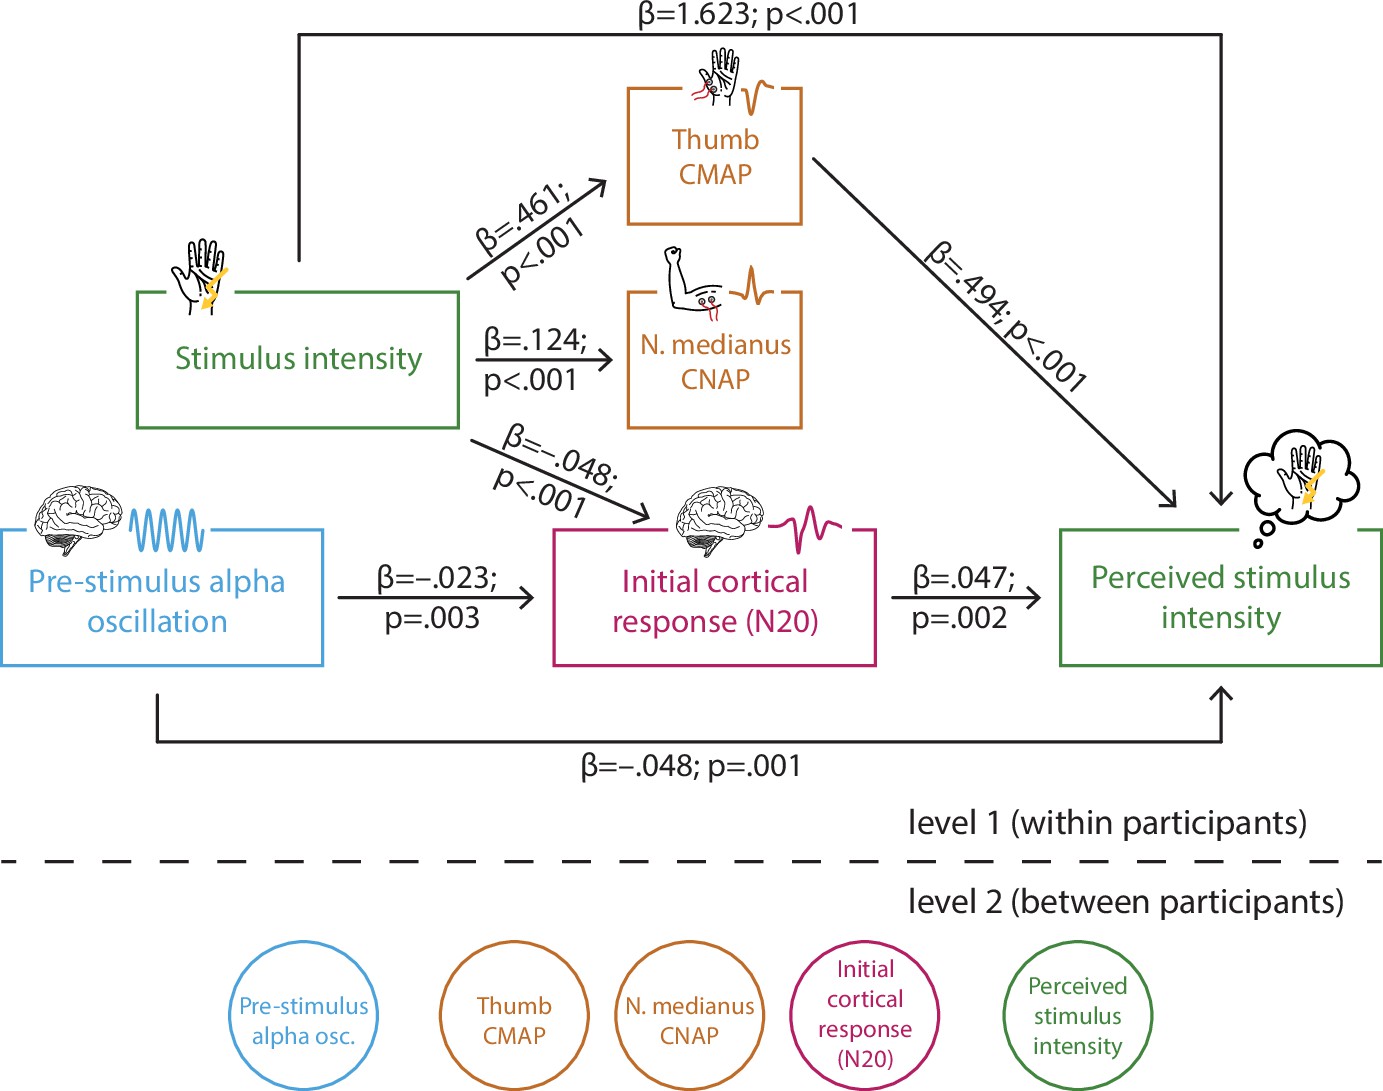
Multi-level structural equation model of the interplay between pre-stimulus alpha activity, the initial cortical response (N20 component of the somatosensory evoked potential [SEP]), intensity of the presented stimuli, the peripheral control measures of the compound muscle action potential (CMAP) of the M. abductor pollicis brevis and the compound nerve action potential (CNAP) of the median nerve, as well as the perceived intensity as reported by the participants (referred to as SEM 1).
Effect paths were estimated between the manifest variables on level 1 (within participants). Latent variables on level 2 served to estimate the respective random intercepts as well as their between-subject variances according to the latent variable approach for multi-level models as implemented in Mplus.
Figure 5 with 1 supplement
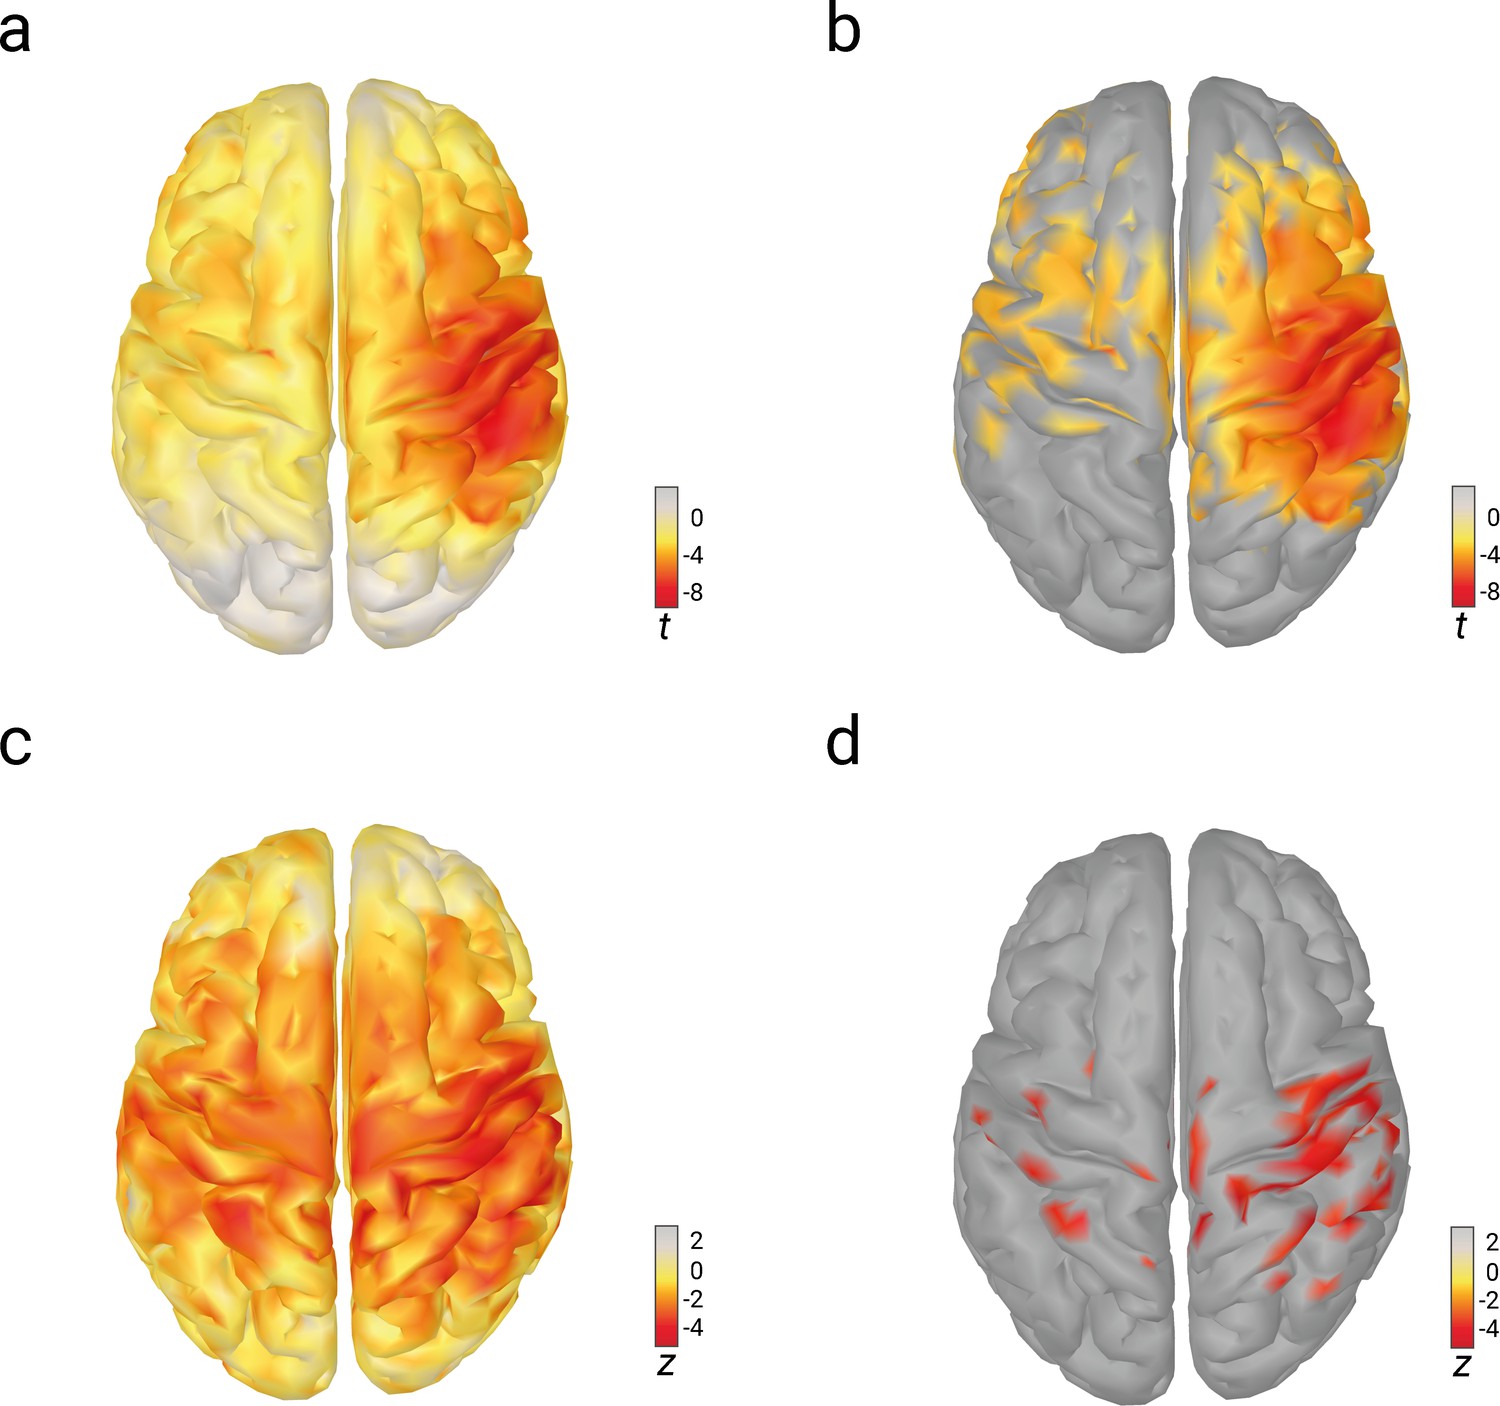
Relations of pre-stimulus alpha amplitude with N20 amplitudes and perceived stimulus intensity as analyzed with linear-mixed-effects models in source space.
(a) Effects of pre-stimulus alpha amplitudes on N20 amplitudes (uncorrected t values). (b) Same as (a) but corrected for multiple comparisons (FDR-corrected; p < 0.01). (c) Effects of pre-stimulus alpha amplitudes on perceived stimulus intensity (uncorrected z values). (d) Same as (c) but corrected for multiple comparisons (FDR-corrected; p < 0.01).
Figure 5—figure supplement 1
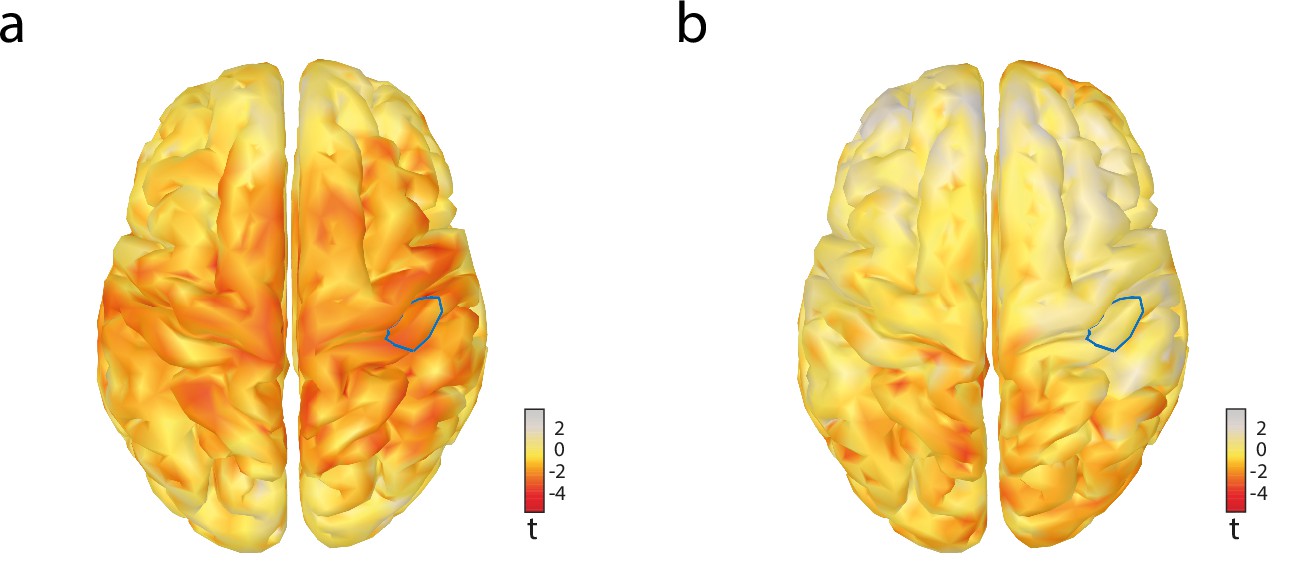
Effects of pre-stimulus alpha amplitude on signal detection theory parameters criterion c and sensitivity d’ in source space.
(a) Effects on criterion c. (b) Effects on sensitivity d’. Both panels show t values uncorrected for multiple comparisons. The blue outline indicates the hand region of the right somatosensory cortex, whose sources were used for the region of interest (ROI) analysis.
Figure 6
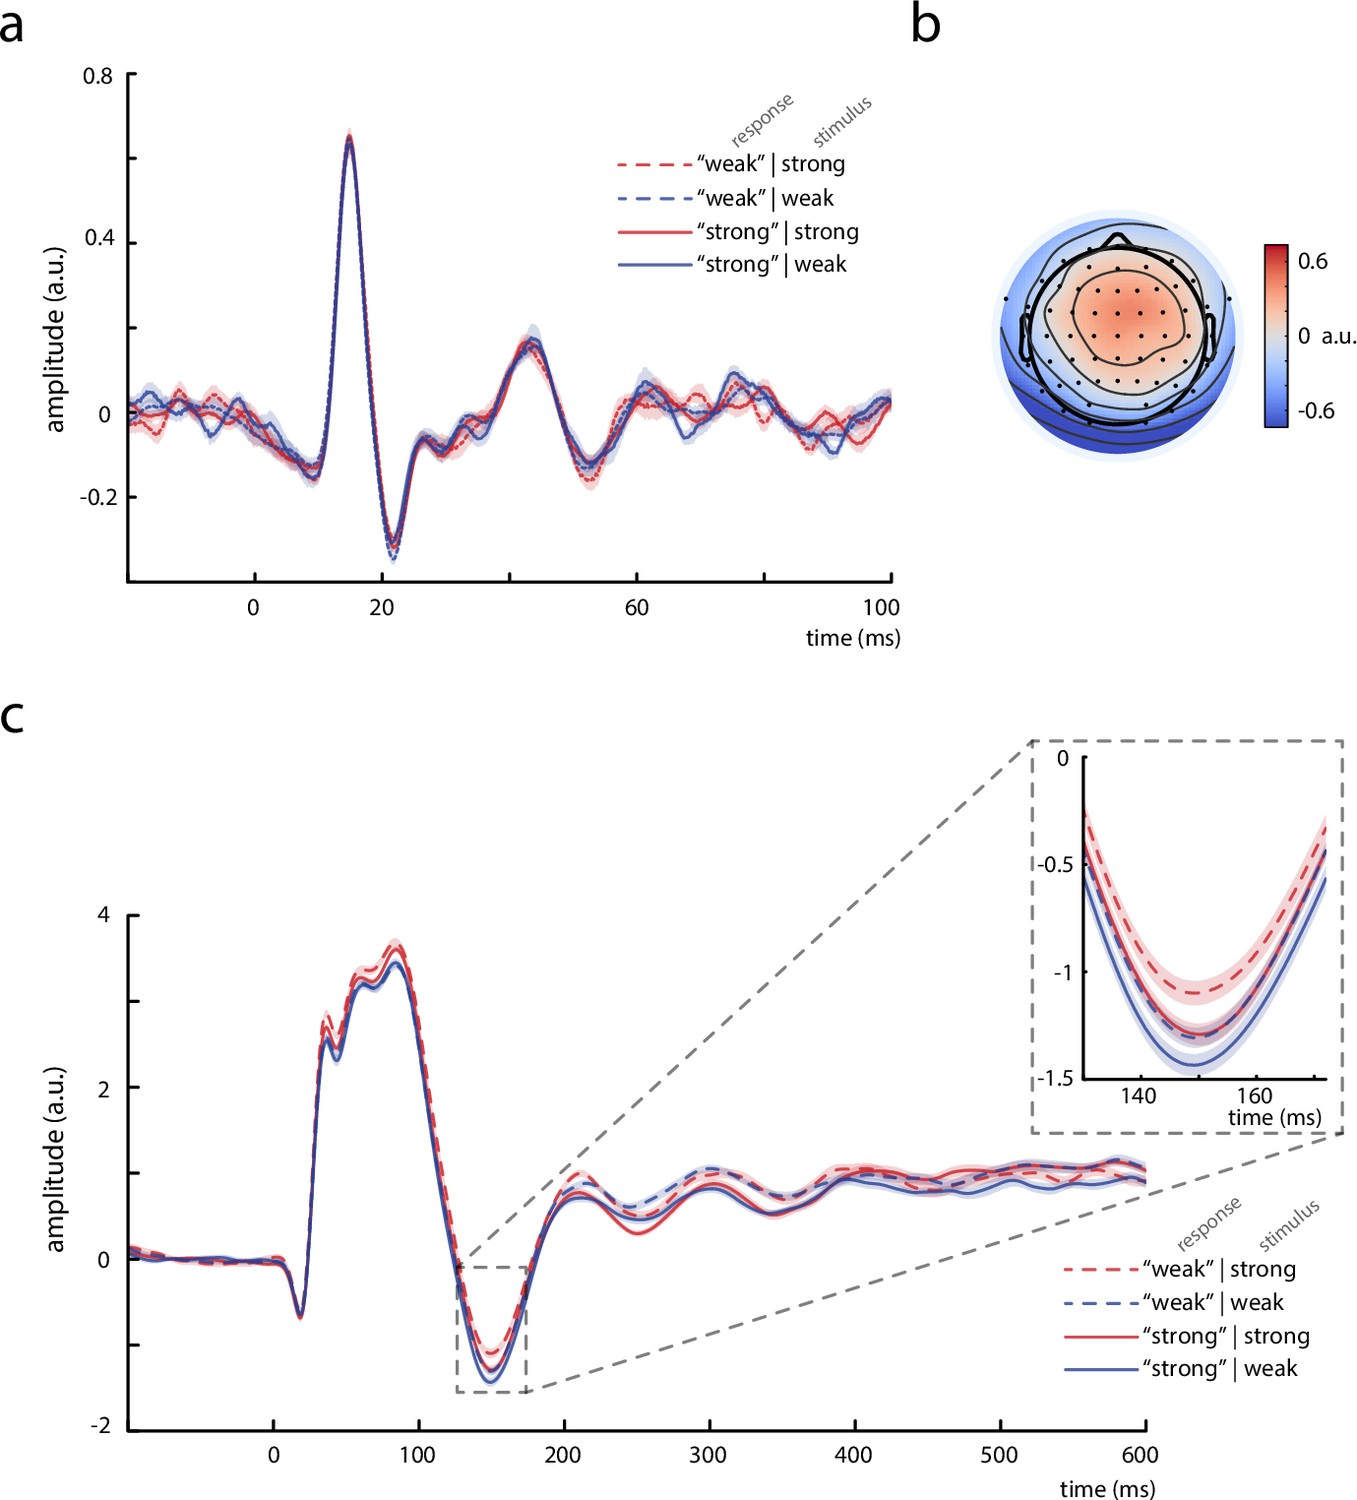
Thalamic activity and later somatosensory evoked potential (SEP) components.
(a) Grand average (N = 13) of the thalamic component derived from canonical correlation analysis (CCA), showing a clear P15 potential which did not differ across behavioral response categories. (b) Activation pattern of the thalamic CCA component (average across subjects). (c) Grand average (N = 32) of later SEP components (extracted with the tangential-CCA filter in the frequency range from 0.5 to 45 Hz). The N140 is visible as a negative peak at around 149 ms. Larger N140 amplitudes are associated with higher perceived intensities. Shaded areas correspond to the standard errors of the mean based on the within-subject variances (Morey, 2008).
Author response image 1

Phase distributions of pre-stimulus alpha band activity, separately displayed for quintiles of alpha amplitudes (panel a), and N20 amplitudes (panel b).
Alpha phase estimates were based on Fast-Fourier transforms in the pre-stimulus time windows from -200 to -10 ms. For visualization, data were concatenated across all participants (N=32).
Tables
Table 1
Model comparison of structural equation models (SEMs).
The original SEM (1) was compared to the alternative models (2–10) using Akaike information criterion (AIC), Bayesian information criterion (BIC), log-likelihood (LL), and the chi-square difference test based on the LL (with corresponding p-value; p-values < 0.05 are indicated by bold print). Differences in AIC, BIC, LL, and degrees of freedom (df) were derived by the subtraction alternative SEM minus SEM 1. A better model fit is indicated by lower AIC and/or BIC as well as higher LL. The χ2 difference tests correspond to the comparisons model with fewer parameters minus model with more parameters.
| Model fit indices | ||||||
|---|---|---|---|---|---|---|
| AIC diff. | BIC diff. | LL diff. | χ2 diff. | df diff. | p-value | |
| (1) Original SEM (‘SEM 1’) | ||||||
| (2) SEM incl. N20 ~ CNAP | 1.813 | 10.166 | 0.093 | 0.146 | –1 | 0.702 |
| (3) SEM incl. N20 ~ CMAP | 0.088 | 8.441 | 0.956 | 0.799 | –1 | 0.371 |
| (4) SEM incl. perceived_int ~ CNAP | 1.967 | 10.320 | 0.016 | 0.019 | –1 | 0.890 |
| (5) SEM excl. perceived_int ~ prestim | 8.002 | –0.351 | –5.001 | 11.415 | 1 | <0.001 |
| (6) SEM excl. N20 ~ prestim | 15.053 | 6.701 | –8.527 | 8.087 | 1 | 0.005 |
| (7) SEM excl. N20 | 47.099 | 22.040 | –26.550 | 31.095 | 3 | <0.001 |
| (8) SEM excl. CMAP | 9586.906 | 9570.200 | –4795.453 | 87.030 | 2 | <0.001 |
| (9) SEM incl. CMAP ~ prestim | 1.404 | 9.757 | 0.297 | 0.220 | –1 | 0.639 |
| (10) SEM incl. CNAP ~ prestim | –0.115 | 8.239 | 1.057 | 2.342 | –1 | 0.126 |
Table 2
Relationships included in the hypothesized structural equation model (‘SEM 1’).
Level 1 equations reflect the within-participant effects between variables of interest. On level 2, only intercepts and variances of each variable were modeled; apart from stimulus intensity which only varied within participants by experimental design.
| Level 1 (within participants): |
|---|
| N20 amplitude ~ 1 + stimulus intensity + pre-stimulus alpha |
| CNAP ~ 1 + stimulus intensity |
| CMAP ~ 1 + stimulus intensity |
| Perceived intensity ~ 1 + stimulus intensity + N20 amplitude + pre-stimulus alpha + CMAP |
| Level 2 (between participants): |
| N20 amplitude ~~ N20 amplitude |
| CNAP ~~ CNAP |
| CMAP ~~ CMAP |
| Perceived intensity ~~ perceived intensity |
| Pre-stimulus alpha ~~ pre-stimulus alpha |
Additional files
Download links
A two-part list of links to download the article, or parts of the article, in various formats.
Downloads (link to download the article as PDF)
Open citations (links to open the citations from this article in various online reference manager services)
Cite this article (links to download the citations from this article in formats compatible with various reference manager tools)
Neural excitability and sensory input determine intensity perception with opposing directions in initial cortical responses
eLife 10:e67838.
https://doi.org/10.7554/eLife.67838


