ADF and cofilin-1 collaborate to promote cortical actin flow and the leader bleb-based migration of confined cells
- Department of Regenerative and Cancer Cell Biology, Albany Medical College, United States
Figures
Figure 1 with 1 supplement

ADF and cofilin-1 are required for leader bleb-based migration.
(A) Ventral Z-section of a melanoma A375-M2 cell, which has been confined down to 3 µm, with mEmerald-LifeAct. (B) Kymograph from (A; dashed line), showing cortical actin flow. (C) Ventral Z-section of a melanoma A375-M2 cells, which has been confined down to 3 µm, with EGFP tagged regulatory light chain (EGFP-RLC). (D) Western blot confirming CFL1, actin depolymerizing factor (ADF), and ADF + CFL1 RNAi in melanoma A375-M2 cells. (E) Individual cell migration tracks (plot of origin) for non-targeting, CFL1, ADF, and CFL1 + ADF RNAi cells, as well as CFL1 + ADF RNAi cells rescued by transfection with EGFP-cofilin-1 plasmid. In each, cells were tracked over a period of 5 hr. Relative y (µm) and relative × (µm) are shown in each. (F) Percentage of highly motile cells from (E). Cells that traveled a distance equivalent to at least one cell length over the course of the 5 hr time-lapse were classified as highly motile. (G) Average speed (µm/min) from cells in (E; mean ± SEM). Statistical significance was determined by one-way ANOVA and a Dunnett’s post hoc test. (H) Instantaneous top speed (µm/min) for highly motile cells in (E; mean ± SEM). (I) Cofilin-1 levels (fold change; fluorescence intensity) of adhered RNAi cells by immunofluorescence confirming rescue by transfection with EGFP-cofilin-1 or not rescued with EGFP. Statistical significance was determined by an unpaired one-sample t-test. All data are representative of at least three independent experiments. *p ≤ 0.05, **p ≤ 0.01, ***p ≤ 0.001, and ****p ≤ 0.0001.
-
Figure 1—source data 1
Raw data from manual tracking.
Spreadsheet of x-y coordinates of cells for each frame within a video. Time interval between frames for all cells is 8 min. Data for CFL1, actin depolymerizing factor (ADF), CFL1 + ADF RNAi, as well as CFL1 + ADF RNAi cells rescued by transfection with EGFP-cofilin-1 plasmid are provided. These data are displayed as plots of origin in Figure 1E.
- https://cdn.elifesciences.org/articles/67856/elife-67856-fig1-data1-v2.xlsx
Figure 1—figure supplement 1
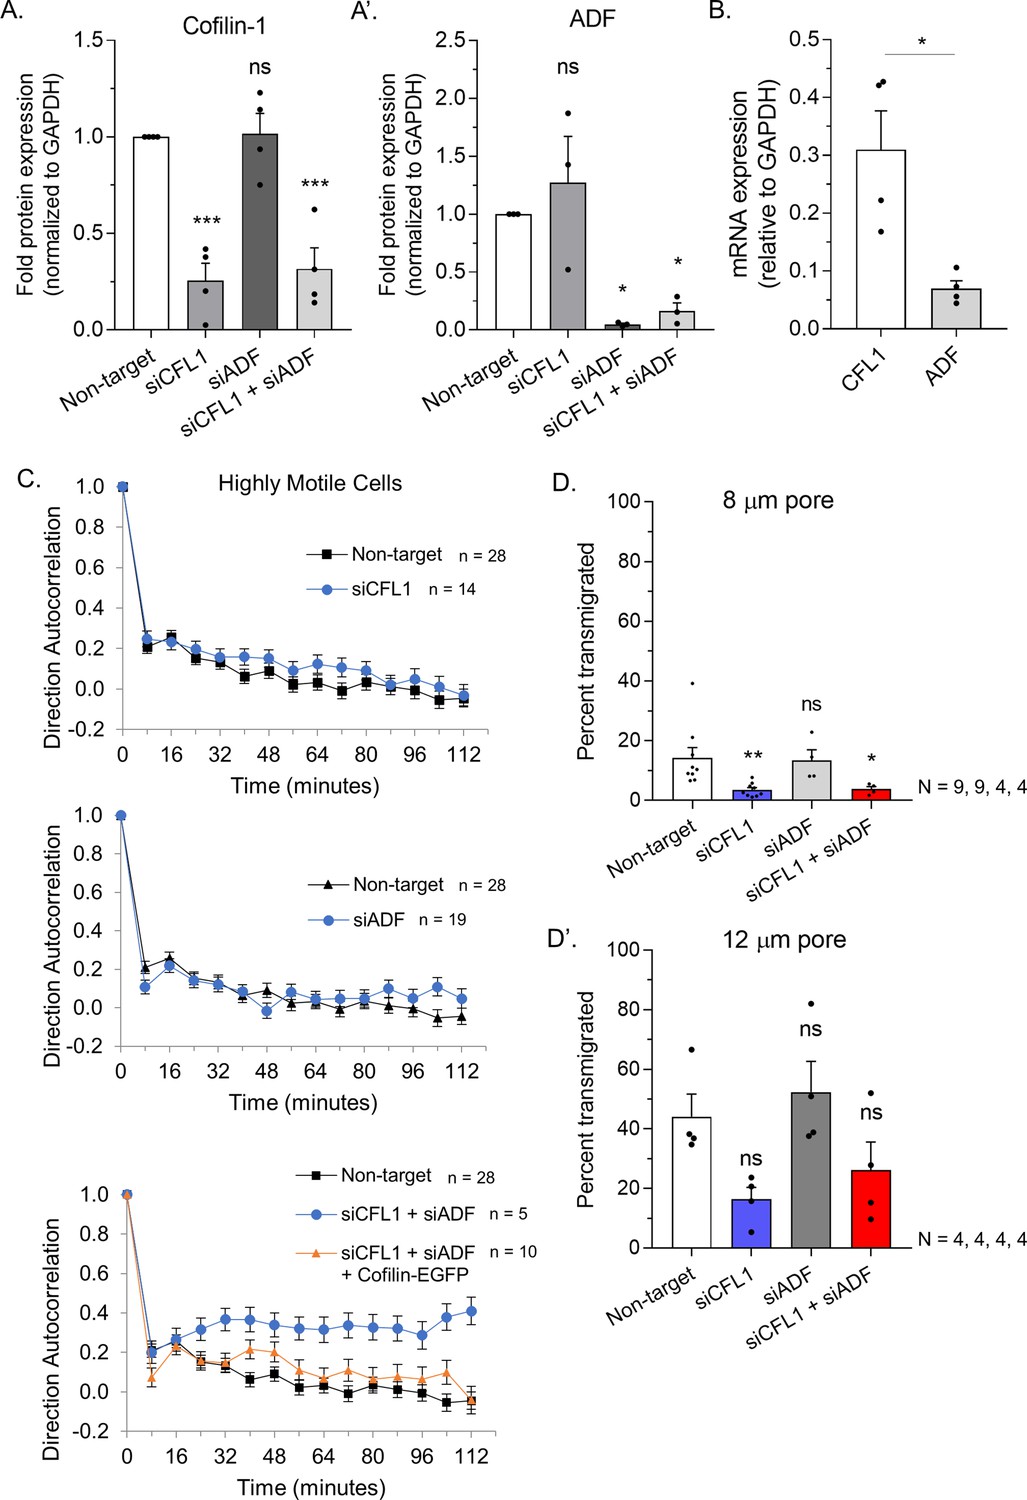
Protein levels and migration parameters.
(A) Quantitative evaluation of cofilin-1 (left) and actin depolymerizing factor (ADF) (right) RNAi as measured by Western blotting of total cell lysates. (B) Quantitative evaluation of cofilin-1 and ADF mRNA levels by qRT-PCR in A375-M2 cells (mean ± SEM). (C) Direction autocorrelation plots of confined highly motile cells after RNAi. (D) Transmigration of melanoma A375-M2 cells through 8 (above) or 12 µm (below) pores after non-targeting, CFL1, ADF, and CFL1 + ADF RNAi. Statistical significance was determined by one-way ANOVA and a Dunnet’s post hoc test. All data are representative of at least three independent experiments. *p ≤ 0.05, **p ≤ 0.01, ***p ≤ 0.001, and ****p ≤ 0.0001.
Figure 2
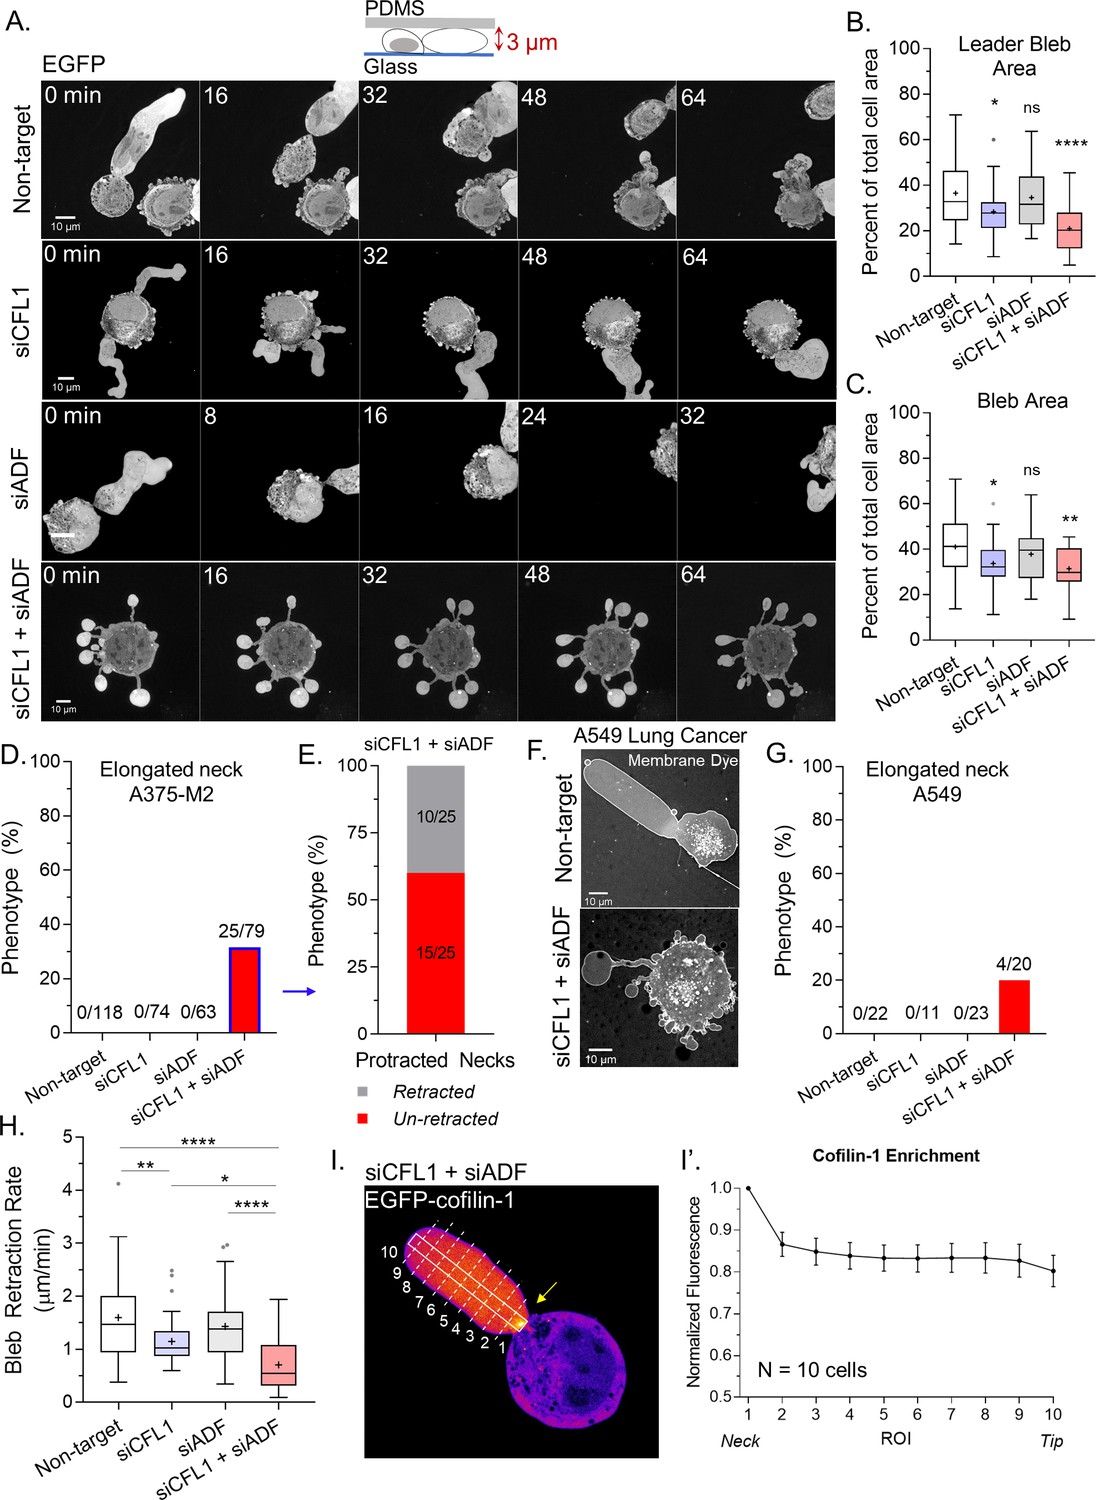
Together, actin depolymerizing factor (ADF) and cofilin-1 are required to retract blebs.
(A) Montage of non-targeting, CFL1, ADF, and CFL1 + ADF RNAi with EGFP alone (volume marker) in melanoma A375-M2 cells. (B–C) Quantitation of area for leader (A) and all blebs (B) after non-targeting, CFL1, ADF, and ADF + CFL1 RNAi. Statistical significance was determined by one-way ANOVA and a Dunnet’s post hoc test. (D) Percent of non-targeting, CFL1, ADF, and CFL1 + ADF RNAi cells with elongated bleb necks. (E) Percent of ADF + CFL1 RNAi cells from (D) with elongated bleb necks that retract vs. un-retracted. (F–G) Lung adenocarcinoma A549 cells after non-targeting and CFL1 + ADF RNAi stained with a far-red fluorescent membrane dye (F). Percent of non-targeting, CFL1, ADF, and CFL1 + ADF RNAi cells with elongated bleb necks (G). (H) Bleb retraction rates for non-targeting (45 blebs; 26 cells), CFL1 (40 blebs; 20 cells), ADF (48 blebs; 30 cells), and CFL1 + ADF RNAi (38 blebs; 23 cells). Statistical significance was determined by one-way ANOVA and a Dunnet’s post hoc test. (I) EGFP-cofilin-1 localization in an A375-M2 cell confined down to 3 µm. Arrow points to an enrichment of cofilin-1 at the leader bleb neck. (I’) Regional analysis of EGFP-cofilin-1 average fluorescence intensity in ROIs sampled from bleb neck to tip (mean ± SEM). Representative regions taken within white box and dashed lines in (I). All data are representative of at least three independent experiments. *p ≤ 0.05, **p ≤ 0.01, ***p ≤ 0.001, and ****p ≤ 0.0001.
-
Figure 2—source data 1
Raw leader bleb and bleb area measurements.
Spreadsheet of leader bleb and bleb (i.e., all blebs) area measurements. Each measurement is a percent of the total cell area. Data for CFL1, actin depolymerizing factor (ADF), and CFL1 + ADF RNAi are provided. These data are graphed in Figure 2B–C.
- https://cdn.elifesciences.org/articles/67856/elife-67856-fig2-data1-v2.xlsx
Figure 3 with 1 supplement
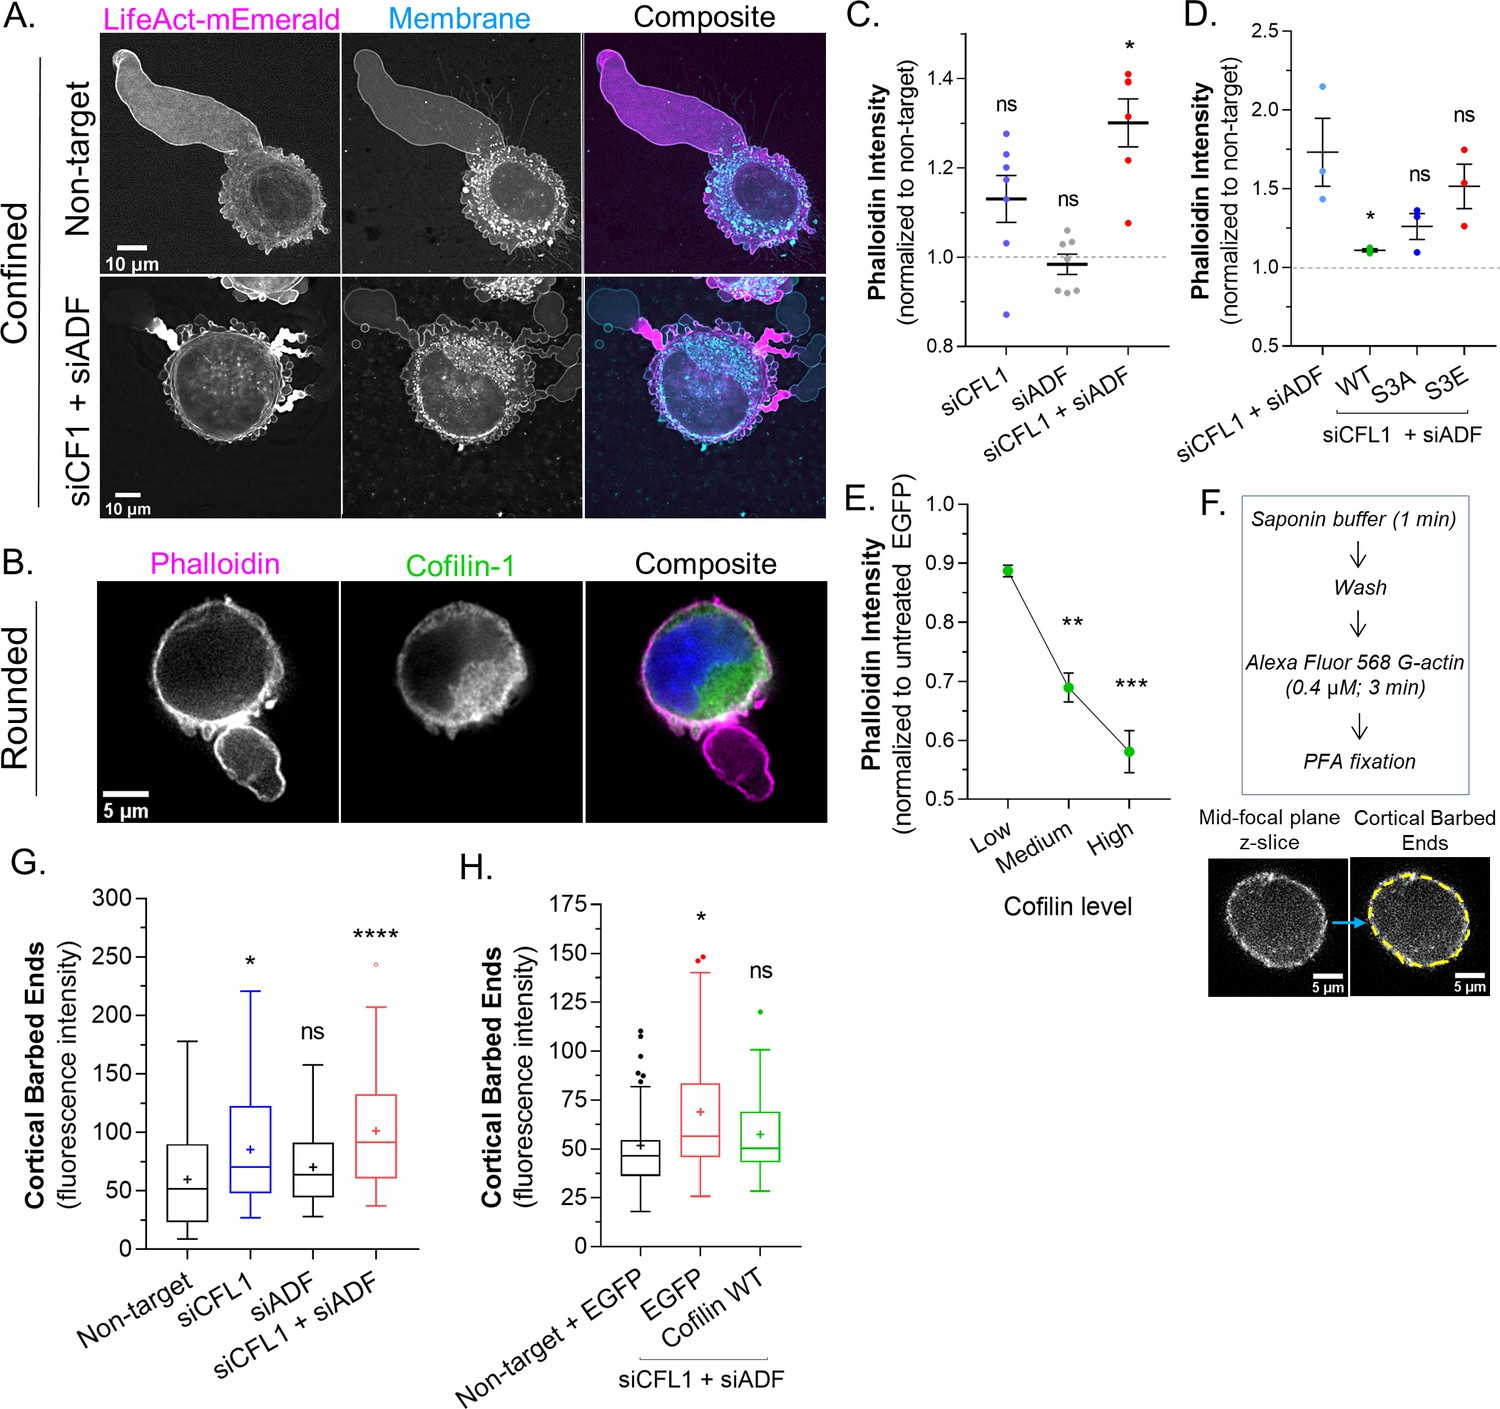
Actin depolymerizing factor ( ADF) and cofilin-1 rapidly disassemble cortical actin.
(A) mEmerald-LifeAct and far-red fluorescent membrane dye in cells after non-targeting and CFL1 + ADF RNAi. (B) Cells freshly plated on poly-L-lysine coated cover glass stained for endogenous cofilin-1 and filamentous-actin (F-actin) (phalloidin). (C) F-actin levels (normalized to non-target; mean ± SEM) after CFL1, ADF, and CFL1 + ADF RNAi in trypsinized (spherical) cells, as determined by flow cytometry. Statistical significance was determined by one-way ANOVA and a Dunnet’s post hoc test. (D) F-actin levels (normalized to non-target; mean ± SEM) after CFL1 + ADF RNAi, as well as after CFL1 + ADF RNAi with EGFP-cofilin-1 WT, S3A, or S3E, as determined by flow cytometry. Statistical significance was determined by one-way ANOVA and a Dunnet’s post hoc test. (E) F-actin level (normalized to EGFP alone; mean ± SEM) as a function of increasing EGFP-cofilin-1 in cells depleted of endogenous cofilin-1 and ADF by RNAi, as determined by flow cytometry. Statistical significance was determined by one-way ANOVA and a Dunnet’s post hoc test. (F) Top, barbed end assay workflow. Bottom, representative image of a freshly plated (spherical) cell subjected to the barbed end assay. (G) As shown in (F; bottom), the level of cortical barbed ends was measured in cells after non-targeting (71 cells), CFL1 (53 cells), ADF (47 cells), and CFL1 + ADF RNAi (83 cells). Statistical significance was determined by one-way ANOVA and a Dunnet’s post hoc test. (H) As shown in (F; bottom), the level of cortical barbed ends was measured in cells with non-targeting and EGFP (42 cells), as well as after CFL1 + ADF RNAi with EGFP (32 cells) or EGFP-cofilin-1 (27 cells). Statistical significance was determined by one-way ANOVA and a Dunnet’s post hoc test. All data are representative of at least three independent experiments. *p ≤ 0.05, **p ≤ 0.01, ***p ≤ 0.001, and ****p ≤ 0.0001.
Figure 3—figure supplement 1
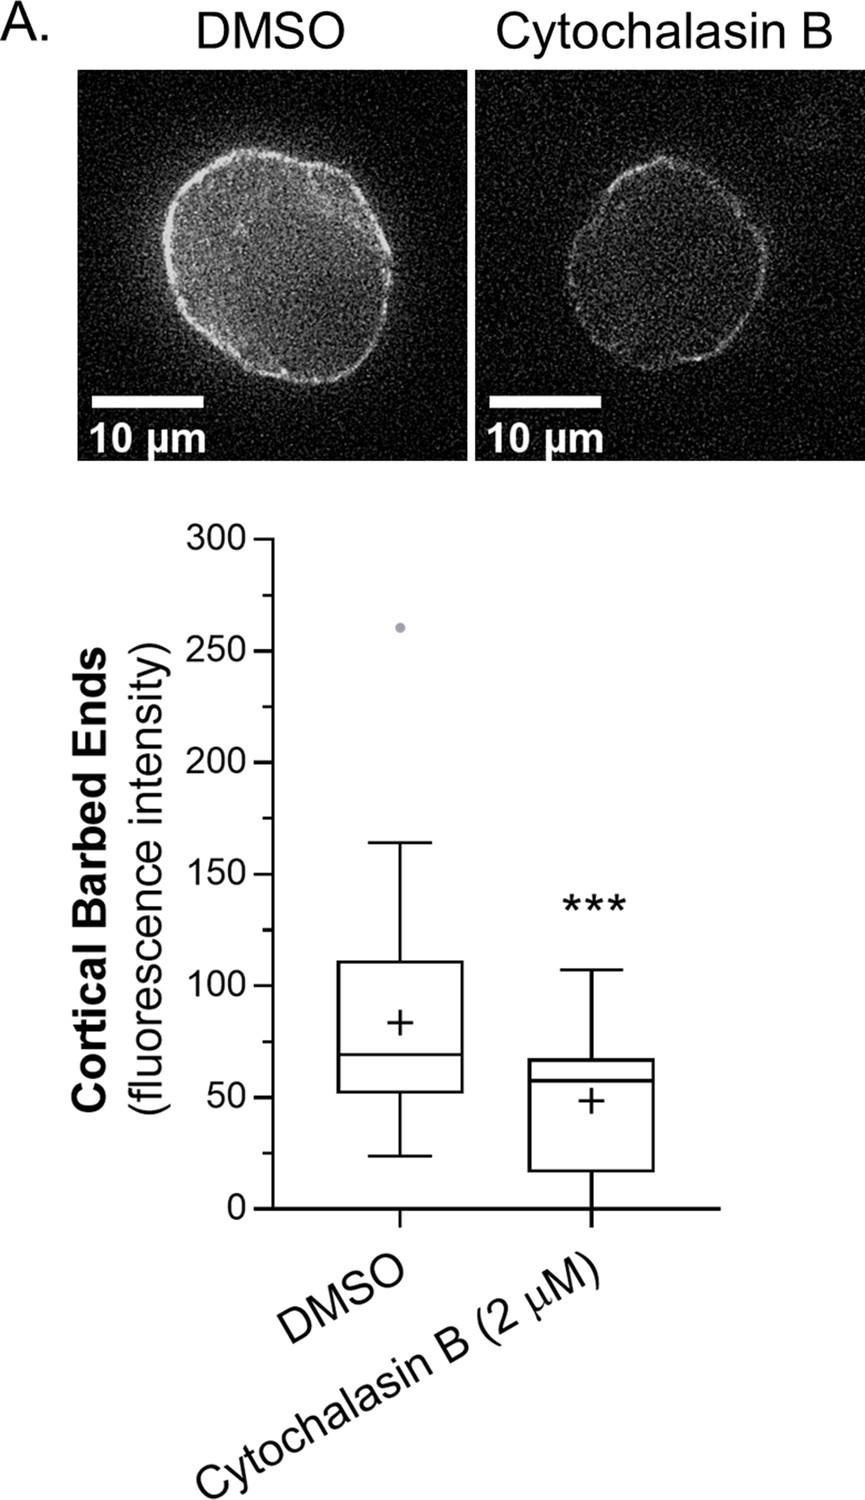
Cytochalasin B blocks access to cortical barbed ends.
(A) Cortical barbed end levels in melanoma A375-M2 cells after vehicle (DMSO; 53 cells) or cytochalasin B (2 µM; 24 cells) treatment. Statistical significance was determined using an unpaired Student’s t-test. All data are representative of at least three independent experiments. *p ≤ 0.05, **p ≤ 0.01, ***p ≤ 0.001, and ****p ≤ 0.0001.
Figure 4 with 1 supplement
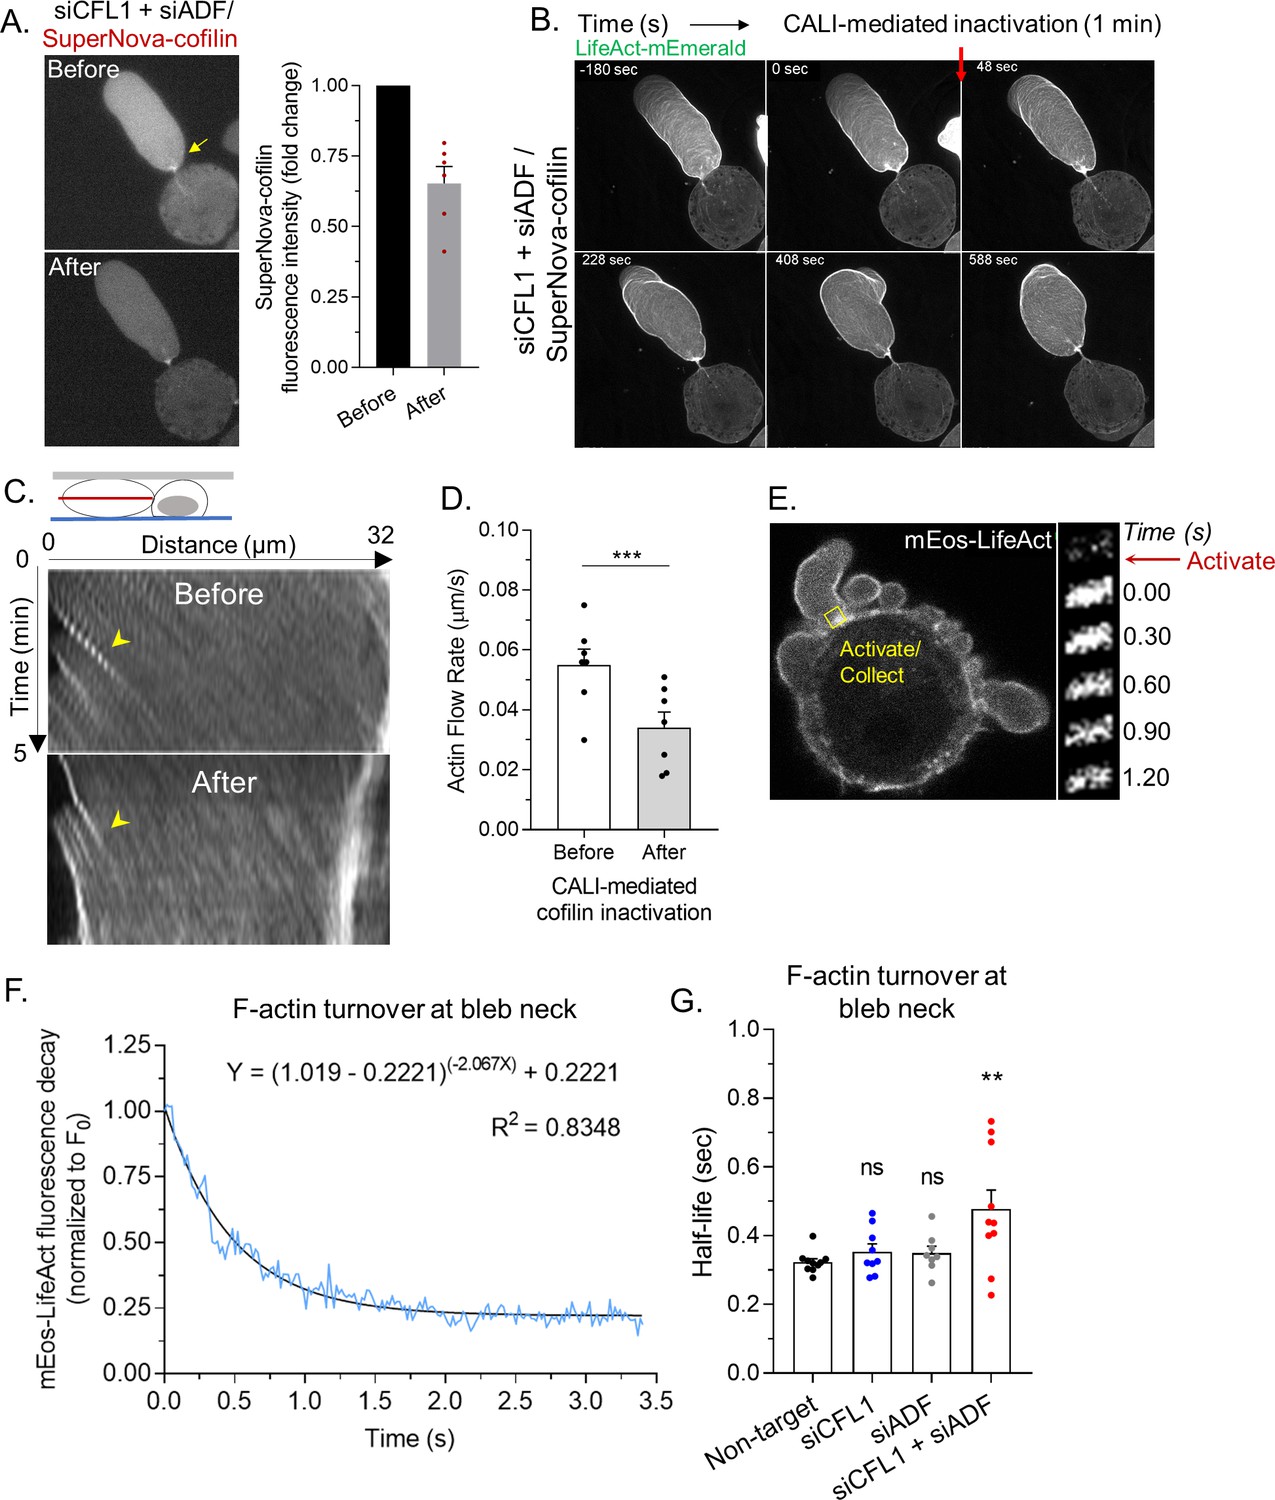
Rapid cortical actin flow requires actin depolymerizing factor (ADF) and cofilin-1 severing at leader bleb necks.
(A) Left, SuperNova-cofilin-1 localization in cells depleted of endogenous cofilin-1 and ADF by RNAi before and after 1 min of red light irradiation. Right, quantitative analysis of CALI, as determined by the fold change in SuperNova emission. (B) Montage of mEmerald-LifeAct before and after cofilin-1 inactivation in a cell depleted of endogenous cofilin-1 and ADF by RNAi. (C) Kymographs of cortical actin (mEmerald-LifeAct) flow from the leader bleb tip before and after cofilin-1 inactivation. (D) Quantitative evaluation of cortical actin flow rates before and after cofilin-1 inactivation. Statistical significance was determined by a paired Student’s t-test. (E) Left, representative image of a freshly plated (spherical) cells with mEos3.2-LifeAct. Right, montage of mEos3.2-LifeAct within the shown ROI before and after photoactivation. (F) Average decay curve for mEos3.2-LifeAct at bleb necks (normalized to the initial fluorescence level; F/F0). The curve was fit using a non-linear single phase decay function. (G) t1/2 for mEos3.2-LifeAct after photoactivation at bleb necks for non-targeting, CFL1, ADF, and CFL1 + ADF RNAi. Statistical significance was determined by one-way ANOVA and a Dunnet’s post hoc test. All data are representative of at least three independent experiments. *p ≤ 0.05, **p ≤ 0.01, ***p ≤ 0.001, and ****p ≤ 0.0001.
Figure 4—figure supplement 1
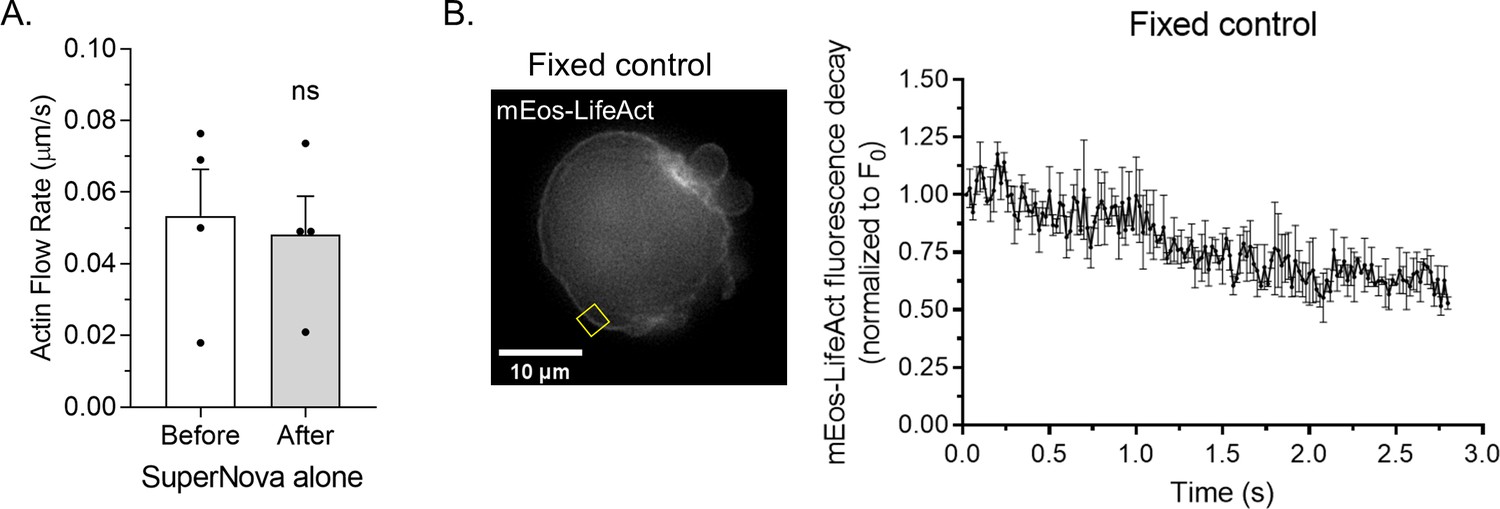
Actin turnover measurement controls.
(A) Cortical actin (mEmerald-LifeAct) flow rates before and after the inactivation (i.e., red light irradiation) of SuperNova alone. (B) Left, sample ROI from a paraformaldehyde (PFA) treated melanoma A375-M2 cell with mEos3.2-LifeAct. Right, average mEos3.2-LifeAct decay (three cells; mean ± SEM) after photoactivation. All data are representative of at least three independent experiments.
Figure 5
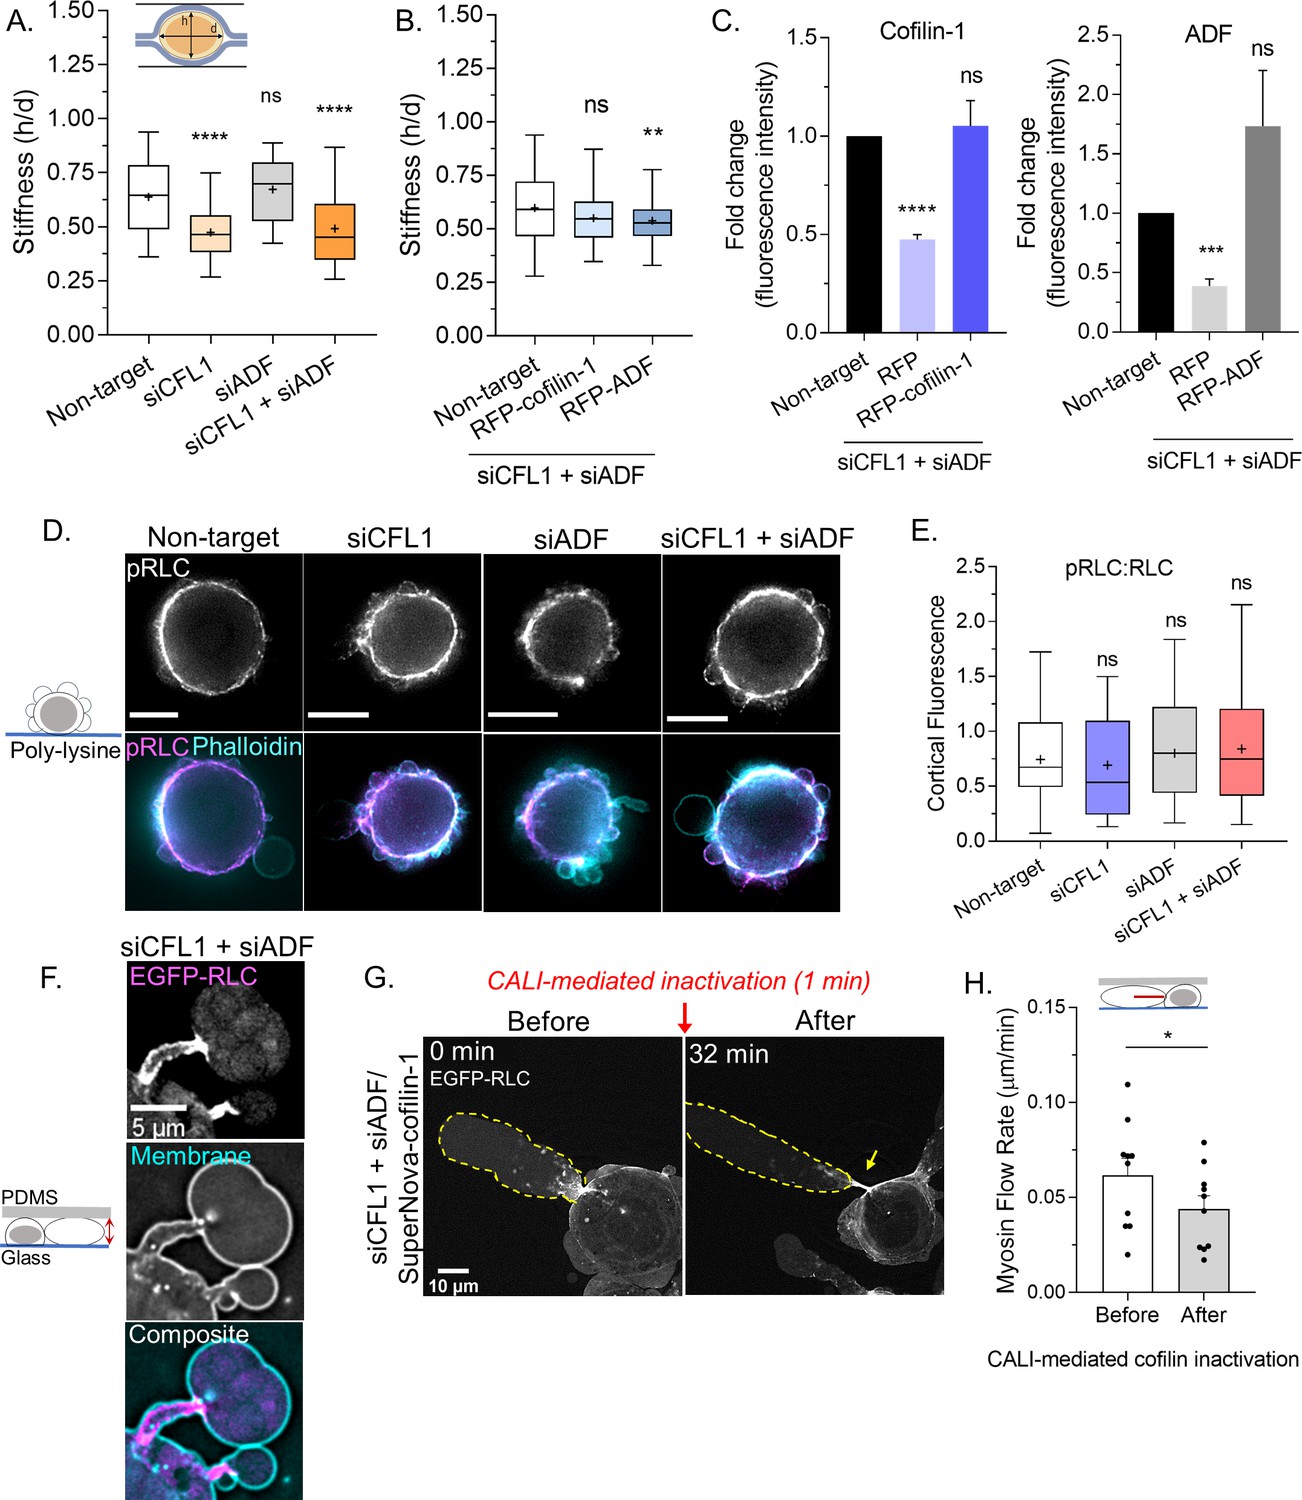
Cofilin-1 supports both actin turnover and myosin contractility at leader bleb necks.
(A) A previously described gel sandwich assay was used to measure the stiffness (h/d) of spherical cells after non-targeting (91 cells), CFL1 (30 cells), actin depolymerizing factor (ADF) (25 cells), and CFL1 + ADF RNAi (42 cells). (B) Cell stiffness (h/d) of spherical cells with non-targeting (181 cells) or siCFL1 + siADF RNAi rescued with RFP-cofilin-1 (41 cells) or RFP-ADF (74 cells). (A–B) Statistical significance was determined by one-way ANOVA and a Dunnet’s post hoc test. (C) Cofilin-1 (left) and ADF (right) levels (fluorescence intensity; fold change) of adhered RNAi cells by immunofluorescence confirming rescue by transfection with RFP-cofilin-1 (left) or RFP-ADF (right). Statistical significance was determined by an unpaired one-sample t-test. (D) Immunofluorescence imaging of endogenous phosphorylated regulatory light chain (pRLC) (S18), total RLC, and filamentous-actin (F-actin) (phalloidin) in freshly plated (spherical) cells after non-targeting, CFL1, and CFL1 + ADF RNAi. (E) Ratio of cortical pRLC (S18) to total RLC fluorescence intensity after non-targeting (114 cells), CFL1 (107 cells), ADF (124 cells), and CFL1 + ADF RNAi (91 cells). Statistical significance was determined by one-way ANOVA and a Dunnet’s post hoc test. (F) Localization of EGFP tagged regulatory light chain (EGFP-RLC) in a cell confined down to 3 µm after CFL1 + ADF RNAi. (G) EGFP-RLC dynamics in a cell depleted of cofilin-1 and ADF before and after chromophore assisted light inactivation (CALI) of SuperNova-cofilin-1. Arrow points to myosin accumulating at an elongating leader bleb neck after cofilin-1 inactivation. (H) Myosin minifilament flow rate before and after cofilin-1 inactivation. Statistical significance was determined using a paired Student’s t-test. All data are representative of at least three independent experiments. *p ≤ 0.05, **p ≤ 0.01, ***p ≤ 0.001, and ****p ≤ 0.0001.
-
Figure 5—source data 1
Raw stiffness measurements.
Spreadsheet of stiffness (h/d) measurements for CFL1, actin depolymerizing factor (ADF), CFL1 + ADF RNAi, as well as CFL1 + ADF RNAi cells rescued by transfection with RFP-cofilin-1 or RFP-ADF plasmid are provided. These data are graphed in Figure 5A–B.
- https://cdn.elifesciences.org/articles/67856/elife-67856-fig5-data1-v2.xlsx
Figure 6
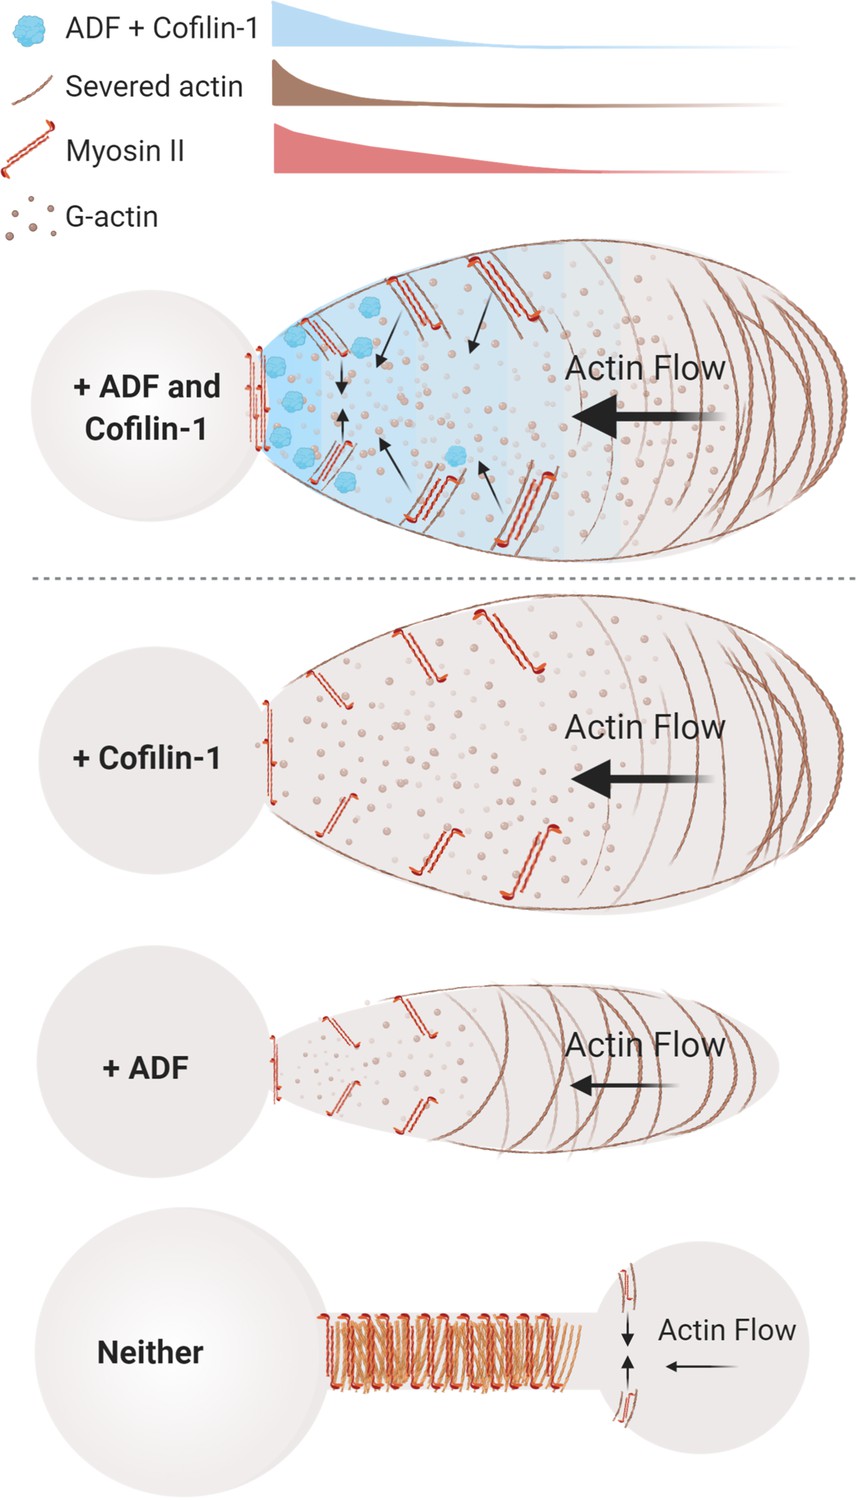
Model of actin depolymerizing factor (ADF) and cofilin-1 function within leader blebs.
Top, in the presence of both ADF and cofilin-1, cells display large blebs with rapid cortical actin flow. Below, in the absence of cofilin-1 or ADF, cells form smaller blebs with slower cortical actin flow. Bottom, without both ADF and cofilin-1, blebs display several defects, including a failure to retract and an accumulation of actomyosin at elongated necks.
Videos
Video 1
Time-lapse imaging of melanoma A375-M2 cells confined down to 3 µm with far-red plasma membrane dye.
Video 2
Time-lapse imaging of a melanoma A375-M2 cell confined down to 3 µm with mScarlet-LifeAct and EGFP tagged regulatory light chain (EGFP-RLC).
Video 3
Time-lapse imaging of a melanoma A375-M2 cell confined down to 3 µm with the volume marker, mScarlet, after control (non-targeting) RNAi.
Video 4
Time-lapse imaging of a melanoma A375-M2 cell confined down to 3 µm with the volume marker, EGFP, after RNAi of actin depolymerizing factor (ADF) alone.
Video 5
Time-lapse imaging of a melanoma A375-M2 cell confined down to 3 µm with the volume marker, mScarlet, after RNAi of CFL1 alone.
Video 6
Time-lapse imaging of a melanoma A375-M2 cell confined down to 3 µm with the volume marker, EGFP, after RNAi of CFL1 + actin depolymerizing factor (ADF).
Video 7
Time-lapse imaging of a melanoma A375-M2 cell confined down to 3 µm with mEmerald-LifeAct after chromophore assisted light inactivation (CALI) of SuperNova-cofilin-1.
The cell was depleted of endogenous actin depolymerizing factor (ADF) and cofilin-1 by RNAi.
Video 8
Time-lapse imaging of a melanoma A375-M2 cell confined down to 3 µm with EGFP tagged regulatory light chain (EGFP-RLC) after chromophore assisted light inactivation (CALI) of SuperNova-cofilin-1.
The cell was depleted of endogenous actin depolymerizing factor (ADF) and cofilin-1 by RNAi.
Tables
Key resources table
| Reagent type (species) or resource | Designation | Source or reference | Identifiers | Additional information |
|---|---|---|---|---|
| Cell line (Homo sapiens) | A375-M2 | ATCC | CRL-3223 | Metastatic melanoma |
| Cell line (Homo sapiens) | A549 | ATCC | CCL-185 | Lung adenocarcinoma |
| Chemical compound, drug | SYLGARD 184 | Dow Corning | Cat no. 24236–10 | PDMS |
| Transfected construct (Homo sapiens) | EGFP-cofilin-1 WT, S3A, and S3E | Addgene (a gift from Dr James Bamburg) | Plasmid no. 50859, 50854, and 50855 | Plasmid constructs to transfect |
| Transfected construct (Homo sapiens) | RFP-cofilin-1 | Dr James Bamburg (Colorado State University) | n/a | Plasmid construct to transfect |
| Transfected construct (Homo sapiens) | RFP-ADF | Dr James Bamburg (Colorado State University) | n/a | Plasmid construct to transfect |
| Transfected construct (Homo sapiens) | SuperNova-cofilin-1 | Dr Kazuyo Sakai (Osaka University, Osaka, Japan) | n/a | Plasmid construct to transfect and destroy cofilin-1 by CALI |
| Transfected construct (Saccharomyces cerevisiae) | mEos3.2-LifeAct | Addgene (a gift from Michael Davidson) | Plasmid no. 54696 | Plasmid construct to transfect and monitor F-actin dynamics |
| Sequence-based reagent (Homo sapiens) | Non-targeting siRNA | Thermo Fisher | Cat no. 4390844 | Control siRNA to transfect |
| Sequence-based reagent (Homo sapiens) | Cofilin-1 siRNA | Thermo Fisher | Cat no. 4392420; s2936 | Cofilin-1 siRNA to transfect |
| Sequence-based reagent (Homo sapiens) | ADF siRNA | Thermo Fisher | Cat no. 4392422; s21737 | ADF siRNA to transfect |
| Antibody | Anti-cofilin-1 (mouse monoclonal) | Thermo Fisher | Cat no. MA5-17275 | WB (1:1000), IF (1:250) |
| Antibody | Anti-ADF (mouse monoclonal) | Thermo Fisher | Cat no. MA5-25485 | WB (1:1000), IF (1:250) |
| Sequence-based reagent (Homo sapiens) | Cofilin-1 forward qPCR primer | Thermo Fisher | n/a | GCAACCTATGAGACCAAGGAGAG |
| Sequence-based reagent (Homo sapiens) | ADF forward qPCR primer | Thermo Fisher | n/a | GCACCAGAACTAGCACCTCTGA |
| Sequence-based reagent (Homo sapiens) | GAPDH forward qPCR primer | Thermo Fisher | n/a | GTCTCCTCTGACTTCAACAGCG |
| Recombinant DNA protein | Alexa Fluor 568-conjugated G-actin from rabbit muscle | Thermo Fisher | Cat no. A12374 | Fluorescent G-actin to label actin barbed ends |
| Software | Fiji | n/a | https://imagej.net/Fiji | Microscopy |
| Software | Prism | GraphPad | n/a | Statistical analyses |
| Software | BioRender | Toronto, ON | n/a | Illustration |
| Other | DeltaVision Elite | GE | n/a | Commercial deconvolution microscopy system |
| Other | LSM880 with fast Airy Scan | Zeiss | n/a | Commercial point scanning confocal microscopy system |
Additional files
Download links
A two-part list of links to download the article, or parts of the article, in various formats.
Downloads (link to download the article as PDF)
Open citations (links to open the citations from this article in various online reference manager services)
Cite this article (links to download the citations from this article in formats compatible with various reference manager tools)
ADF and cofilin-1 collaborate to promote cortical actin flow and the leader bleb-based migration of confined cells
eLife 10:e67856.
https://doi.org/10.7554/eLife.67856


