Ir56d-dependent fatty acid responses in Drosophila uncover taste discrimination between different classes of fatty acids
- Department of Biological Sciences, Florida Atlantic University, United States
- Wilkes Honors College, Florida Atlantic University, United States
- Interdepartmental Neuroscience Program, University of California, Riverside, United States
- Department of Molecular, Cell & Systems Biology, University of California, Riverside, United States
Figures
Figure 1 with 4 supplements
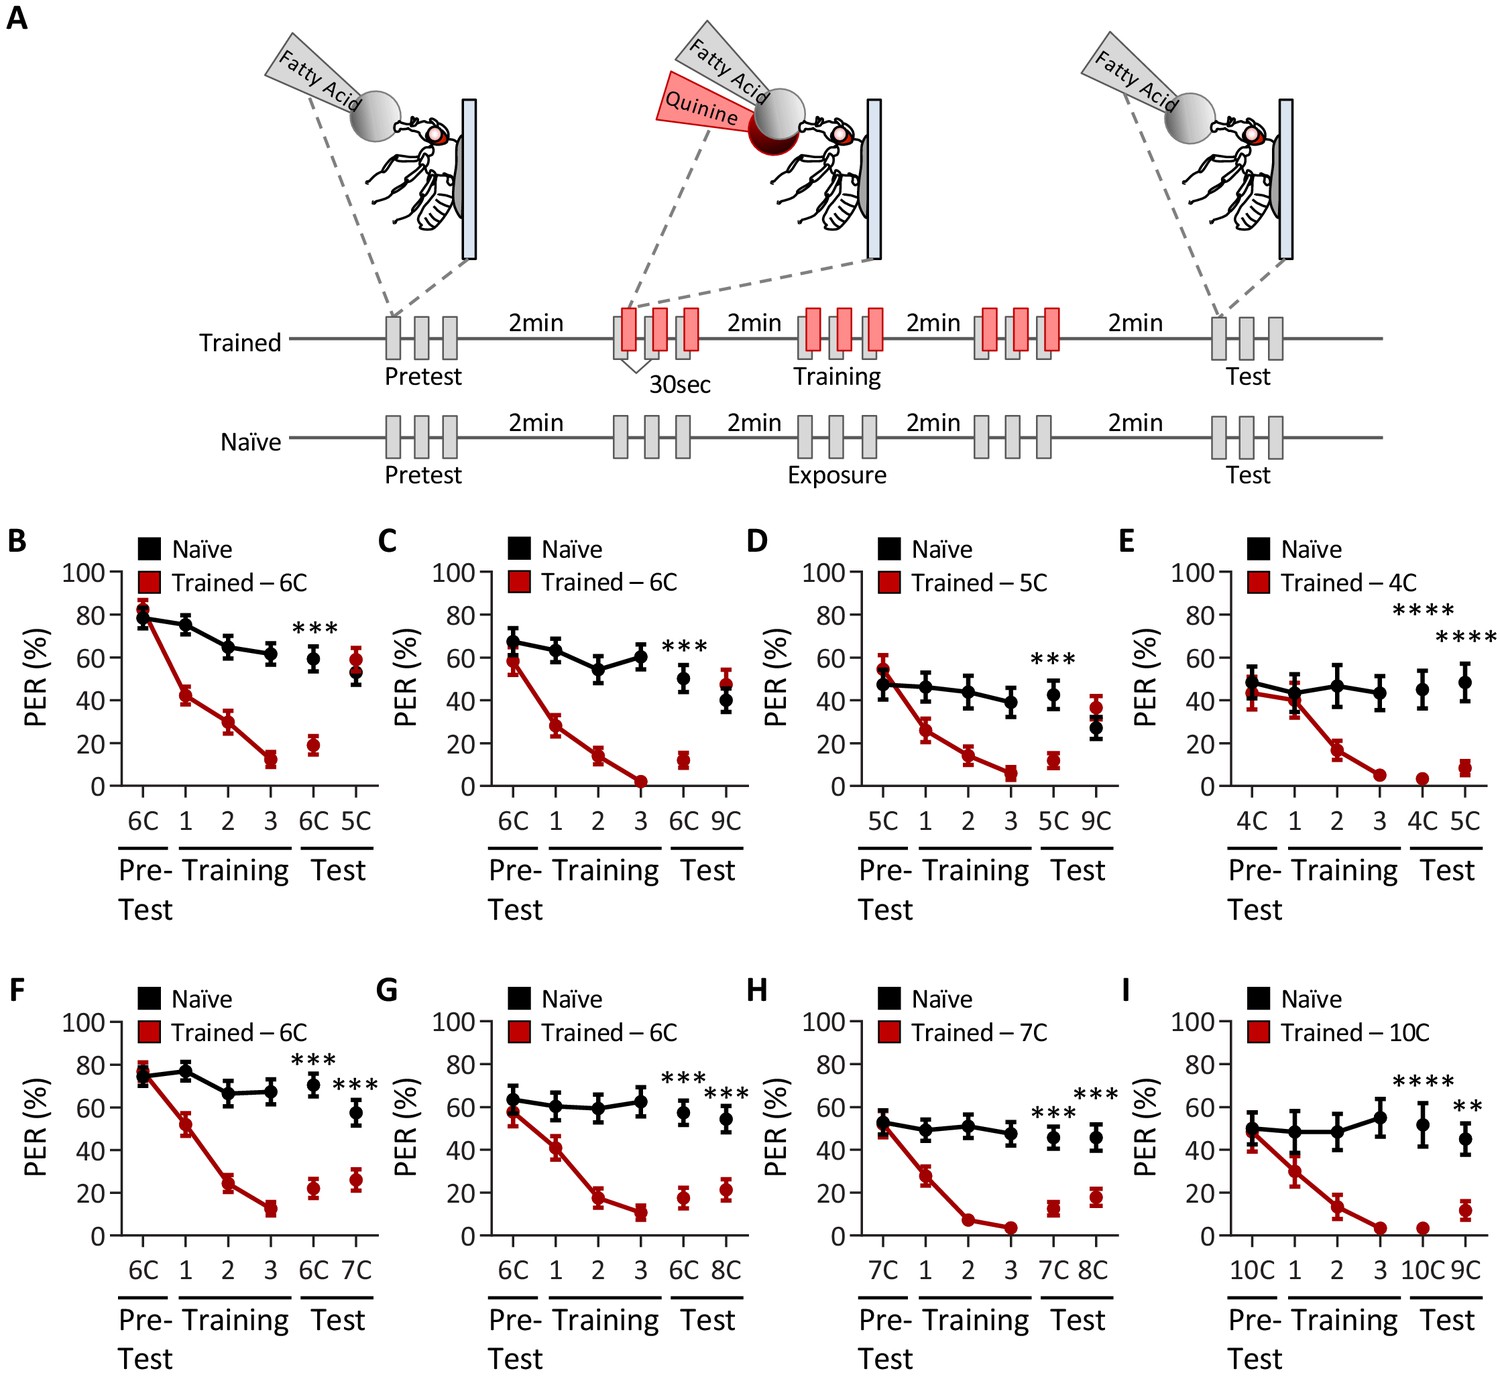
Drosophila can discriminate between, but not among, short-, medium-, and long-chain fatty acids.
(A) An aversive taste memory assay was used to assess fatty acid taste discrimination in female w1118 flies at a 1% concentration. First, initial responses to a short-, medium-, or long-chain fatty acid were assessed (Pretest). Next, flies were trained by pairing this fatty acid with quinine presentation immediately following tastant application (Training). Proboscis extension response (PER) in response to either the same or different fatty acid was then tested in the absence of quinine (Test). In control experiments (Naïve), the same procedure was followed, but quinine was not applied to the proboscis. (B) The pairing of medium-chain hexanoic acid (6C) and quinine (red) results in a significant reduction in PER compared to naïve flies. After training, PER response to 6C was significantly lower in trained flies compared to naïve flies (p<0.0001), but there was no difference in PER to short-chain valeric acid (5C; p=0.6864). Restricted maximum likelihood (REML): F1,80 = 7.329, p=0.0003, with Sidak’s test for multiple comparisons; N = 40–42. (C) The pairing of medium-chain hexanoic acid (6C) and quinine (red) results in a significant reduction in PER compared to naïve flies. After training, PER response to 6C was significantly lower in trained flies compared to naïve flies (p<0.0001), but there was no difference in PER to long-chain nonanoic acid (9C; p=0.3346). REML: F1,64 = 6.296, p=0.0146, with Sidak’s test for multiple comparisons; N = 33. (D) The pairing of short-chain valeric acid (5C) and quinine (red) results in a significant reduction in PER compared to naïve flies. After training, PER response to 5C was significantly lower in trained flies compared to naïve flies (p=0.0014), but there was no difference in PER to long-chain nonanoic acid (9C; p=0.0789). REML: F1,46 = 2.721, p=0.0105, with Sidak’s test for multiple comparisons; N = 24. (E) The pairing of short-chain butanoic acid (4C) and quinine (red) results in a significant reduction in PER compared to naïve flies. After training, PER to both 4C and short-chain valeric acid (5C) was significantly lower in trained flies compared to naïve flies (4C: p<0.0001; 5C: p<0.0001). REML: F1,38 = 33.67, p<0.0001, with Sidak’s test for multiple comparisons; N = 20. (F) The pairing of medium-chain hexanoic acid (6C) and quinine (red) results in a significant reduction in PER compared to naïve flies. After training, PER to both 6C and medium-chain heptanoic acid (7C) was significantly lower in trained flies compared to naïve flies (6C: p<0.0001; 7C: p<0.0001). REML: F1,81 = 45.88, p<0.0001, with Sidak’s test for multiple comparisons; N = 41–42. (G) The pairing of medium-chain hexanoic acid (6C) and quinine (red) results in a significant reduction in PER compared to naïve flies. After training, PER to both 6C and medium-chain octanoic acid (8C) was significantly lower in trained flies compared to naïve flies (6C: p<0.0001; 8C: p<0.0001). REML: F1,65 = 32.76, p<0.0001, with Sidak’s test for multiple comparisons; N = 33–34. (H) The pairing of medium-chain heptanoic acid (7C) and quinine (red) results in a significant reduction in PER compared to naïve flies. After training, PER to both 7C and medium-chain octanoic acid (8C) was significantly lower in trained flies compared to naïve flies (7C: p<0.0001; 8C: p<0.0001). REML: F1,72 = 33.67, p<0.0001, with Sidak’s test for multiple comparisons; N = 37. (I) The pairing of long-chain decanoic acid (10C) and quinine (red) results in a significant reduction in PER compared to naïve flies. After training, PER to both 10C and long-chain nonanoic acid (9C) was significantly lower in trained flies compared to naïve flies (10C: p<0.0001; 9C: p=0.0015). REML: F1,38 = 33.23, p<0.0001, with Sidak’s test for multiple comparisons; N = 20. Error bars indicate ± SEM. **p<0.01; ***p<0.001; ****p<0.0001.
-
Figure 1—source data 1
Raw taste discrimination data between short-, medium-, and long-chain fatty acids.
- https://cdn.elifesciences.org/articles/67878/elife-67878-fig1-data1-v2.xlsx
Figure 1—figure supplement 1
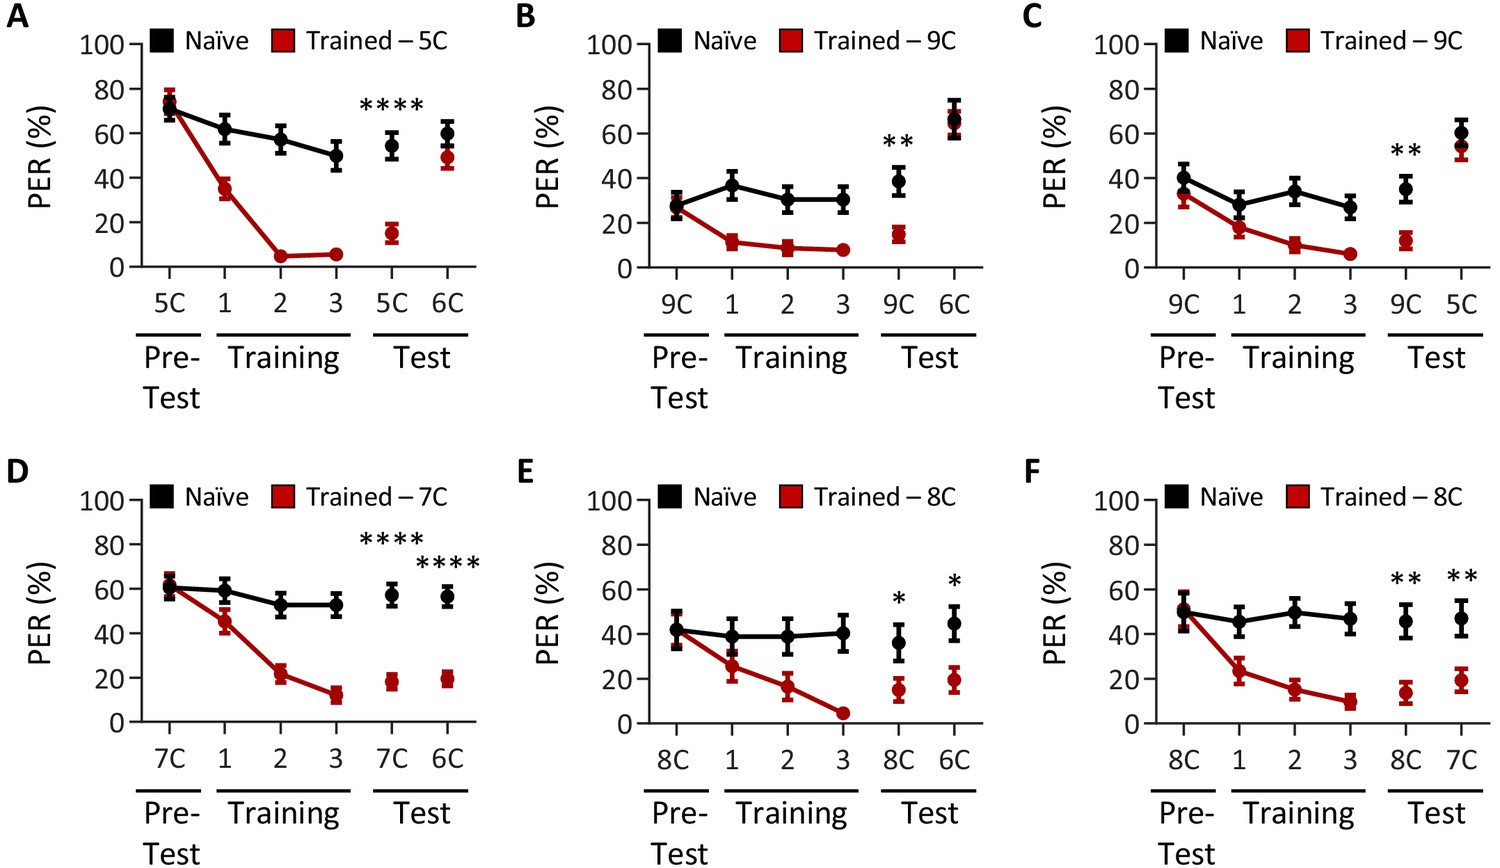
Drosophila can discriminate between, but not among, short-, medium-, and long-chain fatty acids.
Aversive taste memory was measured as described in Figure 1A. The tastants used during training and to assess taste discrimination are reciprocal to those in Figure 1 and were tested at a 1% concentration. (A) The pairing of short-chain valeric acid (5C) and quinine (red) results in a significant reduction in proboscis extension response (PER) compared to naïve flies. After training, PER response to 5C was significantly lower in trained flies compared to naïve flies (p<0.0001), but there was no difference in PER to medium-chain hexanoic acid (6C; p=0.2102). Restricted maximum likelihood (REML): F1,45 = 15.73, p=0.0003, with Sidak’s test for multiple comparisons; N = 23–24. (B) The pairing of long-chain nonanoic acid (9C) and quinine (red) results in a significant reduction in PER compared to naïve flies. After training, PER response to 9C was significantly lower in trained flies compared to naïve flies (p=0.0031), but there was no difference in PER to medium-chain hexanoic acid (6C; p=0.9811). REML: F1,123 = 4.254, p=0.0413, with Sidak’s test for multiple comparisons; N = 14–38. (C) The pairing of long-chain nonanoic acid (9C) and quinine (red) results in a significant reduction in PER compared to naïve flies. After training, PER response to 9C was significantly lower in trained flies compared to naïve flies (p=0.0077), but there was no difference in PER to short-chain valeric acid (5C; p=0.6868). REML: F1,64 = 6.207, p=0.0153, with Sidak’s test for multiple comparisons; N = 33. (D) The pairing of medium-chain heptanoic acid (7C) and quinine (red) results in a significant reduction in PER compared to naïve flies. After training, PER to both 7C and medium-chain hexanoic acid (6C) was significantly lower in trained flies compared to naïve flies (7C: p<0.0001; 6C: p<0.0001). REML: F1,98 = 62.64, p<0.0001, with Sidak’s test for multiple comparisons; N = 49–51. (E) The pairing of medium-chain octanoic acid (8C) and quinine (red) results in a significant reduction in PER compared to naïve flies. After training, PER to both 8C and medium-chain hexanoic acid (6C) was significantly lower in trained flies compared to naïve flies (8C: p=0.0428; 6C: p=0.0214). REML: F1,43 = 7.642, p=0.0084, with Sidak’s test for multiple comparisons; N = 22–23. (F) The pairing of medium-chain octanoic acid (8C) and quinine (red) results in a significant reduction in PER compared to naïve flies. After training, PER to both 8C and medium-chain heptanoic acid (7C) was significantly lower in trained flies compared to naïve flies (8C: p=0.0017; 7C: p=0.0068). REML: F1,46 = 20.72, p<0.0001, with Sidak’s test for multiple comparisons; N = 24. Error bars indicate ± SEM. *p<0.05; **p<0.01; ****p<0.0001.
Figure 1—figure supplement 2
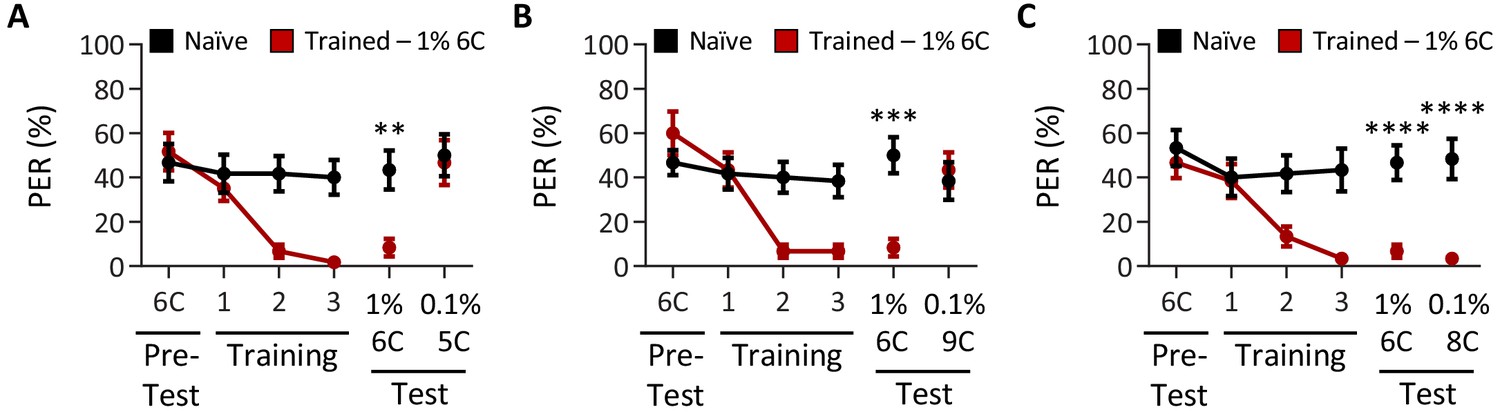
Tastant intensity does not affect the ability of Drosophila to discriminate between short-, medium-, and long-chain fatty acids.
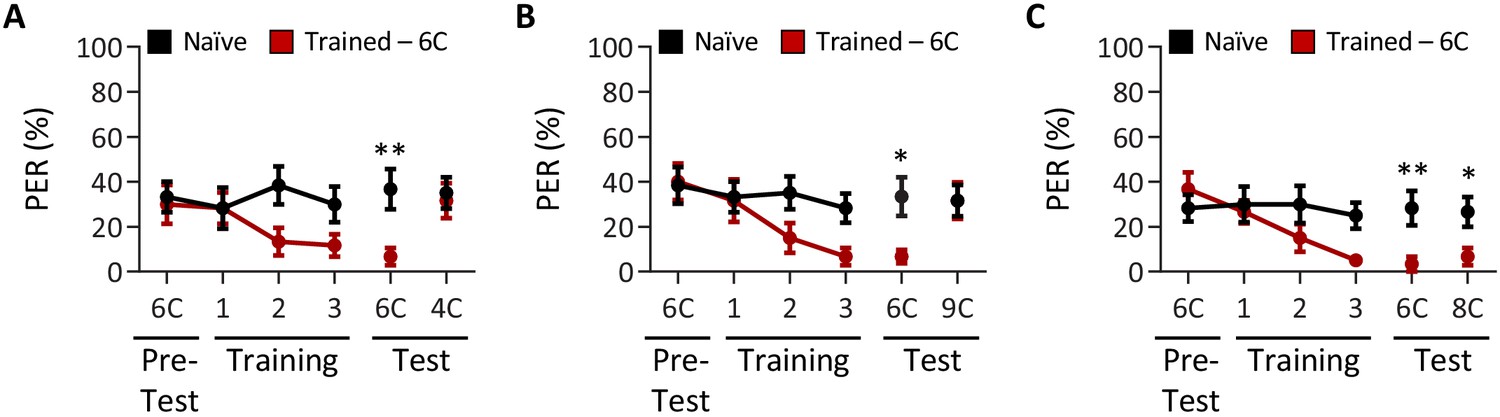
Aversive taste memory was measured as described in Figure 1A. (A) The pairing of medium-chain hexanoic acid (6C) and quinine (red) results in a significant reduction in proboscis extension response (PER) compared to naïve flies. After training, PER response to 1% 6C was significantly lower in trained flies compared to naïve flies (p=0.0090), but there was no difference in PER to 0.1% short-chain valeric acid (5C; p=0.9521). Restricted maximum likelihood (REML): F1,38 = 4.128, p=0.0492, with Sidak’s test for multiple comparisons; N = 20. (B) The pairing of medium-chain hexanoic acid (6C) and quinine (red) results in a significant reduction in PER compared to naïve flies. After training, PER response to 1% 6C was significantly lower in trained flies compared to naïve flies (p=0.0003), but there was no difference in PER to long-chain nonanoic acid (9C; p=0.8671). REML: F1,38 = 6.090, p=0.0158, with Sidak’s test for multiple comparisons; N = 20. (C) The pairing of medium-chain hexanoic acid (6C) and quinine (red) results in a significant reduction in PER compared to naïve flies. After training, PER to both 1% 6C and 0.1% medium-chain octanoic acid (8C) was significantly lower in trained flies compared to naïve flies (6C: p<0.0001; 8C: p<0.0001). REML: F1,38 = 35.94, p<0.0001, with Sidak’s test for multiple comparisons; N = 20. Error bars indicate ± SEM. **p<0.01; ***p<0.001; ****p<0.0001.
Figure 1—figure supplement 3
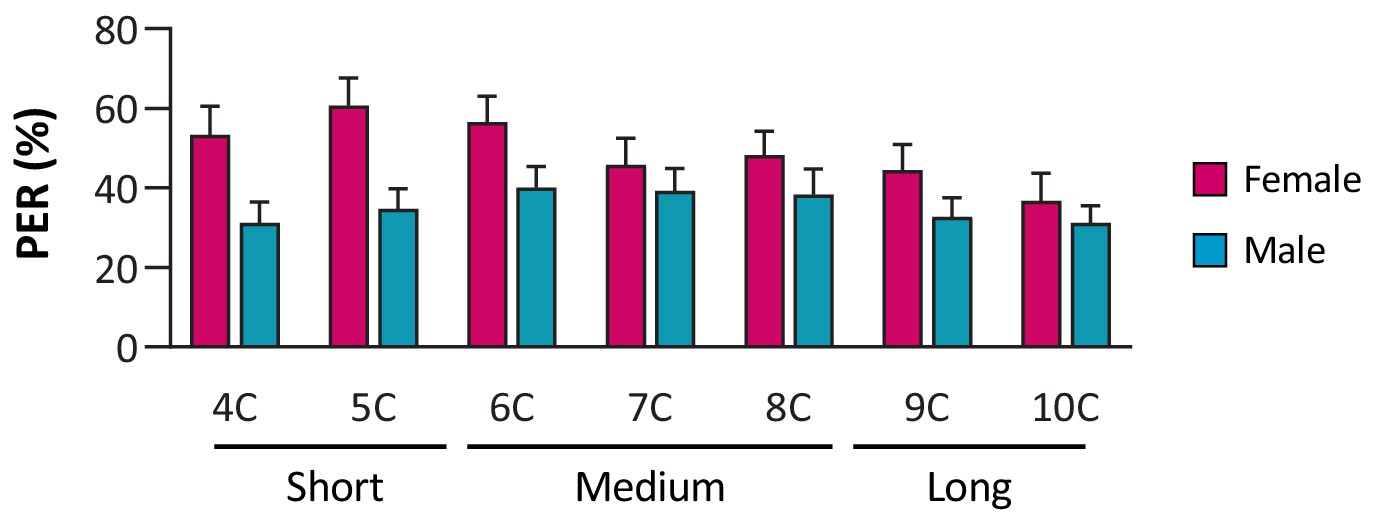
Drosophila of both sexes are responsive to short-, medium-, and long-chain fatty acids.
N = 28–40.
Figure 1—figure supplement 4
Drosophila males can discriminate between short-, medium-, and long-chain fatty acids, but not among medium-chain fatty acids.
Aversive taste memory was measured as described in Figure 1A, but in w1118 males. (A) The pairing of medium-chain hexanoic acid (6C) and quinine (red) results in a significant reduction in proboscis extension response (PER) compared to naïve flies. After training, PER response to 6C was significantly lower in trained flies compared to naïve flies (p=0.0085), but there was no difference in PER to short-chain butyric acid (4C; p=0. 9346). Restricted maximum likelihood (REML): F1,38 = 5.208, p=0.0282, with Sidak’s test for multiple comparisons; N = 20. (B) The pairing of medium-chain hexanoic acid (6C) and quinine (red) results in a significant reduction in PER compared to naïve flies. After training, PER response to 6C was significantly lower in trained flies compared to naïve flies (p=0.0193), but there was no difference in PER to long-chain nonanoic acid (9C; p=0.9999). REML: F1,38 = 4.143, p=0.0488, with Sidak’s test for multiple comparisons; N = 20. (C) The pairing of medium-chain hexanoic acid (6C) and quinine (red) results in a significant reduction in PER compared to naïve flies. After training, PER to both 6C and medium-chain octanoic acid (8C) was significantly lower in trained flies compared to naïve flies (6C: p=0.0056; 8C: p=0.0310). REML: F1,38 = 11.49, p=0.0017, with Sidak’s test for multiple comparisons; N = 20. Error bars indicate ± SEM. *p<0.05; **p<0.01.
Figure 2
Ablation of olfactory organs has no effect on the ability of Drosophila to discriminate between short-, medium-, and long-chain fatty acids.
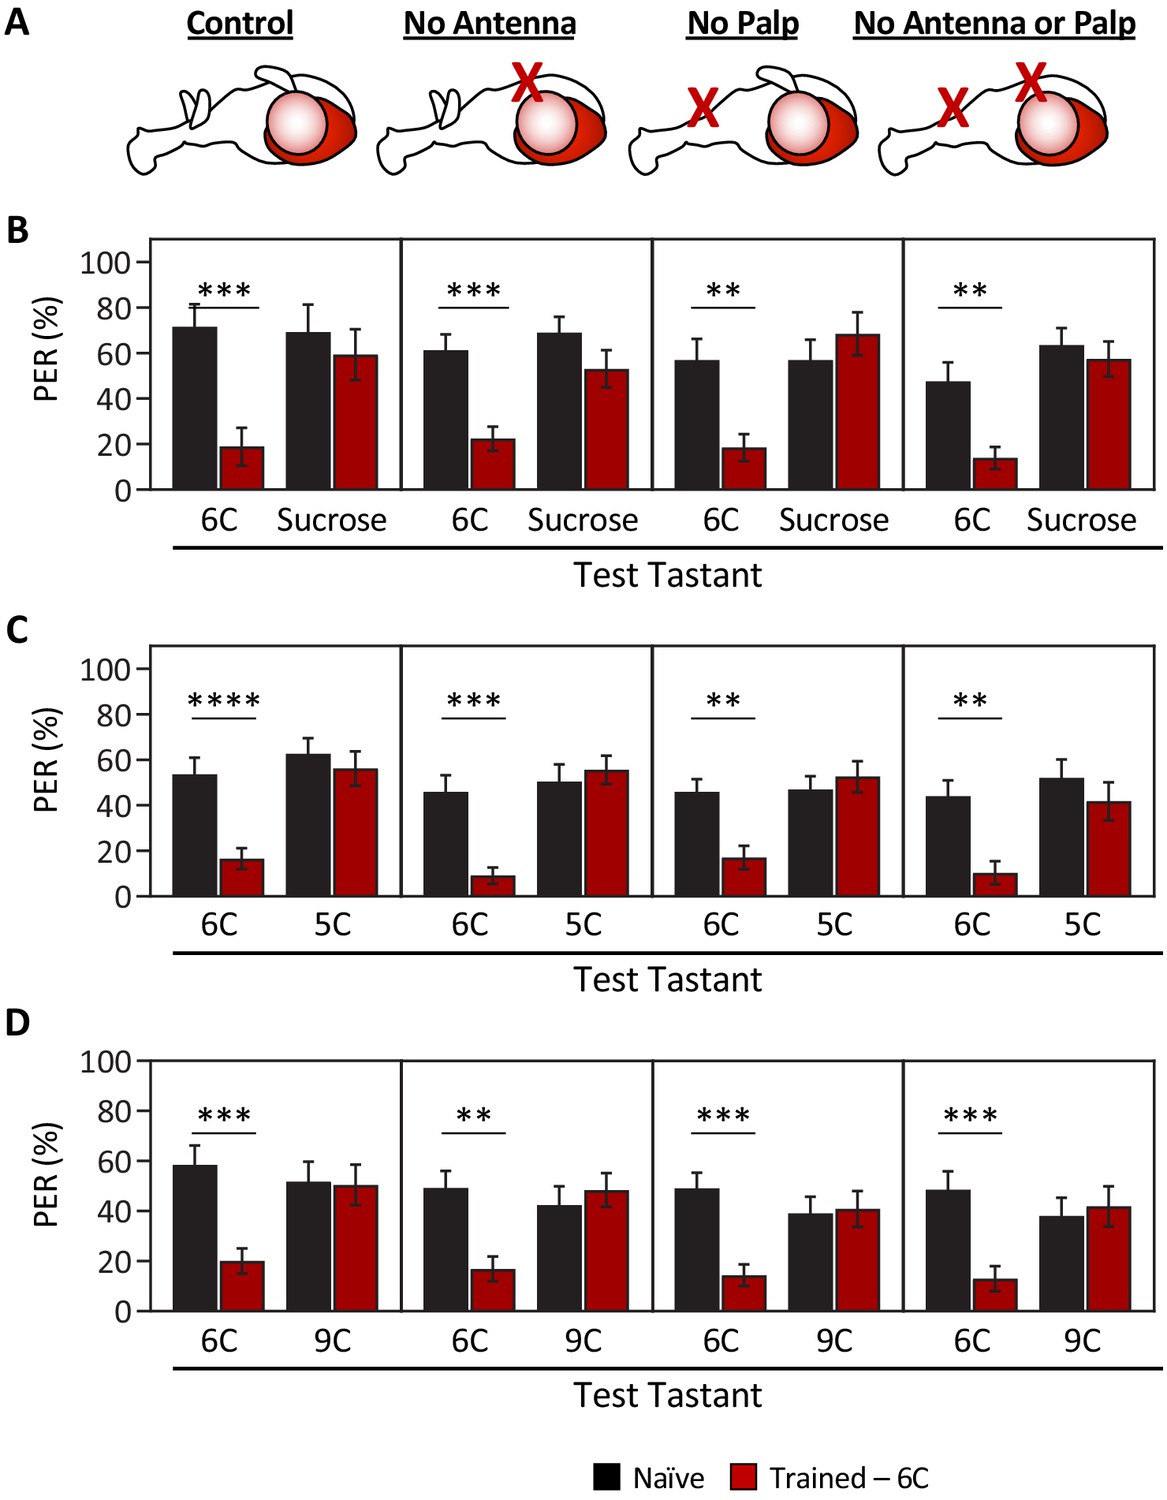
Aversive taste memory was measured as described in Figure 1A. Flies were trained by pairing 1% medium-chain hexanoic acid (6C) with quinine (Training; see Figure 1—figure supplement 3) and then proboscis extension response (PER) in response to either 10 mM sucrose, 1% short-chain valeric acid (5C), or 1% long-chain nonanoic acid (9C) was measured in the absence of quinine (Test). (A) Aversive taste memory was measured in unmanipulated control flies (first panel), in flies without antennae (second panel), maxillary palps (third panel), or both antennae and maxillary palps (fourth panel). (B) For all ablation treatments, taste memory to medium-chain hexanoic acid (6C) was significantly lower in trained flies compared to naïve flies, but there was no difference in PER to sucrose. Restricted maximum likelihood (REML): F1,86 = 42.41, p<0.0001, with Sidak’s test for multiple comparisons; N = 13–26. (C) For all ablation treatments, taste memory to 6C was significantly lower in trained flies compared to naïve flies, but there was no difference in PER to short-chain valeric acid (5C). REML: F1,103 = 51.87, p<0.0001, with Sidak’s test for multiple comparisons; N = 19–31. (D) For all ablation treatments, taste memory to 6C was significantly lower in trained flies compared to naïve flies, but there was no difference in PER to long-chain nonanoic acid (9C). REML: F1,97 = 11.47, p=0.0010, with Sidak’s test for multiple comparisons; N = 22–27. Error bars indicate ± SEM. **p<0.01; ***p<0.001; ****p<0.0001.
-
Figure 2—source data 1
Raw taste discrimination data after ablation of olfactory organs.
- https://cdn.elifesciences.org/articles/67878/elife-67878-fig2-data1-v2.xlsx
Figure 3 with 1 supplement
Silencing both IR56D- and GR64f-expressing neurons reduces taste perception to medium-chain fatty acids.
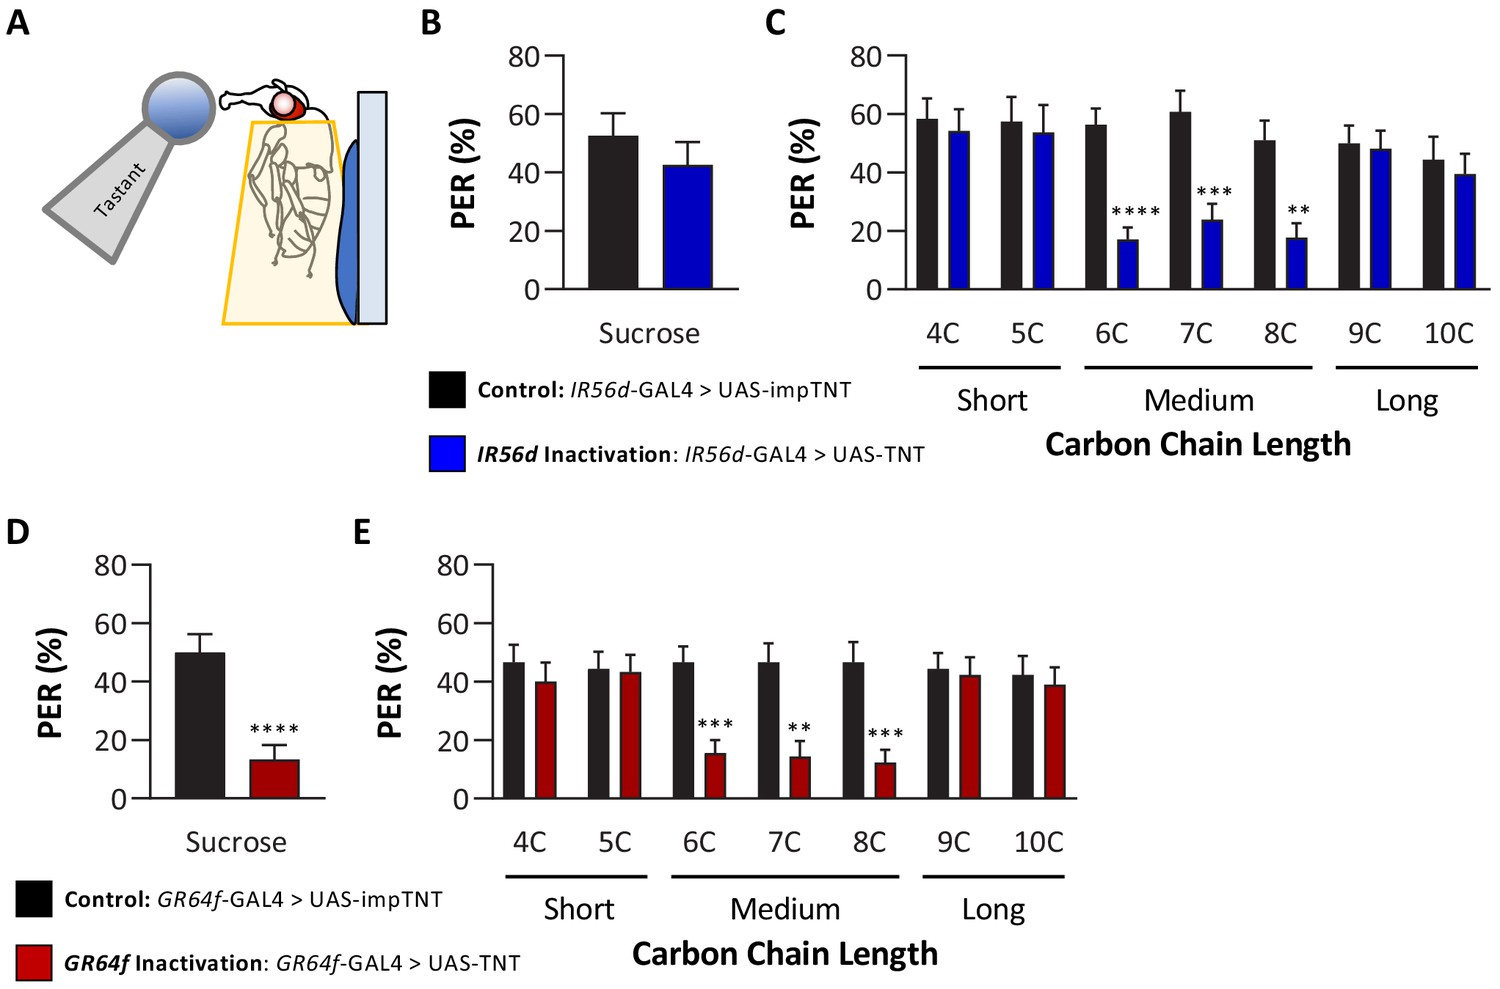
(A) Proboscis extension response (PER) was measured in female flies after 24 hr of starvation. Either 10 mM sucrose or 1% fatty acid was applied to the fly’s labellum for a maximum of 2 s and then removed to observe proboscis extension reflex. (B) Blocking synaptic release by genetic expression of light-chain tetanus toxin (UAS-TNT) in IR56D-expressing neurons has no effect on PER to sucrose compared to control flies expressing an inactive form of tetanus toxin (UAS-impTNT). Mann–Whitney test: U = 595, p=0.8410; N = 35. (C) Silencing IR56D-expressing neurons significantly reduces PER to medium-chain fatty acids (6C–8C), but has no effect on PER to either short- (4C, 5C) or long-chain fatty acids (9C, 10C). Restricted maximum likelihood (REML): F1,406 = 25.03, p<0.0001, with Sidak’s test for multiple comparisons; N = 24–45. (D) Blocking synaptic release by genetic expression of light-chain tetanus toxin (UAS-TNT) in GR64f-expressing neurons significantly reduces PER to sucrose compared to control flies expressing an inactive form of tetanus toxin (UAS-impTNT). Mann–Whitney test: U = 177, p<0.0001; N = 30. (E) Silencing GR64f-expressing neurons significantly reduces PER to medium-chain fatty acids (6C–8C), but has no effect on PER to either short- (4C, 5C) or long-chain fatty acids (9C, 10C). REML: F1,58 = 22.68, p<0.0001, with Sidak’s test for multiple comparisons; N = 30. Error bars indicate ± SEM. **p<0.01; ***p<0.001; ****p<0.0001.
-
Figure 3—source data 1
Raw data from proboscis extension response experiments to short-, medium-, and long-chain fatty acids.
- https://cdn.elifesciences.org/articles/67878/elife-67878-fig3-data1-v2.xlsx
Figure 3—figure supplement 1
IR76b and IR25a are required for taste perception to short-, medium-, and long-chain fatty acids.
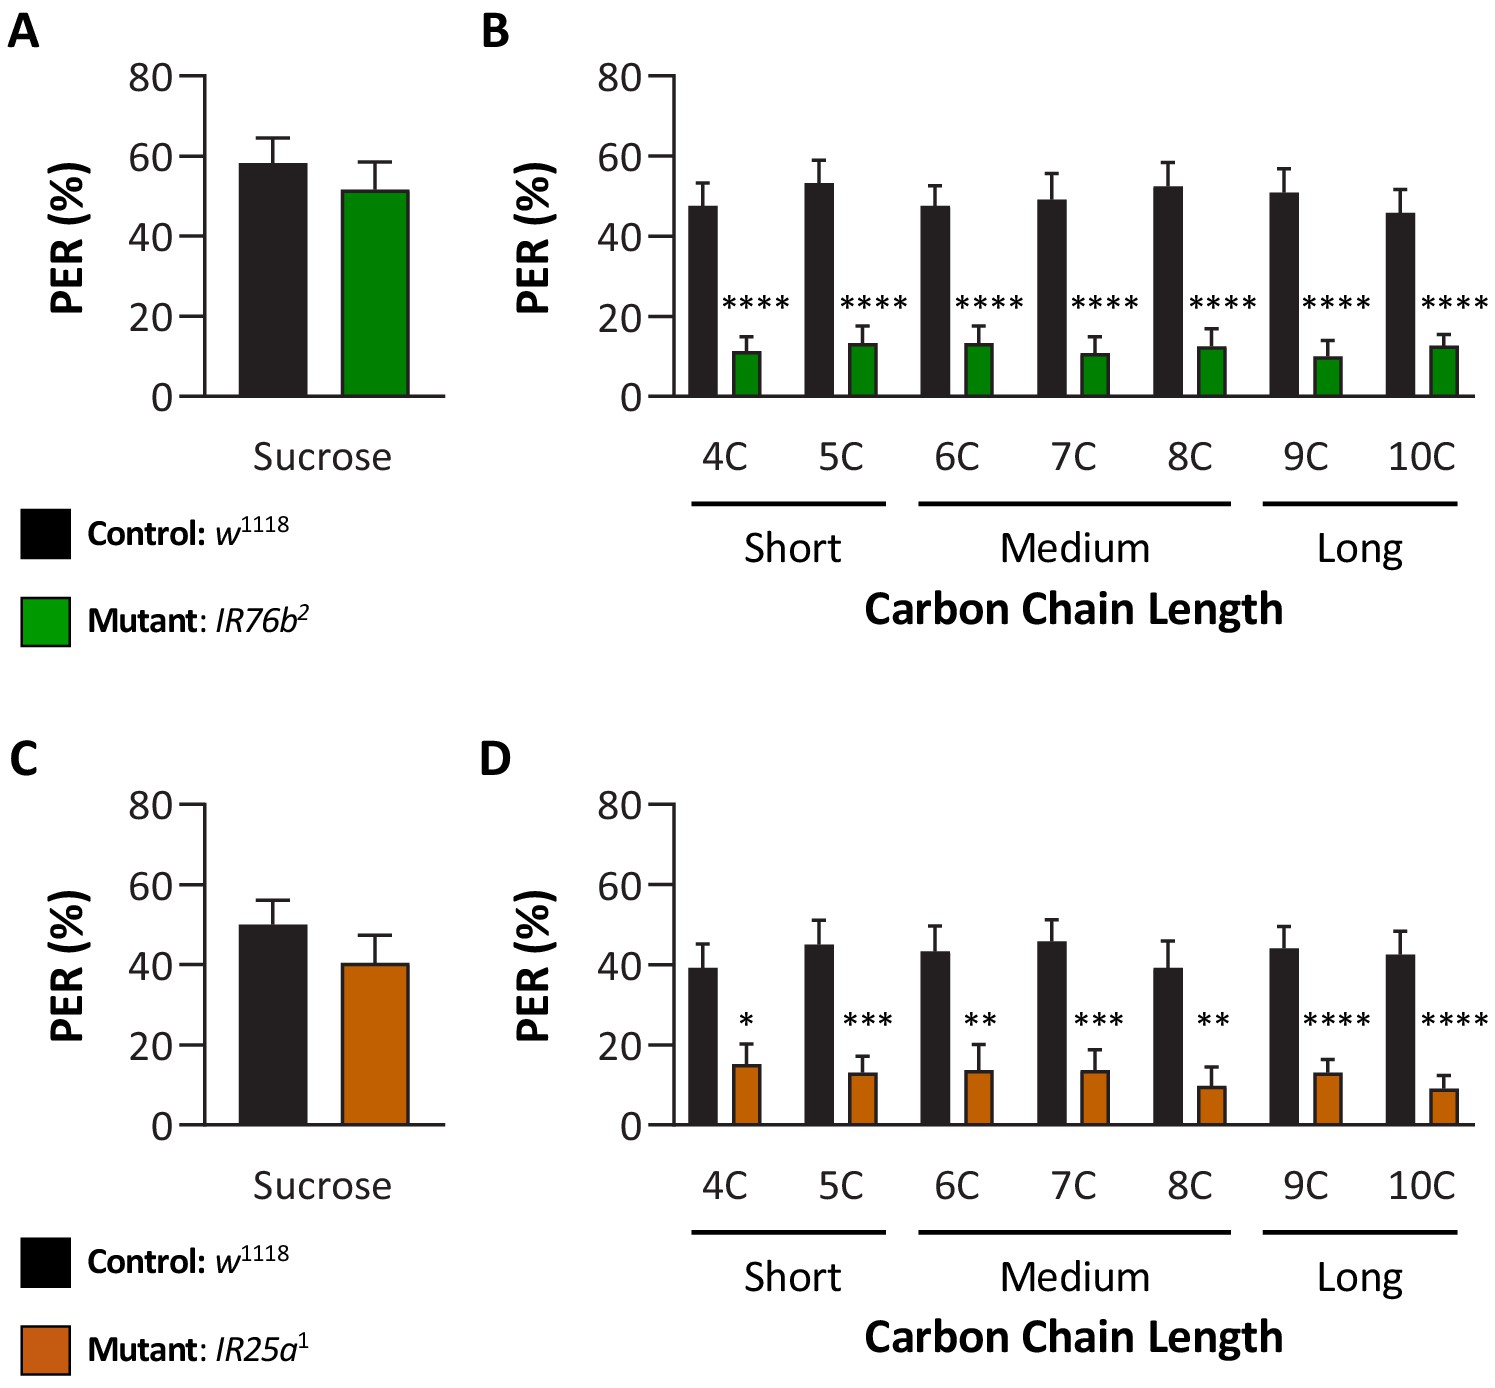
Proboscis extension response (PER) was measured as described in Figure 3A. (A) Both control and IR76b2 mutant flies are responsive to sucrose. Mann–Whitney test: U = 740, p=0.5502; N = 40. (B) IR76b2 mutant flies significantly reduce PER to fatty acids compared to control flies. Restricted maximum likelihood (REML): F1,88 = 82.53, p<0.0001, with Sidak’s test for multiple comparisons; N = 40–50. (C) Both control and IR25a1 mutant flies are responsive to sucrose. Mann–Whitney test: U = 565, p=0.2799; N = 33–40. (D) IR25a1 mutant flies significantly reduce PER to fatty acids compared to control flies. REML: F1,71 = 43.40, p<0.0001, with Sidak’s test for multiple comparisons; N = 17–40. Error bars indicate ± SEM. *p<0.05; **p<0.01; ***p<0.001; ****p<0.0001.
Figure 4 with 1 supplement
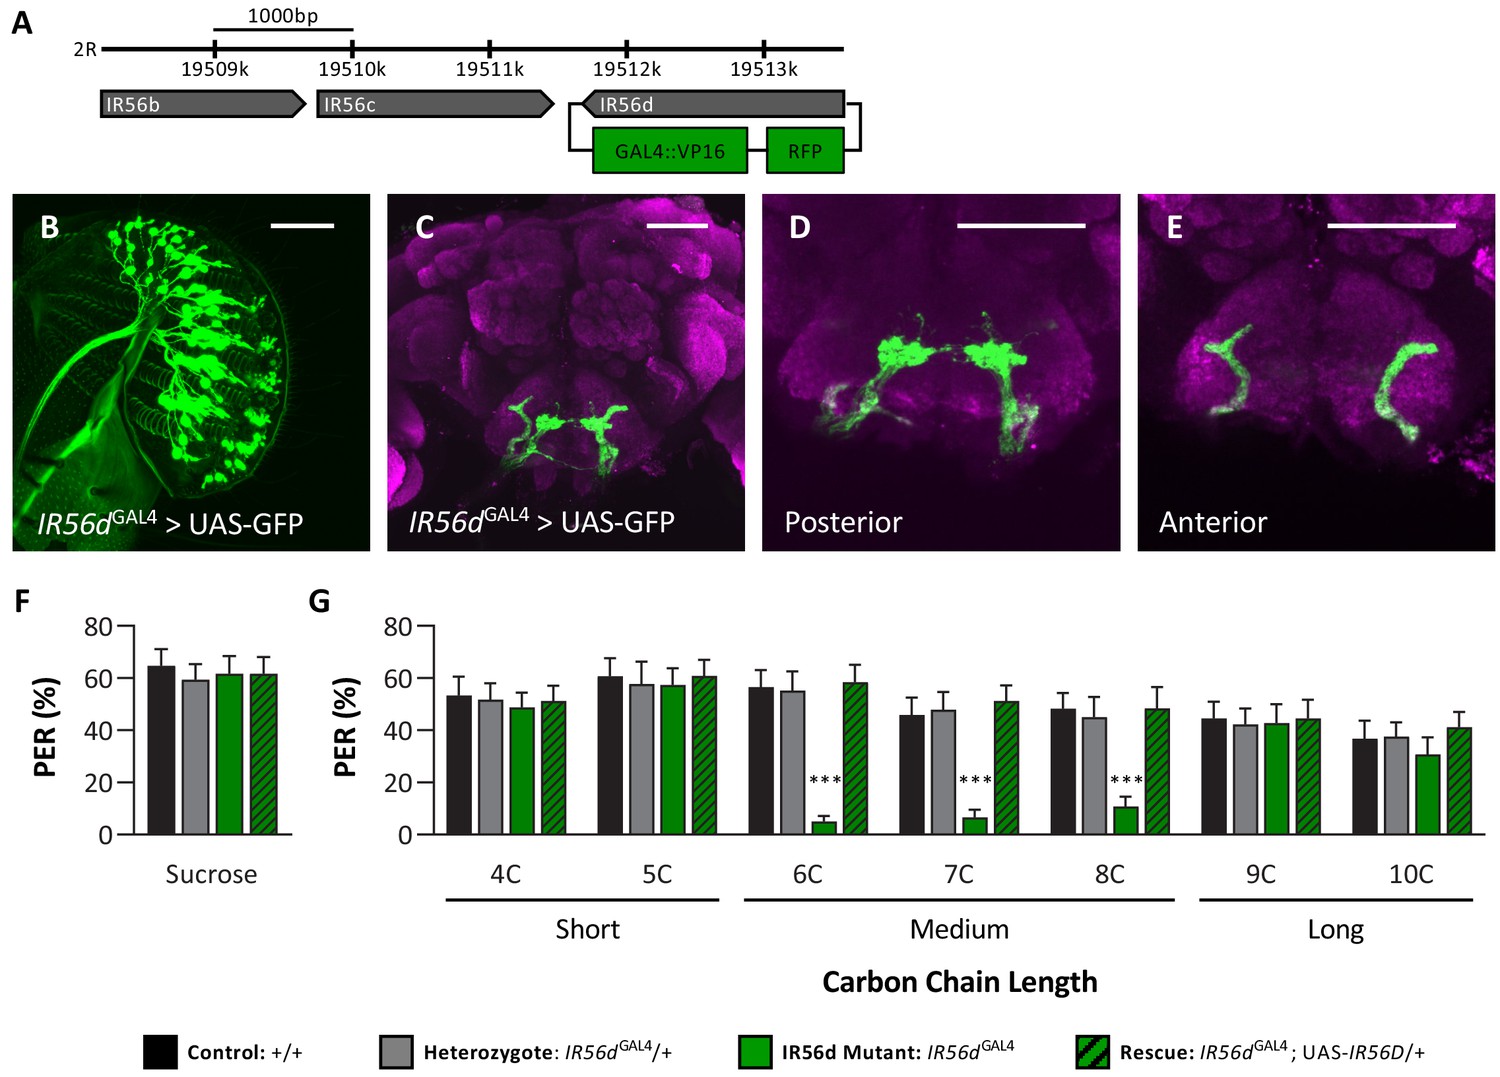
IR56D mediates taste perception to medium-chain fatty acids.
(A) IR56dGAL4 was generated using the CRISPR/Cas9 system. In IR56dGAL4 flies, the IR56d gene was replaced by GAL4 and RFP elements (green boxes). The relative location and orientation of genes in the region are represented as gray arrows. (B–E) Expression pattern of IR56dGAL4 is visualized with GFP. IR56d-expressing neurons are located on the (B) labellum and project to the (C) subesophageal zone of the brain. Distinct regions of projection include the (D) posterior and (E) anterior subesophageal zones. Background staining is NC82 antibody (magenta). Scale bar = 50 μm. (F) Sucrose taste perception is similar in control and IR56dGAL4 mutant flies. Kruskal–Wallis test: H = 0.1758, p=0.9814, with Dunn’s test for multiple comparisons; N = 33–40. (G) The IR56dGAL4 flies have reduced proboscis extension response to medium-chain fatty acids (6C–8C) relative to control, IR56dGAL4 heterozygotes, and IR56dGAL4 rescue flies. However, all genotypes respond similarly to both short- and long-chain fatty acids (4C, 5C; 9C, 10C). Restricted maximum likelihood: F3,850 = 17.80, p<0.0001, with Sidak’s test for multiple comparisons; N = 28–40. Error bars indicate ± SEM. ****p<0.0001.
-
Figure 4—source data 1
Raw data from IR56dGAL4proboscis extension response experiments.
- https://cdn.elifesciences.org/articles/67878/elife-67878-fig4-data1-v2.xlsx
Figure 4—figure supplement 1
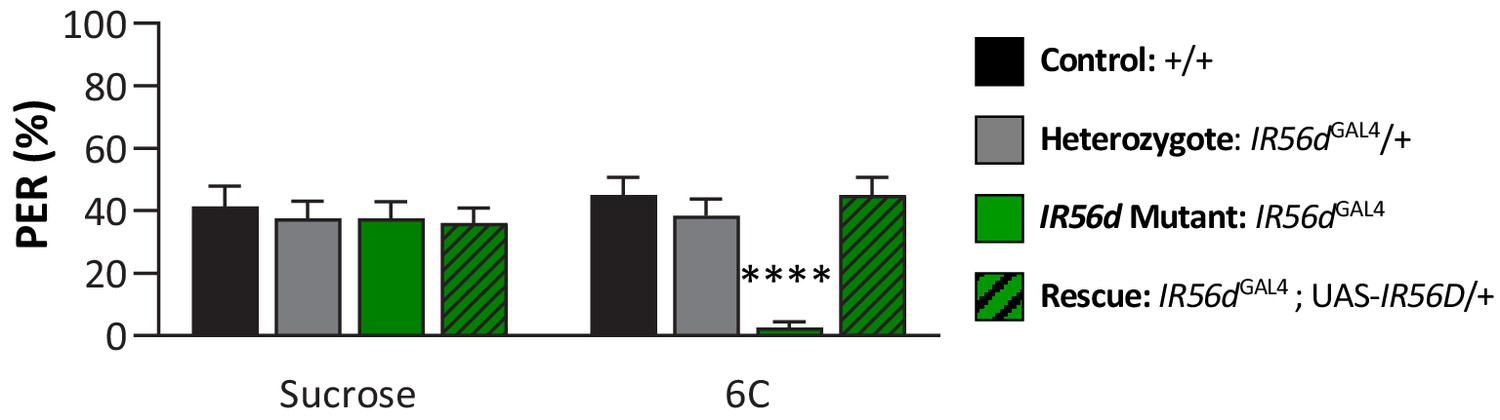
IR56d mediates taste perception to medium-chain hexanoic acid (6C) in male flies.
Although sucrose taste perception is similar in control and IR56dGAL4 mutant flies, IR56dGAL4 flies have reduced proboscis extension response to medium-chain hexanoic acid (6C) relative to control, IR56dGAL4 heterozygotes, and IR56dGAL4 rescue flies. Restricted maximum likelihood: F3,150 = 5.394, p=0.0015, with Sidak’s test for multiple comparisons; N = 37–40. Error bars indicate ± SEM. ****p<0.0001.
Figure 5 with 1 supplement
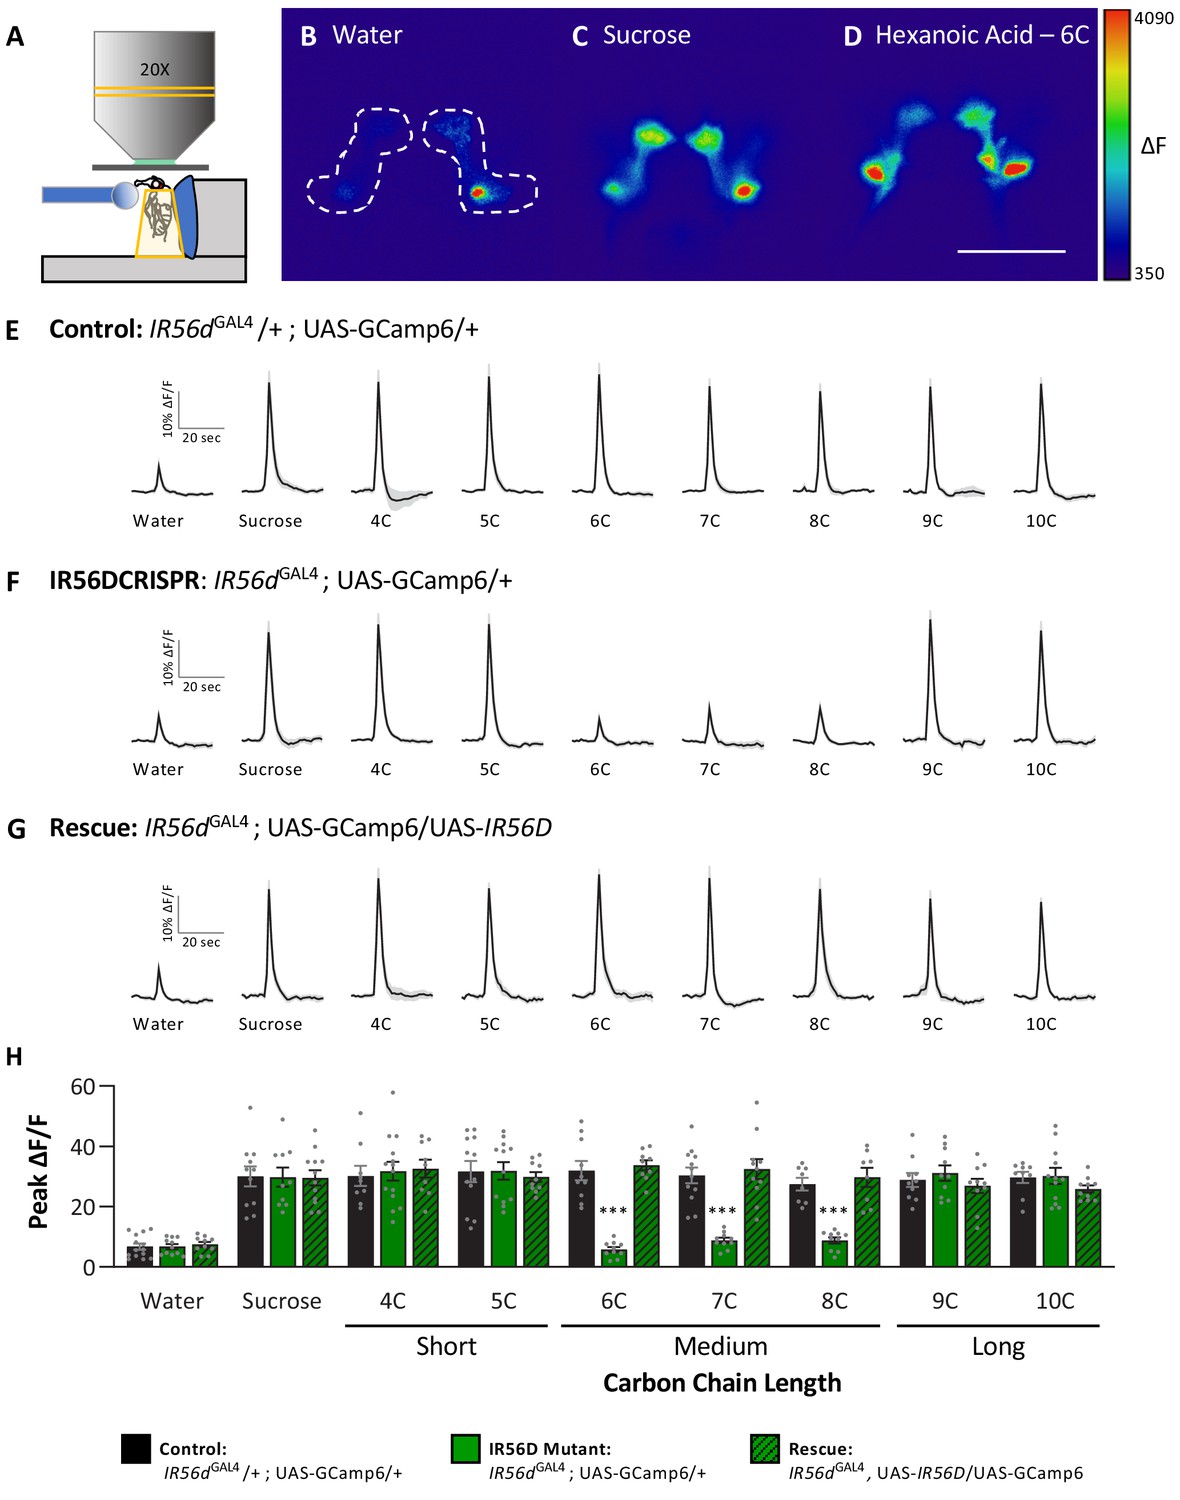
Neuronal responsiveness in posterior labellar taste neurons of IR56dGAL4 mutant flies is reduced in response to medium-chain fatty acids.
(A) Diagram of live-imaging experimental protocol. A tastant is applied to the proboscis while florescence is recorded simultaneously. (B–D) Representative pseudocolor images of calcium activity in the posterior projections of IR56D neurons in response to water (B), 10 mM sucrose (C), or 1% hexanoic acid (D). Shown is the change in UAS-GCaMP6 fluorescence (ΔF). Scale bar = 50 μm. (E–G) Activity traces of the posterior projections of IR56D neurons in response to each tastant in the (E) IR56dGAL4 heterozygote controls, (F) IR56dGAL4 mutants, and (G) IR56dGAL4 rescue flies. The shaded region of each trace indicates ± SEM. (H) Average peak change in fluorescence for data shown in (E–G). Neuronal responses to medium-chain fatty acids (6C–8C) are significantly reduced in IR56dGAL4 mutants compared to IR56dGAL4 heterozygote controls and IR56dGAL4 rescue flies. All genotypes respond similarly to both short- and long-chain fatty acids (4C, 5C; 9C, 10C), as well as to water and sucrose. Two-way ANOVA: F2,256 = 23.67, p<0.0001, with Sidak’s test for multiple comparisons; N = 8–14. Error bars indicate ± SEM. ***p<0.001.
-
Figure 5—source data 1
Raw imaging data from the posterior labellar region in IR56dGAL4 flies.
- https://cdn.elifesciences.org/articles/67878/elife-67878-fig5-data1-v2.xlsx
Figure 5—figure supplement 1
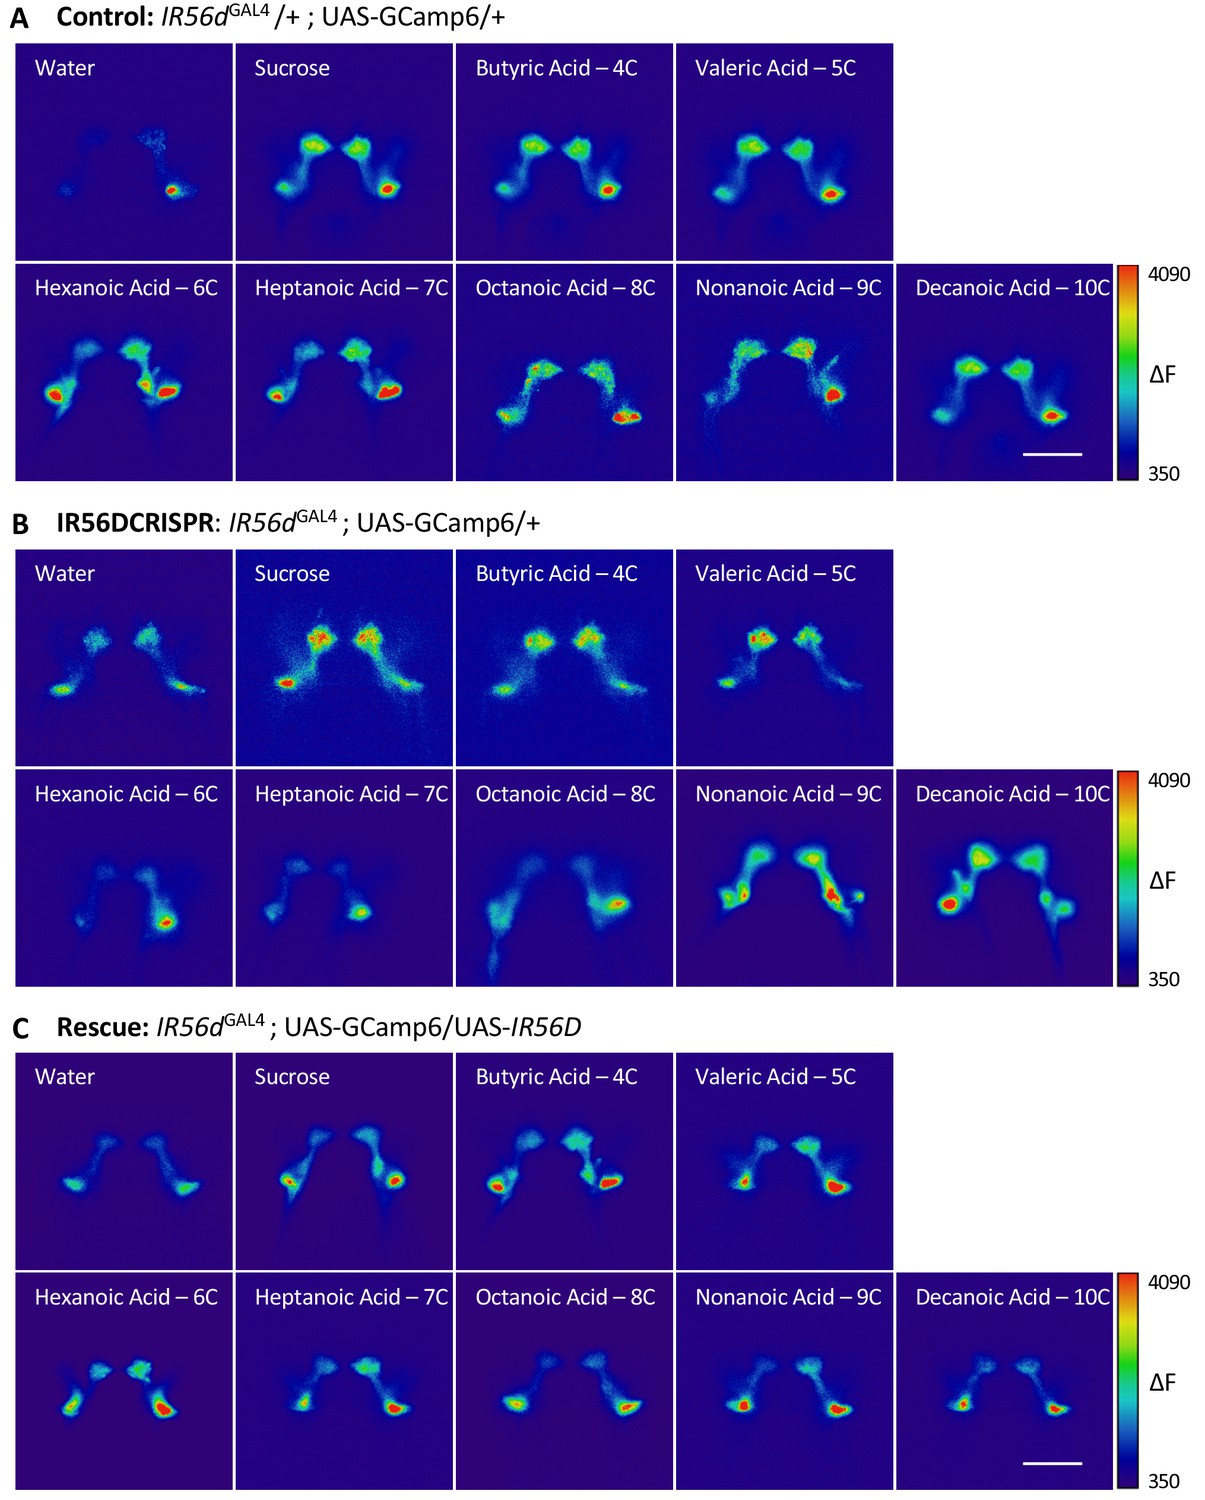
Representative pseudocolor images of calcium activity in the posterior projections of IR56d neurons in response to fatty acid presentation.
The change in UAS-GCaMP6 fluorescence (ΔF) is shown for (A) IR56dGAL4 heterozygote controls, (B) IR56dGAL4 mutants, and (C) IR56dGAL4 rescue flies. Error bars indicate ± SEM. ****p<0.0001.
Figure 6
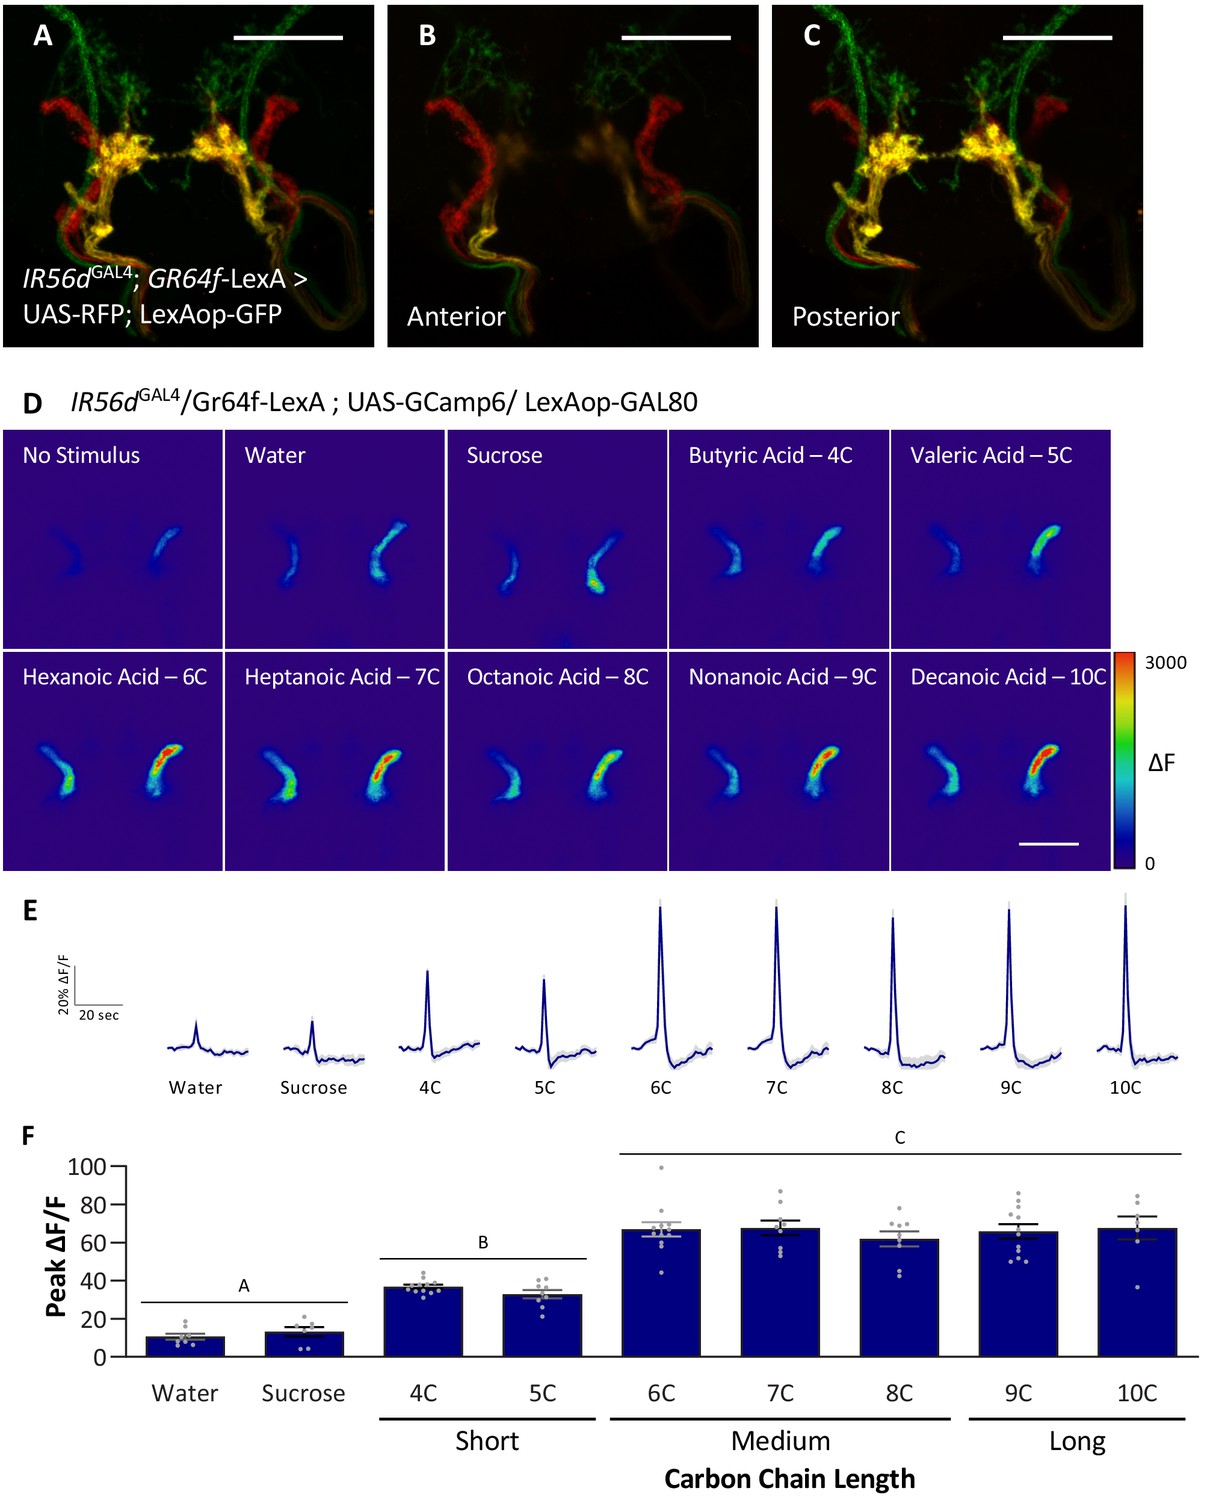
Anterior, non-GR64f-IR56d-expressing neurons are response to short-, medium-, and long-chain fatty acids.
(A–C) Colocalization of IR56dGAL4 and GR64f-expressing neurons occurs in the posterior subesophageal zone. (A) Expression pattern of IR56dGAL4 and GR64f is visualized with IR56dGAL4 driving UAS-RFP and GR64f-LexA driving LexAop-GFP. Colocalization (yellow) is detected in the posterior projections (B), but not in the anterior projections (C). Scale bar = 50 μm. (D–F) Restricting UAS-GCaMP6 expression to the non-overlapping anterior projection neurons does not significantly impact neuronal activity in response to short-, medium-, or long-chain fatty acid presentation. Live imaging was performed as described in Figure 5A. (D) Representative pseudocolor images of calcium activity in the anterior projections of non-GR64f-IR56d-expressing neurons in response to tastant presentation. Shown is the change in UAS-GCaMP6 fluorescence (ΔF). Scale bar = 50 μm. (E) Activity traces of the anterior projections of non-GR64f-IR56d-expressing neurons in response to each tastant in the IR56dGAL4 rescue flies. The shaded region of each trace indicates ± SEM. (F) Average peak change in fluorescence for data shown in (E). Neuronal activity in response to water and sucrose presentation is significantly reduced compared to fatty acid presentation, while responses to short-chain fatty acids (4C, 5C) are intermediate compared to medium- and long-chain fatty acids (6C–10C). No difference in neural activity between medium- and long-chain fatty acid presentation was observed. One-way ANOVA: F8,76 = 45.22, p<0.0001, with Sidak’s test for multiple comparisons; N = 7–12. Error bars indicate ± SEM. ***p<0.001.
-
Figure 6—source data 1
Raw imaging data from the anterior, non-GR64f-IR56d-expressing region in IR56dGAL4 flies.
- https://cdn.elifesciences.org/articles/67878/elife-67878-fig6-data1-v2.xlsx
Additional files
Download links
A two-part list of links to download the article, or parts of the article, in various formats.
Downloads (link to download the article as PDF)
Open citations (links to open the citations from this article in various online reference manager services)
Cite this article (links to download the citations from this article in formats compatible with various reference manager tools)
Ir56d-dependent fatty acid responses in Drosophila uncover taste discrimination between different classes of fatty acids
eLife 10:e67878.
https://doi.org/10.7554/eLife.67878


