Impairing one sensory modality enhances another by reconfiguring peptidergic signalling in Caenorhabditis elegans
- Cell Biology Division, MRC Laboratory of Molecular Biology, United Kingdom
- Institute of Science and Technology Austria (IST Austria), Austria
Figures
Figure 1 with 1 supplement
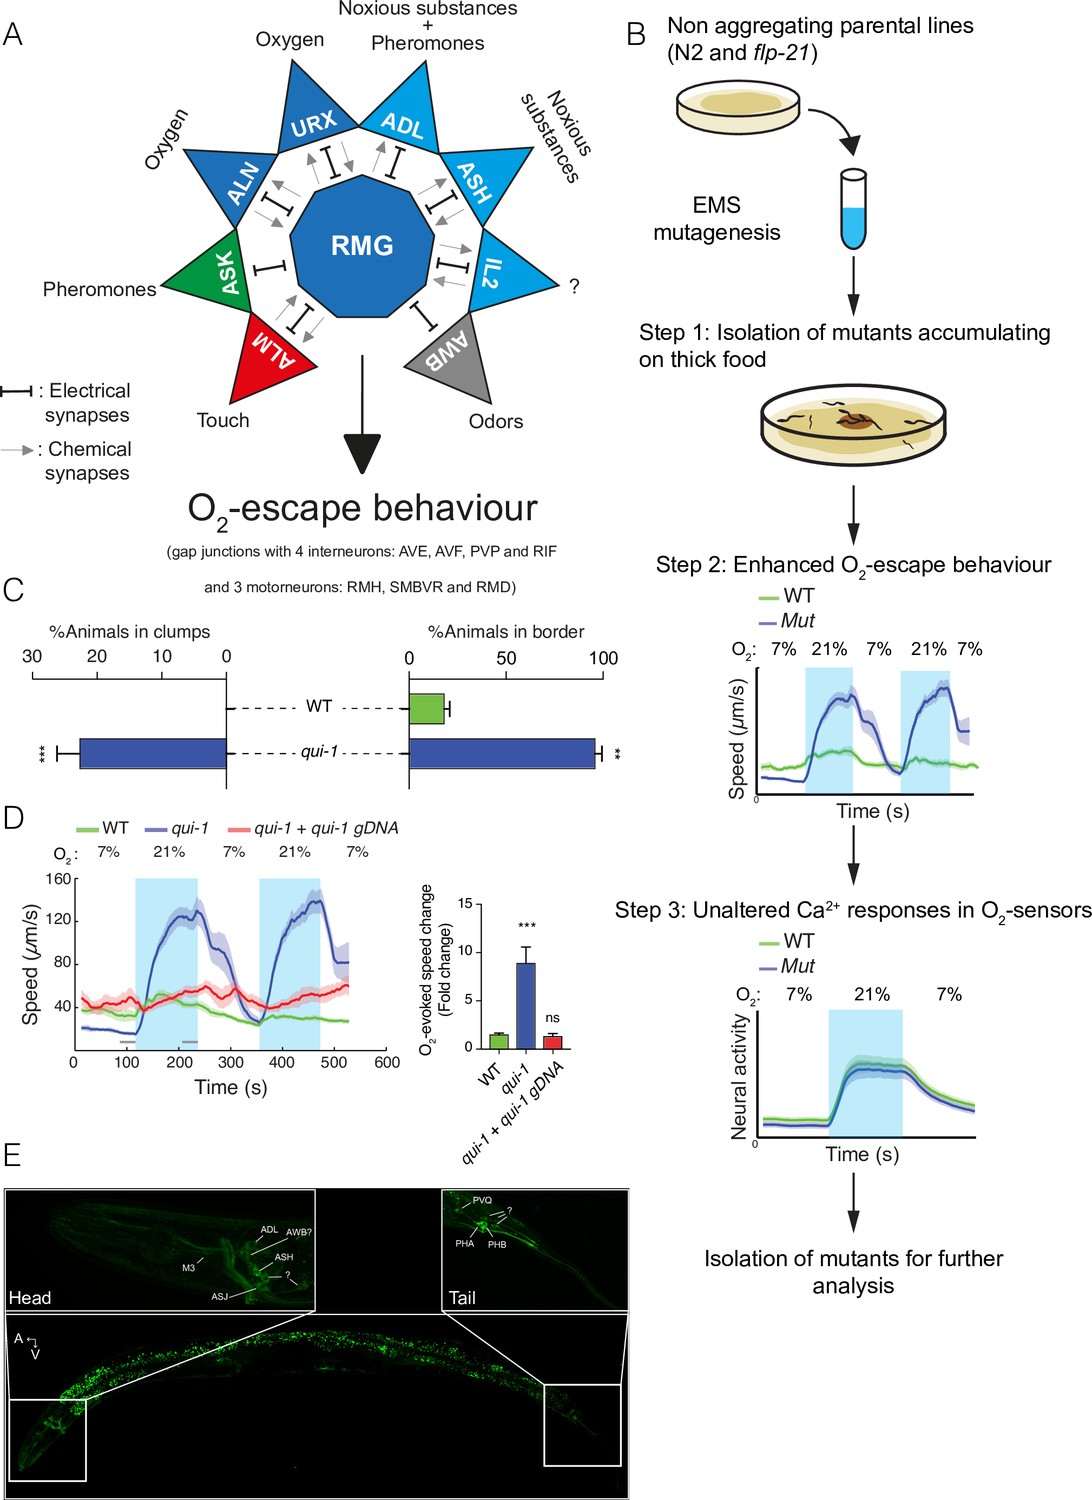
A genetic screen for mutants with enhanced O2-escape behaviour.
(A) The hub-and-spoke circuit associated with the URX O2 sensors and O2-escape behaviour, updated according to Cook et al., 2019. (B) Schematic of the genetic screen. We selected mutants that preferentially accumulate on thicker bacteria, a behaviour that depends on O2 responses (Step 1), screened these mutants for increased O2-escape behaviour (Step 2), and then identified strains with overtly normal O2-evoked Ca2+ responses in the URX O2 sensors and RMG interneurons (Step 3). (C) Bar graphs quantifying aggregation and bordering behaviour. N = 4–6 assays. (D) A wild-type copy of qui-1 rescues the O2-escape phenotype of qui-1(db104) mutants. Left: line shows average speed, shading shows standard error of the mean (SEM), and grey bars show the 30s time intervals used to calculate the average speed at 7% and 21% O2. Right: the bar graph shows the fold change in average speed at 21% O2 compared to 7% O2. N = 6–9 assays. (E) QUI-1 expression and localization using an mNeonGreen::qui-1 translational fusion knock-in strain. Fluorescent neurons include ADL, ASH (Head) and PVQ, PHB and PHA (Tail), and potentially M3, AWB, and ASJ based on position and morphology. Also visible is yellow gut autofluorescence. Statistics: **p value ≤0.01; ***p value ≤0.001; ns, not significant, Mann–Whitney U-test. Comparisons are with wild-type. (C, D) Error bars represent standard error of the mean.
Figure 1—figure supplement 1
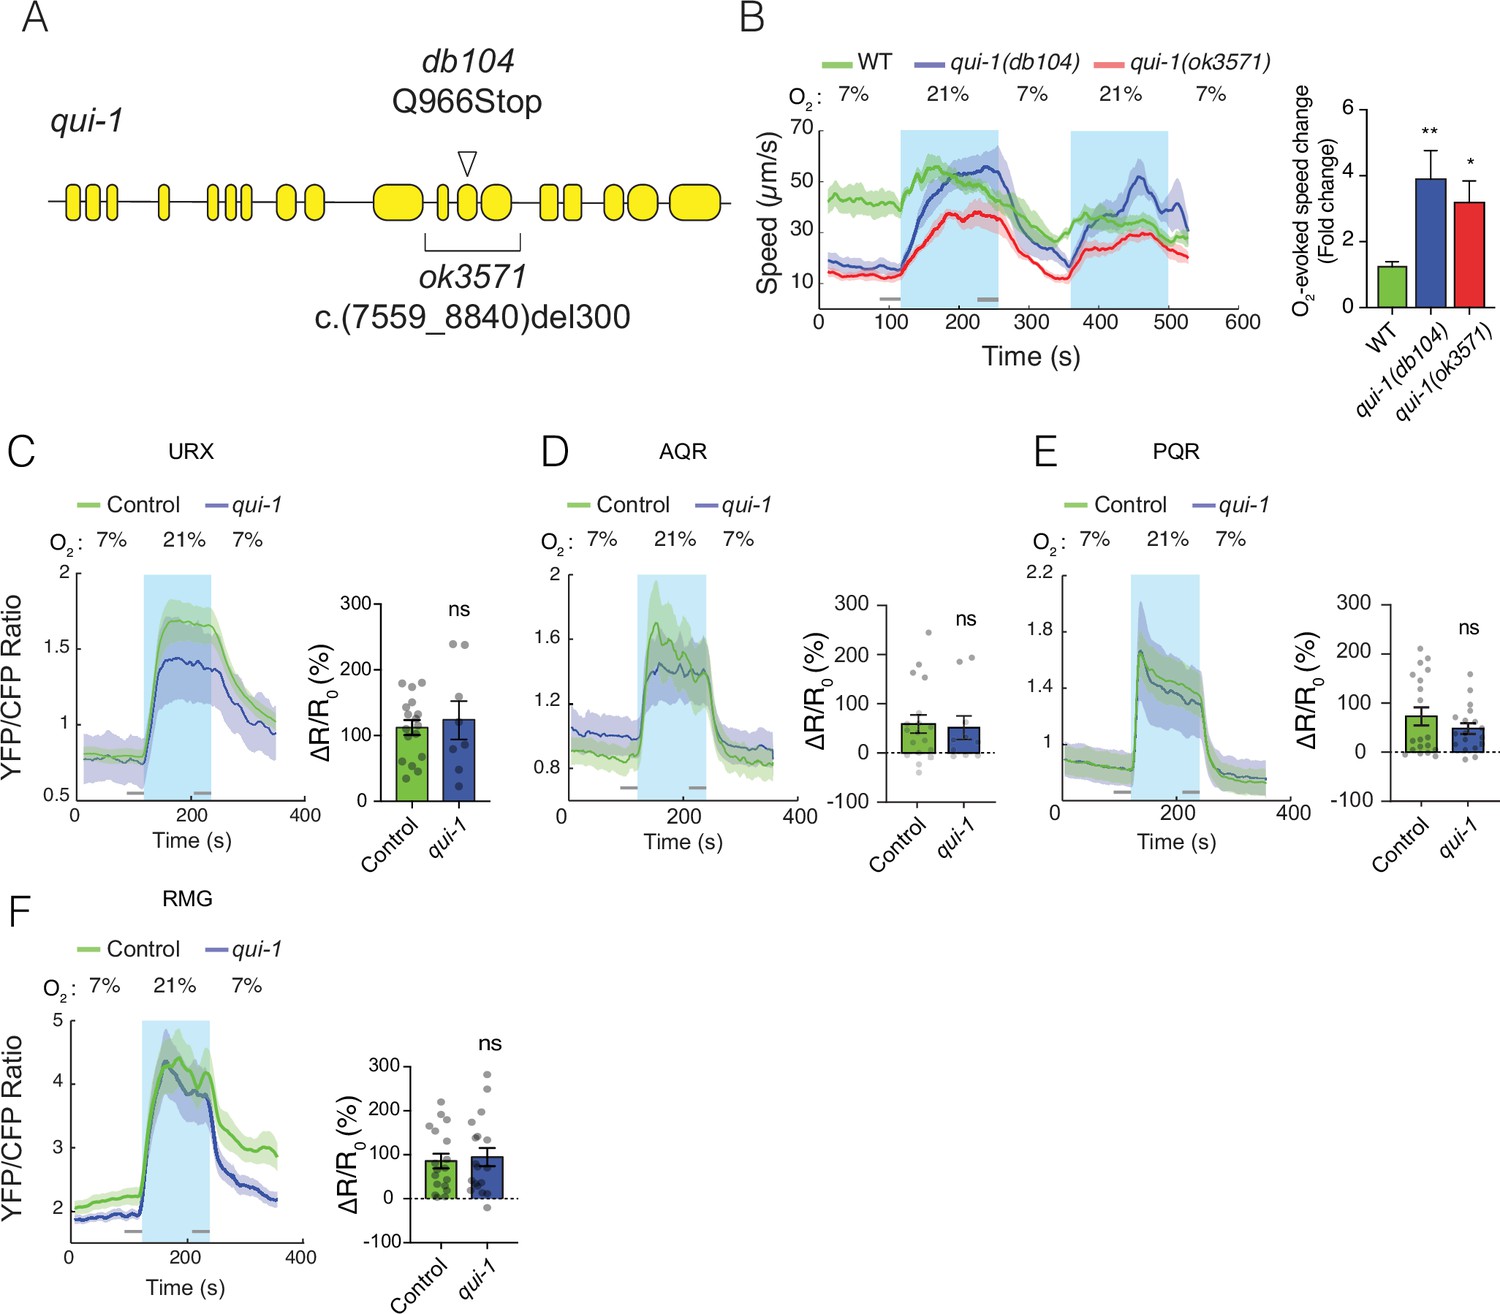
Characterization of qui-1 mutants.
(A) Schematic of the qui-1 locus, showing lesions in qui-1(db104) and qui-1(ok3571). (B) The O2-escape behaviours of qui-1(db104) and qui-1(ok3571) animals are indistinguishable. Left: line shows average speed, while shading represents standard error of the mean (SEM). Grey bars show 30s time intervals used to calculate the average speed at 7% and 21% O2. Right: bar graph shows fold change in average speed at 21% O2 compared to 7% O2. N = 3–5 assays. (C–F) O2-evoked Ca2+ responses in the URX, AQR, and PQR O2 sensors, and in the RMG hub interneurons, are indistinguishable in qui-1 and wild-type control animals. Lines show the average YFP/CFP ratio, which reports Ca2+ levels; shading represents SEM. Bar plots quantify O2-evoked Ca2+ responses. URX: N = 17 (Control) and N = 8 (qui-1); both strains carry a dbEx614[gcy-37p:YC2.60; unc-122p:rfp] transgene. AQR: N = 18 (Control) and N = 10 (qui-1); both strains carry dbEx(pgcy-32::YC3.60 lin-15(+)) transgene. PQR: N = 19 (Control) and N = 18 (qui-1); both strains carry a dbEx(pgcy-32::YC3.60 lin-15(+)). RMG: N = 18 (Control) and N = 18 (qui-1); both strains carry dbEx637[ncs-1p::Cre; flp-21p:loxP:STOP:loxP:YC2.60; unc-122p:rfp]. ∆R/Ro (%) was calculated using the 30s intervals indicated by the grey bars. Statistics: *p ≤ 0.05; **p ≤ 0.01; ns, not significant. Mann–Whitney U-test. Comparisons are with WT or Control, which is N2 bearing the indicated transgene.
Figure 2 with 1 supplement
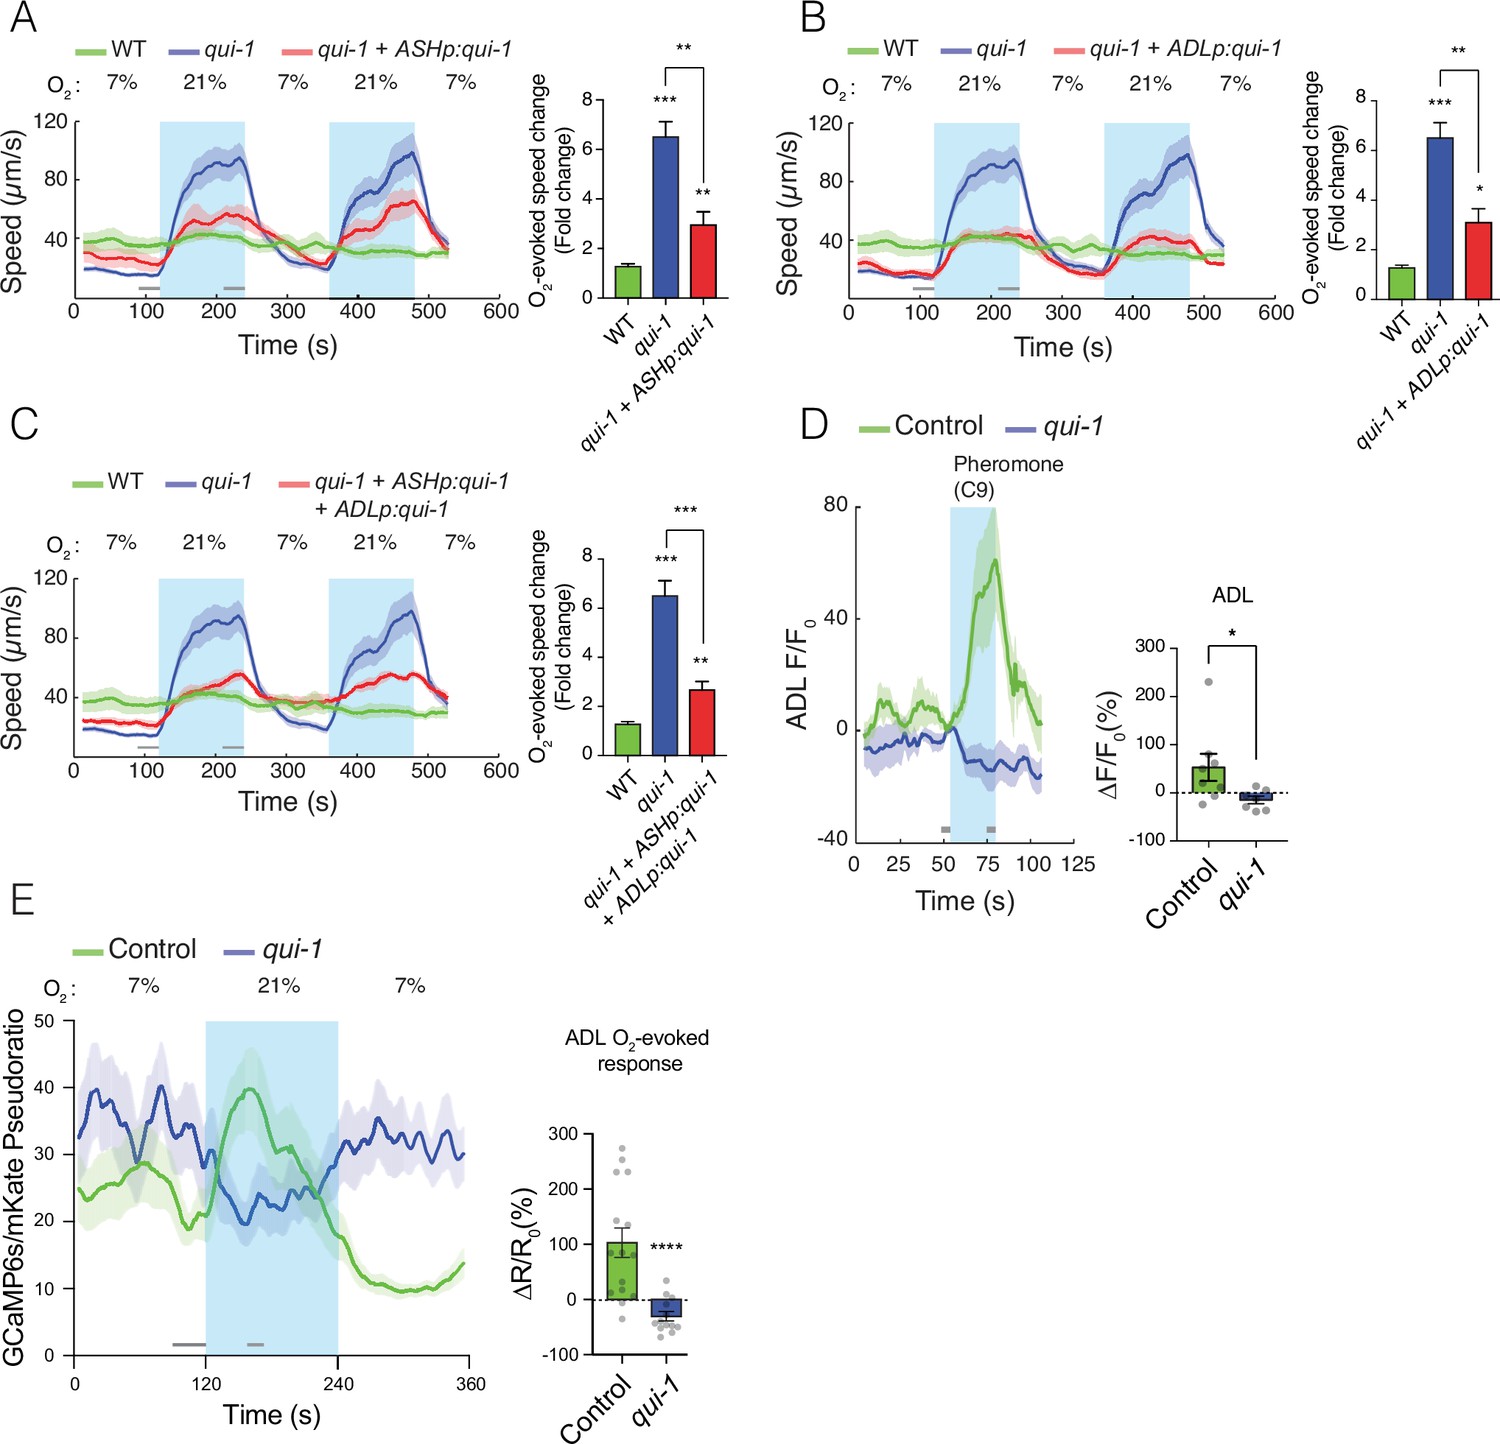
qui-1 acts in ADL and ASH chemosensory neurons to inhibit O2-escape behaviour, and is required for pheromone-evoked Ca2+ responses in ADL.
(A–C) Selective expression of qui-1 in ASH (sra-6p), ADL (Δsre-1p), or ASH+ADL (sra-6p + Δsre-1p) neurons partially rescues the O2-escape phenotype of qui-1 mutants. Left: lines show average speed, while shading represents standard error of the mean (SEM). Grey bars show 30-s time intervals used to calculate the average speed at 7% and 21% O2. Right: the bar graph shows fold change in average speed at 21% O2 compared to 7% O2. N = 6–9 assays. (D) qui-1 mutants lack pheromone-evoked Ca2+ responses in ADL. Left: average GCaMP3 signal intensity (F) divided by baseline intensity (F0) plotted over time. Shading shows SEM. Light blue rectangle indicates period of C9 pheromone stimulation. Right: bar graph quantifying pheromone-evoked Ca2+ responses. ∆F/F0 (%) was computed from 5-s intervals before the C9 stimulus was removed (F) and 5s before C9 stimulus was presented (F0), indicated by the grey bars. N = 8 (Control) and N = 7 (qui-1); both strains carry a dbEx941[∆sre-1p::GCaMP3v500; unc-122p:rfp] transgene (E) qui-1 mutants appear to lose O2-evoked Ca2+ responses in ADL. Left: Ca2+ levels reported as a pseudo-ratio between the GCaMP6s and mKate2 fluorescence signals. Both proteins are expressed under the ADL-specific promoter srh-220p. Grey horizontal bars show intervals (30 and 15 s) used for calculating ΔR/R0 (%) in the bar graph (right), which quantifies O2-evoked Ca2+ responses in ADL. N = 15 (Control), N = 13 (qui-1); both strains carry a dbEx1149[srh-220p:GCaMP6s(Ce):mKate2; lin-44p:gfp] transgene. Shading shows SEM. Statistics: *p value ≤0.05, **p value ≤0.01, ***p value ≤0.001, ****p value ≤0.0001, Mann–Whitney U-test. Comparisons are with wild-type (WT) or Control, which is N2 bearing the indicated transgene.
Figure 2—figure supplement 1
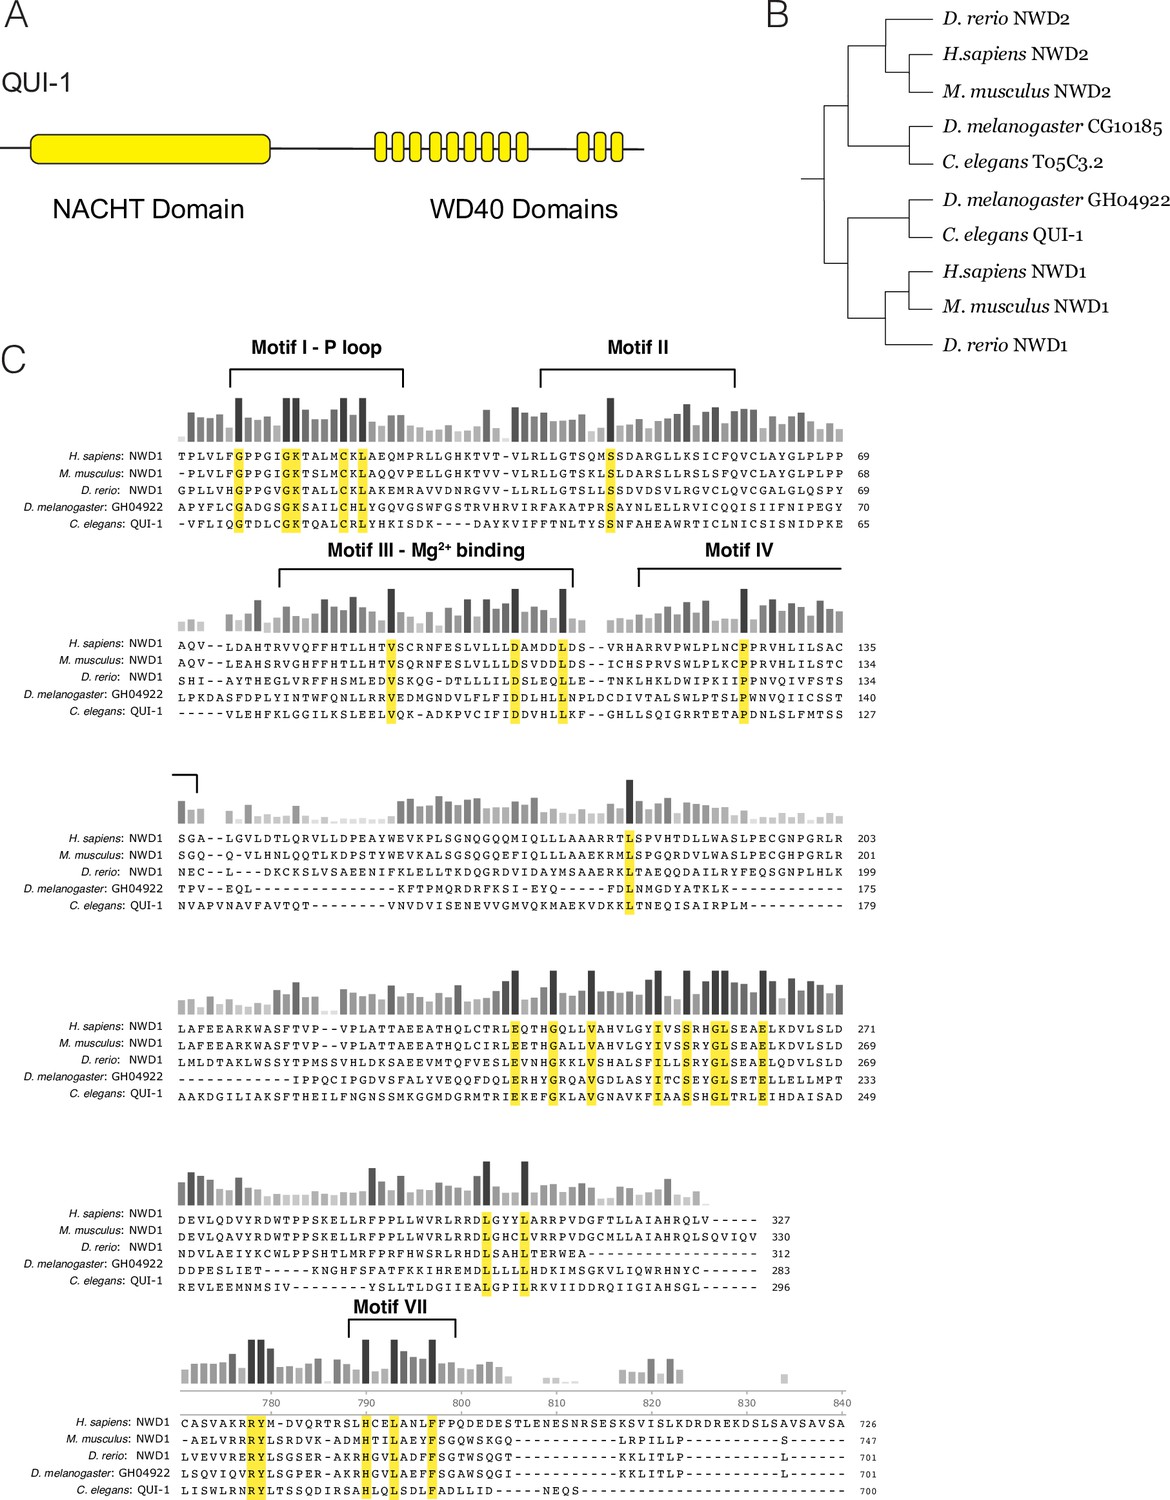
Conservation of NACHT/WD40 containing proteins.
(A) Schematic of QUI-1 protein domains. (B) Phylogenetic analysis using cladogram of NWD1 and NWD2. (C) Sequence conservation of the QUI-1/NWD1 NACHT domain across phylogeny. Bars indicate level of conservation across species. Residues conserved in all five species are highlighted in yellow.
Figure 3 with 1 supplement

Loss of qui-1 confers O2-evoked neurosecretion on ADL sensory neurons.
(A) Disrupting qui-1 increases neurosecretion from ADL. This phenotype is rescued by expressing qui-1 cDNA specifically in ADL (Δsre-1p). N = 22 (Control), N = 16 (qui-1), N = 15 (ADLp rescue). (B) Loss of qui-1 does not lead to increased axonal accumulation of dense-core vesicles (DCVs). Bar graph shows axonal levels of IDA-1::GFP, a DCV marker we expressed exclusively in ADL using srh-220p. N = 42 (Control), N = 34 (qui-1) both strains carry dbEx1151[srh-220p:ida-1::gfp; srh-220p:mKate2; lin-44p:gfp]. Increased ADL neurosecretion in qui-1 mutants depends on the molecular O2-sensor GCY-35 (C), which acts partly in URX neurons (D). (C) N = 21 (Control), N = 30 (qui-1), N = 27 (qui-1; gcy-35). (D) N = 60 (qui-1), N = 46 (qui-1; gcy-35), N = 46 (URX gcy-32p rescue), N = 32 (URX flp-8p rescue). (E) O2 levels modulate ADL neurosecretion in qui-1 mutants but not wild-type (WT). Animals were raised at either 7% or 21% O2 from egg to young adult. N = 30 (Control, 7% O2), N = 22 (Control, 21% O2), N = 23 (qui-1, 7% O2), N = 35 (qui-1, 21% O2). (F) RMG signalling contributes to ADL neurosecretion in qui-1 mutants. Rescue was achieved using two promoters that overlap only in RMG. The flp-21 promoter drives a floxed transcriptional STOP signal followed by the npr-1(215V) isoform, flp-21p:flox:STOP:flox:npr-1(215V); the ncs-1 promoter drives the Cre recombinase (ncs-1p:Cre). N = 27 (qui-1), N = 22 (qui-1;npr-1), N = 33 (RMGp rescue). In A and C–F, bar graphs report the accumulation of DAF-28::mCherry fluorescence in coelomocytes following its release from ADL; all strains carry ftIs25[srh-220p:daf-28::mCherry; myo-2p:gfp; unc-122p:gfp]. Statistics: **p value ≤0.01; ***p value ≤0.001; ****p value ≤0.0001; ns, not significant. Mann–Whitney U-test. Comparisons are against Control in A–C, against qui-1;gcy-35 in D, and against qui-1 in F. Control refers to N2 carrying the indicated transgene.
Figure 3—figure supplement 1
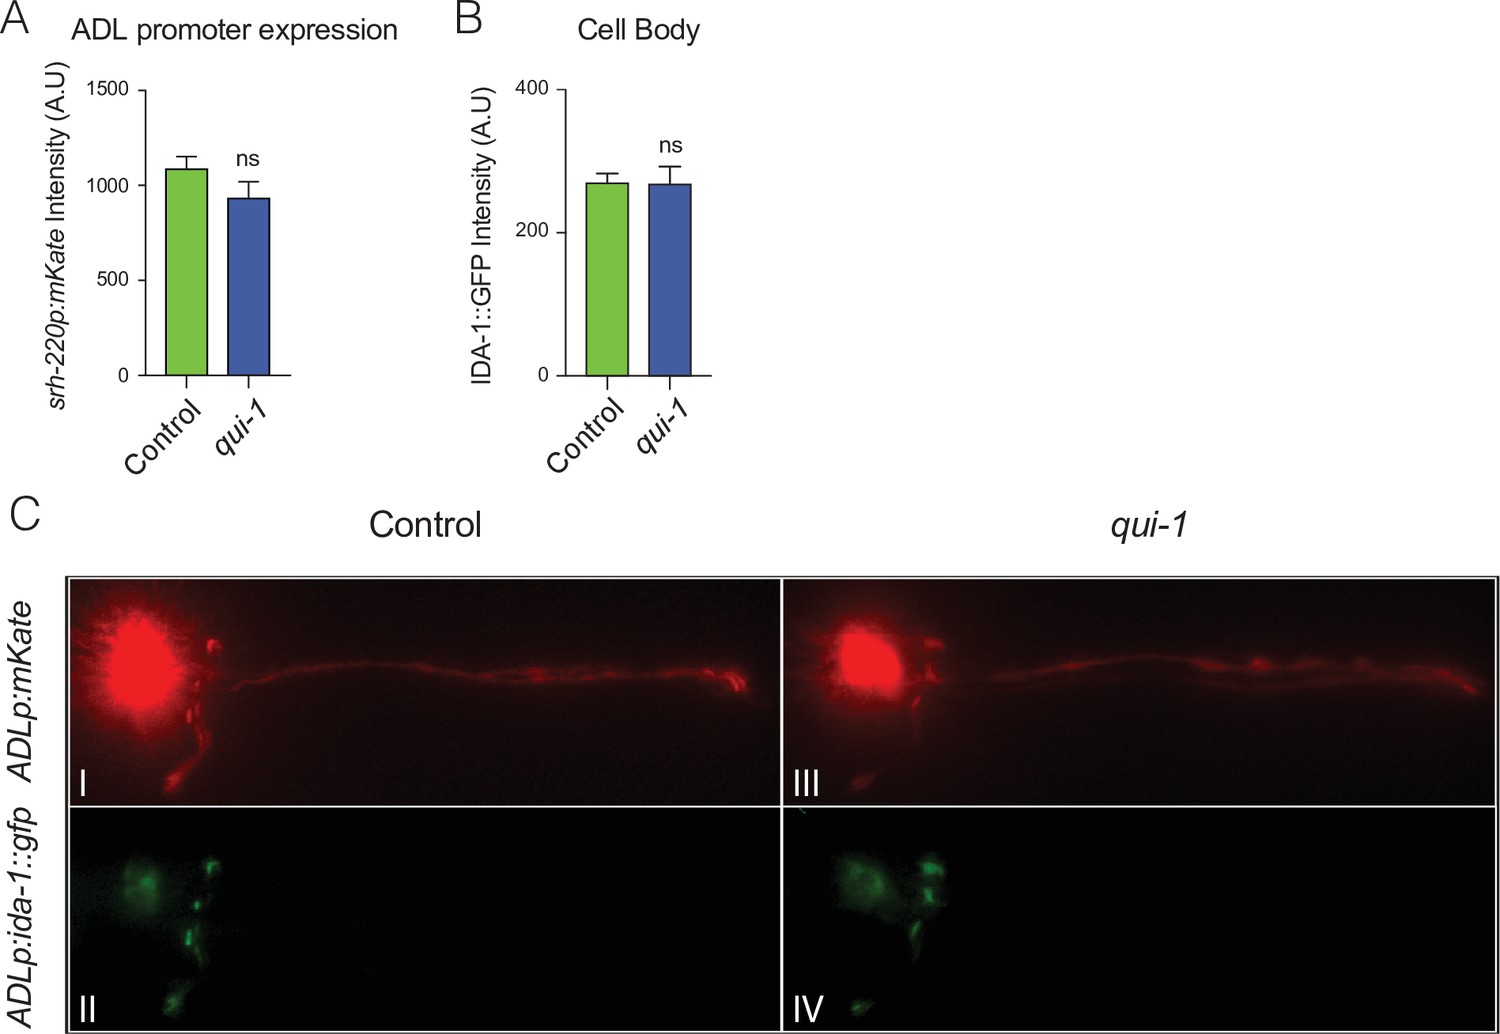
Enhanced secretion of DAF-28::mCherry from ADL reflects increased dense-core vesicle (DCV) release.
(A) mKate2 expression from the ADL-specific promoter srh-220p is not altered in qui-1 mutants. The bar graph shows mKate2 intensity at the ADL cell body. N = 27 (Control), N = 21 (qui-1). (B) Disrupting qui-1 does not alter levels of the DCV marker IDA-1::GFP in the ADL cell body. IDA-1::GFP was expressed in ADL (srh-220p) and its intensity at the cell body recorded. N = 41 (Control), N = 33 (qui-1). (C) IDA-1::GFP localization in ADL in wild-type control and qui-1 mutant suggests qui-1 does not alter DCV distribution. Images shown are representative of the images used for measurements reported in Figure 3B and (B). In A–C, all strains carry dbEx1151[srh-220p:ida-1::gfp; srh-220p:mKate2; lin-44p:gfp]. Statistics: ns, not significant, Mann–Whitney U-test. Comparisons are with Control, which is N2 carrying the indicated transgenes.
Figure 4 with 2 supplements
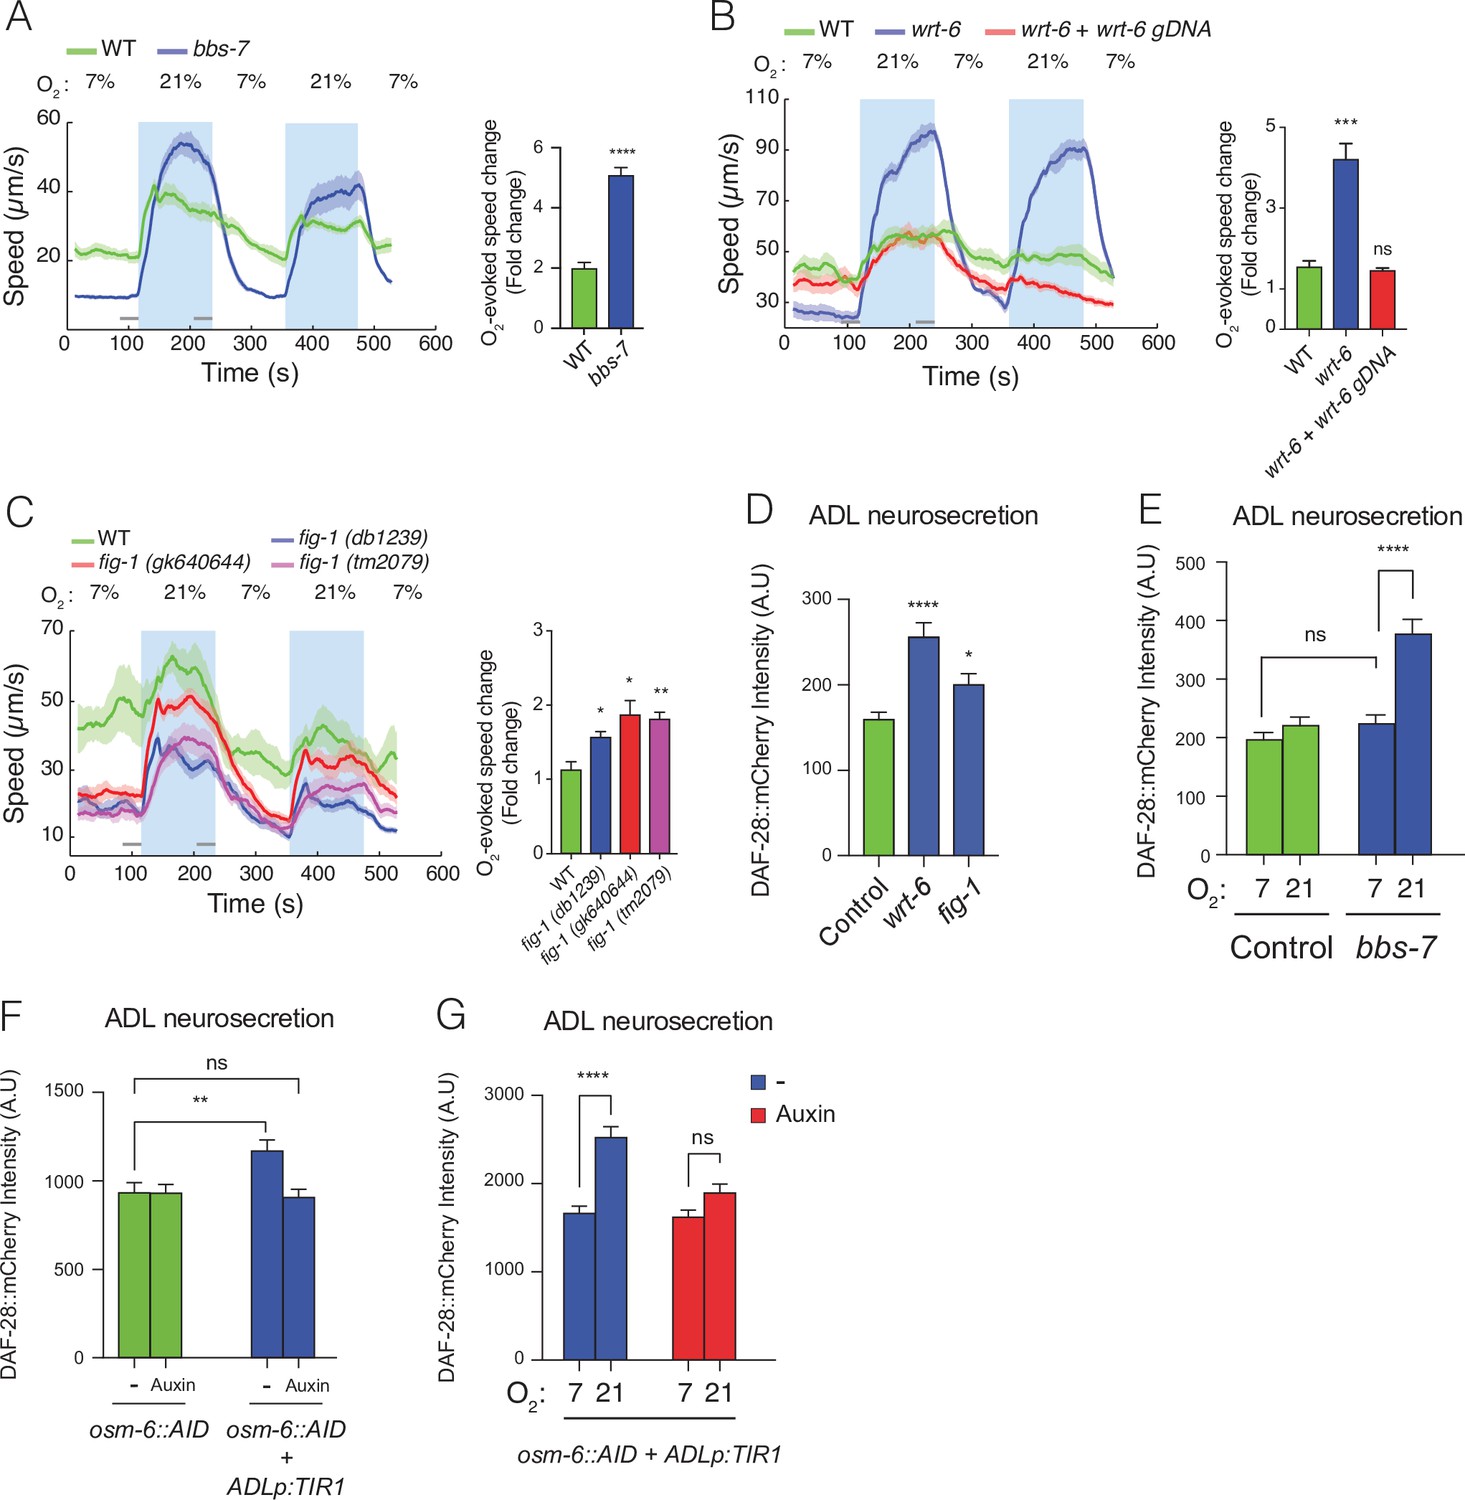
Disrupting sensory perception in ADL confers O2-evoked neurosecretion.
(A) bbs-7 mutants, which lack a subunit of the BBSome complex and have impaired cilia formation and function, show increased behavioural responses to O2 (see also Figure 4—figure supplement 1). (B) wrt-6 mutants, which are defective in a hedgehog-related gene expressed in the glia surrounding the sensory endings of chemosensory neurons, show increased O2-evoked behaviours. The phenotype is rescued by a wild-type copy of wrt-6. (C) Null mutants of , fig-1 another gene expressed in glia whose loss causes chemosensory defects, show increased O2 responses similar to fig-1 (db1239) allele isolated in our screen (see Figure 4—figure supplement 1). (A–C) Left: lines show average speed, shading represents standard error of the mean (SEM), and grey bars represent 30-s intervals used to calculate the average speed at 7% and 21% O2. Right: bar graphs show fold change in average speed at 21% O2 compared to 7% O2. N = 6–9 assays. (D) wrt-6 and fig-1 mutants show increased neurosecretion from ADL. N = 22 (Control), N = 21 (wrt-6), N = 18 (fig-1). (E) Increased ADL neurosecretion in bbs-7 mutants reflects increased responsiveness to O2 stimuli. Animals experienced 7% or 21% O2 from egg to young adult, as indicated. N = 30 (Control, 7% O2), N = 22 (Control, 21%O2), N = 25 (bbs-7, 7% O2), N = 25 (bbs-7, 21% O2). (F) Knocking down OSM-6, a protein essential for intraflagellar transport and cilia function, exclusively in ADL alters neurosecretion from this neuron. Animals were grown from egg to young adult on control plates (−) or plates containing 1 mM Auxin (Auxin). N = 35 (osm-6::AID, −), N = 40 (osm-6::AID, Auxin), N = 36 (osm-6::AID + ADLp:TIR1, −), N = 30 (osm-6::AID + ADLp:TIR1, Auxin). (G) ADL-specific knockdown of OSM-6::AID confers O2-evoked neurosecretion. Animals were grown from egg to young adult on control plates (−) or plates containing 1 mM Auxin (Auxin) at either 7% or 21% O2 as indicated. N = 41 (7%, –), N = 38 (21%, –), N = 37 (7%, Auxin), N = 36 (21%, Auxin). (D–G) Bar graphs show DAF-28::mCherry fluorescence accumulated in coelomocytes following release from ADL, and all strains carry ftIs25[srh-220p:daf-28::mCherry; myo-2p:gfp; unc-122p:gfp]. Statistics: *p value ≤0.05; **p value ≤0.01; ***p value ≤0.001, ****p value ≤0.0001; ns, not significant. Mann–Whitney U-test. Unless indicated, comparisons are against wild-type (WT) or Control, which is N2 carrying the indicated transgene.
Figure 4—figure supplement 1
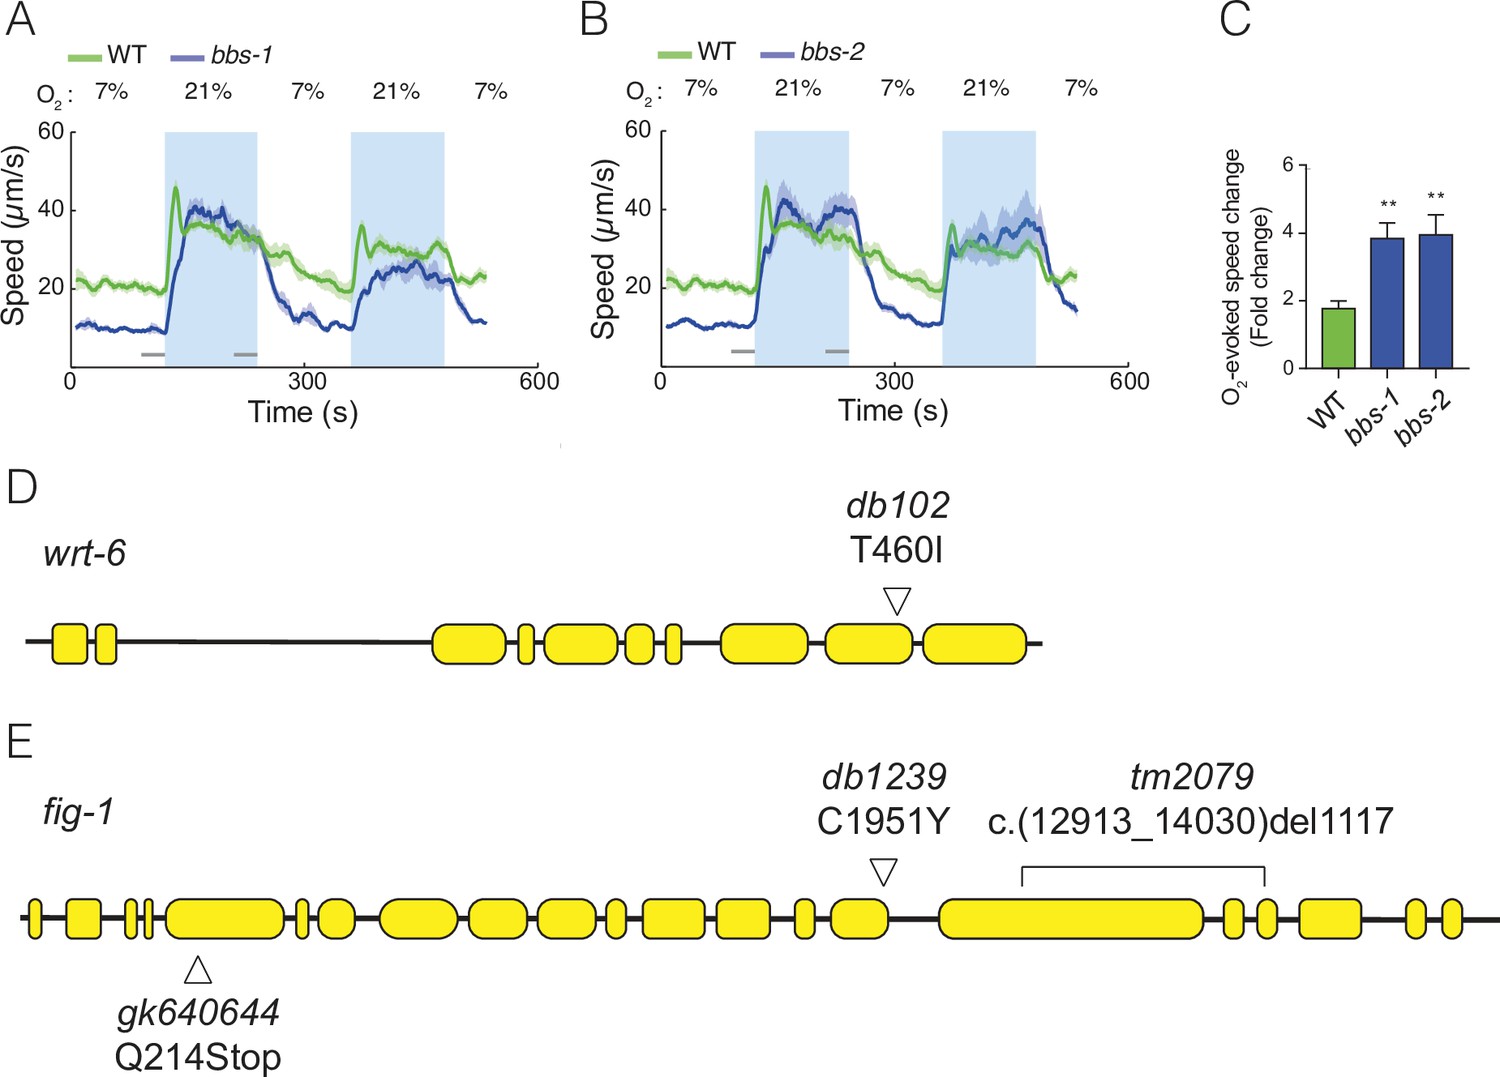
Mutants defective in subunits of the BBSome complex show enhanced O2 responses.
(A–C) Mutations in two additional components of the BBSome complex, bbs-1 (A), bbs-2 (B), show increased behavioural responses to O2. Left: lines show average speed, shading represents standard error of the mean (SEM) and grey bars represent 30-s intervals used to calculate the average speed at 7% and 21% O2. Right: bar graph shows fold change in average speed at 21% O2 compared to 7% O2. N = 5–9 assays. (D) Schematic of the wrt-6 locus showing the db102 mutation isolated in our screen. The T460I substitution changes a conserved residue essential for autocleavage and activation of Hedgehog-like proteins. (E) Schematic of fig-1 gene showing mutations used in Figure 4C. fig-1 (db102) was isolated in our screen; tm2079 and gk640644 are previously isolated null alleles. Statistics: **p value ≤0.01. Mann–Whitney U-test. Comparisons are with wild type (WT).
Figure 4—figure supplement 2
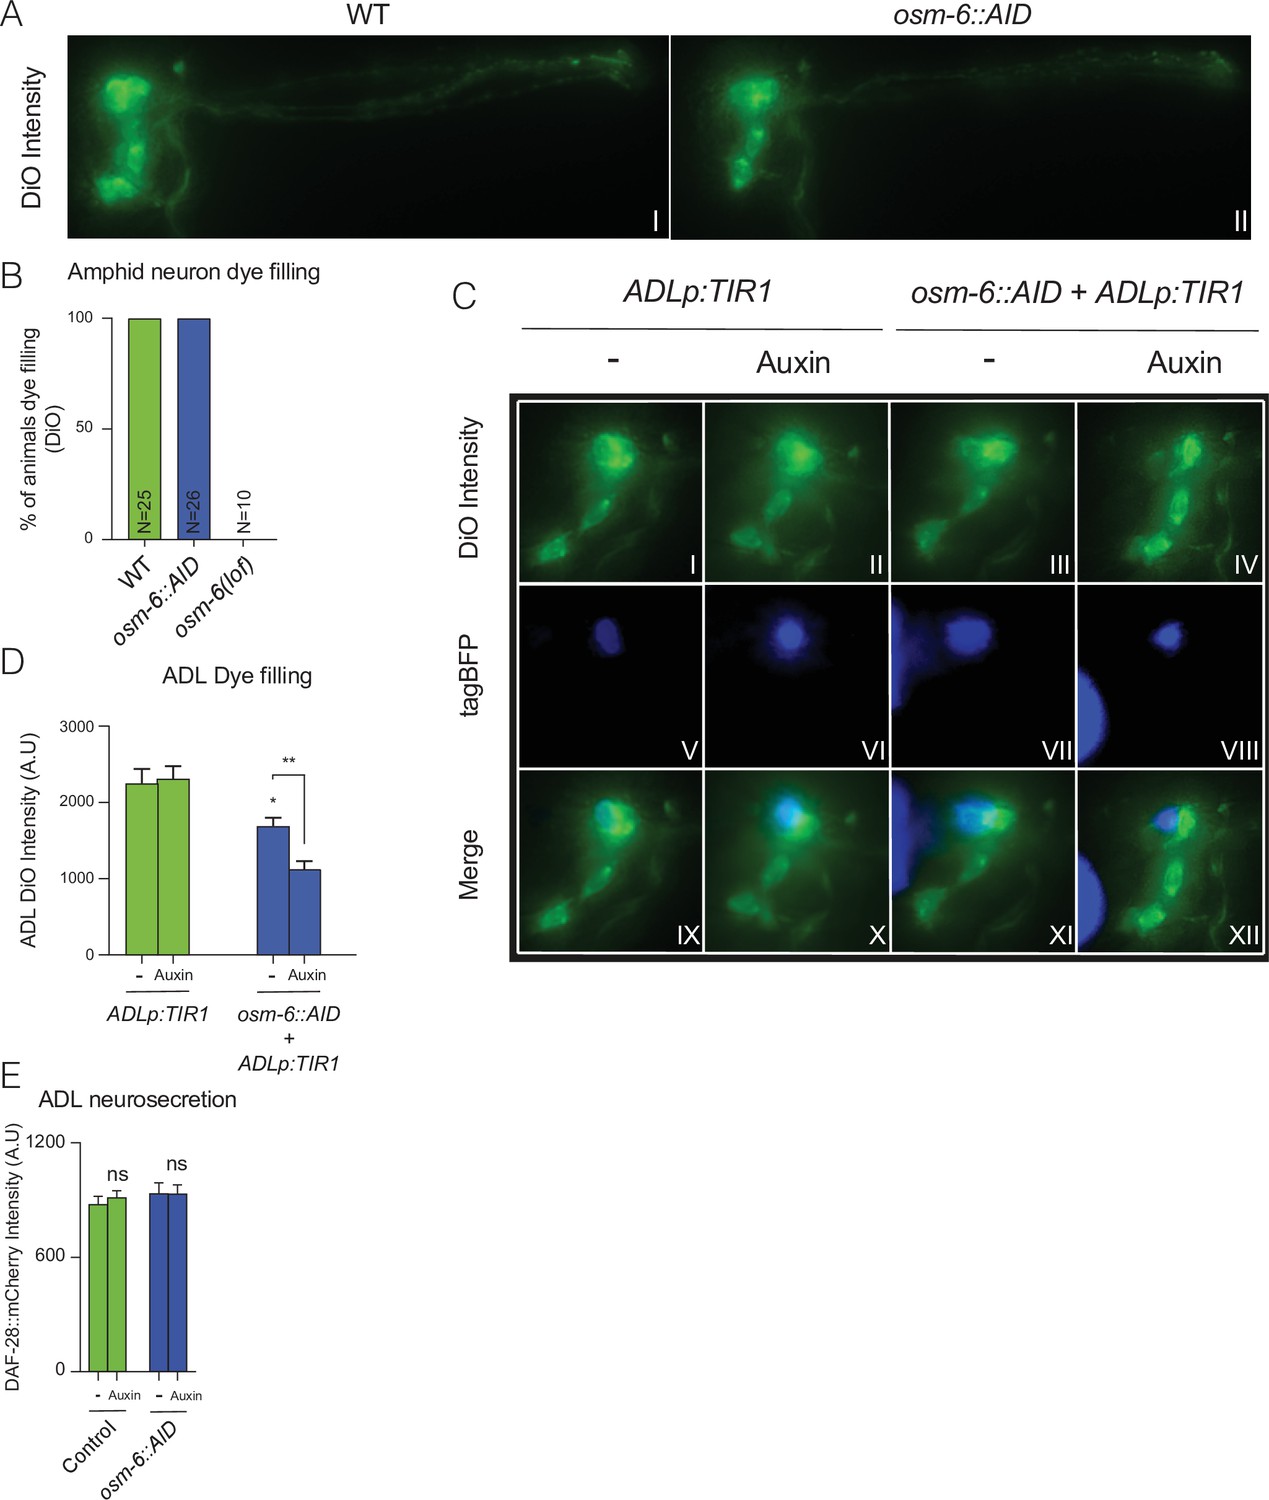
Impairment of OSM-6::AID in ADL disrupts its cilia formation and results in a cell-specific dye filling defect.
(A, B) Endogenous tagging of osm-6 with an Auxin inducible degron (AID) does not compromise dye filling of amphid neurons. (A) Images are representative of images used for measurements reported in B. (B) Bar graph displays percentage of animal with defects in dye filling. Graph shows N number according to genotype. (C, D) TIR1-mediated knockdown of OSM-6::AID in ADL results in reduced uptake of the DiO dye, a phenotype which becomes stronger in the presence of Auxin. A transgene was used to drive both TIR1 and tagBFP expression in ADL (srh-220p:TIR1:sl2tagBFP). The transgene was expressed in either a wild-type (ADLp:TIR1) or an osm-6::AID (osm-6::AID + ADLp:TIR1) background. (C) Panels show representative images of data quantified in D. (D) Bar graph shows quantification of DiO intensity in ADL neurons. Unless otherwise indicated, statistical comparisons are against ADLp:TIR1, −. (E) 1 mM Auxin does not alter ADL neurosecretion. N = 36 (Control, −), N = 33 (Control, Auxin), N = 35 (osm-6::AID, −), N = 40 (osm-6::AID, Auxin). Bar graphs show DAF-28::mCherry fluorescence taken up by coelomocytes following release from ADL and all strains carry ftIs25[srh-220p:daf-28::mCherry; myo-2p:gfp; unc-122p:gfp]. Statistical comparisons are against Control (−) samples. (C–E) Animals were grown from egg to young adult on control plates (−) or plates containing 1 mM Auxin (Auxin). Statistics: *p value ≤0.05; **p value ≤0.01; ns, not significant. Mann–Whitney U-test.
Figure 5 with 2 supplements
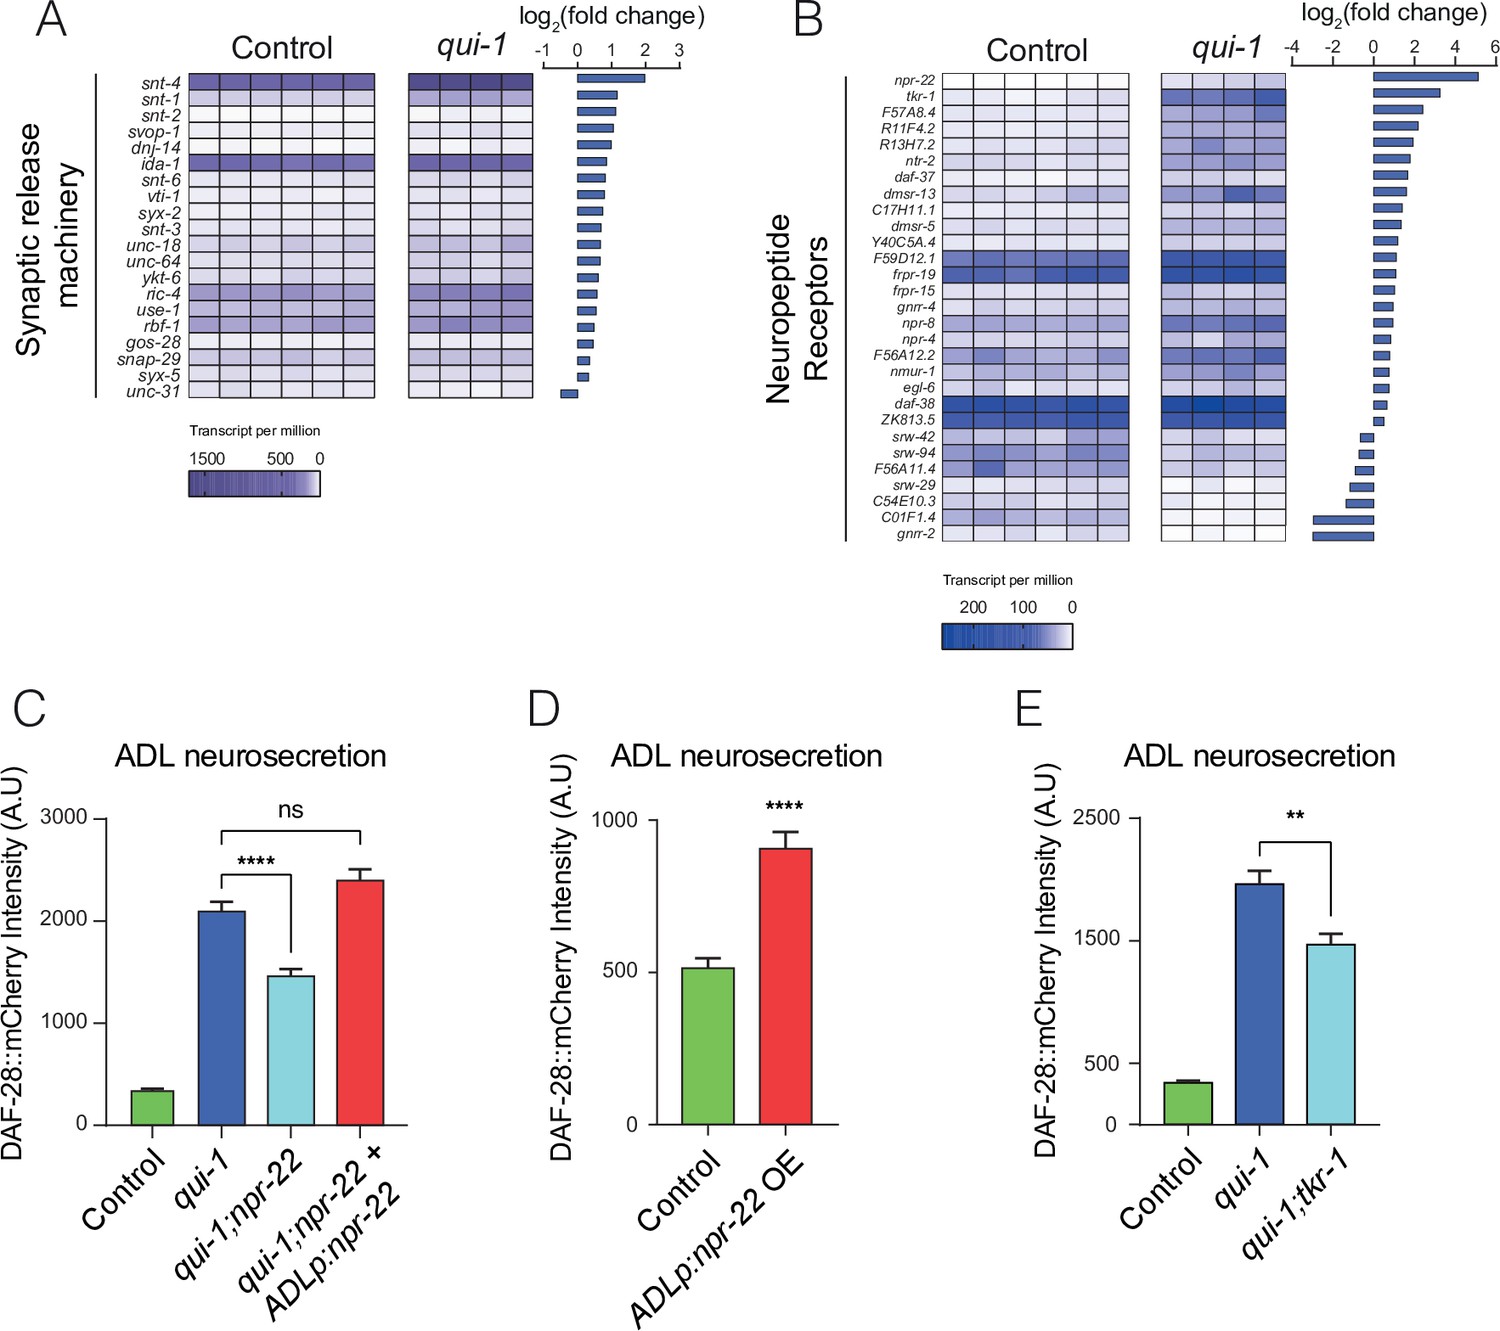
Increased O2-evoked neurosecretion from ADL in qui-1 mutants is associated with reconfigured peptidergic communication.
(A) qui-1 mutants upregulate a suite of genes that control synaptic and/or dense-core vesicle (DCV) release. (B) Loss of qui-1 reprograms neuropeptide receptor expression in ADL. (A, B) Heat maps show expression values (transcript per million, tpm) for each gene across biological replicates, which are indicated by columns. To target analysis, we used lists generated in a review of the neural genome (Hobert, 2013), and selected the annotation ‘Synaptic release machinery’ (A) or ‘Neuropeptide receptor’ (B). All genes matching these criteria were included unless their expression was below 10 tpm in both genotypes or the q-value was >0.05 (see Supplementary file 5). Animals from Control and qui-1 samples carry dbIs47[srh-220p:mKate2; lin-44p:gfp]. (C) The neuropeptide receptor NPR-22 promotes neurosecretion from ADL in qui-1 mutants; this phenotype can be rescued by expressing npr-22 cDNA (encoding NPR-22 isoform b) from an ADL-specific promoter (srh-220p). N = 33 (Control), N = 54 (qui-1), N = 53 (qui-1;npr-22), N = 52 (ADLp rescue). (D) Overexpressing the same npr-22 cDNA construct specifically in ADL is sufficient to stimulate neurosecretion in control animals. N = 46 (Control), N = 44 (ADLp OE). (E) The tachykinin receptor tkr-1 also stimulates ADL neurosecretion in qui-1 mutants. N = 38 (Control), N = 37 (qui-1), N = 38 (qui-1;tkr-1). (C–E) Bar graphs show the intensity of DAF-28::mCherry accumulated in coelomocytes following release from ADL, and all strains carry ftIs25[srh-220p:daf-28::mCherry; myo-2p:gfp; unc-122p:gfp]. Statistics: **p value ≤0.01; ****p value ≤0.0001; ns, not significant. Mann–Whitney U-test. In C and E, comparisons are against qui-1, while in D comparisons are against Control, which is N2 carrying the indicated transgene.
Figure 5—figure supplement 1
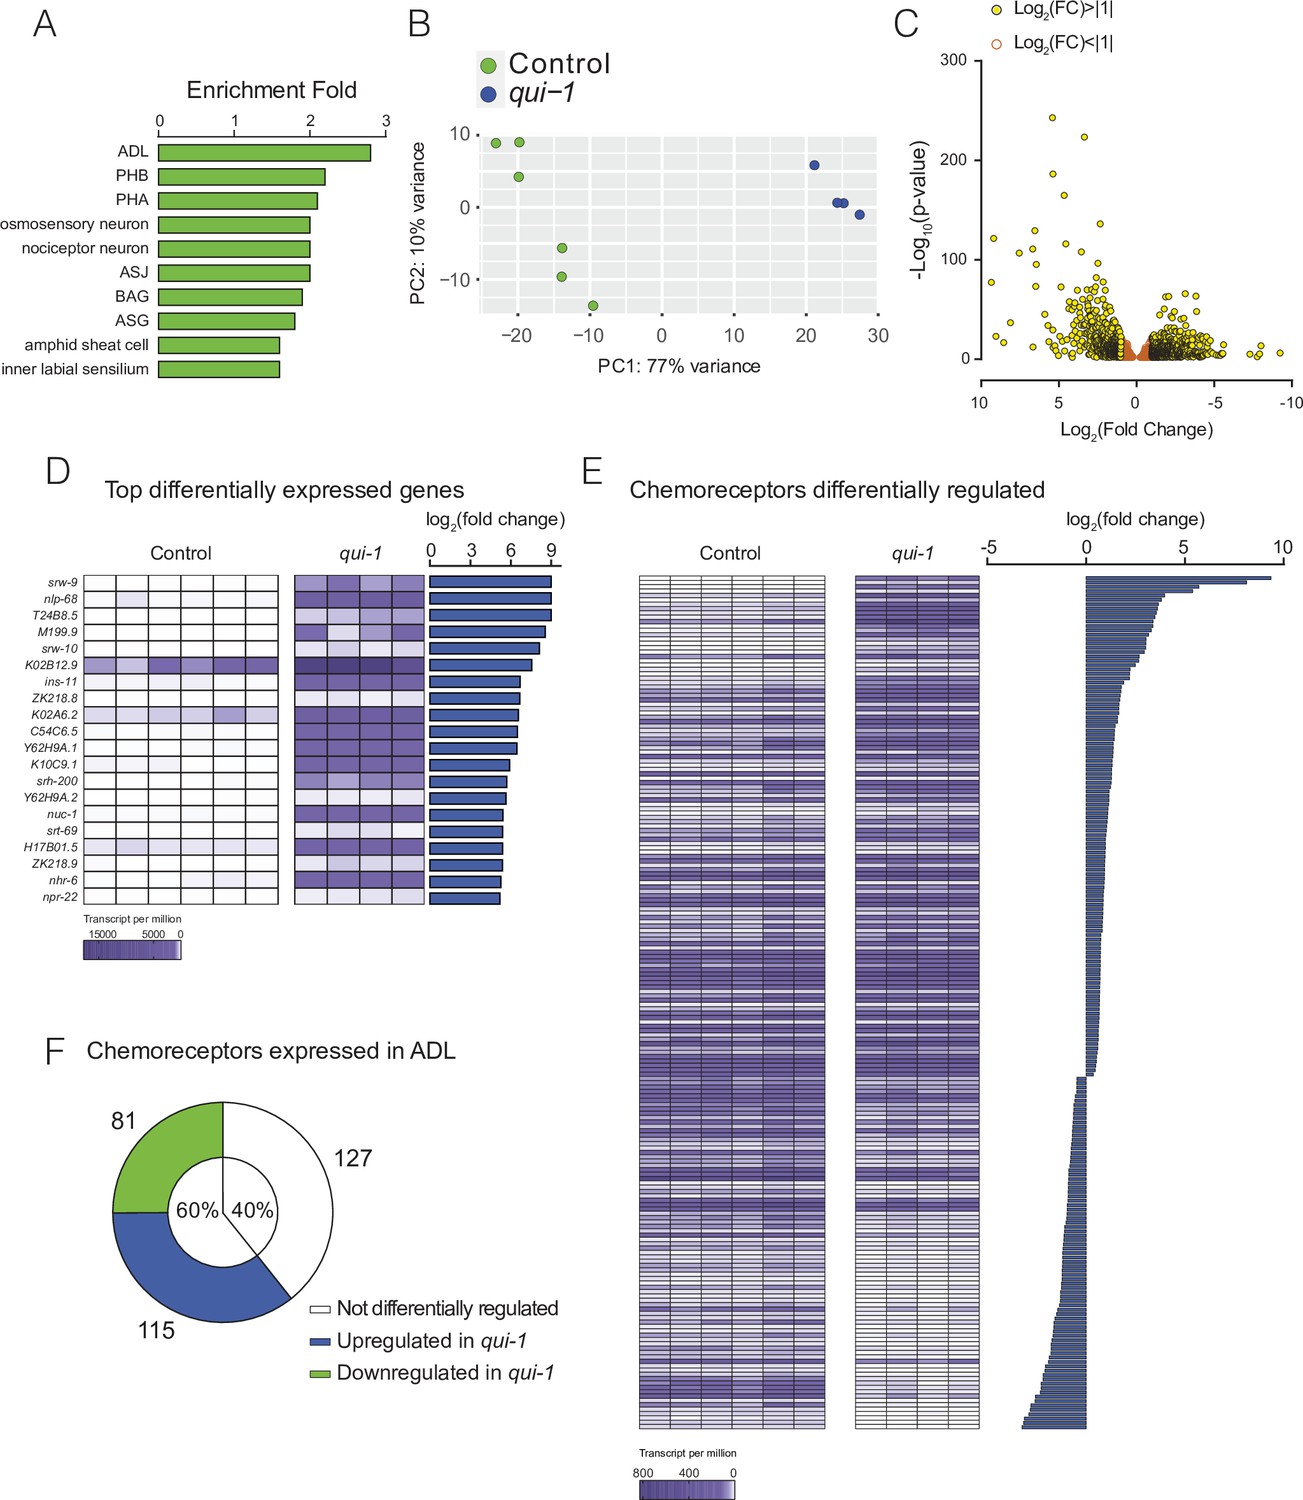
Profiling of ADL sensory neurons.
(A) Enrichment analysis confirms our dataset most closely matches the ADL profile. A list of genes expressed in ADL according to our RNAseq data (see Supplementary file 1) was analysed using the Enrichment Analysis tool (Angeles-Albores et al., 2016). (B) Principal component analysis showing that RNAseq data from wild-type control and qui-1 biological replicates cluster by genotype. Each dot represents a single biological replicate, N = 6 (Control), N = 4 (qui-1). (C) Differentially expressed genes are mostly upregulated in qui-1. Volcano plot showing distribution of genes expressed in Control and qui-1 according to their log2 fold change (x-axis), and statistical significance (y-axis, −log10(p-value)). Empty dots show genes not strongly regulated in qui-1 samples (log2 fold change between +1 and −1); yellow dots show genes strongly regulated in qui-1 samples (log2 fold change >+1 or <−1). (D) Heat map displays the 20 most upregulated genes in qui-1 mutants. (E) The absence of qui-1 reprograms the chemoreceptor repertoire of ADL neurons. (D, E) Heat maps show expression levels (tpm) for each gene across biological replicates, indicated by columns. To target analysis for (E), we used lists generated in a review of the neural genome (Robertson and Thomas, 2006), and selected genes annotated as ‘Chemoreceptors’. All genes matching these criteria were included unless their expression was below 10 tpm in both genotypes or the q-value was >0.05 (see Supplementary file 5). (F) Pie chart showing absolute numbers and percentage of chemoreceptors expressed in ADL in both control and qui-1 samples. In B, D, and F, animals from Control and qui-1 samples carry dbIs47[srh-220p:mKate2; lin-44p:gfp]. Control refers to N2 animals carrying the indicated transgene.
Figure 5—figure supplement 2
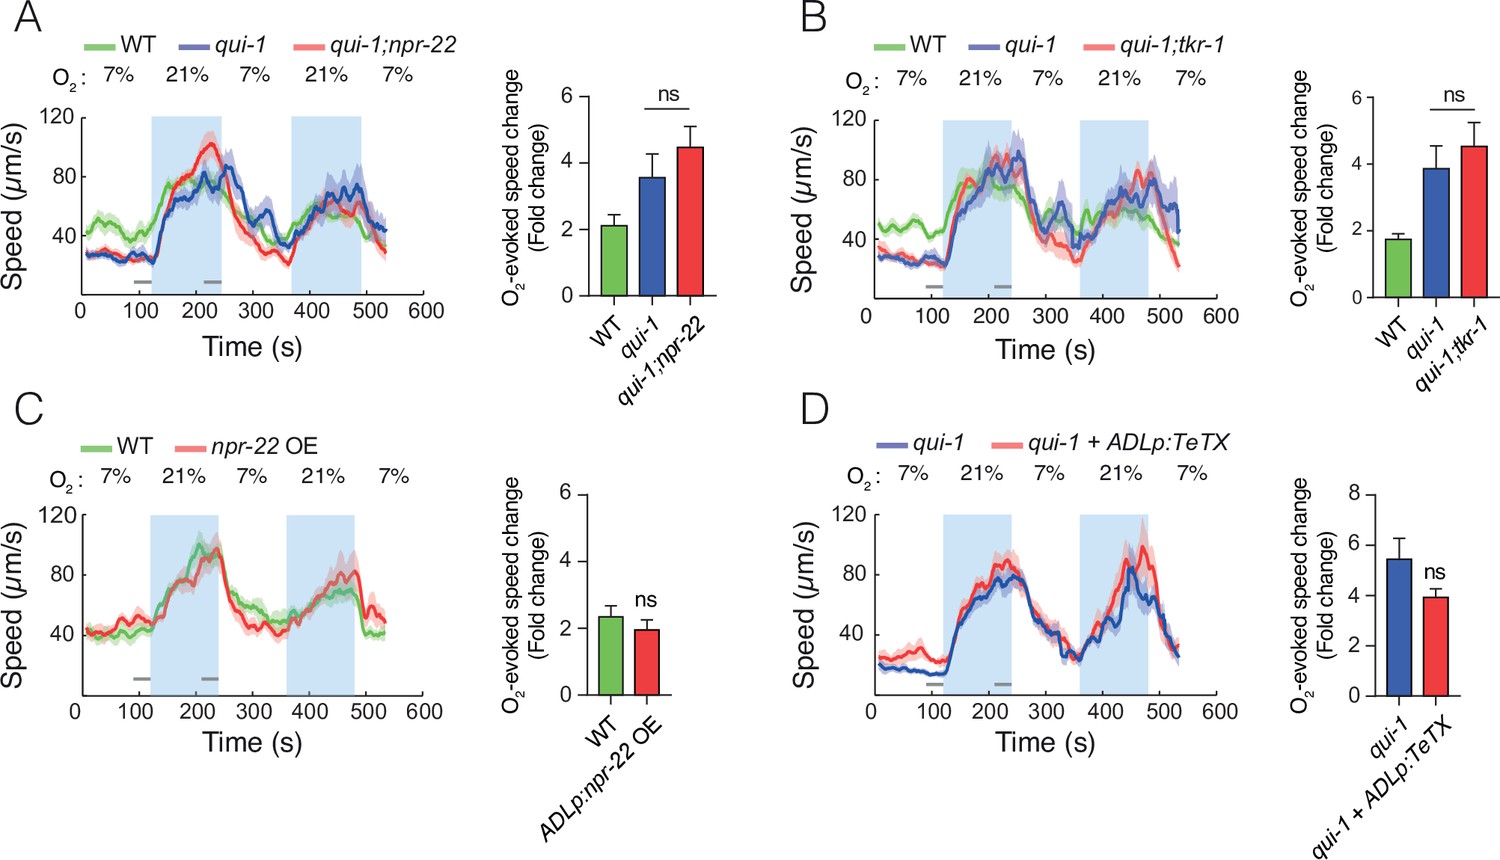
Disrupting npr-22, tkr-1, or synaptic communication is not sufficient to reduce the O2-escape behaviour of qui-1 mutants.
(A) Removing npr-22 is not sufficient to suppress O2-escape behaviour in qui-1 mutants. (B) Disrupting either npr-22 or tkr-1 is not sufficient to diminish O2-escape responses in qui-1 mutants. (C) Overexpressing NPR-22 specifically in ADL does not confer increased O2-escape responses on wild-type animals. The npr-22 cDNA (encoding NPR-22 isoform b) was expressed using an ADL-specific promoter (srh-220p). (D) Blocking synaptic release in ADL does not suppress the O2-escape behaviour of qui-1 mutants. Tetanus toxin (TeTX) and mKate were coexpressed in ADL as an operon controlled by the srh-220p promoter (srh-220p:TeTX:mKate). (A–D) Left: lines show average speed, shading represents standard error of the mean (SEM) and grey bars represent 30-s intervals used to calculate the average speed at 7% and 21% O2. Right: bar graphs show fold change in average speed at 21% O2 compared to 7% O2. N = 7–10 assays. Statistics: ns, not significant, Mann–Whitney U-test. Comparisons are against qui-1, except in (C) where they are against wild-type (WT).
Figure 6
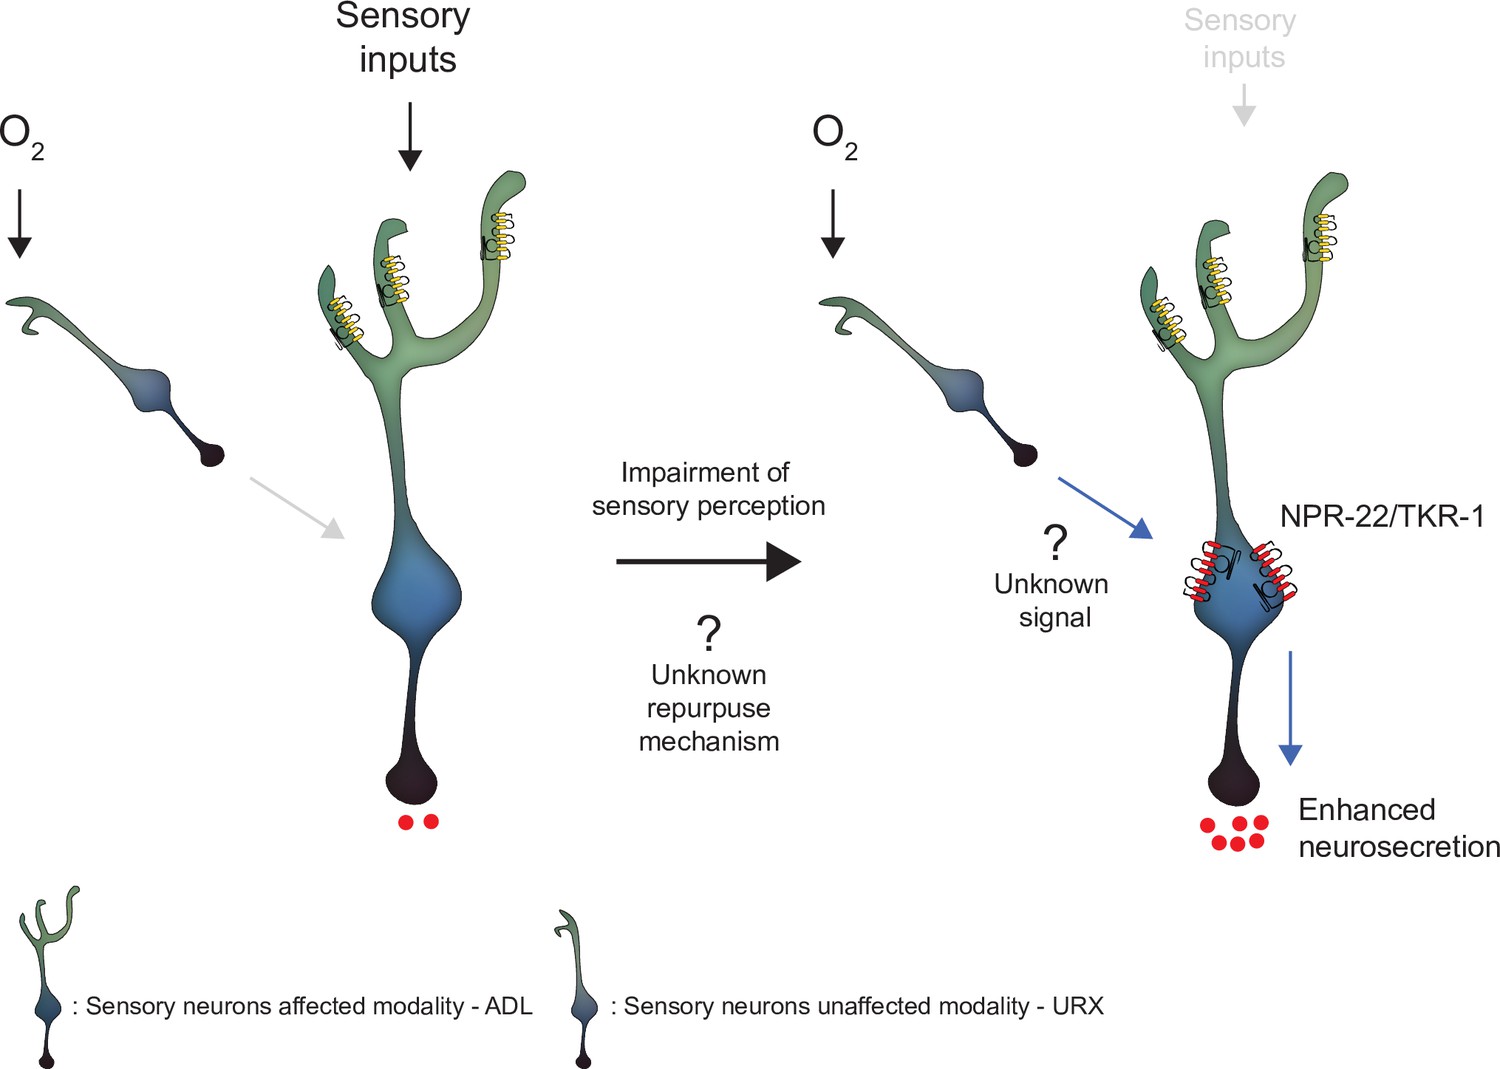
Model depicting the effect of disrupting sensory perception on ADL sensory neurons.
Schematic depiction of model explaining ADL O2-evoked neurosecretion in sensory defective mutants. When ADL sensory perception is functioning (left side), O2 does not modulate ADL neurosecretion in wild-type, despite ADL receiving signals from O2 sensors, including URX. When sensory perception is impaired (right side). ADL undertakes a transcriptional reconfiguration that results in stronger coupling of ADL neurosecretion to input from URX and other O2 sensors. Much of the increase in O2-evoked neurosecretion is conferred by increased expression of two receptors, NPR-22 and TKR-1, in ADL itself.
Additional files
-
Supplementary file 1
Genes expressed in ADL neurons.
- https://cdn.elifesciences.org/articles/68040/elife-68040-supp1-v1.xlsx
-
Supplementary file 2
Chemoreceptors expressed in ADL neurons.
- https://cdn.elifesciences.org/articles/68040/elife-68040-supp2-v1.xlsx
-
Supplementary file 3
Neuropeptide receptors expressed in ADL neurons.
- https://cdn.elifesciences.org/articles/68040/elife-68040-supp3-v1.xlsx
-
Supplementary file 4
Neuropeptides expressed in ADL neurons.
- https://cdn.elifesciences.org/articles/68040/elife-68040-supp4-v1.xlsx
-
Supplementary file 5
Genes differentially regulated in ADL neurons (Control vs qui-1).
- https://cdn.elifesciences.org/articles/68040/elife-68040-supp5-v1.xlsx
-
Supplementary file 6
Strain list.
- https://cdn.elifesciences.org/articles/68040/elife-68040-supp6-v1.xlsx
-
Transparent reporting form
- https://cdn.elifesciences.org/articles/68040/elife-68040-transrepform1-v1.docx
Download links
A two-part list of links to download the article, or parts of the article, in various formats.
Downloads (link to download the article as PDF)
Open citations (links to open the citations from this article in various online reference manager services)
Cite this article (links to download the citations from this article in formats compatible with various reference manager tools)
Impairing one sensory modality enhances another by reconfiguring peptidergic signalling in Caenorhabditis elegans
eLife 11:e68040.
https://doi.org/10.7554/eLife.68040


