Closed-loop auditory stimulation method to modulate sleep slow waves and motor learning performance in rats
- Department of Neurology, University Hospital Zurich, University of Zurich, Switzerland
- University Center of Competence Sleep & Health Zurich (CRPP), University of Zurich, Switzerland
- Neuroscience Center Zurich (ZNZ), Switzerland
- Institute of Biological Chemistry, School of Exact and Natural Sciences (IQUIBICEN). CONICET – University of Buenos Aires, Argentina
- Child Development Center, University Children’s Hospital Zurich, University of Zurich, Switzerland
- Department of Child and Adolescent Psychiatry and Psychotherapy, Psychiatric Hospital, University of Zurich, Switzerland
Figures
Figure 1 with 1 supplement
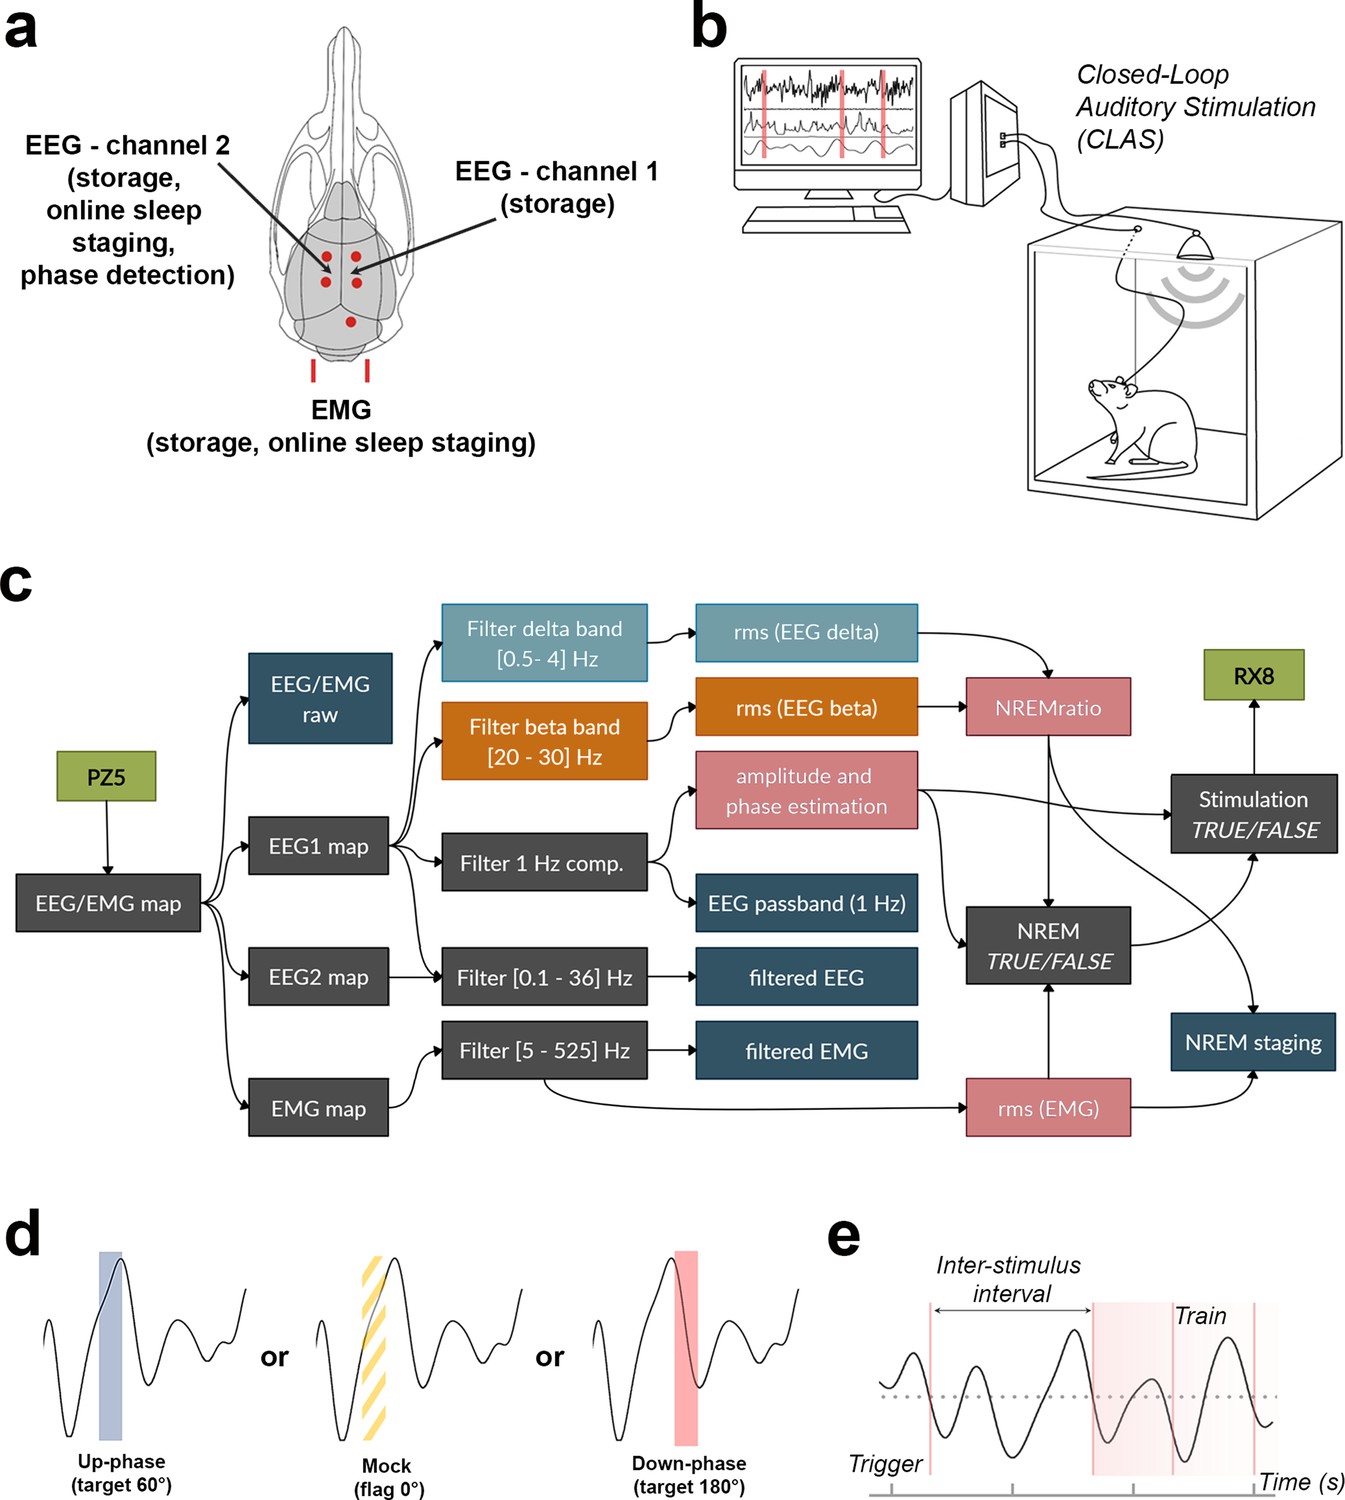
Schematic representation of electroencephalogram/electromyogram (EEG/EMG) headpiece, closed-loop auditory stimulation (CLAS) concept, and computational pipeline.
(a) Dorsal skull schematic of the two subdural (differential) channels for cortical EEG and one nuchal EMG. (b) Closed-loop auditory stimulation setup: the system can accommodate up to ieight subjects in the same machine. (c) Processing tree for online non-rapid eye movement (NREM) staging and phase-targeted auditory stimulation. EEG/EMG is sampled and amplified via PZ5 NeuroDigitizer preamplifier (TDT, USA). Left: EEG (EEG1) is filtered in the delta and beta bands, and between 0.1 and 36 Hz for offline analysis; EMG signal is filtered between 5 and 525 Hz for offline analysis. Power estimations (rms(EEG delta) in orange, rms(EEG beta) in blue, and rms(EMG) in pink) and amplitude of EEG 1 Hz component form the basis for detection of NREM. When NREM is identified, auditory triggers are delivered phase-locked to the EEG 1 Hz component (RX8 MULTI-I/O processor). Intermediary operations are in gray and outputs for offline analysis are in dark blue. (d) Animals were stimulated with either up-phase (60°), mock stimulation (0°, sound muted by disconnection of the speaker), or down-phase (180°) CLAS. (e) Distribution of sound triggers was analyzed in terms of trains of triggers (count of any size sequences of triggers 1 s or less apart) and interstimulus interval (ISI, time between triggers). rms: root mean square.
Figure 1—figure supplement 1
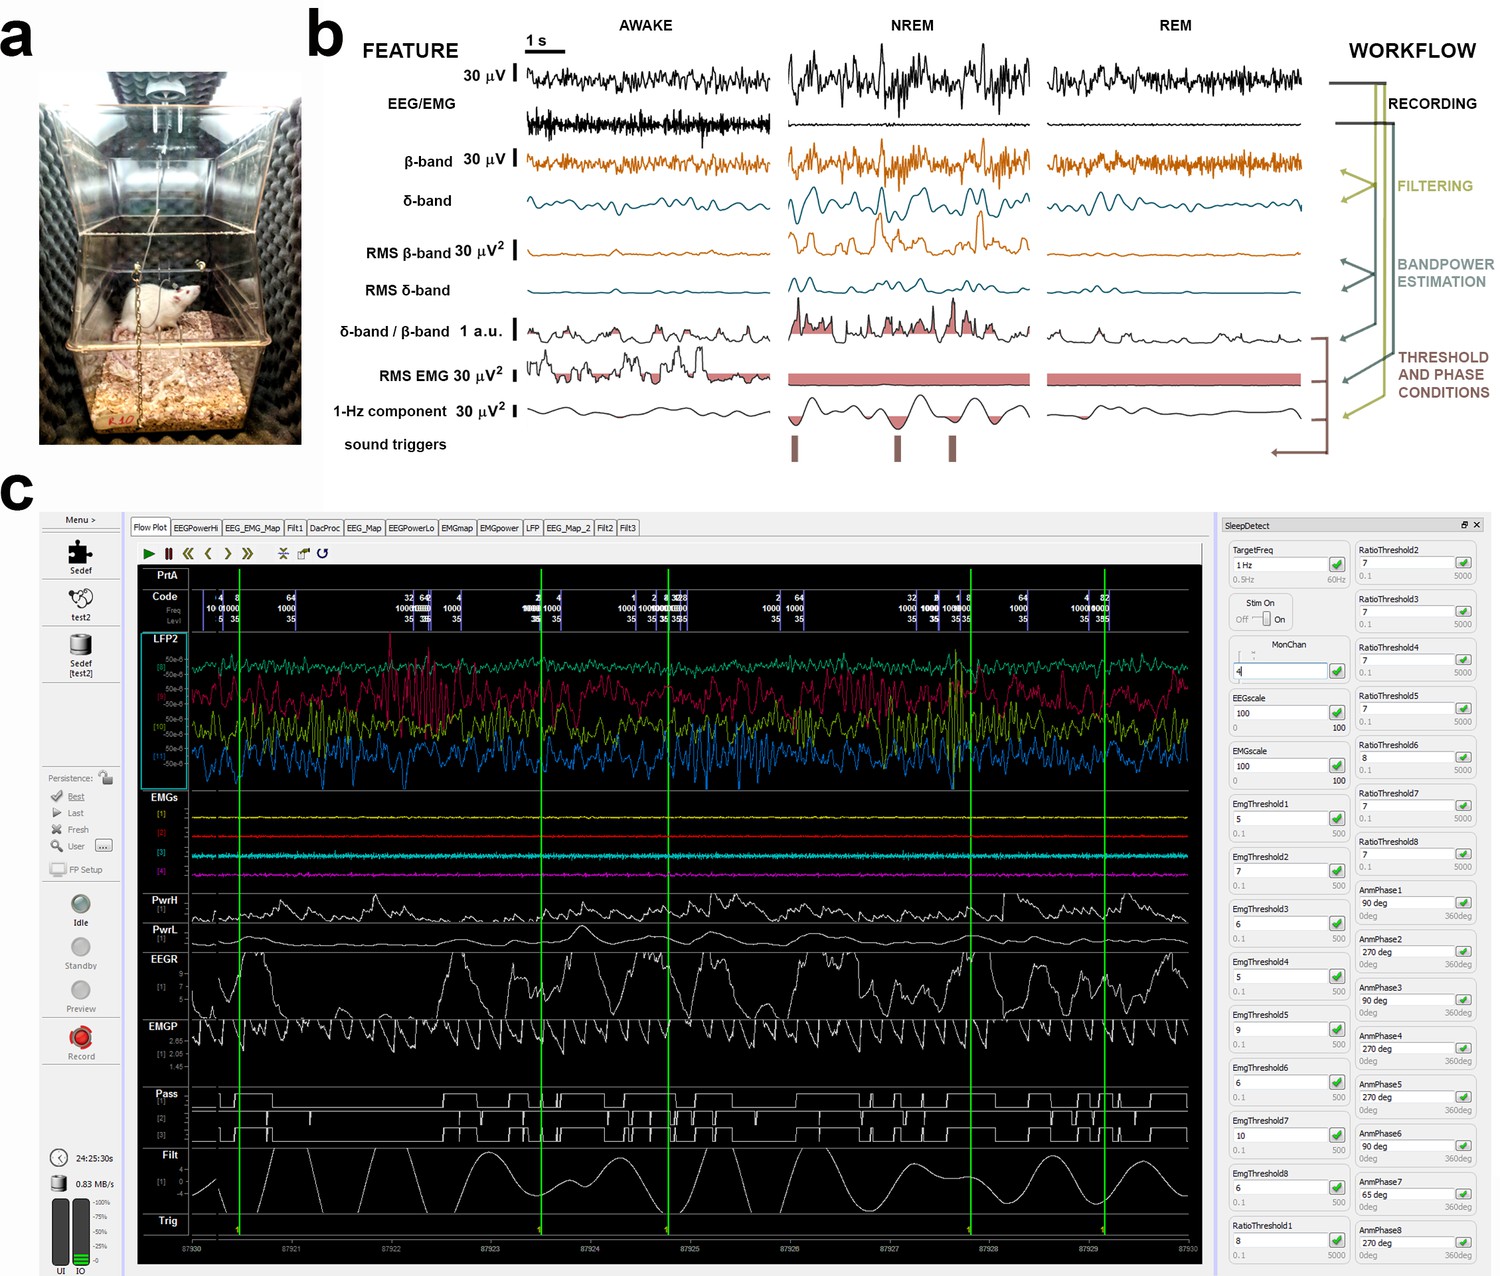
Illustration of a sound-insulated chamber, online signal processing workflow, and SYNAPSE’s interface.
(a) Single sound-insulated chamber for recording and auditory stimulation in a freely moving rat. (b) Processing tree for online non-rapid eye movement (NREM) staging and phase-targeted auditory stimulation: left: electroencephalogram (EEG) and electromyogram (EMG) channels are filtered and analyzed for spectral power. Based on individual thresholds predefined during baseline (BL) (highlighted pink areas for δ-band/β-band [i.e., NREMratio] and EMGrms), auditory triggers were delivered in selected phases of slow waves, during online-staged NREM. (c) SYNAPSE interface depicting EEG/EMG signal (in color) and phase-locked stimulation triggers (vertical green lines) in four subjects. On the right, input boxes for individual NREMratio and EMGrms thresholds and phase targets will determine the optimal timing for phase-locked auditory stimulation during NREM in each animal.
Figure 2
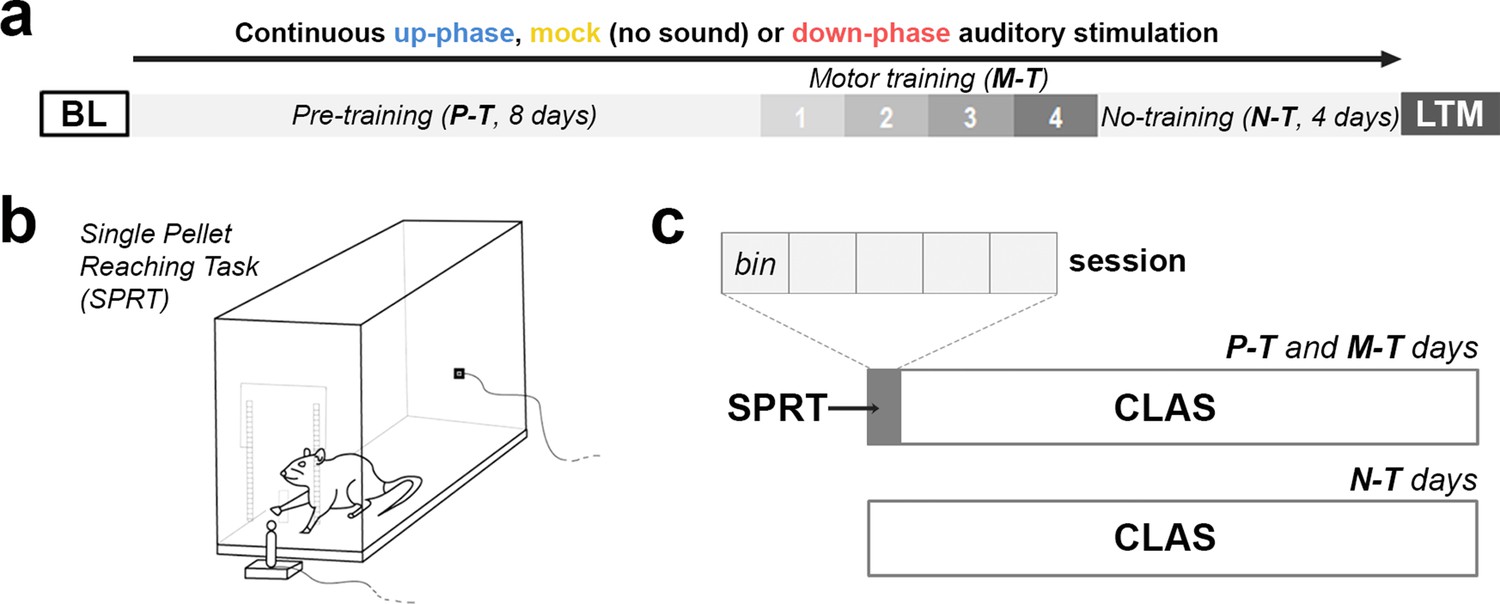
Behavioral experimental design.
(a) During the course of 16 days under continuous auditory stimulation, the animals were trained in the single-pellet reaching task (SPRT) for the initial 12 days (8 days of pre-training [P-T] and 4 days of motor-training [M-T]). For the remaining and final 4 days, the non-training (N-T) phase, the animals did not perform any behavior test, although they were still kept under auditory stimulation. The protocol was terminated on the 16th day, with one last motor assessment (long-term memory [LTM]). (b, c) From protocol days 1–12, the animals were trained in the SPRT during the first hour of the light period and got back to the auditory stimulation chambers for the remaining time. Each training session had a cutoff at 60 min, divided into five bins of up to 12 min. BL: baseline.
Figure 3 with 1 supplement
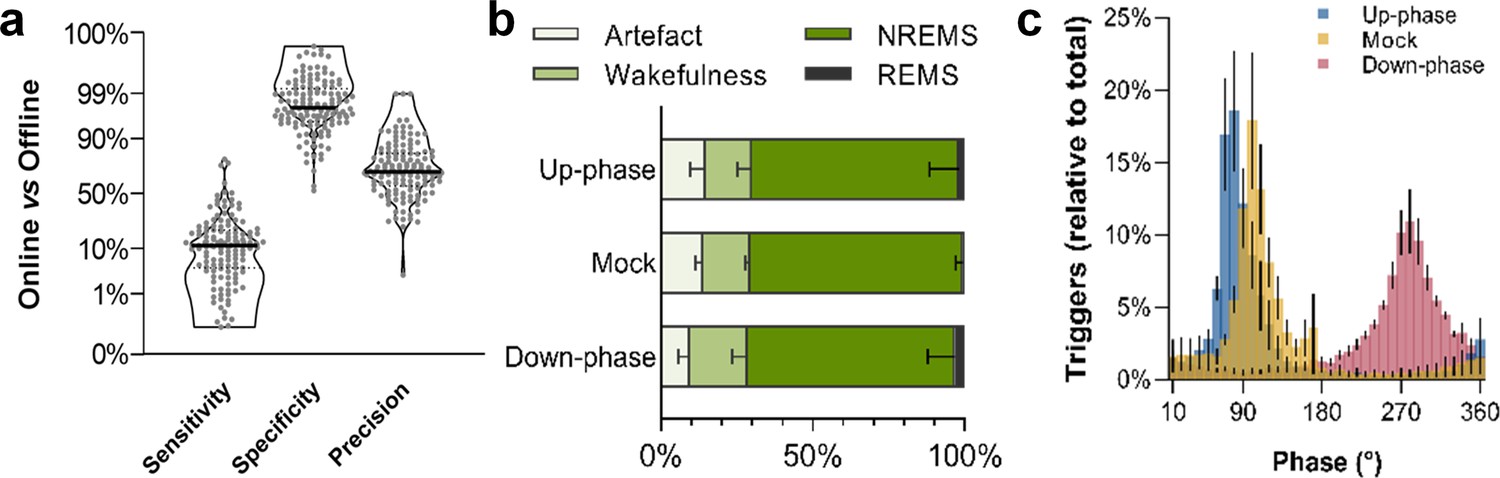
Non-rapid eye movement (NREM) sleep staging performance and phase-target distribution.
(a) Closed-loop auditory stimulation (CLAS) exhibited a 12% sensitivity, 98% specificity, and 70% precision for unsupervised real-time NREM staging (points represent all days from all animals). (b) Offline classification of online-labeled NREM sleep epochs per paradigm. . (c) Phase distribution at trigger onset for up-phase (targeting 65°), mock (targeting 90° but no delivery of sound), and down-phase (targeting 270°), having defined slow wave’s 0° as the rising zero-crossing, 90° to the positive peak, and 270° to the slow-wave trough. For the definitions of sensitivity, specificity, and precision, as well as information about offline scoring of vigilance states and artifact detection, see detailed methods ‘EEG/EMG offline scoring and online staging validation’ section.
Figure 3—figure supplement 1
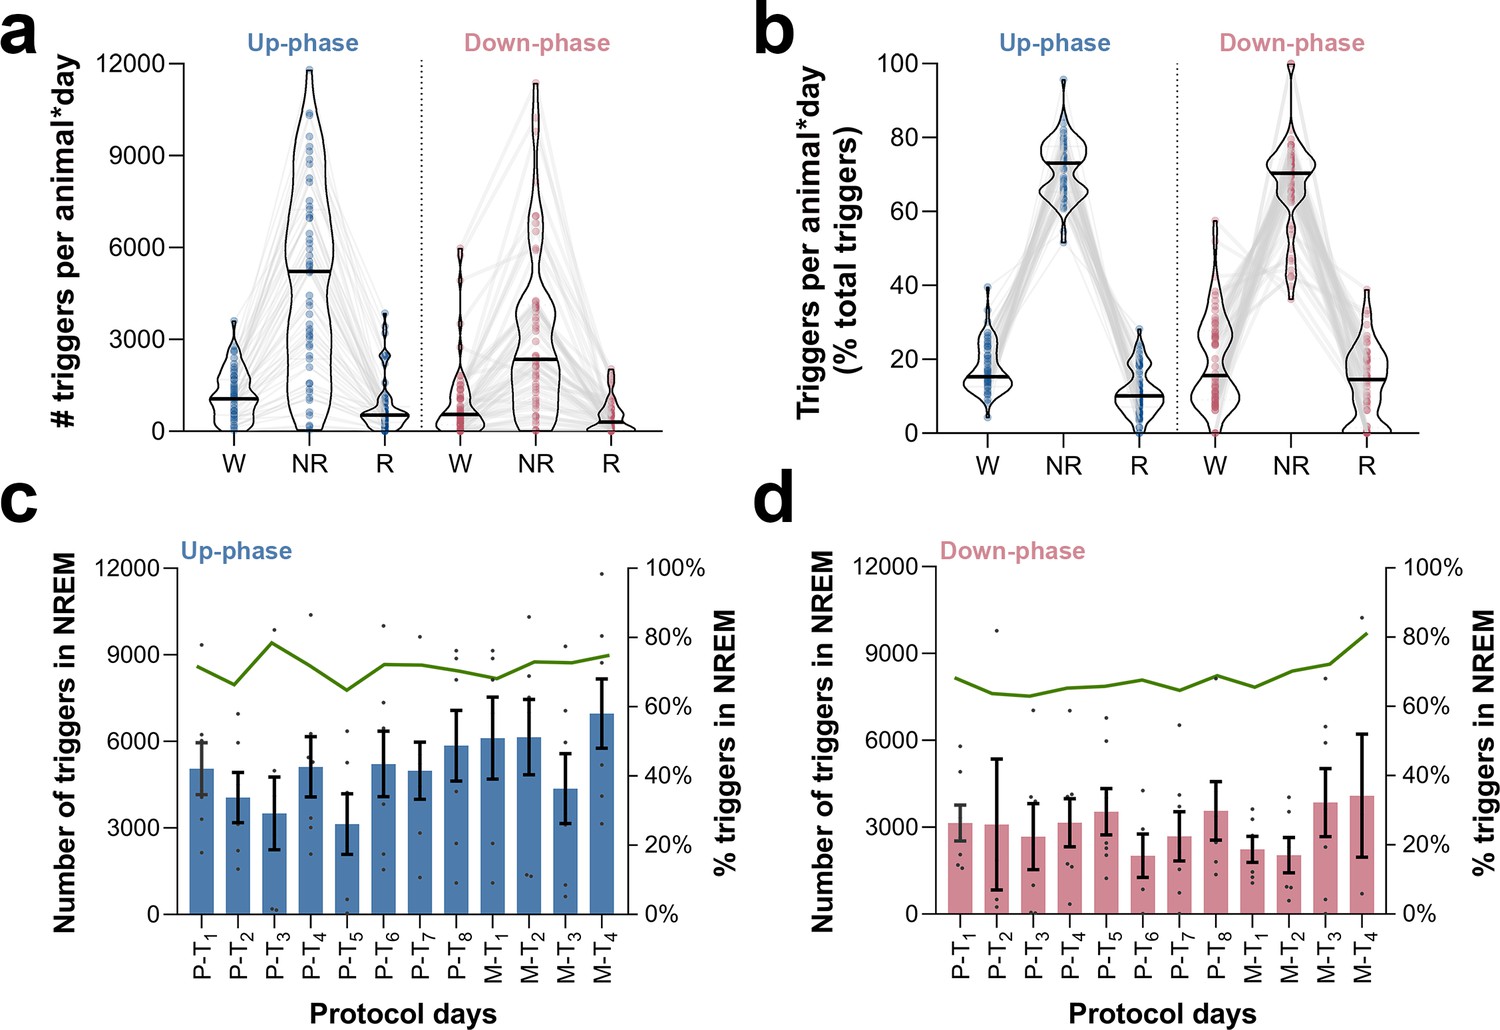
Occurrence and proportion of closed-loop auditory stimulation (CLAS) triggers in wakefulness, non-rapid eye movement (NREM), and rapid eye movement (REM) sleep.
(a) Distribution of triggers per animal * day across sleep stages, for pre-training (P-T) and motor-training (M-T) days. (b) Proportion of triggers per animal * day in relation to daily total of triggers. (c) Daily number of triggers during NREM sleep in up-phase-stimulated animals (bar plot, left axis) and proportion in relation to total triggers (green connecting line, right axis). (d) Daily number of triggers during NREM sleep in down-phase-stimulated animals (bar plot, left axis) and proportion in relation to total triggers (green connecting line, right axis). W: wakefulness; NR: NREM sleep; R: REM sleep.
Figure 4 with 2 supplements

Altered delta and sigma power in stimulated animals.
(a) Non-rapid eye movement (NREM) amount is not different between groups across all protocol days (two-way repeated measures analysis of variance [RM-ANOVA], condition * day interaction, F(32, 215) = 0.929, p=0.582), (b) Fragmentation index reveals no fragmented NREM in none of the groups overtime (RM-ANOVA, time * condition interaction, F(32, 228) = 0.830, p=0.730). (c–e) Average power spectral density in NREM (0.5–28 Hz) extracted from the left electroencephalogram (EEG) derivation during M-T3, relative to baseline (BL). (f) 24 hr spectral for all the groups as percentage change from BL for delta (>0.5–4 Hz), theta (>4–8 Hz), alpha (>8–12 Hz), sigma (>11–16 Hz), and beta (>16–20 Hz) frequency bands for all pre-training (P-T) and motor-training (M-T) days (one-sample Hotelling’s T2). The change in delta and beta was significantly increased during up-phase stimulation compared to mock (***p<0.001 and *p=0.010), whereas down-phase stimulation showed a significant reduction in relation to non-stimulated animals both in delta and sigma (***p<0.001 and ***p<0.001, respectively). Significant changes from BL are marked as gray bars on the lower part of the chart. (g) Sigma power in the mock group back to BL values during non-training (N-T) days (one-sample t-test, p=0.672). AUC: area under the curve.
Figure 4—figure supplement 1
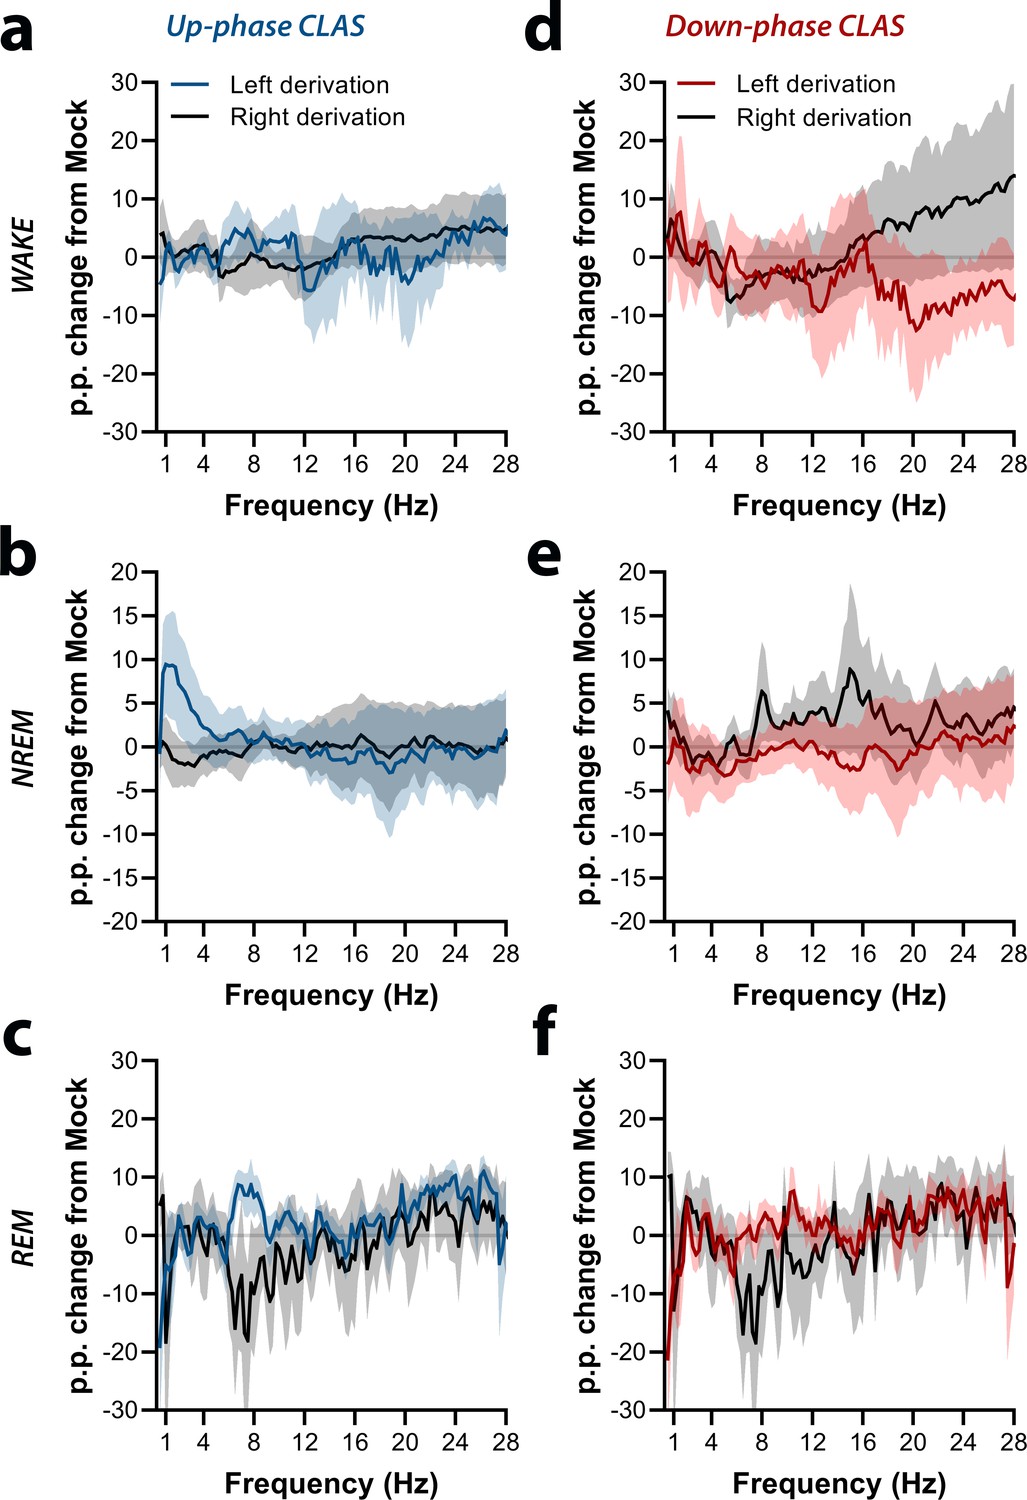
Interhemispheric symmetry during protocol day M-T3.
(a–c) Up-phase-stimulated animals show fairly symmetrical power spectral, with exceptions in the delta range during non-rapid eye movement (NREM) sleep and alpha and beta ranges during rapid eye movement (REM) sleep. (d–f) Down-phase-stimulated animals reveal interhemispheric asymmetry in the beta range during wakefulness, sigma range during NREM sleep, and alpha range during REM sleep (multiple unpaired t-test, significanct level *p>0.05 is represented below the corresponding datapoints). M-T: motor-training; p.p.: percentage points.
Figure 4—figure supplement 2

Exploratory analysis on the effect of behavioral laterality during the single-pellet reaching task on delta and sigma activity from left electroencephalogram (EEG) derivation during M-T3.
(a) Diagram illustrating the combination of modulatory factors (closed-loop auditory stimulation [CLAS] and handedness) on EEG activity for right- and left-pawed animals (preferred paw highlighted in black). (b) Delta activity change on the left EEG derivation (used for CLAS) in relation to the right derivation for up- and down-phase-stimulated animals during M-T3. (c) Sigma activity change on the left EEG derivation (used for CLAS) in relation to the right derivation for up- and down-phase-stimulated animals during M-T3. M-T: motor-training; R: right paw; L: left paw.
Figure 5 with 1 supplement
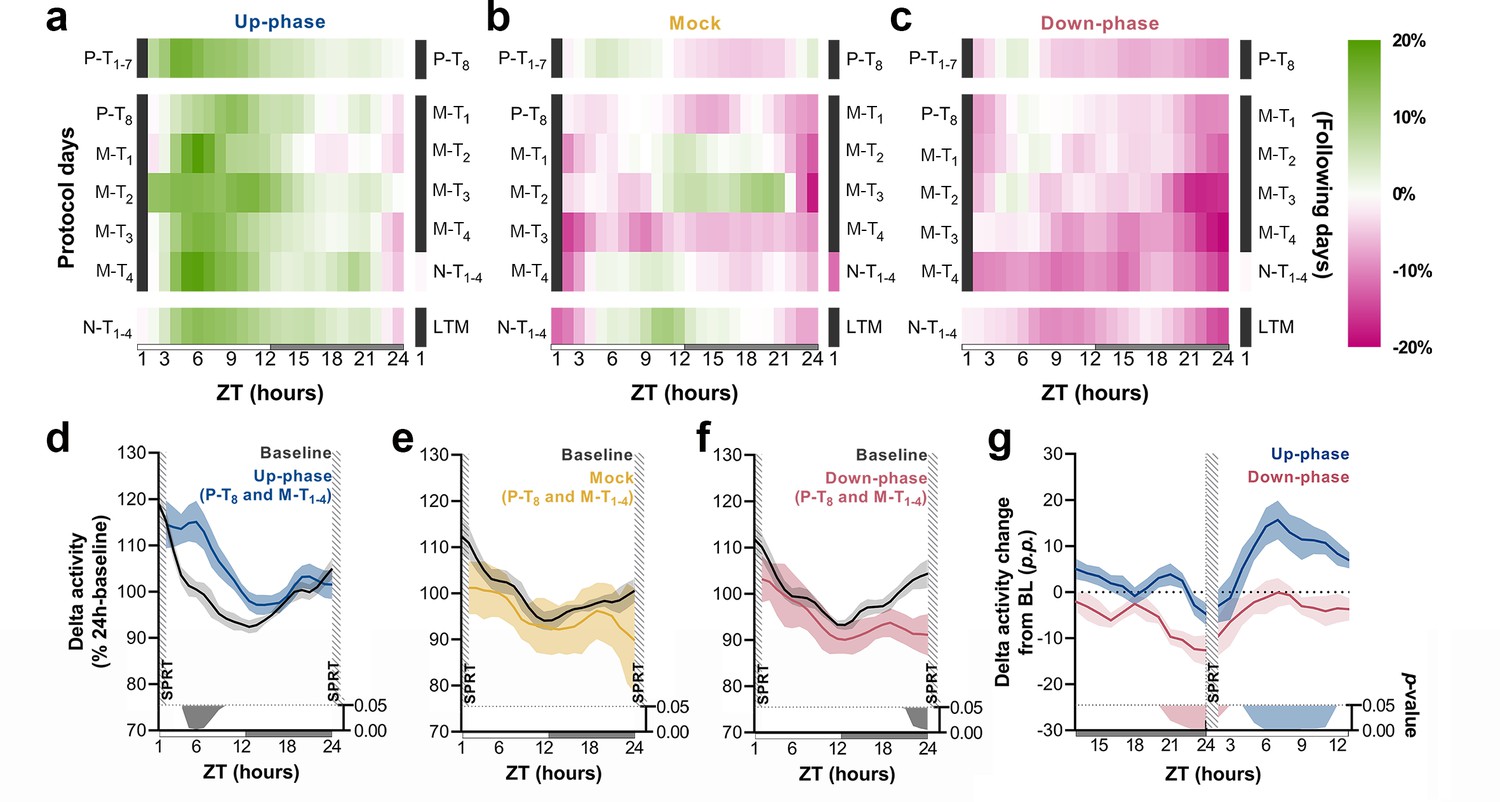
Time course of delta activity changes from baseline (BL) during non-rapid eye movement (NREM) sleep.
(a–c) Delta activity (0.5–4 Hz) changes from BL, in 1 hr bins, for up-phase, mock, and down-phase-stimulated animals. Pre-training (P-T) and non-training (N-T) days were condensed into grand averages (top and bottom heatmap rows, respectively). Individual motor-training (M-T) days are shown in the middle rows. Hours in black represent the single-pellet reaching task (SPRT) training sessions, numbered with the respective protocol day. On the right side of each heatmap, the training sessions of the following protocol day are enumerated. (d–f) Time course of hourly delta activity during BL and M-T days, collectively (colored line represents the grand average of training sessions P-T8 to M-T4). These 5 days, as seen individually in the five-row subpanels in the middle of each heatmap (a–c), were chosen because they circumscribe the four M-T testing sessions and serve to illustrate the potential effect of modulated NREM sleep on behavior and vice versa. (g) Contrast between delta activity during the SPRT session’s preceding and succeeding hours for up- and down-phase stimulation groups, plotted in percentage points from BL. Gray/colored shadows bellow plots (d–g) represent significant timepoints (multiple t-tests, Holm–Sidak correction for multiple comparisons). The light period comprises ZT-1 to ZT-12 (white rectangle), whereas the dark period spans from ZT-13 to ZT-24 (gray rectangle). ZT: zeitgeber; LTM: long-term memory; p.p.: percentage points.
Figure 5—figure supplement 1
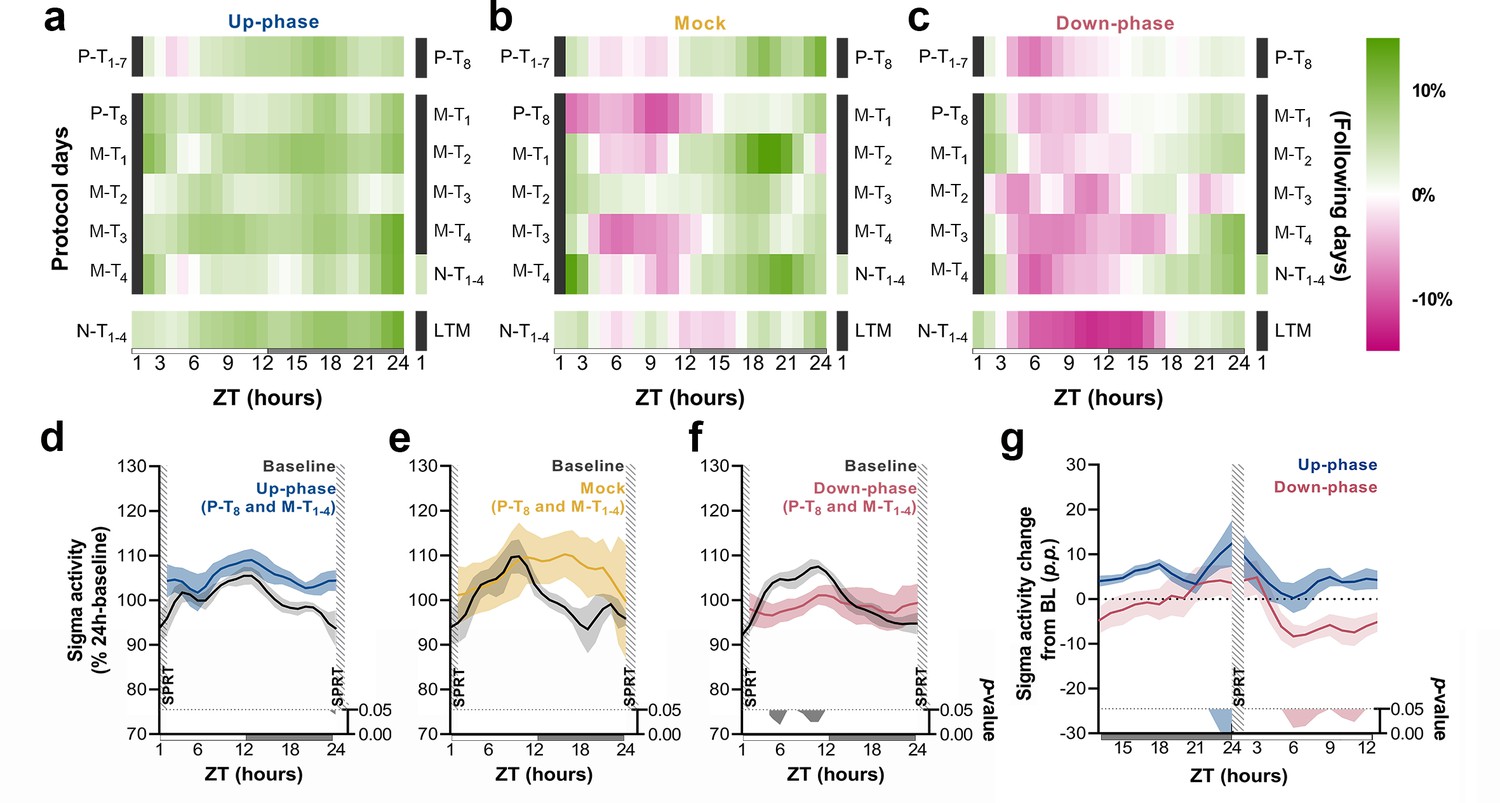
Time course of sigma activity changes from baseline (BL) during all protocol days and motor-training (M-T) grand average.
(a–c) Sigma activity (11–16 Hz) changes from BL, in 1 hr bins, for up-phase, mock, and down-phase-stimulated animals. Pre-training (P-T) and non-training (N-T) days were condensed into grand averages (top and bottom rows, respectively). Individual M-T days are shown in the middle rows. Hours in black represent the single-pellet reaching task (SPRT) training sessions, numbered with the respective protocol day. On the right side of each heatmap, the training sessions of the following protocol day are enumerated. (d–f) Time course of hourly sigma activity during BL and M-T days, collectively (colored line represents the grand average of training sessions P-T8 to M-T4). (g) Contrast between delta activity during the SPRT session’s preceding and succeeding hours for up- and down-phase stimulation groups, plotted in percentage points from BL. Gray/colored shadows bellow plots (d–g) represent significant timepoints (multiple t-tests, Holm–Sidak correction for multiple comparisons). The light period comprises ZT-1 to ZT-12 (white rectangle), whereas the dark period spans from ZT-13 to ZT-24 (gray rectangle). ZT: zeitgeber; LTM: long-term memory; p.p.: percentage points.
Figure 6 with 1 supplement
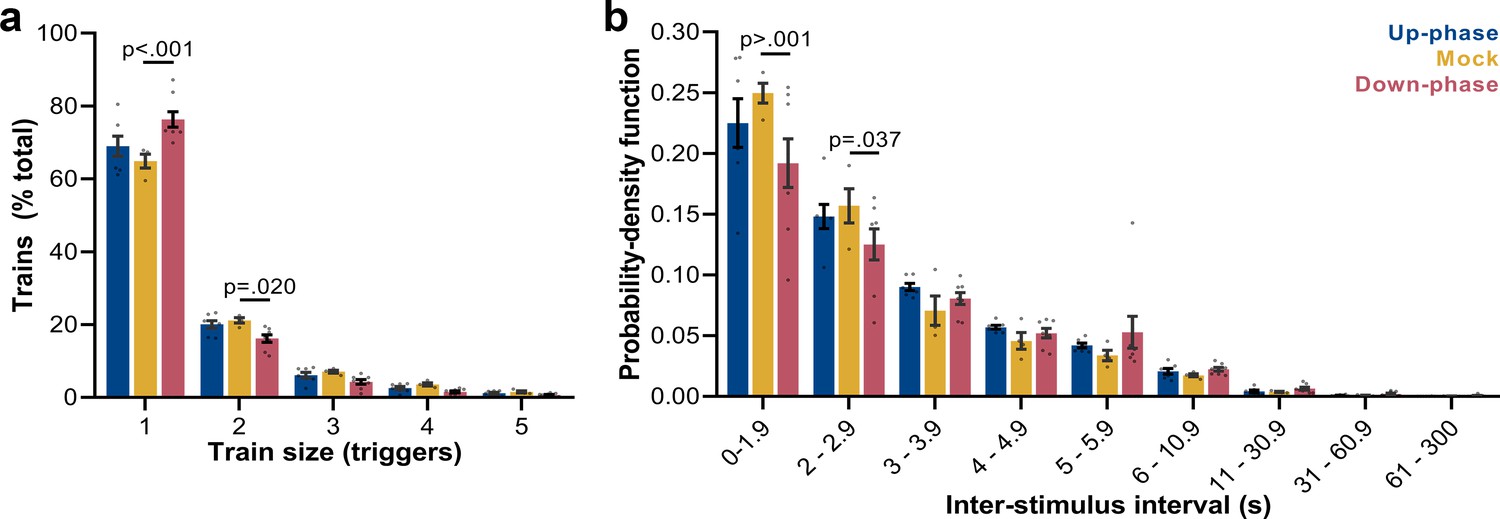
Trigger’s entrainment and distribution.
(a) Histogram for the train of pulses, up to five consecutive stimuli, spaced by no more than 1 s (two-way ANOVA, condition * train size interaction, F(8, 80) = 6.72, ***p<0.001). (b) Histogram for the time between triggers, organized in a probability density function for different bin sizes (two-way ANOVA, condition * interstimulus interval interaction, F(16, 144) = 1.80, *p=0.037).
Figure 6—figure supplement 1
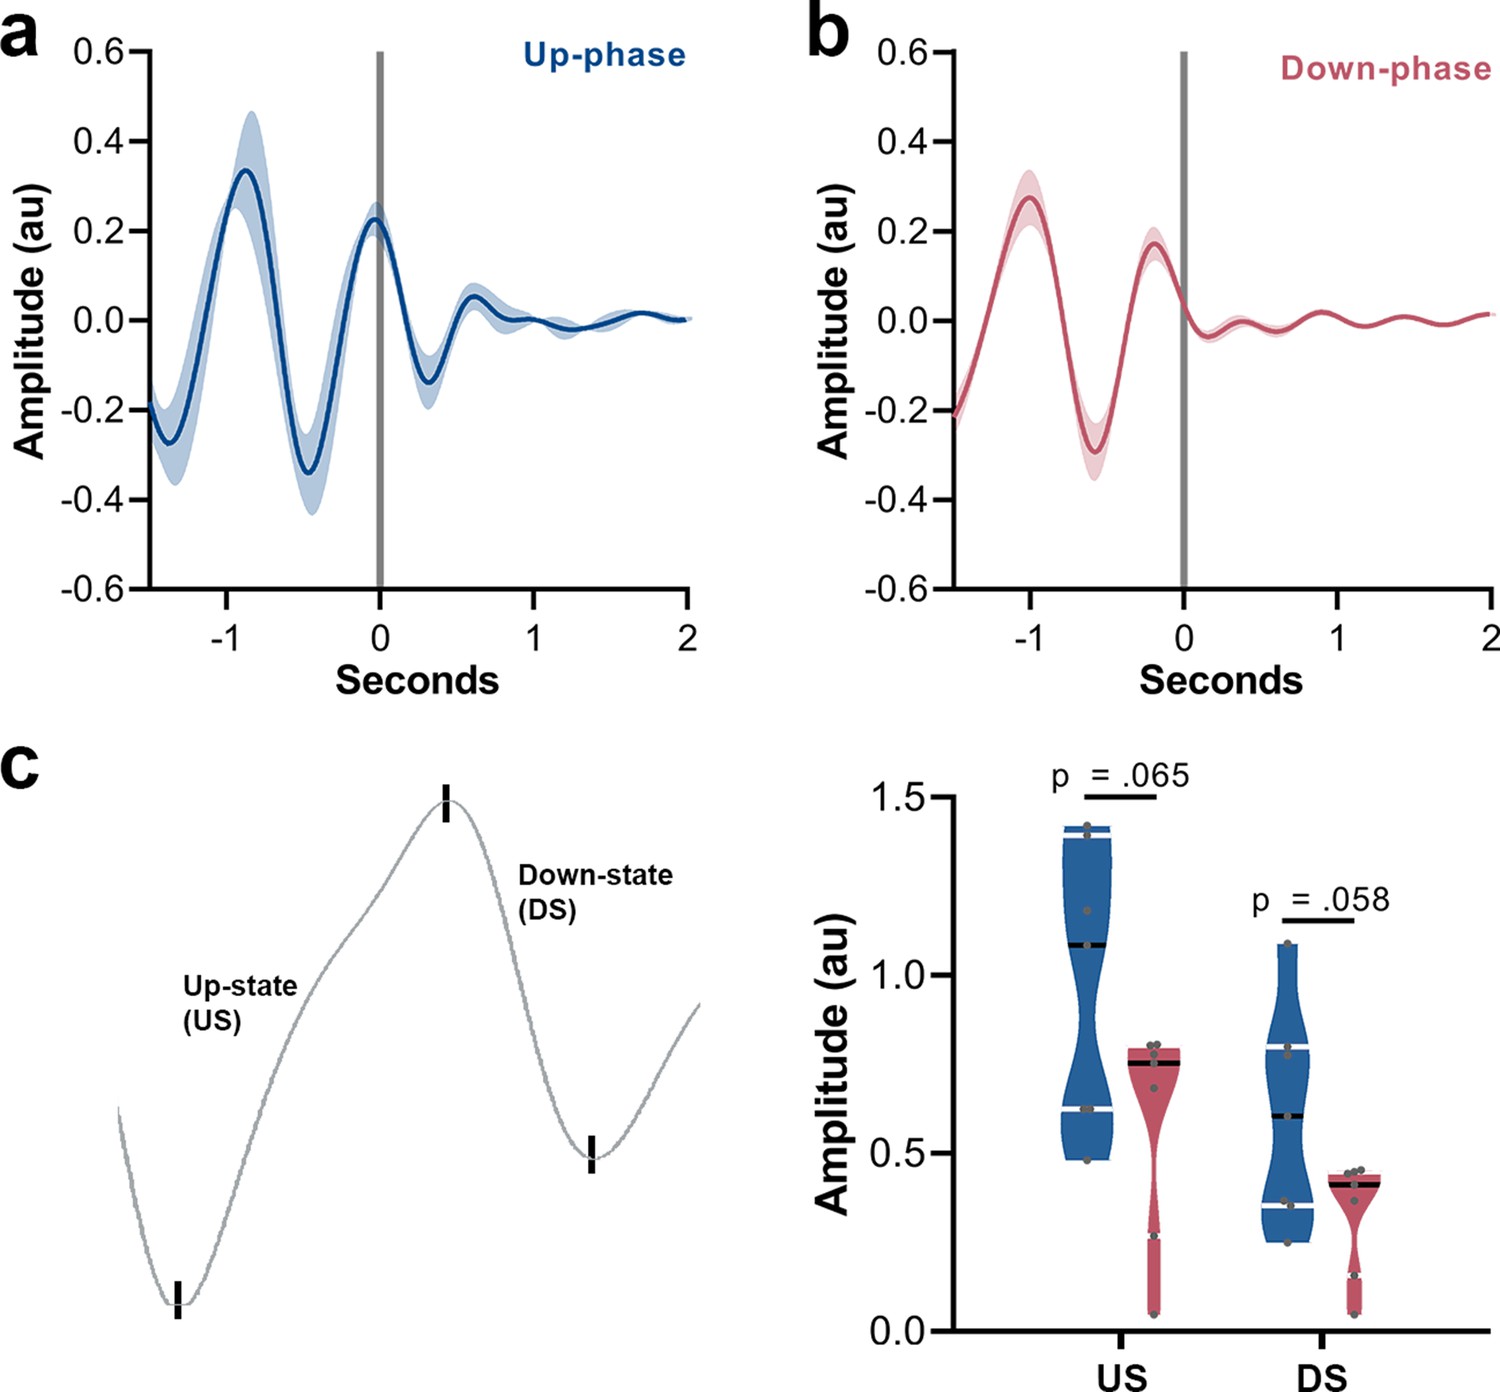
Grand mean event-related potential (ERP) of up- and down-phase groups, and amplitude contrast between the two conditions.
(a) Waveforms from motor-training (M-T) period were locked to the start of each auditory trigger onset (t = 0). Up-phase seems to induce a second slow-wave cycle. (b) Down-phase stimulation does not preserve the slow oscillatory pattern. (c) Comparison of amplitude between up- and down-phase conditions for the depolarized up-state (US) (unpaired t-test, p=0.065) and the hyperpolarized down-state (DS) (unpaired t-test, p=0.058). au: arbitrary units.
Figure 7
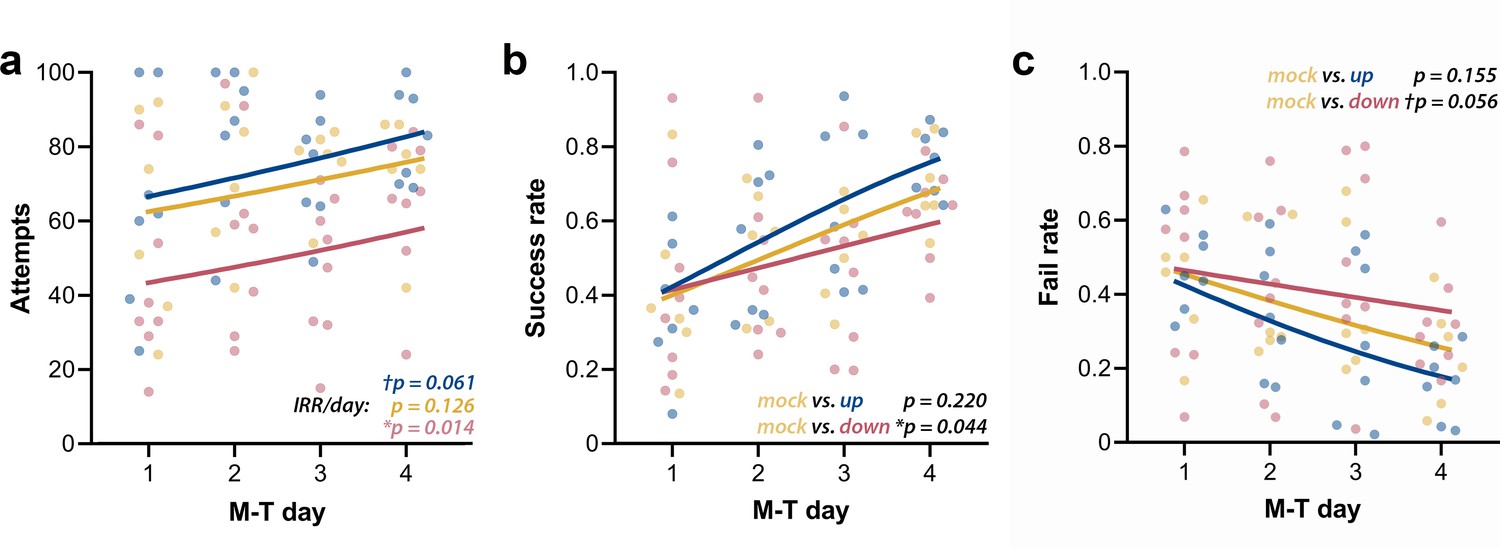
Up-phase-stimulated rats’ learning rate progresses similarly to controls over time, whereas that one of down-phase-stimulated rats is impaired.
(a) The number of attempts in up-phase (n = 7, †pIRR/day = 0.061) and mock (n = 6, pIRR/day = 0.126)-stimulated rats did not significantly change over the period of the test, whereas down-phase rats showed a significant increase in this parameter (n = 8; *pIRR/day = 0.014). (b) By observing success rate (SR) (number of successes in total attempts), down-phase-stimulated subjects show significantly worse learning progression when contrasted with mock subjects ((Χ2(2, N = 21) = 17.50), ***p<0.001; Tukey post-hoc comparison up * mock: p=0.220, down * mock: *p=0.044). (c) Like SR results, the fail rate (FR) analysis (Χ2(2, N = 21) = 18.34, ***p<0.001; Tukey post-hoc comparison up * mock: p=0.155, down * mock: †p=0.056) shows impaired learning in the down-phase-stimulated group compared to mock, while up-phase performs similarly to controls. M-T: motor-training; IRR/day: incidence rate ratios per day.
Figure 8

Down-phase-stimulated animals show a reduction in the engagement with the task towards the end of the session.
(a) Down-phase-stimulated animals attempt significantly less than control animals during the last bin (two-way repeated measures analysis of variance [RM-ANOVA], condition * bin interaction, F(2, 18) = 4.03, *p=0.036; down * mock, *p=0.037). (b) In relation to the proportion of attempts per bin to the total number of attempts, down-phase-stimulated animals again show a sharp decrease towards the end of the session (RM-ANOVA, condition * bin interaction, F(2, 18) = 5.24, *p=0.016; first-bin * last-bin, **p=0.004). (c) Attempting speed shows a non-significant decline from the first to the fifth bin in the down-phase-stimulated subjects (RM-ANOVA, condition * bin interaction, F(2, 18) = 1.33, p=0.291). (d) Up-phase-stimulated animals show a consistent increase in successful attempts from the first to the fifth bin, in all motor-training (M-T) days. Conversely, down-phase-stimulated animals were always slightly less successful towards the end of each session, although this might be due to the drop in attempts within the last testing window (plotted as the log2 of the fold-change of the number of successes of the last bin to the first bin of a session: –1 represents a 50% drop in successes, while 1 represents twice more successes from first bin).
Figure 9

Correlations between number of triggers, delta activity change from baseline (BL), sigma activity change from BL and success rate.
(a) The magnitude of changes in the delta-frequency band was moderately correlated with the number of stimuli delivered, both for up- (Spearman’s rho = 0.43, *p=0.022) and down-phase-stimulated animals (Spearman’s rho = –0.41, *p=0.026). (b) In turn, 24 hr grand average (motor-training [M-T] days) of delta activity changes from BL correlated significantly with sigma activity changes in the same period (Spearman’s rho = 0.57, **p=0.004). (c, d) Moderate positive associations between the success rate (SR) scores achieved by all subjects in the last motor assessment (M-T4) and the global changes in delta activity (Spearman’s rho = 0.41, *p=0.034) and sigma activity (Spearman’s rho = 0.53, *p=0.007), from all days preceding the sessions of the M-T phase, collectively (P‑T8, M-T1, M-T2, and M-T3).
Tables
Table 1
Interindividual and longitudinal variability for delta activity (% change from baseline [BL]).
Differences between subjects contribute the most to the variability seen during closed-loop auditory stimulation (CLAS). Values across animals represent the grand average (P‑T1 – M-T3) of delta power change from BL per animal. Values across days include a grand average of all animals per day. P-T: pre-training; M-T: motor-training.
| Across animals (intervariability) | Across days (P-T1 – M-T33 = 11 days) (longitudinal variability) | |||||||||
|---|---|---|---|---|---|---|---|---|---|---|
| Range | Mean | SD | F(DFn, DFd) | p-Value | Range | Mean | SD | F(DFn, DFd) | p-Value | |
| Up (n = 7) | +1.11 to +10.45 | +7.36 | 3.19 | (6,61) = 5.26 | <0.001 | +3.04 to +10.3 | +6.85 | 1.98 | (10,57) = 1.66 | 0.114 |
| Mock (n = 5) | –5.32 to +10.99 | +0.14 | 5.91 | (4,40) = 3.51 | 0.015 | –4.60 to +3.32 | –0.46 | 2.11 | (10,34) = 1.22 | 0.313 |
| Down (n = 8) | –8.93 to +1.59 | +4.00 | 3.31 | (7,68) = 4.86 | <0.001 | –8.61 to –2.06 | –4.47 | 1.96 | (10,65) = 0.45 | 0.916 |
Additional files
Download links
A two-part list of links to download the article, or parts of the article, in various formats.
Downloads (link to download the article as PDF)
Open citations (links to open the citations from this article in various online reference manager services)
Cite this article (links to download the citations from this article in formats compatible with various reference manager tools)
Closed-loop auditory stimulation method to modulate sleep slow waves and motor learning performance in rats
eLife 10:e68043.
https://doi.org/10.7554/eLife.68043


