Mesenchymal stromal cell aging impairs the self-organizing capacity of lung alveolar epithelial stem cells
- Division of Pulmonary, Allergy, and Critical Care Medicine, Department of Medicine, United States
- John W. Deming Department of Medicine, Tulane University School of Medicine, United States
- Department of Surgery, United States
- Comprehensive Cancer Center Mass Spectrometry & Proteomics Shared Facility, United States
- Department of Anesthesiology and Perioperative Medicine, United States
- Department of Pathology, United States
- Division of Preventive Medicine, Department of Medicine; University of Alabama at Birmingham, United States
Figures
Figure 1 with 1 supplement
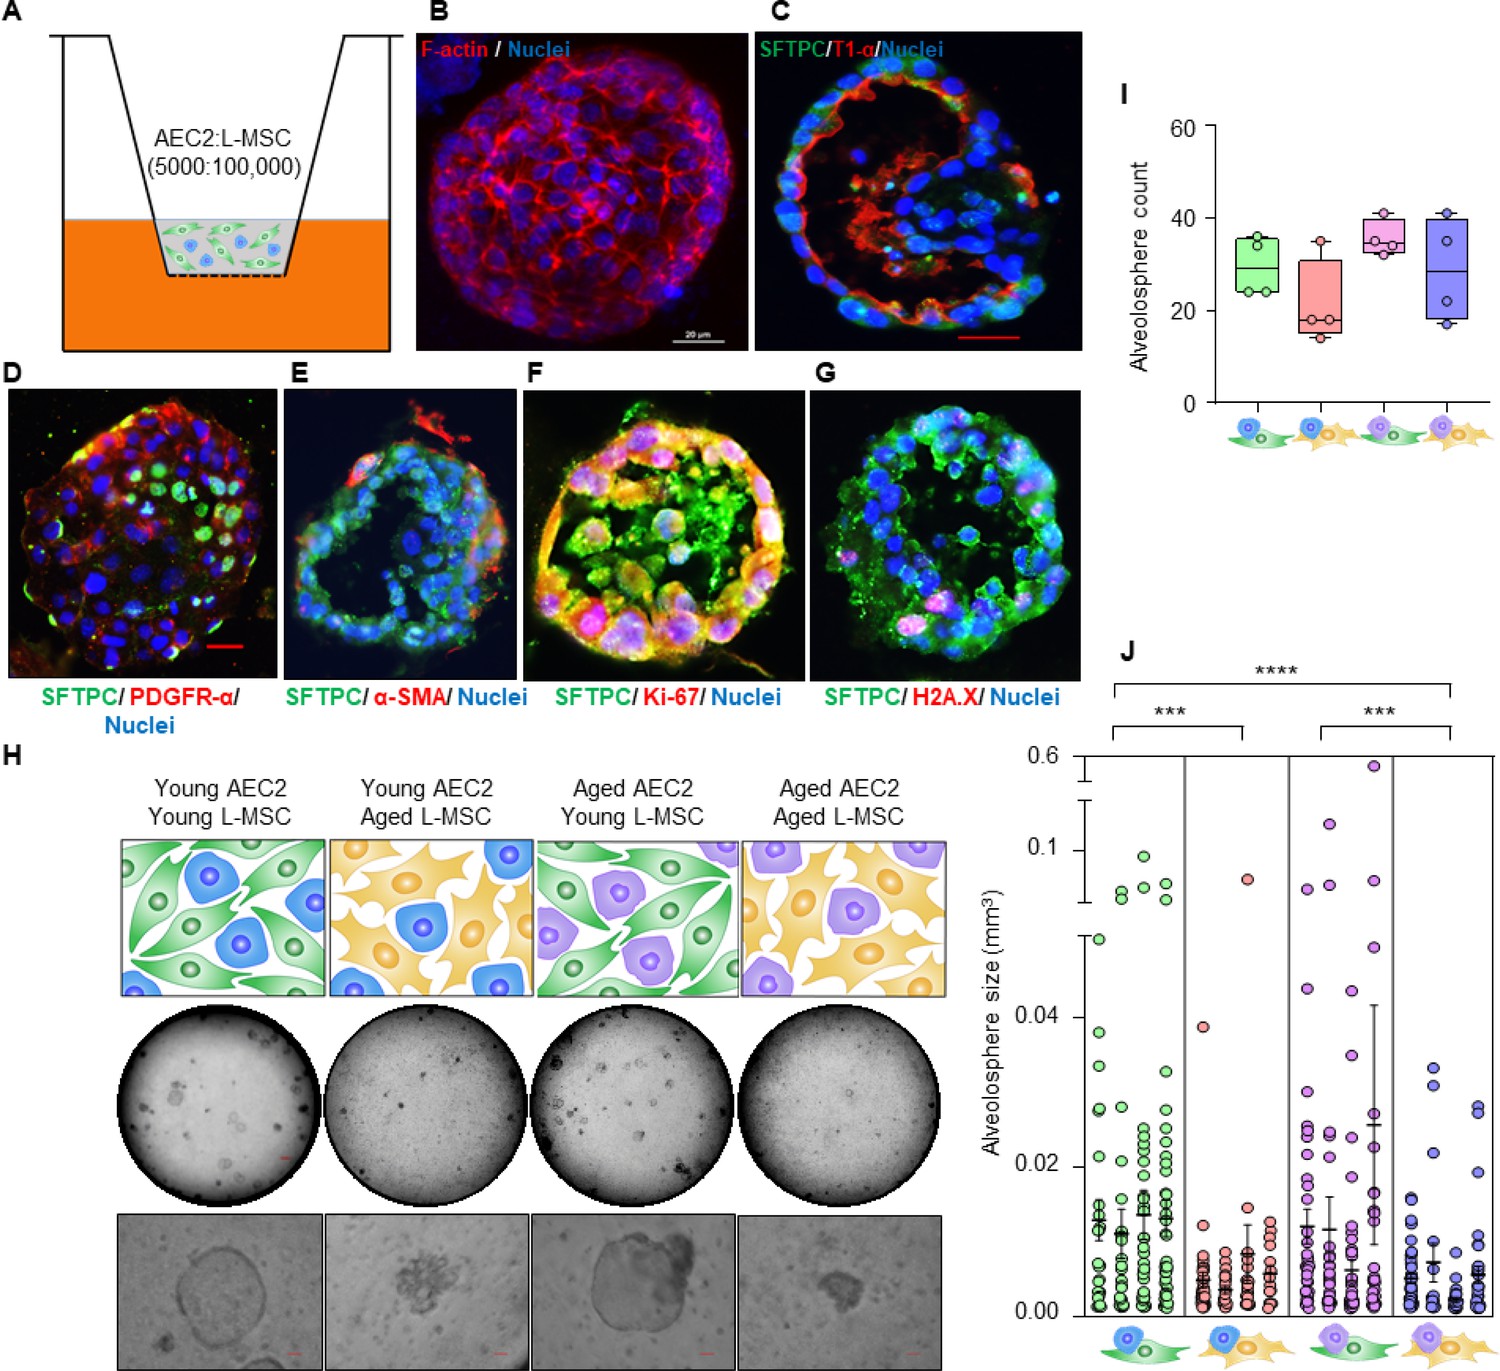
Aging lung-mesenchymal stromal cells (L-MSCs) impair self-organization of alveolar epithelial stem cells (AEC2s) and alveolosphere formation.
(A) Alveolosphere assay. AEC2s and L-MSCs were purified from the young (3 months) mice lungs. AEC2s (5000 cells/well) and L-MSCs (100,000 cells/well) were mixed and seeded in Matrigel: MTEC plus media (1:1) and co-cultured in cell-culture inserts in 24-well dishes as shown. Alveolospheres form within 9–12 days of co-culture. (B) Alveolosphere whole mounts were immunofluorescently stained with antibody against F-actin (red) for confocal imaging. Image showing maximum intensity projection of an alveolosphere (scale bar = 20 µm). (C) Immunofluorescence (IF) staining showing localization of AEC2s (surfactant protein-C [SFTPC], green) and AEC1s (lung type I integral membrane glycoprotein-α [T1-α], red) within the alveolospheres. (D) IF staining showing localization of platelet-derived growth factor receptor-α (PDGFR-α, red) expressing alveolar L-MSCs within the alveolospheres. (E) Alpha-smooth muscle actin (α-SMA, red) IF staining showing presence of myofibroblasts in the alveolosphere. (F, G) Cell proliferation and DNA repair/apoptosis within the alveolospheres were determined by Ki-67 (F; red) and histone H2A.X (G; red) IF staining, respectively. Nuclei were stained with Hoechst 33,342 (blue; scale bars = 20 µm). (H) L-MSCs and AEC2s from young (3 months) and aged mice (24 months) were co-cultured in varied combinations as shown (upper panel); alveolospheres were imaged by brightfield microscopy. Images at low and high magnifications are shown (middle panel, scale bar = 300 µm; lower panel, scale bar = 20 µm). (I) Alveolospheres in each well were counted (n = 4 mice); box and whiskers plot showing median alveolosphere count in each group (p>0.05; ANOVA; Tukey’s pairwise comparison test). (J) Alveolosphere sizes (volumes) were determined for each of the co-culture groups using ImageJ v1.47 software. Nested scatterplot showing mean ± SEM of all the alveolospheres counted in each well for each group (n = 4 mice; ***p<0.001, young AEC2s:young L-MSCs vs. young AEC2s:aged L-MSCs; aged AEC2s:young L-MSCs vs. aged AEC2s:aged L-MSCs; ****p<0.0001, young AEC2s:young L-MSCs vs. aged AEC2s:aged L-MSCs; ANOVA followed by Tukey’s pairwise comparison test).
-
Figure 1—source data 1
Alveolosphere formation with varying combinations of L-MSCs and AEC2s.
- https://cdn.elifesciences.org/articles/68049/elife-68049-fig1-data1-v1.xlsx
Figure 1—figure supplement 1
Measurements of alveolosphere size and number.
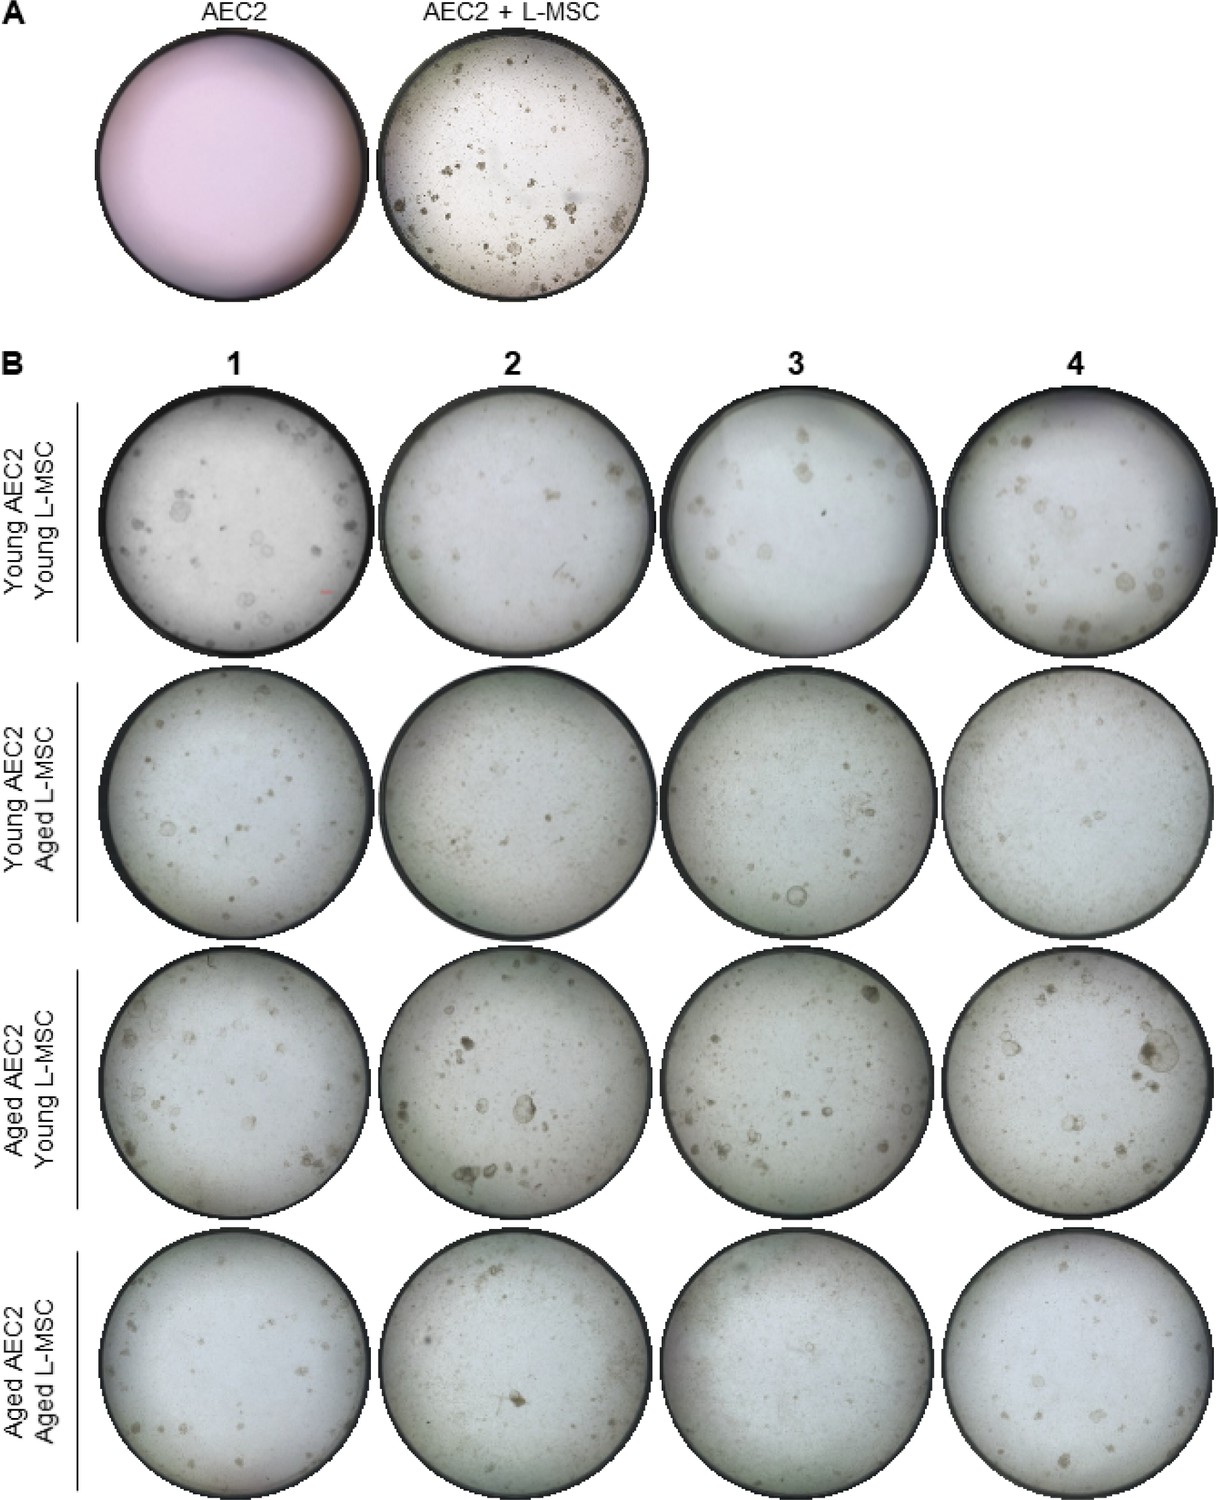
(A) Alveolosphere assay. Type 2 alveolar epithelial cells (AEC2s) do not form alveolospheres in the absence of lung mesenchymal stromal cells (L-MSCs). (B) Aging L-MSCs impair self-organization of AEC2s and alveolosphere formation. L-MSCs and AEC2s were isolated from young (3 months) and aged (24 months) mice and co-cultured as described. Varied combinations of AEC2s and L-MSCs from lungs of mice were studied (scale bar = 300 µm). Alveolospheres were imaged by brightfield microscopy after 12 days of co-culture. Experimental replicates (Figure 1H) are shown here.
Figure 2 with 1 supplement
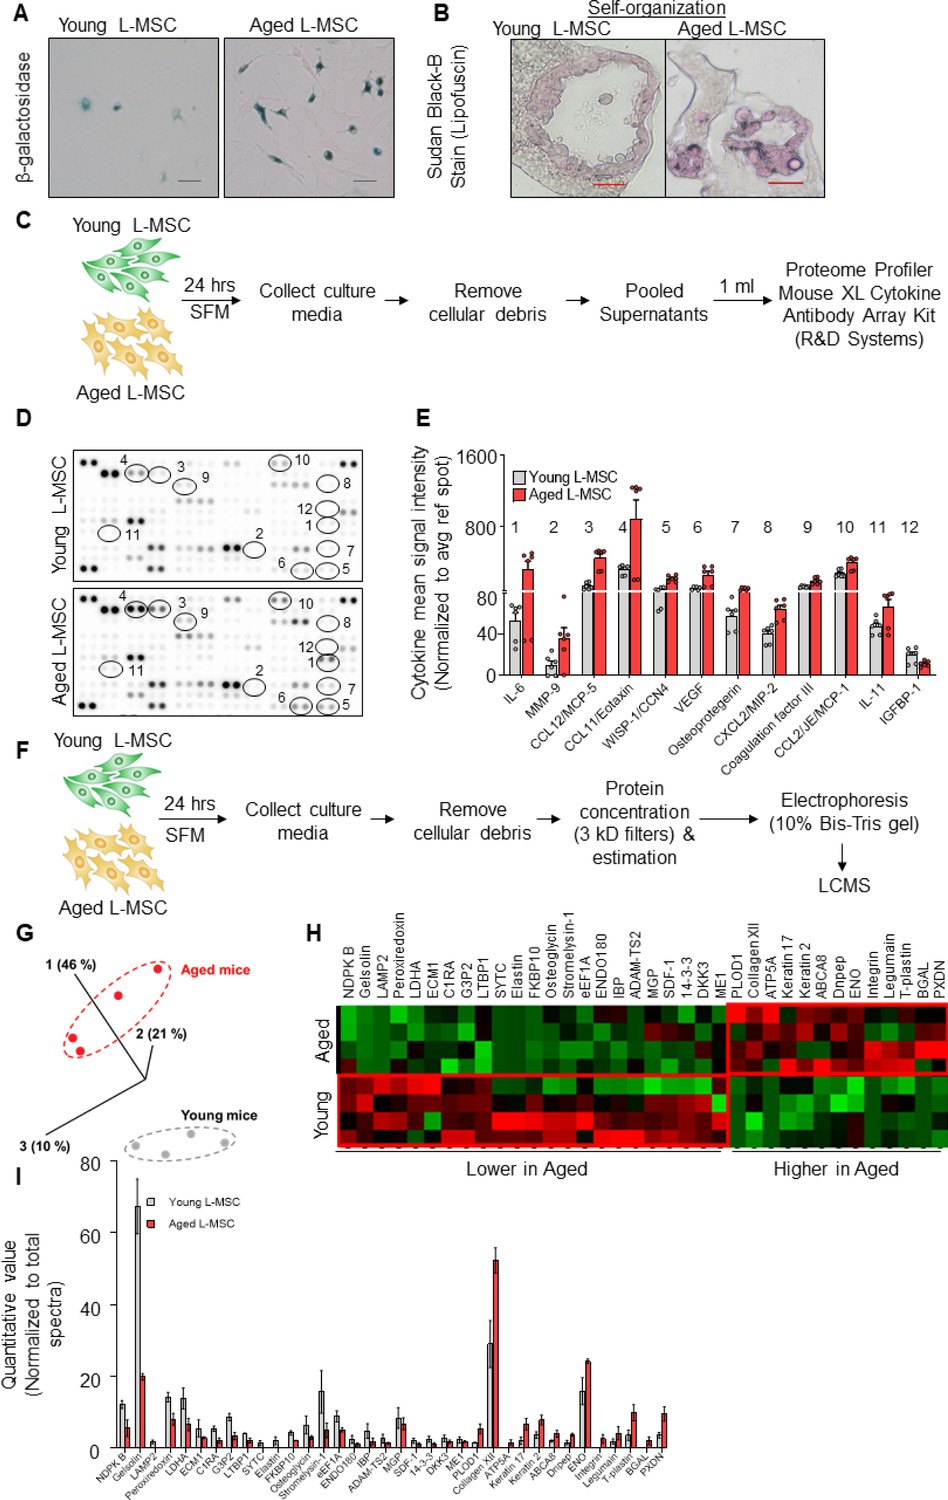
Aged lung mesenchymal stromal cells (L-MSCs) show redox imbalance and acquire senescence-associated secretory phenotype.
(A) β-Galactosidase activity assay. Young and aged L-MSCs were plated in 6-well dishes at a density of 150,000 L-MSCs/well. L-MSCs were allowed to attach overnight and stained for β-galactosidase activity (scale bar = 50 µm). (B) Lipofuscin granules were detected in the alveolosphere paraffin sections by Sudan Black B staining. Sections were also stained with nuclear fast red for contrast (scale bar = 20 µm). (C) Cytokine array. 150,000 young and aged L-MSCs were plated in each well of a 6-well culture dish and grown overnight. Cells were washed with PBS and cultured for 24 hr in serum-free media (SFM; 1.5 ml/well). The culture media were pooled for each cell type and centrifuged to remove any cell and debris. 1 ml of supernatant was applied to antibody array, dotted with antibodies against 111 mouse cytokines and growth factors in duplicates. (D) Antibody array showing comparative expression of cytokines and growth factors in the culture media obtained from young and aged L-MSCs. Cytokines and growth factors showing significant difference are numbered and circled. (E) Signal intensity was determined for each dot using Image Quant array analysis software; mean signal intensity was calculated for each cytokine, and plotted. Twelve proteins with statistically significant difference (n = 6 samples from three mice; p<0.05; unpaired t-test) between the young and aged L-MSCs are shown. Data presented here include pooled data from three independent experiments. (F) Proteomics/mass spectrometry analysis. Cell culture media were collected from young and aged L-MSCs (106 cells) after 24 hr of growth in SFM in 10 cm dishes and subjected to proteomics analysis by liquid chromatography-mass spectrometry (LCMS). (G) A three-dimensional principal component analysis (PCA) plot showing replicated samples (young and aged) are relatively similar in their protein expression profiles and grouped together. (H) Heat map showing comparative expression of highly secreted proteins in the culture media between young and aged L-MSCs (n = 4 mice). (I) The top 36 proteins showing statistically significant difference (n = 4 mice; p<0.05; unpaired t-test) between the young and aged L-MSC secretome are plotted. Gene ontology, processes, and network analyses were performed on the mass spectrometry data, and results are provided in Supplementary file 1.
-
Figure 2—source data 1
Cytokine array and mass spectrometry data comparing young and aged L-MSCs.
- https://cdn.elifesciences.org/articles/68049/elife-68049-fig2-data1-v1.xlsx
Figure 2—figure supplement 1
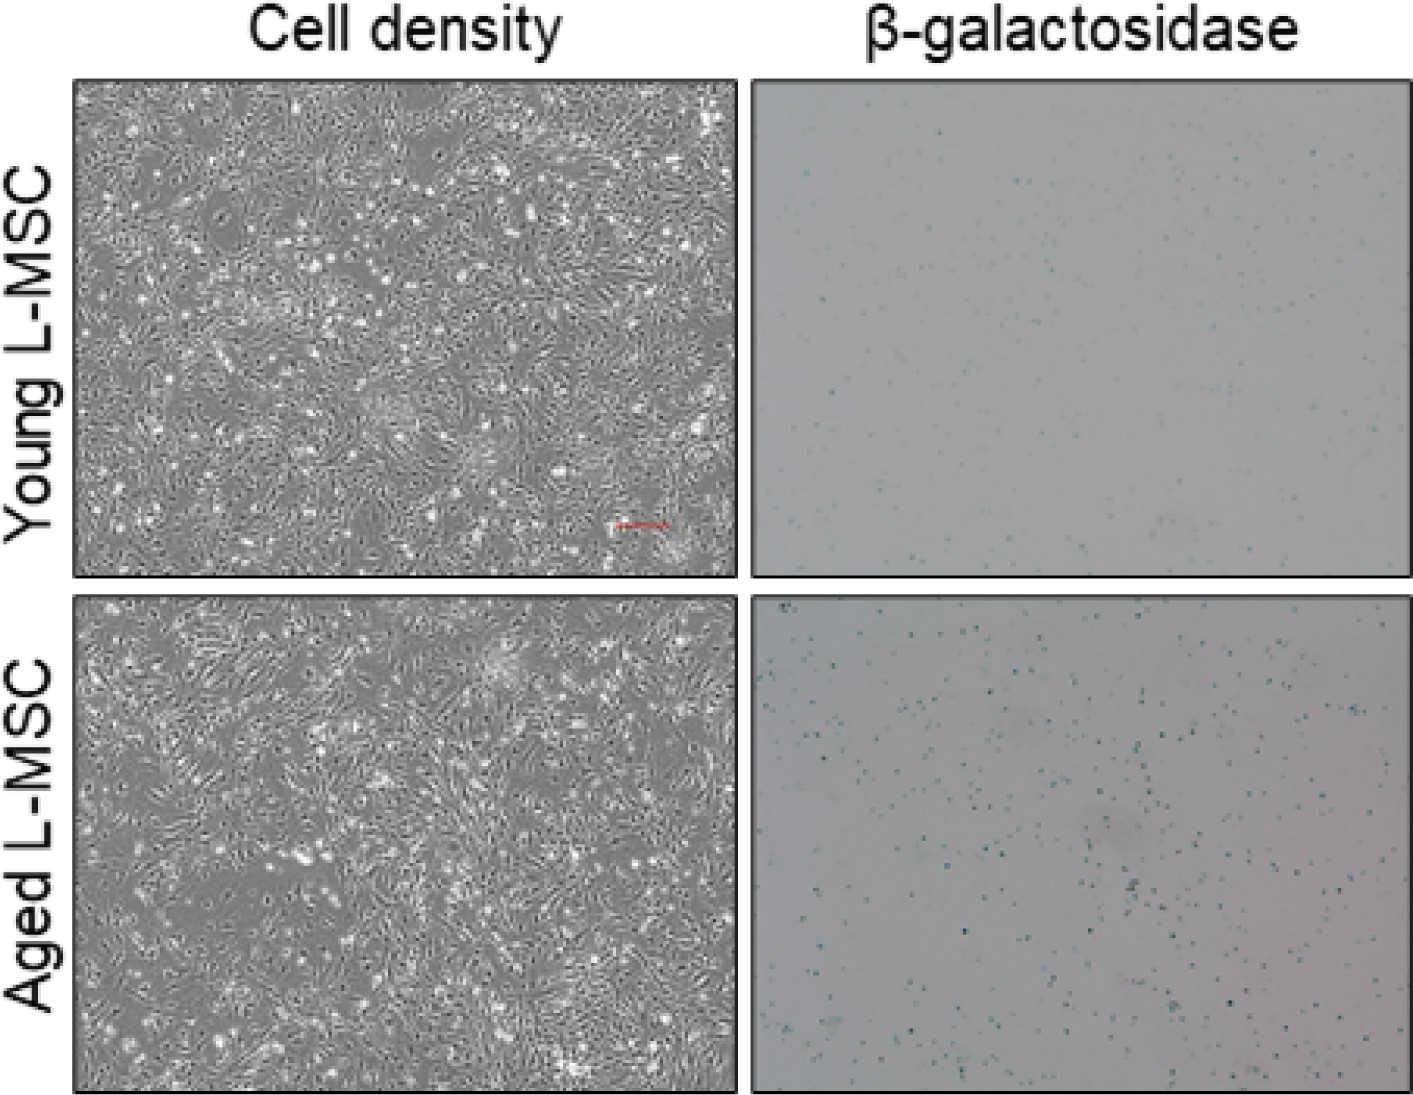
Aged lung mesenchymal stromal cells (L-MSCs) show features of senescence.
β-Galactosidase staining was performed to determine senescence of aged L-MSCs (vs. young) L-MSCs. Low-magnification images are shown here (scale bar = 300 µm).
Figure 3 with 1 supplement
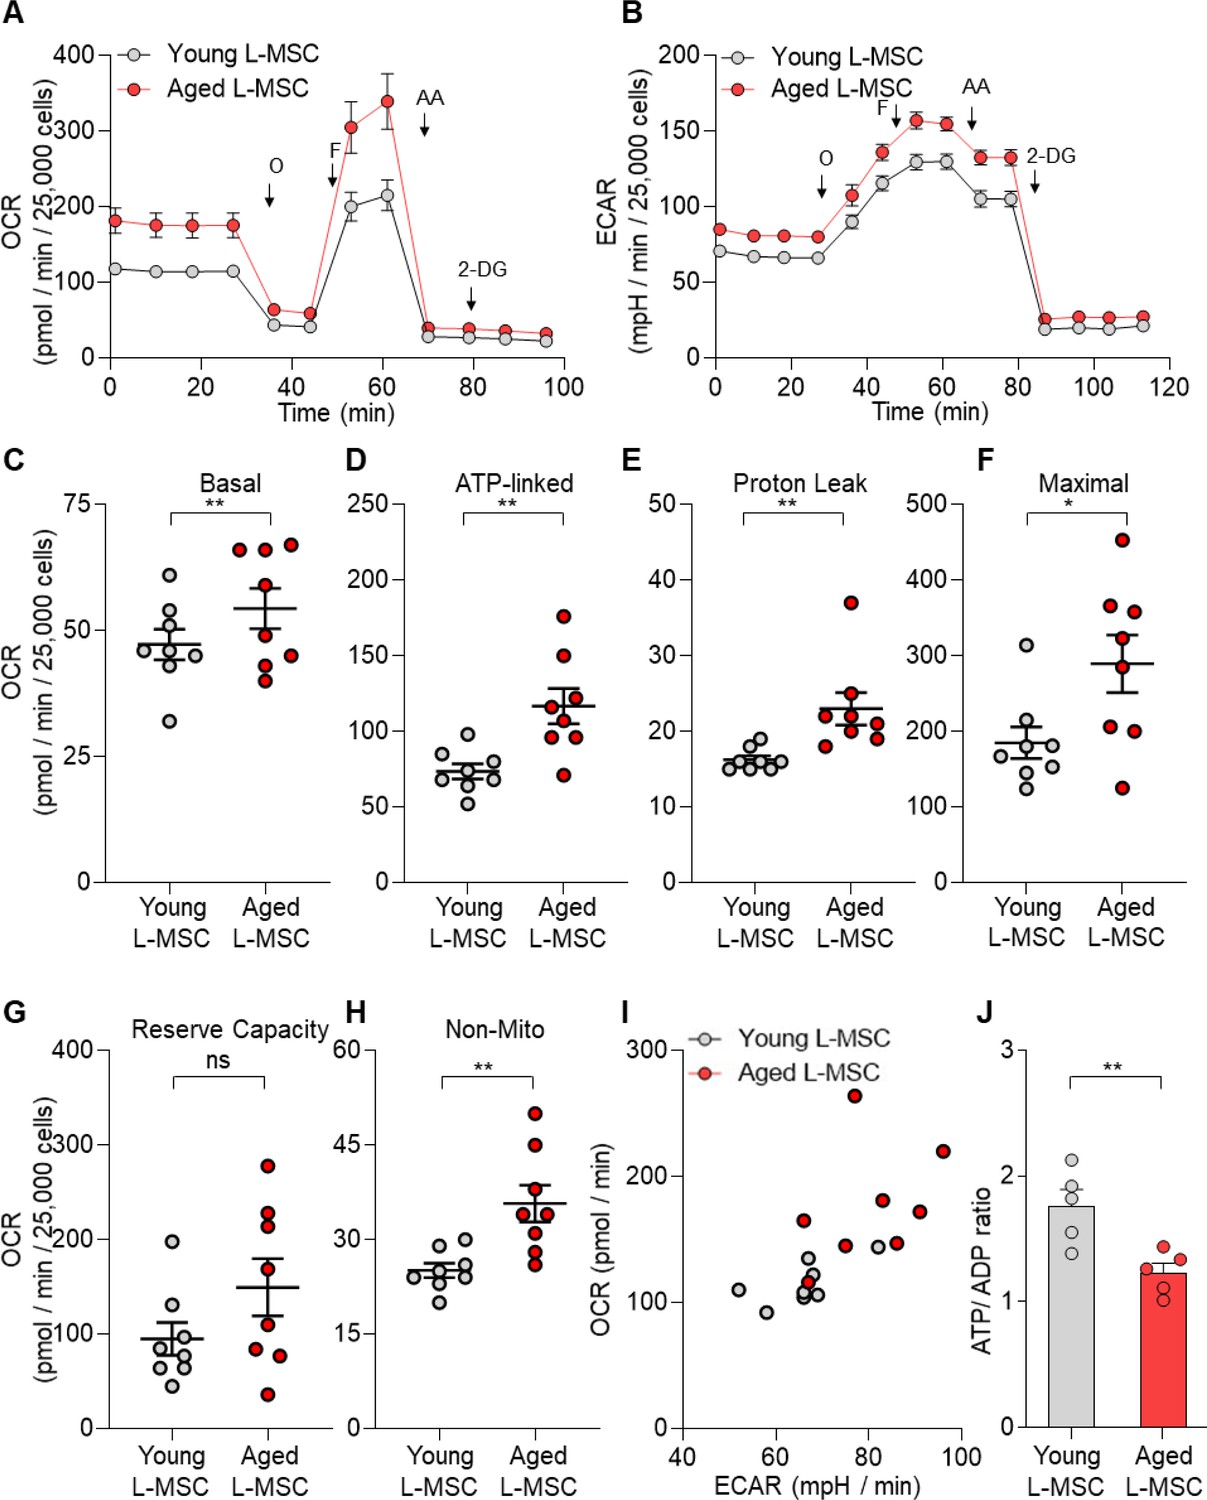
Senescent lung mesenchymal stromal cells (L-MSCs) demonstrate altered bioenergetics.
Young and aged mouse L-MSCs were grown in complete Dulbecco's Modified Eagle Medium (DMEM) for 24 hr. 25,000 cells were seeded in Seahorse XF-24 cell culture microplates. The cells were treated sequentially with mitochondrial inhibitors: oligomycin (Oligo), carbonyl cyanide 4-(trifluoromethoxy) phenylhydrazone (FCCP), antimycin (AA), and glycolytic inhibitor: 2-deoxy-d-glucose (2-DG). (A) Real-time oxygen consumption rates (OCRs) and (B) real-time extracellular acidification rates (ECARs) between the young and aged L-MSCs were compared. (C–H) Basal, ATP-linked, proton leak, maximal, reserve capacity, and non-mitochondria-related OCRs were calculated and plotted (n = 8 mice; 10 technical replicates of each averaged; *p<0.05, **p<0.01; unpaired t-test; vs. young L-MSCs). (I) An energy map was generated from the OCR and ECAR data (above) showing higher basal rate of both mitochondrial respiration and glycolysis in aged L-MSCs. (J) ATP/ADP ratio. Young and aged L-MSCs (10,000 cells) were plated in 96-well flat-bottomed dish and allowed to attach. Cells were treated for 5 min with nucleotide-releasing buffer. Relative ATP and ADP levels were measured from luminescent conversion of ATP-dependent luciferin by the luciferase enzyme. ATP/ADP ratio was calculated and plotted. Graph showing comparative ATP/ADP ratio between young and aged L-MSCs (n = 5 technical replicates; **p<0.01; unpaired t-test; vs. young L-MSCs).
-
Figure 3—source data 1
Bioenergetics of senescent L-MSCs.
- https://cdn.elifesciences.org/articles/68049/elife-68049-fig3-data1-v1.xlsx
Figure 3—figure supplement 1
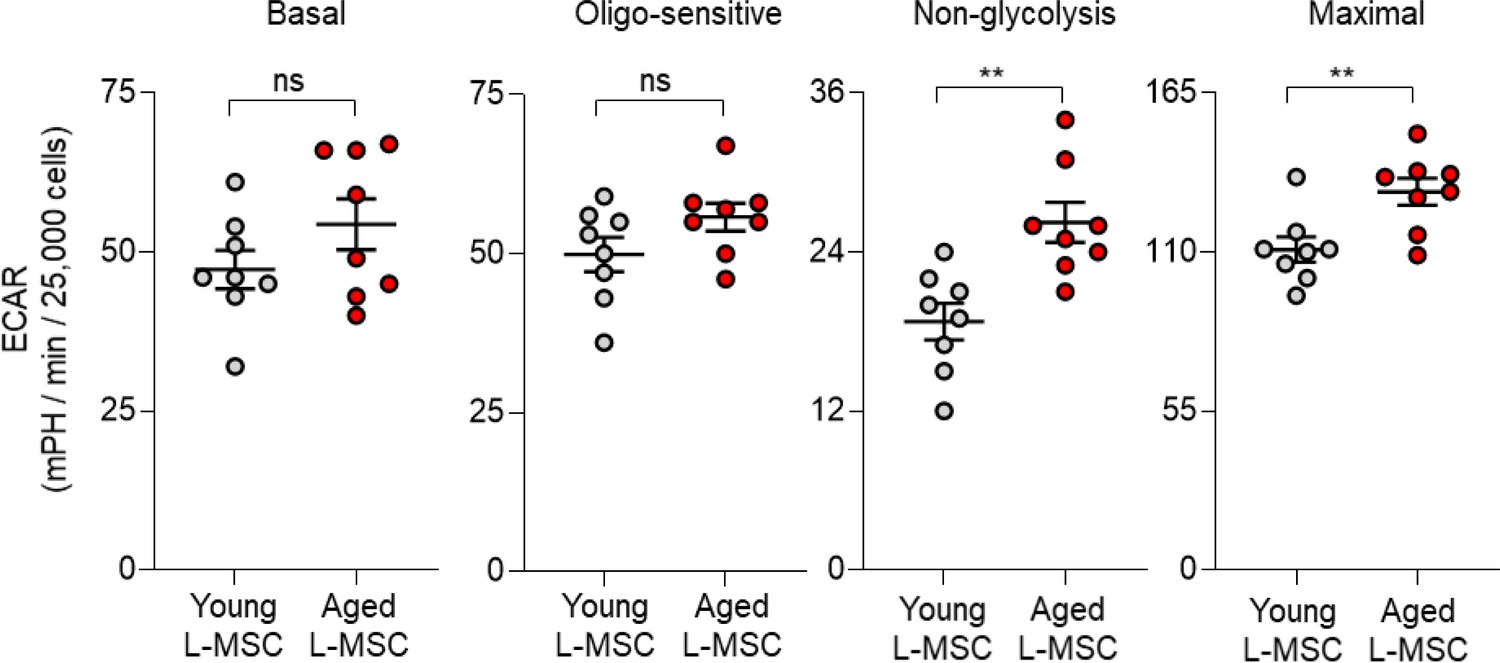
Aged lung mesenchymal stromal cells (L-MSCs) show features of senescence and altered bioenergetics.
Basal, oligo-sensitive, non-glycolysis-related, and maximal extracellular acidification rates (ECARs) are shown here (n = 8 mice; 10 technical replicates of each averaged; **p<0.01; ns: not significant).
-
Figure 3—figure supplement 1—source data 1
ECAR measurements in young and aged L-MSCs.
- https://cdn.elifesciences.org/articles/68049/elife-68049-fig3-figsupp1-data1-v1.xlsx
Figure 4 with 1 supplement
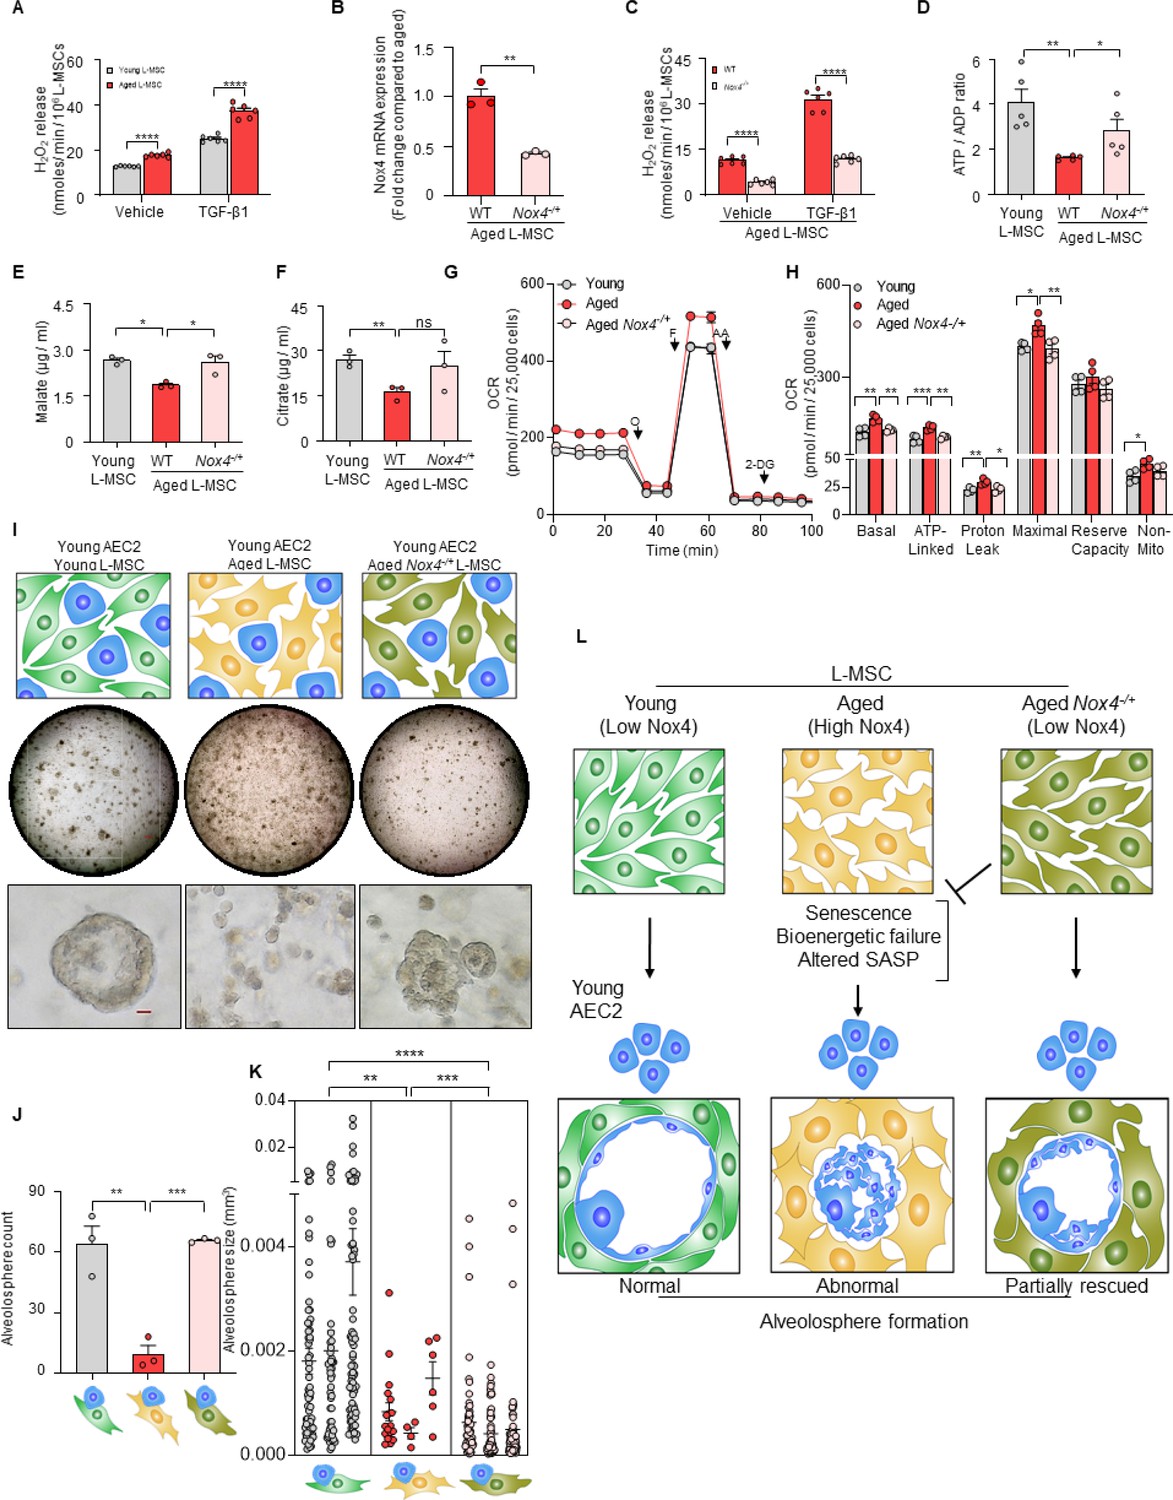
Nox4 deficiency in aged lung mesenchymal stromal cell (L-MSC) improves bioenergetics and restores type 2 alveolar epithelial cell (AEC2) self-organization.
(A) Hydrogen peroxide (H2O2)-release assay. Young and aged L-MSCs were grown in very low serum (1%) containing media for 24 hr and treated with either transforming growth factor-β1 (TGF-β1) or vehicle for 16 hr, and real-time H2O2 release was determined. Here, bar graph showing comparative H2O2 release between young and aged L-MSCs with or without TGF-β1 treatment (n = 6 technical replicates; ****p<0.0001; unpaired t-test). (B) RT-PCR analysis. Total RNA was isolated from aged and aged Nox4-/+ L-MSCs, and subjected to real-time PCR analysis for Nox4 mRNA expression. Data were normalized to β-actin and represented graphically as fold change compared to aged L-MSCs (n = 3 mice; three technical replicates of each averaged; **p<0.01; unpaired t-test). (C) Data showing comparative H2O2 release between aged and aged Nox4-/+ L-MSCs at baseline and after TGF-β1 treatment (n = 6 technical replicates; ****p<0.0001; unpaired t-test). (D) Bar graph showing comparative ATP/ADP ratio between young, aged, and aged Nox4-/+ L-MSCs (n = 5 technical replicates; **p<0.01, *p<0.05). (E, F) Targeted metabolomics. Relative levels of tricarboxylic acid cycle metabolites were determined and compared between young, aged, and aged Nox4-/+ L-MSCs. Concentrations of malate (E) and citrate (F) are shown here (n = 3 technical replicates; *p<0.05; **p<0.01). (G, H) Real-time oxygen consumption rates (OCRs) between the young, aged, and aged Nox4-/+ L-MSCs were compared. Basal, ATP-linked, proton leak, maximal, reserve capacity, and non-mitochondria-related OCRs were calculated and plotted (n = 4 mice/group; 10 technical replicates of each averaged; *p<0.05, **p<0.01; ***p<0.001). (I) Alveolosphere assay. Young, aged, and aged Nox4-/+ L-MSCs were co-cultured with young AEC2s in a ratio described earlier (upper panel). The alveolospheres were imaged by brightfield microscopy after 12 days of co-culture, and comparative outcomes are shown here in low (middle panel; scale bar = 300 µm) and higher magnifications (lower panel; scale bar = 20 µm). (J) Alveolospheres in each well were counted (mean ± SEM; n = 3 mice; **p<0.01; ***p<0.001). (K) Alveolosphere sizes (volumes) were determined for each of the three co-culture groups. Nested scatterplot showing mean ± SEM of all the alveolospheres counted in each well for each group (n = 3 mice; **p<0.01, ***p<0.001, ****p<0.0001). (D–K) Statistical analysis: ANOVA followed by Tukey’s pairwise comparison test. (L) Schematic summarizing the important findings from this study.
-
Figure 4—source data 1
Functional characteristics of wild type and Nox4-deficient aged L-MSCs.
- https://cdn.elifesciences.org/articles/68049/elife-68049-fig4-data1-v1.xlsx
Figure 4—figure supplement 1
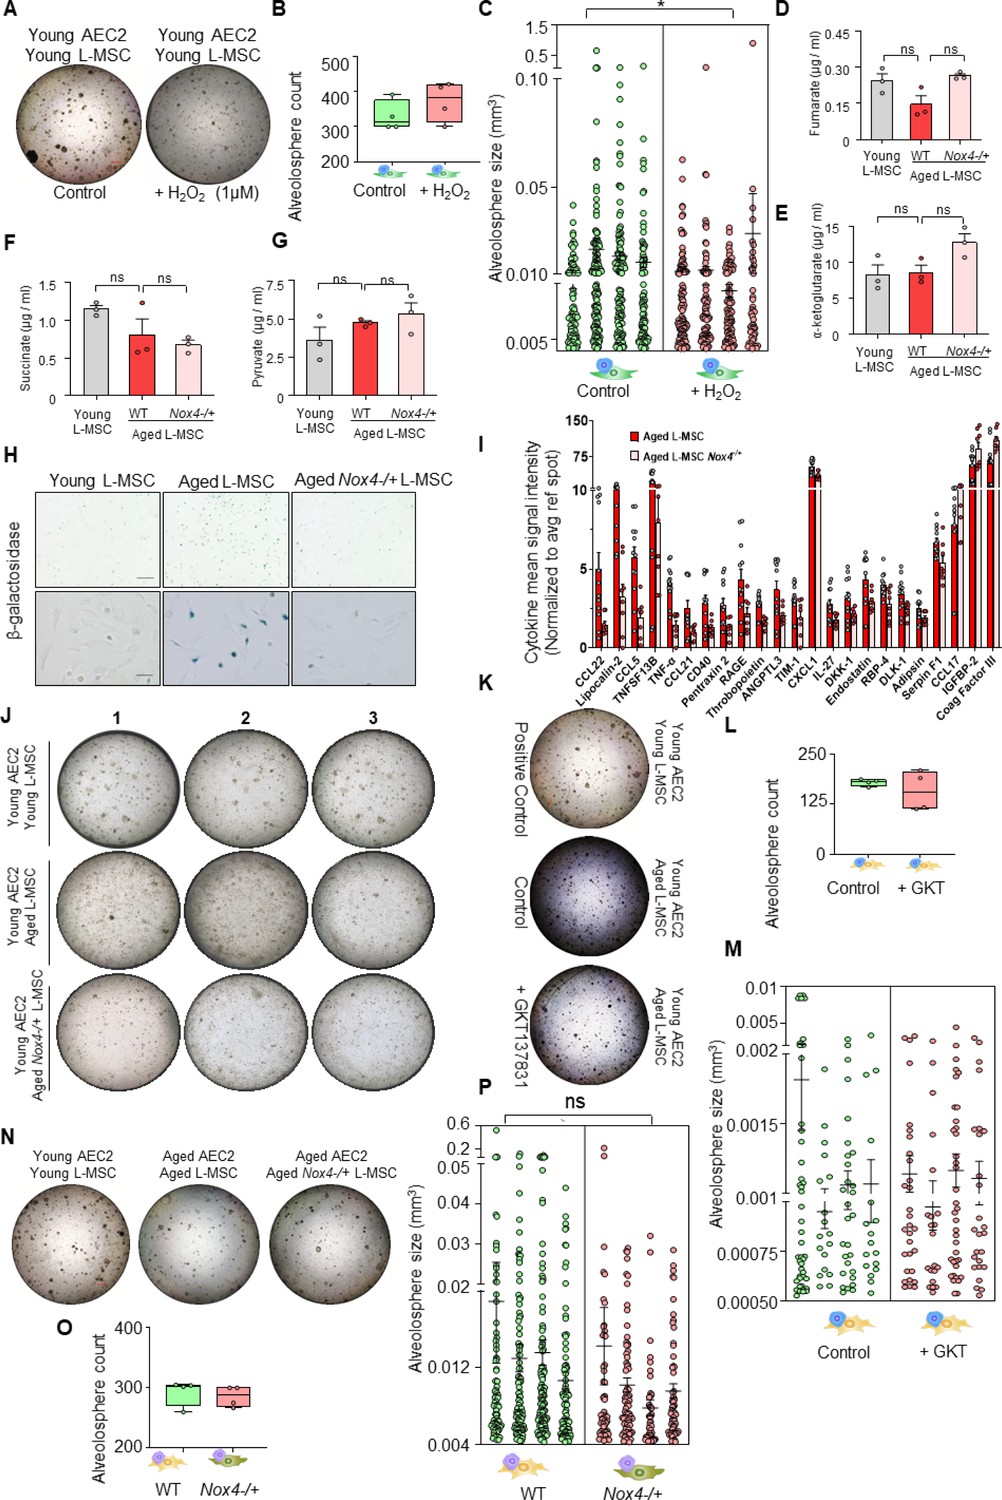
Role of Nox4 in senescent L-MSCs and alveolosphere formation.
(A) Young lung mesenchymal stromal cells (L-MSCs) were co-cultured with young type 2 alveolar epithelial cells (AEC2s) in the presence of H2O2. The alveolospheres were imaged by brightfield microscopy after 12 days of co-culture, and comparative outcomes are shown here in low magnification (scale bar = 500 µm) (B) Alveolospheres in each well were counted (mean ± SEM; n = 4 mice/group). (C) Alveolosphere sizes (volumes) were determined for each of the two co-culture groups. Nested scatterplot showing mean ± SEM (cutoff 200 µm diameter shown) of all the alveolospheres counted in each well for each group (n = 4 mice/group; *p<0.05; unpaired t-test). Targeted metabolomics: concentrations of (D) fumarate, (E) α-ketoglutarate, (F) succinate, and (G) pyruvate in young, aged, and Nox4-deficient L-MSCs were also determined and plotted (n = 3 technical replicates; p>0.05; ns: not significant; ANOVA and Tukey’s pairwise comparison test). (H) β-Galactosidase activity assay. Young, aged, and aged Nox4-/+ L-MSCs were compared for β-galactosidase activity (scale bars = 200 µm [upper panel]; 50 µm [lower panel]). (I) Antibody-based protein array comparing cytokines and growth factors released from aged, and aged Nox4-/+ L-MSCs. Twenty-three proteins that were found to have a statistically significant difference between the young and aged L-MSCs are shown (n = 8–12 samples from 3 to 4 mice/group; p<0.05; unpaired t-test). (J) Nox4-deficiency in aged L-MSCs improves bioenergetics and restores AEC2 self-organization. L-MScs were isolated from young, aged, and Nox4-/+ aged mice and co-cultured with young AEC2s as described earlier. Varied combinations of AEC2s and L-MSCs from lungs of mice were studied. Alveolospheres were imaged by brightfield microscopy after 12 days of co-culture. Experimental replicates shown in Figure 4I (middle panel) are shown here. (K) Young AEC2s were co-cultured with aged L-MSCs in the presence of a Nox4 inhibitor (GKT137831; 10 µM). The alveolospheres were imaged, and comparative outcomes are shown here (scale bar = 500 µm). (L) Alveolospheres in each well were counted (mean ± SEM; n = 4 mice). (M) Alveolosphere sizes (volumes) were determined for each of the two co-culture groups. Nested scatterplot showing mean ± SEM (cutoff 100 µm diameter shown) of all the alveolospheres counted in each well for each group (n = 4 mice/group; ns: nonsignificant; unpaired t-test). (N) Aged AEC2s were co-cultured with either aged L-MSCs or aged Nox4-/+ L-MSCs. The alveolospheres were imaged, and comparative outcomes are shown here (scale bar = 500 µm). (O) Alveolospheres in each well were counted (mean ± SEM; n = 4 mice/group). (P) Alveolosphere sizes (volumes) were determined for each of the two co-culture groups. Nested scatterplot showing mean ± SEM (cutoff 200 µm diameter shown) of all the alveolospheres counted in each well for each group (n = 4 mice; ns; unpaired t-test). (A, K, and N) were co-cultured in a single experiment. Data in (C, M, and P) were natural log transformed before t-test.
-
Figure 4—figure supplement 1—source data 1
Characterization of metabolism, SASP profile, and alveolosphere formation in Nox4-deficient L-MSCs.
- https://cdn.elifesciences.org/articles/68049/elife-68049-fig4-figsupp1-data1-v1.xlsx
Author response image 1
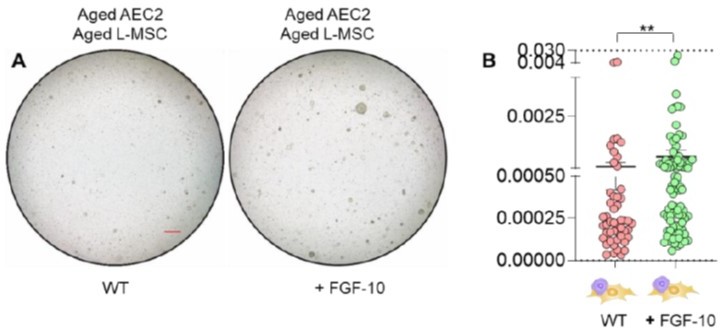
(A) Alveolosphere assay. Aged L-MSCs were co-cultured with aged AEC2s in the presence of FGF-10 (100 ng/ml). The alveolospheres were imaged by brightfield microscopy after 12 days of co-culture, and comparative outcomes are shown here (scale bar = 500 μm) (B) Alveolospheres in each well were counted. Alveolosphere size (volumes) were determined for each of the 2 co-culture groups. Nested scatterplot showing Mean ± SEM of all the alveolospheres counted in each well for each group (n = 2 mice; **p < 0.01; unpaired T-test). Data were natural log transformed before T-test.
Tables
Appendix 1—key resources table
| Reagent type (species) or resource | Designation | Source or reference | Identifiers | Additional information |
|---|---|---|---|---|
| Antibody | Podoplanin (T1-α) monoclonal PE-Cyanine7 | eBioscience/Thermo Fisher Scientific | RRID:AB_2573459 | Host: Syrian hamster0.125 µg/100 µl |
| Antibody | CD31 (PECAM-1) FITC | eBioscience/Thermo Fisher Scientific | RRID:AB_465012 | Host: rat1 µg/100 µl |
| Antibody | CD326 (EpCAM) monoclonal APC-eFluor780 | eBioscience/Thermo Fisher Scientific | RRID:AB_2573986 | Host: rat0.125 µg/100 µl |
| Antibody | CD24 monoclonal, APC | eBioscience/Thermo Fisher Scientific | RRID:AB_10870773 | Host: rat0.06 µg/100 µl |
| Antibody | CD45 monoclonal (30-F11), PE | eBioscience/Thermo fisher Scientific | RRID:AB_465668 | Host: rat0.125 µg/100 µl |
| Antibody | TER-119 monoclonal, biotin | eBioscience/Thermo fisher Scientific | RRID:AB_466796 | Host: rat1:100 |
| Antibody | CD16/32, clone 2.4G2, biotin | BD Biosciences | RRID:AB_394658 | Host: rat1:100 |
| Antibody | CD104 [346-11A] biotin | BioLegend | RRID:AB_961034 | Host: rat1:100 |
| Antibody | CD31 [MEC13.3] biotin | BioLegend | RRID:AB_312910 | Host: rat1:100 |
| Antibody | CD45, biotin | eBioscience/Thermo Fisher Scientific | RRID:AB_466446 | Host: rat1:100 |
| Antibody | Ki-67/MKI67 polyclonal | Novus Biologicals | RRID:AB_10001977 | Host: rabbit1:100 |
| Antibody | Podoplanin polyclonal | R&D Systems | RRID:AB_2268062 | Host: goat15 µg/ml |
| Antibody | Phospho-histone H2A.X (Ser139) | Cell Signaling Technology | RRID:AB_2118010 | Host: mouse1:100 |
| Antibody | Pro-surfactant protein C (SFTP-C) | Millipore Sigma | RRID:AB_91588 | Host: rabbit1:1000 |
| Antibody | Platelet-derived growth factor receptor-α | R&D Systems | RRID:AB_2236897 | Host: mouse1:50 |
| Antibody | α-smooth muscle actin | American Research Product | RRID:AB_1540376 | Host: mouse1:500 |
| Antibody | Goat anti-rabbit IgG secondary antibody-Alexa Fluor 594 | Thermo Fisher Scientific | RRID:AB_2556545 | Host: goat2 µg/ml |
| Antibody | Donkey anti-goat IgG secondary antibody-Alexa Fluor 594 | Thermo Fisher Scientific | RRID:AB_2534105 | Host: donkey2 µg/ml |
| Antibody | Donkey anti-mouse IgG secondary antibody-Alexa Fluor 594 | Thermo Fisher Scientific | RRID:AB_2556543 | Host: donkey2 µg/ml |
| Antibody | Donkey anti-rabbit IgG secondary antibody-Alexa Fluor 488 | Thermo Fisher Scientific | RRID:AB_2556546 | Host: donkey2 µg/ml |
| Antibody | Anti-Biotin MicroBeads UltraPure | Miltenyi Biotec | AB_2811216 | Host: mouse |
| Chemical compound, drug | Fluorescent cell staining reagents | Fixable Viability Dye eFluor 450 | eBioscience/Thermo Fisher Scientific | |
| Chemical compound, drug | Fluorescent cell staining reagents | Phalloidin-iFluor 594 Reagent -CytoPainter | Abcam | |
| Chemical compound, drug | Fluorescent cell staining reagents | Hoechst 33342trihydrochloride trihydrate | Thermo Fisher Scientific | |
| Chemical compound, drug | Bovine pituitary extract | Millipore Sigma | P1476-2.5ML | MTEC/plus supplement |
| Chemical compound, drug | Collagenase, type 4 | Worthington Biochemical | LS004188 | L-MSC isolation |
| Chemical compound, drug | Dispase II | Millipore Sigma | 4942078001 | AEC2 isolation |
| Chemical compound, drug | Matrigel MembraneMatrix GFR | Corning | 356231 | Alveolosphere assay |
| Chemical compound, drug | Insulin-transferrin-selenium-ethanolamine (ITS -X) (100X) | Thermo Fisher Scientific | 51500056 | MTEC/plus supplement |
| Chemical compound, drug | Human insulin soln. | Millipore Sigma | I9278-5ML | MTEC/plus supplement |
| Chemical compound, drug | EGF recombinantmouse protein | Thermo Fisher Scientific | PMG8041 | MTEC/plus supplement |
| Chemical compound, drug | STEMRD Y27632ROCK inhibitor | Thermo Fisher Scientific | 50-175-997 | MTEC/plus supplement |
| Chemical compound, drug | All-trans retinoic acid | Millipore Sigma | R2625-100MG | MTEC/plus supplement |
| Chemical compound, drug | Cholera toxin | Millipore Sigma | C8052-5MG | MTEC/plus supplement |
| Chemical compound, drug | Recombinant humanTGF-beta1 | PeproTech | 100-21-2ug | |
| Chemical compound, drug | Horseradish peroxidase | Millipore Sigma | P8375-25KU | |
| Chemical compound, drug | Homovanillic acid,fluorimetric reagent | Millipore Sigma | H1252-100MG | |
| Chemical compound, drug | Hydrogen peroxide solution, 30% (w/w) | Millipore Sigma | H1009-100ML | |
| Chemical compound, drug | Oligomycin | Millipore Sigma | O4876-5MG | |
| Chemical compound, drug | Carbonyl cyanide 4 | Millipore Sigma | C2920-10MG | |
| Chemical compound, drug | Antimycin A | Millipore Sigma | A8674-25MG | |
| Chemical compound, drug | 2-deoxy D-glucose | Millipore Sigma | D6134-5G | |
| Chemical compound, drug | Vectashield | Vector Laboratories | H-1400-10 | |
| Chemical compound, drug | HistoGel; specimenprocessing gel | Richard-Allan Scientific/Thermo Fisher Scientific | HG-4000-012 | |
| Commercial assay or kit | Pierce BCA ProteinAssay Kit | Thermo Fisher Scientific | PI23225 | |
| Commercial assay or kit | EZQ Protein Quantitation Kit | Thermo Fisher Scientific | R33200 | |
| Commercial assay or kit | MidiMACS Starting Kit (LS) | Miltenyi Biotec | 130-042-301 | |
| Commercial assay or kit | Senescence DetectionKit | Abcam | Ab65351 | |
| Commercial assay or kit | Mouse XL Cytokine Array Kit | R&D Systems | ARY028 | |
| Commercial assay or kit | ADP/ATP Ratio Kit | Abcam | Ab65313 | |
| Commercial assay or kit | Novex Colloidal Blue Staining kit | Invitrogen | LC6025 | |
| Strain, strain background (Mus musculus) | C57BL/6J (2 months) male | Jackson Laboratory | IMSR_JAX:000664 | |
| Strain, strain background (Mus musculus) | C57BL/6J (18 months) male | National Institute of Aging | N/A | |
| Strain, strain background (Mus musculus) | C57BL/6J (Nox4 knockout) male | Dr. Karl-Heinz Krause | University of Geneva | |
| Other | Mouse genotyping service | Transnetyx, Inc, Cordova, TN | ||
| Chemical compound, drug | Isoflurane | VetOne | NDC 13985-528-60 | Anesthesia agent |
| Other | Inverted microscope | Keyence | SCR_017202 | |
| Other | Inverted microscope | Carl Zeiss | ||
| Other | Nikon A1R confocal microscope | Nikon | ||
| Other | Microplate reader | BioTek | SynergyMx | |
| Other | Centrifuge | Eppendorf | 5702R | |
| Other | Flow Cell Sorter | BD Biosciences | ||
| Other | BD FACS Aria | BD Biosciences | SCR_018091 | |
| Other | Flow Cell Analysis | BD Biosciences | BD LSR II GUAVA EasyCyte | |
| Other | Extracellular Flux Analyzer (Seahorse XFe96) | Agilent | SCR_019545 | |
| Other | LS columns (magnetic separation) | Miltenyi Biotec | 130-042-401 | AEC2 purification |
| Other | Extracellular FluxAnalyzer | Agilent | Seahorse XFe96 | |
| Software, algorithm | ImageJ | Wayne Rasband (NIH) | https//github.com/imagej/imagej1 | Johannes, 2021 |
| Software, algorithm | Image Quant | Cytiva | Version TL8.1 | |
| Software, algorithm | FlowJo | Tree Star Inc | ||
| Software, algorithm | Nis Elements | Nikon | Version 5.0 | |
| Sequence-based reagent | Mouse Nox4 forward | IDT | ACT TTT CAT TGG GCG TCC TC | RT-PCR |
| Sequence-based reagent | Mouse Nox4 reverse | IDT | AGA ACT GGG TCC ACA GCA GA | RT-PCR |
| Sequence-based reagent | Mouse β-actin forward | IDT | AGT GTG ACG TTG ACA TCC GT | RT-PCR |
| Sequence-based reagent | Mouse β-actin reverse | IDT | TGC TAG GAG CCA GAG CAG TA | RT-PCR |
Additional files
-
Supplementary file 1
Gene Ontology localizations, processes, and network analyses of mass spectrometry data.
- https://cdn.elifesciences.org/articles/68049/elife-68049-supp1-v1.xlsx
-
Transparent reporting form
- https://cdn.elifesciences.org/articles/68049/elife-68049-transrepform1-v1.docx
Download links
A two-part list of links to download the article, or parts of the article, in various formats.
Downloads (link to download the article as PDF)
Open citations (links to open the citations from this article in various online reference manager services)
Cite this article (links to download the citations from this article in formats compatible with various reference manager tools)
Mesenchymal stromal cell aging impairs the self-organizing capacity of lung alveolar epithelial stem cells
eLife 10:e68049.
https://doi.org/10.7554/eLife.68049


