A role for glial fibrillary acidic protein (GFAP)-expressing cells in the regulation of gonadotropin-releasing hormone (GnRH) but not arcuate kisspeptin neuron output in male mice
- Departments of Molecular & Integrative Physiology, University of Michigan, United States
- Internal Medicine, University of Michigan, United States
- Obstetrics & Gynecology, University of Michigan, United States
- Reproductive Sciences Program, University of Michigan, United States
Figures
Figure 1 with 1 supplement
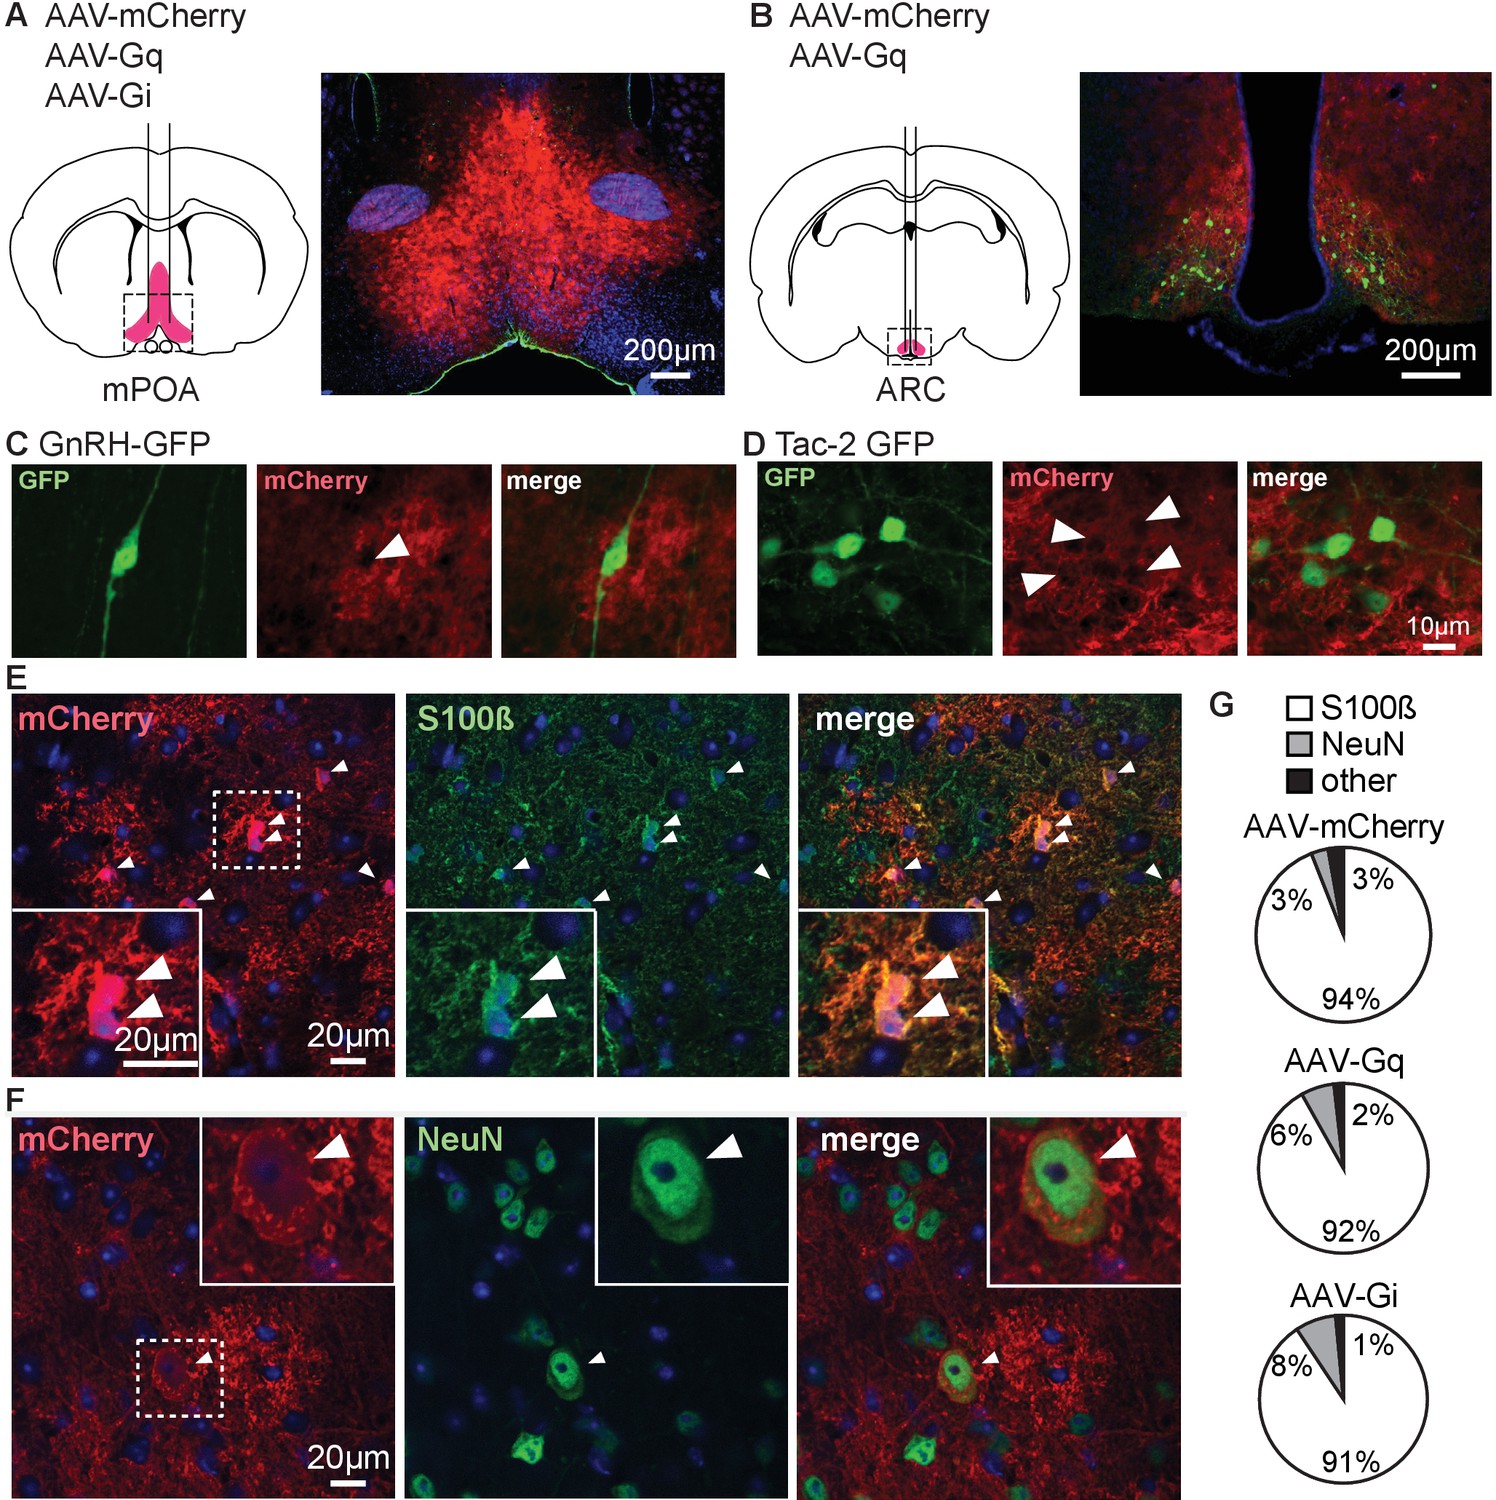
Adeno-associated virus 5 (AAV5) bearing glial fibrillary acidic protein (GFAP) promoter-driven constructs effectively target primarily cells with astroglial phenotype and markers in male mice.
(A,B) Bilateral stereotaxic injection (left) and corresponding infection (right) of the preoptic area (POA) (A) and arcuate nucleus of the hypothalamus (ARC) (B). (C,D) Dual immunofluorescence for green fluorescent protein (GFP) (left) and mCherry (middle) in the POA (C) and ARC (D) reveals GFP-positive neurons surrounded by infected tissue (merge, right). Arrowheads in middle panels of C, D show gaps in mCherry signal where neurons are located; scale bar is the same for (C) and (D). (E) Immunofluorescence for mCherry (left), S100β (middle), and merge (right) showing colocalization of the two signals, white arrowheads identify colocalization between mCherry and S100β staining; dashed box shows area magnified in lower left. (F) Immunofluorescence for mCherry (left), NeuN (middle), and merge (right) showing colocalization of the two signals, white arrowheads identify colocalization between mCherry and NeuN staining; dashed box shows area magnified in upper right. (G) Quantification of infected cells expressing specific markers for each virus type (n=3 mice per group, 5 fields/mouse).
-
Figure 1—source data 1
Data from colocalisation quantification.
- https://cdn.elifesciences.org/articles/68205/elife-68205-fig1-data1-v2.xlsx
Figure 1—figure supplement 1
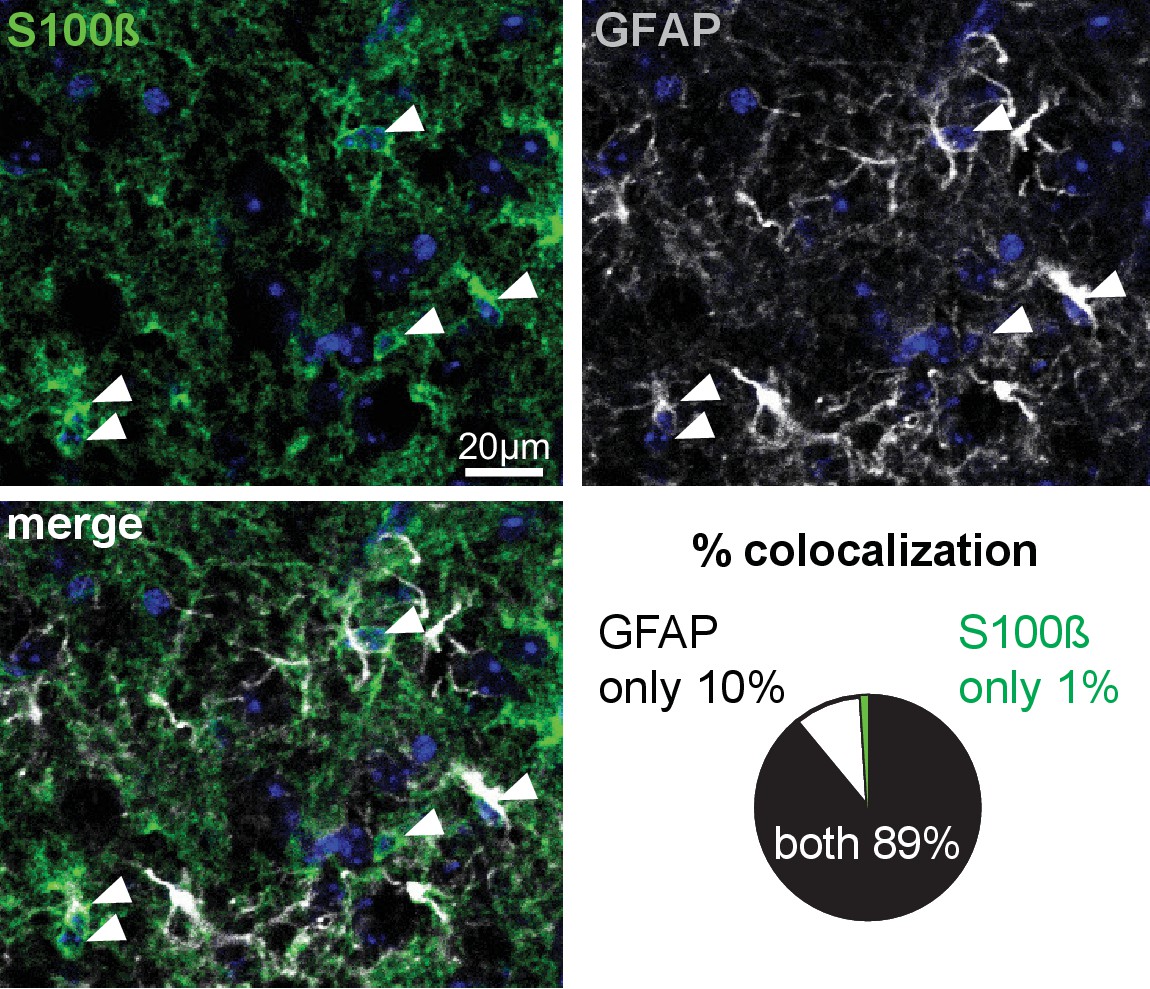
Glial fibrillary acidic protein (GFAP) and S100β signals are coexpressed in the majority of cells from male mice (n=3 mice, 5 fields/mouse).
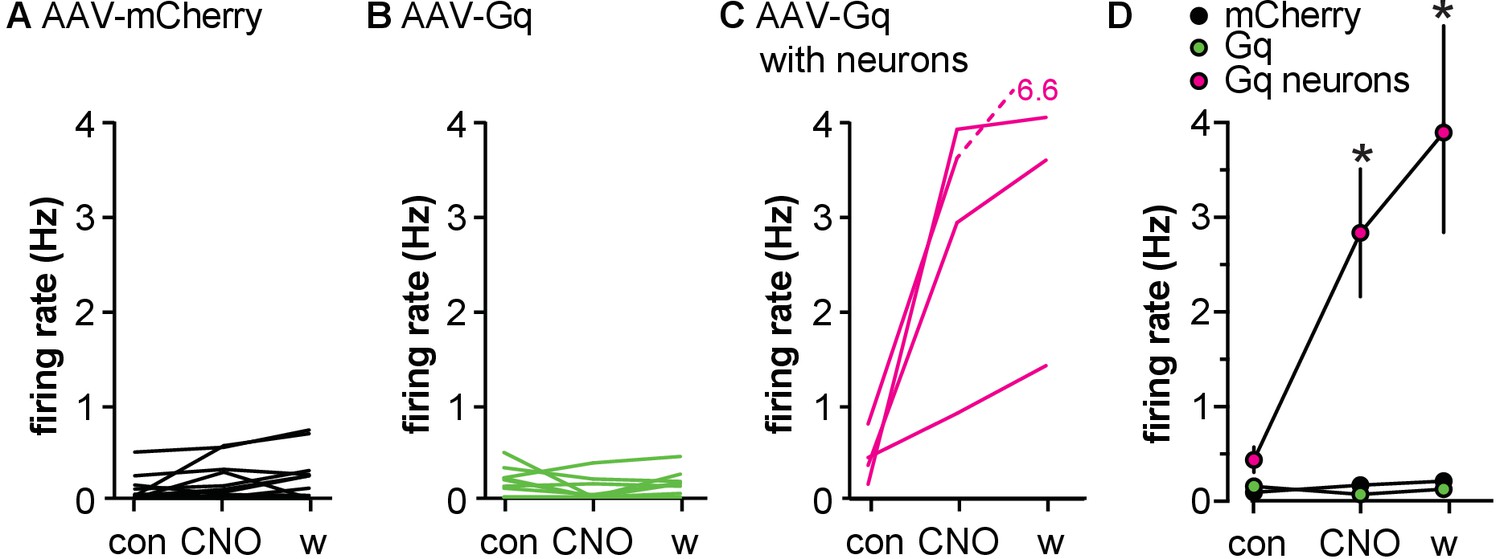
Figure 2 with 1 supplement
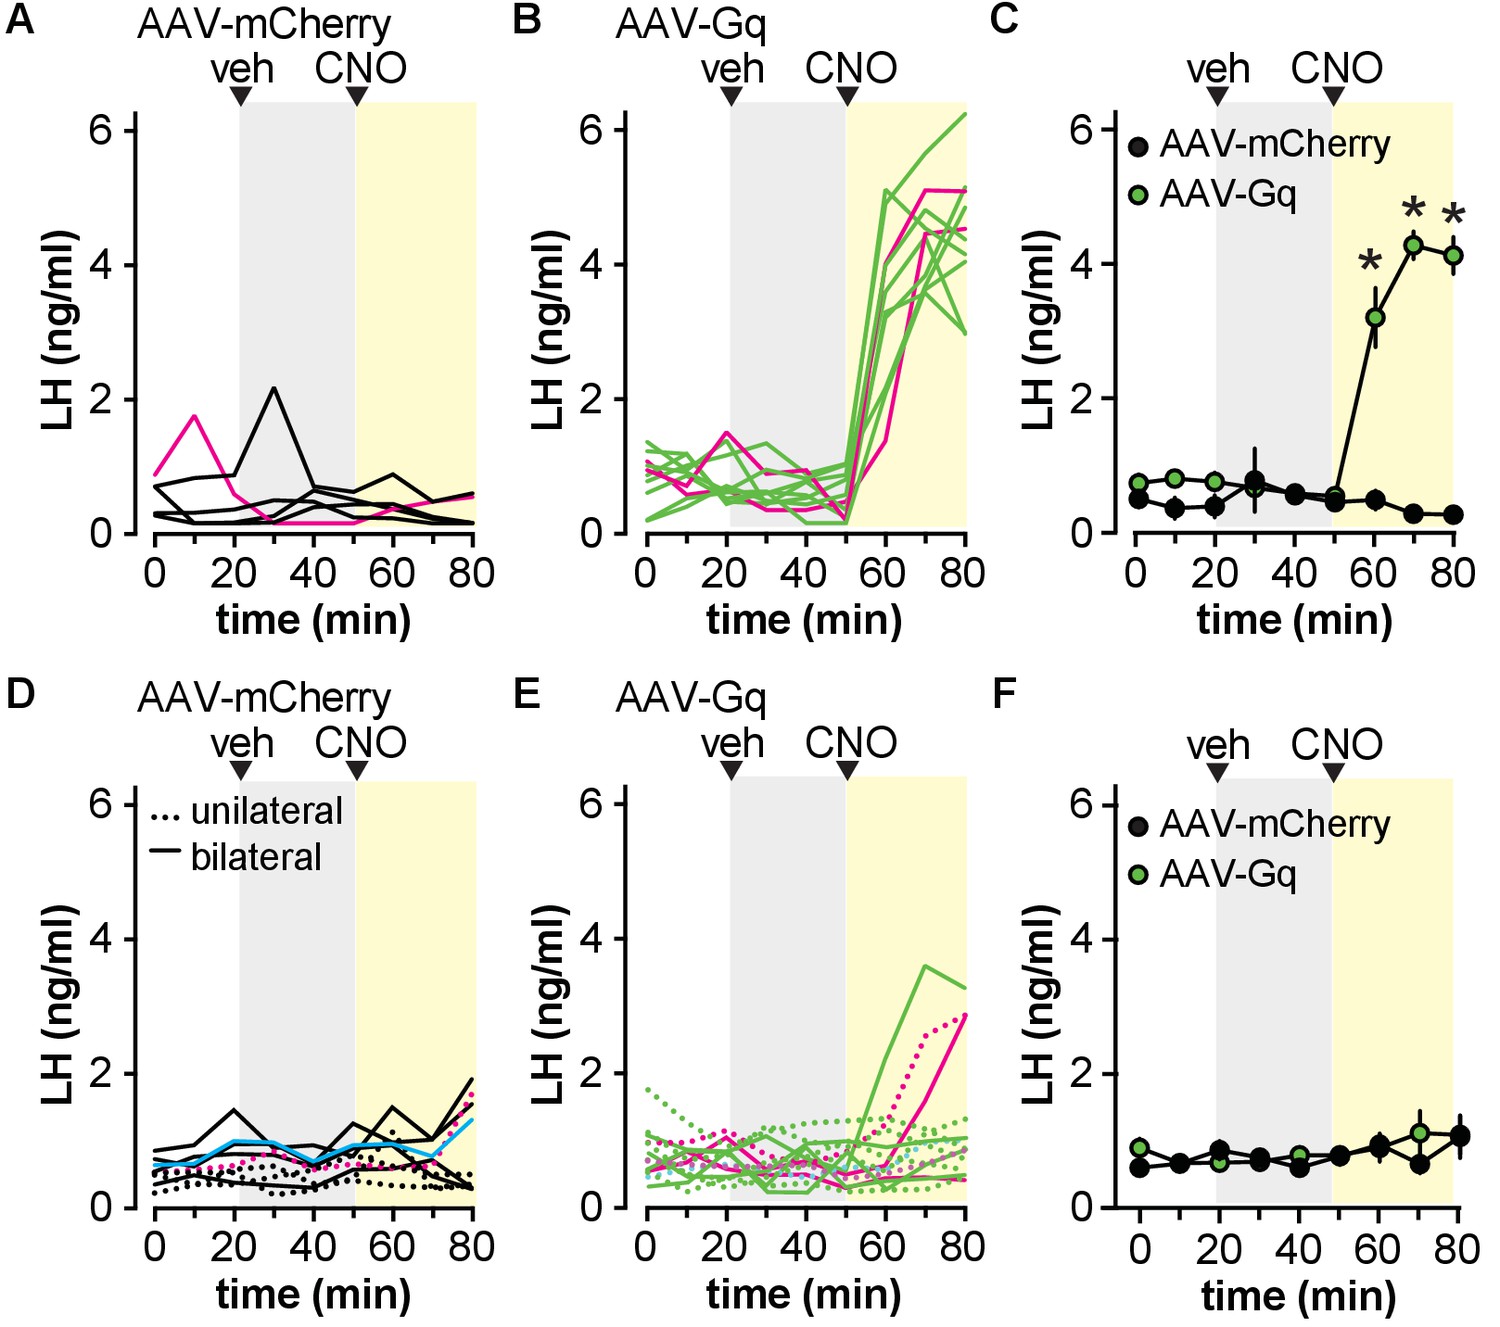
Activation of Gq signaling in glial fibrillary acidic protein (GFAP)-expressing cells in the preoptic area (POA) but not the arcuate nucleus of the hypothalamus (ARC) increases circulating luteinizing hormone (LH) in male mice.
(A,B) LH levels in five mice bilaterally injected in the POA with adeno-associated virus (AAV)-mCherry (A) vs. 10 mice injected with AAV-Gq (B). Magenta lines in A and B show LH in mice rejected based on infection of unidentified neurons. (C) Mean ± SEM LH in mice with no observed neuronal infection *p<0.0001 Bonferroni (n=4–8 mice). (D,E) LH levels in individual mice with unilateral (dashed lines) or bilateral (solid lines) ARC hits in nine mice with AAV-mCherry (D) vs. 14 mice with AAV-Gq (E). Magenta lines in D and E show LH in mice rejected based on infection of unidentified neurons, the cyan line in D indicates a mouse with Tac2 neurons infected. (F) Mean ± SEM LH in mice with no observed neuronal infection (n=6–9 mice). Veh, vehicle.
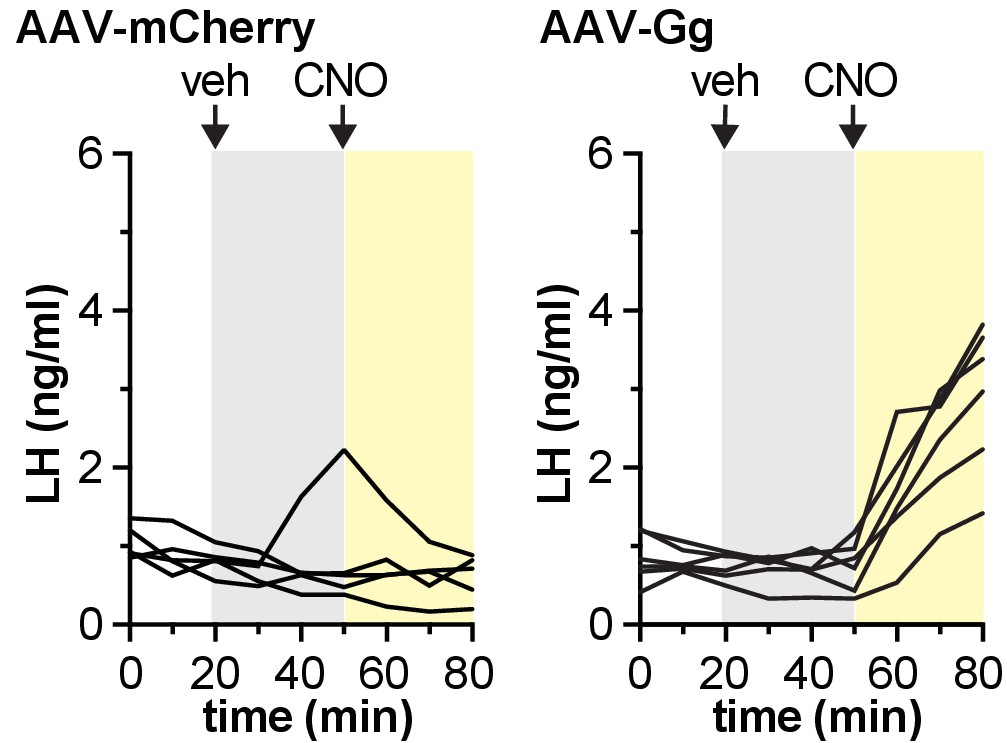
Figure 2—figure supplement 1
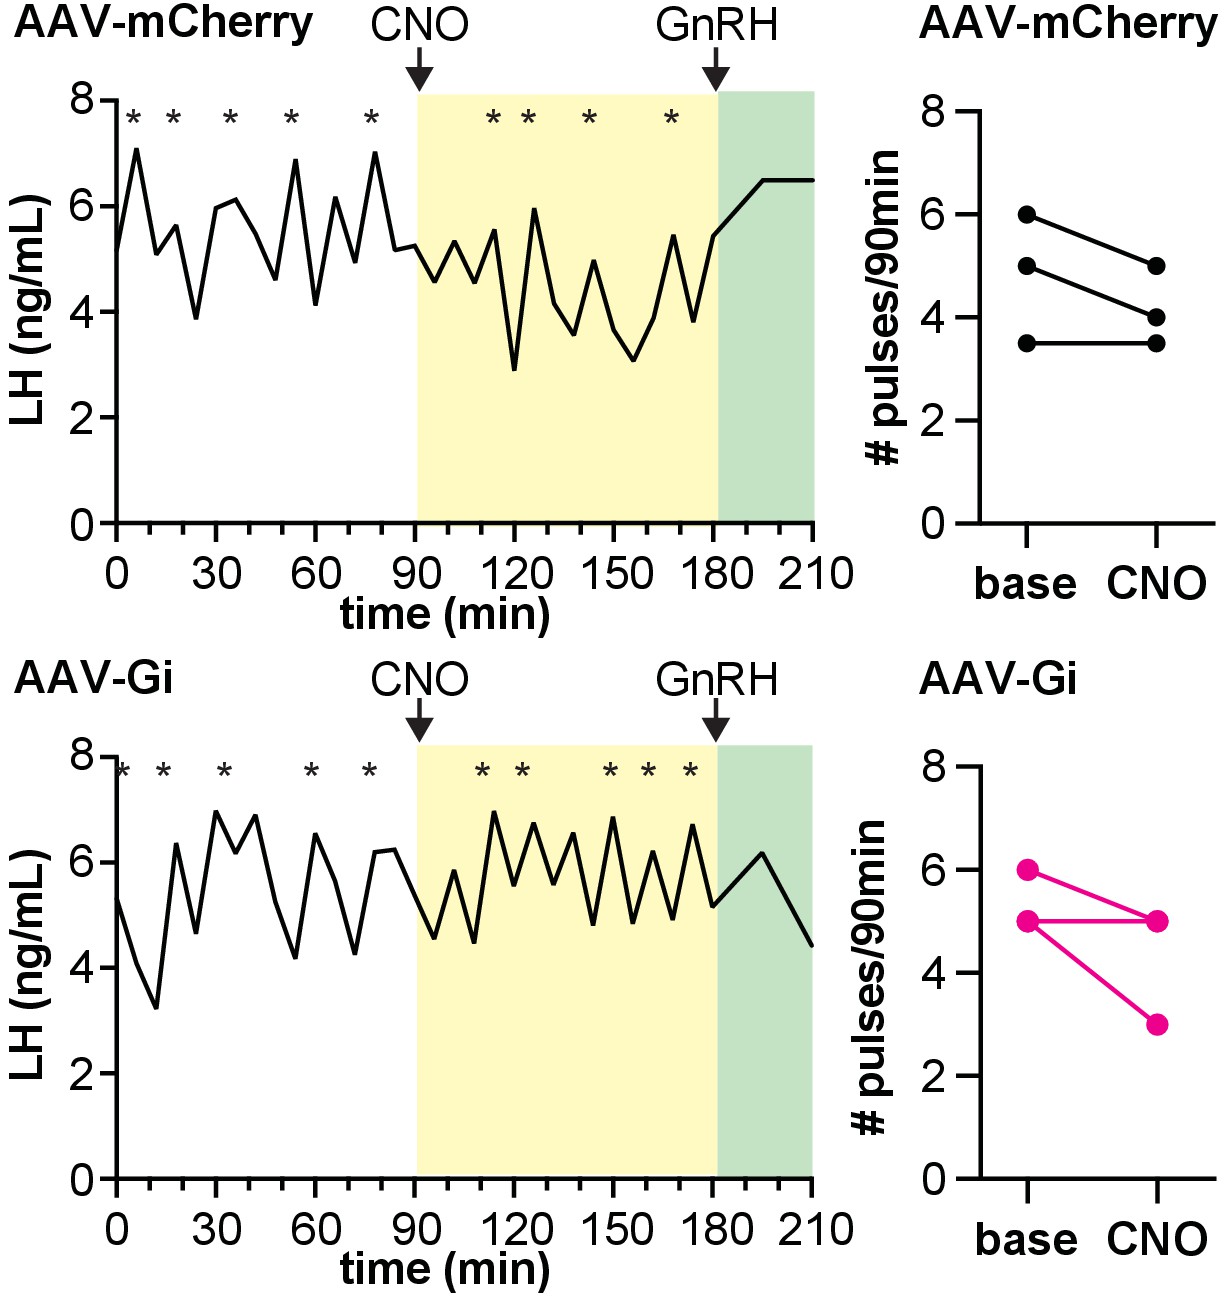
Activating Gi signaling in glial fibrillary acidic protein (GFAP)-expressing cells in the preoptic area (POA) does not affect luteinizing hormone (LH) pulse frequency in male mice in vivo.
Left panels show LH levels measured every 6 min for a duration of 210 min from a male injected in the POA with adeno-associated virus (AAV)-mCherry (top) and AAV-G (bottom). CNO was administered intraperitoneally at 90 min, gonadotropin-releasing hormone (GnRH) was administered at 180 min. Right panels show the number of pulses per 90 min detected during the baseline period (base) and after CNO administration (n=3 mice per group).
Figure 3

Activating Gq signaling in glial fibrillary acidic protein (GFAP)-expressing cells differentially affects gonadotropin-releasing hormone (GnRH) vs. Tac2 neurons in male mice.
(A-C) Top, representative example; bottom, firing rate of individual GnRH-green fluorescent protein (GFP) neurons in mice injected in the preoptic area (POA) with adeno-associated virus (AAV)-mCherry (A, n=12 cells from four mice) or AAV-Gq (B, n=9 from six mice, C, n=8 from six mice). Cells in B were within the mCherry-defined hit, cells in C were outside the hit. Representative raw recording data (60 s each, scale bar in A applies to all raw data) from the time indicated by the lower case a,b,c, are shown at the top of each panel in A-C and also E-F. Yellow indicated time of CNO treatment. (D) Mean ± SEM firing rate during the different periods. *p<0.0001 Bonferroni Gq inside hit vs. Gq outside hit and mCherry (n=8–12). (E-G) Top, representative example; bottom, firing rate of individual Tac2-GFP neurons in mice injected in the ARC with AAV-mCherry (E, n=12 from five mice) or AAV-Gq (F, n=14 from six mice, G, n=4 from two mice). Cells in F were within an ARC hit, cells in G were from mice in which the injection missed the ARC. The two magenta lines in E and F indicate cells in slices with unidentified infected neurons; the single cyan line in E and F indicate cells in slices with Tac2 neurons infected. Data from both magenta and cyan cells were excluded from H, mean ± SEM firing rate, *p=0.0033 Bonferroni AAV-Gq control vs. wash (n=4–11).
Figure 4
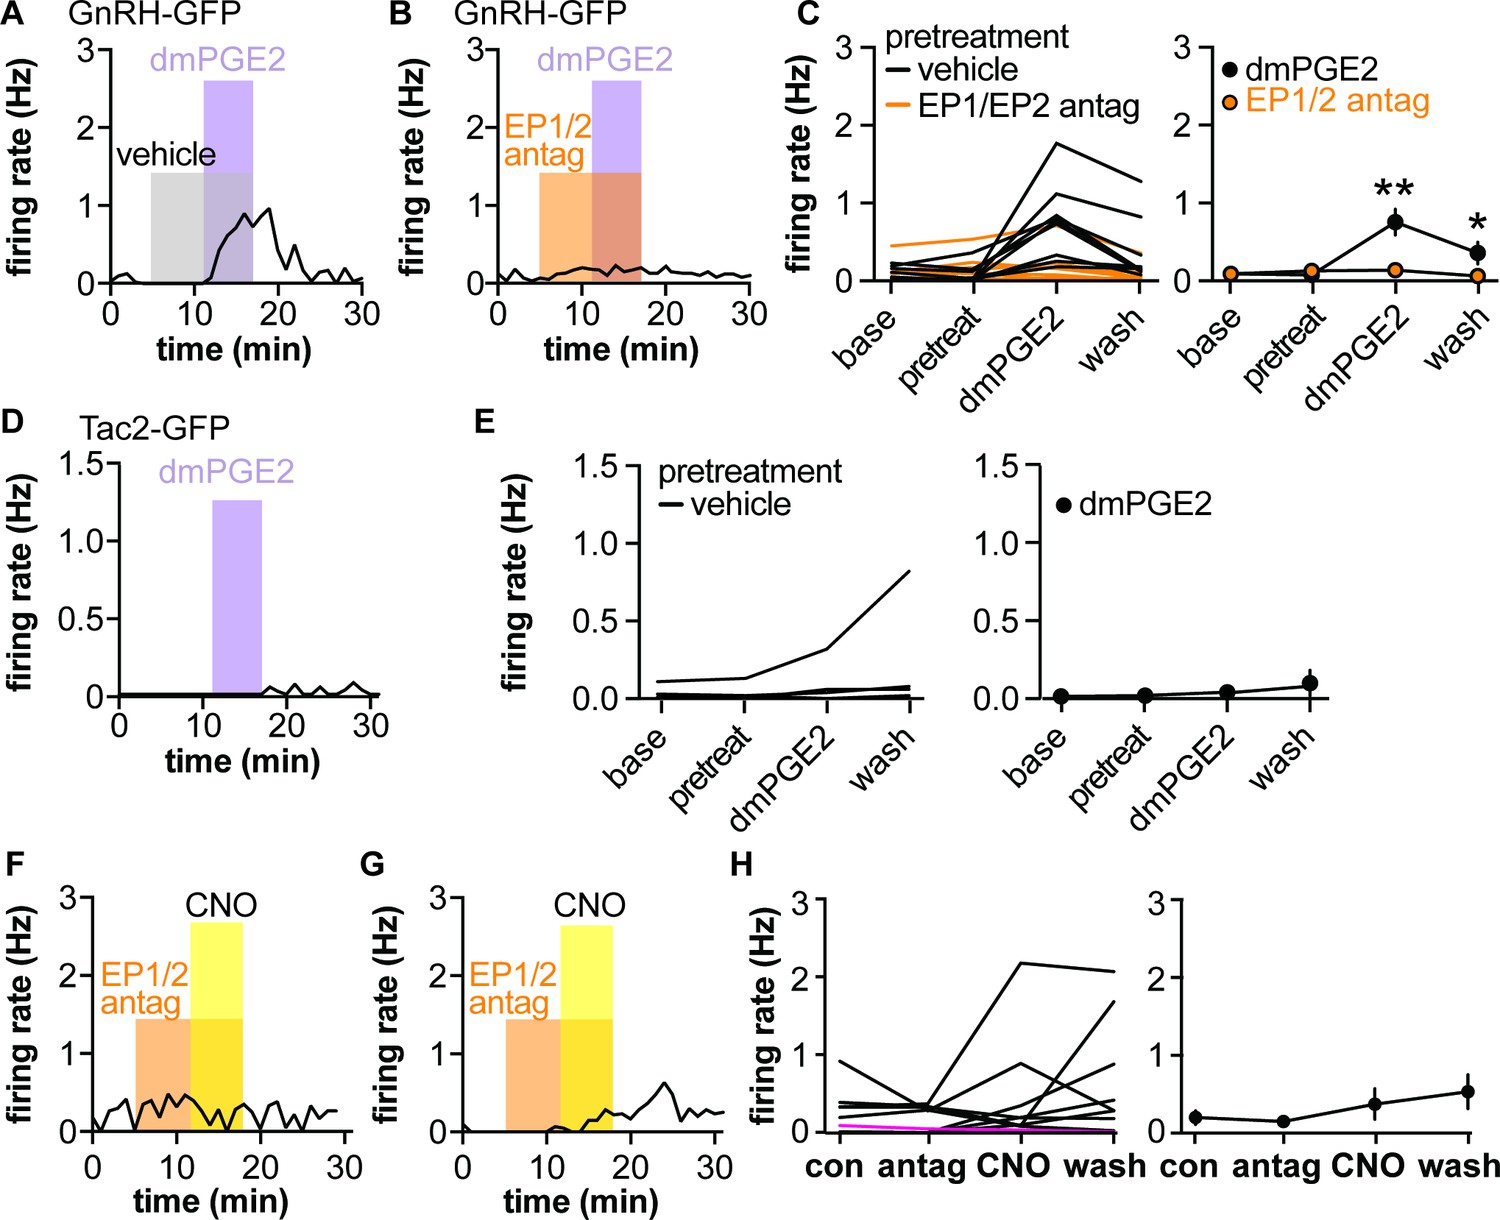
Dimethyl-PGE2 (dmPGE2) increases firing rate of gonadotropin-releasing hormone (GnRH)-green fluorescent protein (GFP) but not Tac2-GFP neurons; pretreatment (pretreat) with EP1/EP2 receptor antagonists blunts CNO-induced GnRH neuron firing in male mice.
(A,B) Representative examples of GnRH neuron firing rate response to dmPGE2 following vehicle pretreatment (A) or EP1/EP2 receptor antagonists (B). (C) Left, mean firing of individual neurons in each period; right, group mean ± SEM, *p<0.05, **p<0.0001, two-way repeated-measure ANOVA/Bonferroni (vehicle n=9 from five mice, EP1/EP2 antag n=10 from five mice). (D) Representative example of Tac2-GFP neuron response to dmPGE2. Note Y-axis is zoomed in compared to A-C. (E) Left, mean firing of individual neurons in each period; right, group mean ± SEM (n=9). (F,G) Representative examples of GnRH neurons from mice injected with AAV-Gq in the POA in which pretreatment with EP1/EP2 receptor antagonists blocked (F) or reduced response (G) to CNO. (H) Left, mean firing of individual neurons in each period, the single magenta line shows a cell in a slice with AAV-Dq infected neurons (n=12 from seven mice), which was omitted from the group mean ± SEM on the right (n=11 from seven mice).
Figure 5 with 1 supplement
Activating Gq signaling in glial fibrillary acidic protein (GFAP)-expressing cells in the preoptic area (POA) does not affect gonadotropin-releasing hormone (GnRH) neuron firing rate in female mice.
(A-C) Firing rate of individual GnRH-green fluorescent protein (GFP) neurons in brain slices from diestrous females injected in the POA with adeno-associated virus (AAV)-mCherry (A, n=12 from five mice) or AAV-Gq (B, n=10 from five mice, C, n=4 from two mice); slices in C had viral infection of cells with neuronal morphology. Green symbols and lines show data in AAV-Gq infected slices without detected contamination by neuronal infection; magenta symbols and lines show data in slices with Gq-infected neurons. (D) Mean ± SEM firing rate during the three periods, *p<0.0001 Bonferroni for cells in slices with Gq-infected neurons vs. the other groups (n=4–12).
Figure 5—figure supplement 1
Activation of Gq signaling in glial fibrillary acidic protein (GFAP)-expressing cells in the preoptic area (POA) of female mice increases circulating luteinizing hormone (LH) in vivo, but there are caveats associated with infection of cells with neuronal morphology.
LH levels in individual mice bilaterally injected in the POA with adeno-associated virus (AAV)-mCherry (left, n=5) and AAV-Gq (right, n=6).
Tables
Table 1
Mouse strains and viruses used.
| Full name | Referred to in text as | Reference | Supplier catalog # | RRID | |
|---|---|---|---|---|---|
| Mouse | B6;CBATg(Gnrh1-EGFP)51Sumo/J | GnRH-GFP | Suter et al., 2000 | JAX 033639 | IMSR_JAX:033639 |
| Mouse | Tg [Tac2-EGFP]381Gsat | Tac2-GFP | Ruka et al., 2013 | MMRRC; 015495-UCD/STOCK | MMRRC_015495-UCD |
| AAV | AAV5-GFAP-hM3Dq(Gq)-mCherry | AAV-Gq | Erickson et al., 2021 | Addgene; 50478-AAV5 | Addgene_50478 |
| AAV | AAV5-GFAP-hM4Di(Gi)-mCherry | AAV-Gi | This paper | Addgene; 50479-AAV5 | Addgene_50479 |
| AAV | AAV5-GFAP104-mCherry | AAV-mCherry | This paper | Addgene; 58909-AAV5 | Addgene_58909 |
Table 2
Antibodies used.
| Antibody | Species | Dilution/use | Reference | Supplier catalog # | RRID |
|---|---|---|---|---|---|
| Anti-GFAP | Rabbit | 1:10,000 | Buckmaster et al., 2017 | Agilent DAKO z0334 | RRID:AB_10013382 |
| Anti-S100β | Mouse | 1:500 | Nishiyama et al., 2002 | Sigma S2532 | RRID:AB_477499 |
| Anti-mCherry | Rat | 1:3000 | Zhang et al., 2016 | Thermo Fisher Scientific M11217 | RRID:AB_2536611 |
| Anti-NeuN | Rabbit | 1:3000 | Li et al., 2016 | Abcam ab177487 | RRID:AB_2532109 |
| Anti-GFP | Chicken | 1:1000 | Kerman et al., 2006 | Abcam ab13970 | RRID:AB_300798 |
| Anti-bovine LHβ 518B7 | LH assay capture | Steyn et al., 2013 | Janet Roser, UC Davis | RRID:AB_2665514 | |
| AFP240580Rb | Rabbit | LH assay detection | Steyn et al., 2013 | National Hormone and Peptide Program | RRID:AB_2665533 |
| Goat anti-rabbit HRP | Goat | LH assay enzyme conjugated | Steyn et al., 2013 | Dako D048701-2 |
Table 3
Statistical parameters for effects of CNO on neuronal firing rate (Figure 3), p-values <0.05 are in bold.
| GnRH-GFP neurons | F | p | ||
|---|---|---|---|---|
| AAV-mCherry vs. AAV-Gq inside hit vs. AAV-Gq outside hit | (2,26)=4.013 | 0.0303 | ||
| Control vs. CNO vs. wash | (2,52)=7.711 | 0.0012 | ||
| Interaction | (4,52)=8.590 | <0.0001 | ||
| Bonferroni | Con vs. CNO | Con vs. wash | CNO vs. wash | |
| AAV-mCherry | >0.9999 | >0.9999 | >0.9999 | |
| AAV-Gq in hit | <0.0001 | <0.0001 | 0.8009 | |
| AAV-Gq outside hit | >0.9999 | 0>0.9999 | >0.9999 | |
| Tac2-GFP neurons | F | p | ||
| AAV-mCherry vs. AAV-Gq inside hit vs. AAV-Gq outside hit | (2,21)=0,2496 | 0.7814 | ||
| Control vs. CNO vs. wash | (2,42)=6.751 | 0.0029 | ||
| Interaction | (4,42)=1.641 | 0.1819 | ||
| Bonferroni | Con vs. CNO | Con vs. wash | CNO vs. wash | |
| AAV-mCherry | >0.9999 | >0.9999 | >0.9999 | |
| AAV-Gq hit | 0.7680 | 0.0033 | 0.0707 | |
| AAV-Gq miss | 0.1342 | 0.0626 | >0.9999 |
Table 4
Statistical parameters for effects of dimethyl-PGE2 (dmPGE2), EP1 and EP2 receptor blockers and CNO on gonadotropin-releasing hormone (GnRH)-green fluorescent protein (GFP) neuron firing rate (Figure 4), p-values <0.05 are in bold font.
| GnRH-GFP neurons | F | p | ||
|---|---|---|---|---|
| Vehicle vs. EP1/EP2 antagonist pretreatment | F(1,17) | 0.0229 | ||
| Time (baseline vs. pretreatment vs. dmPGE2 vs wash) | F(3,51) | <0.0001 | ||
| Interaction | (3,51)=11 | <0.0001 | ||
| Bonferroni | Baseline vs. pretreatment | Baseline vs. dmPGE2 | Baseline vs. wash | |
| Vehicle | >0.9999 | <0.0001 | 0.0407 | |
| EP1/EP2 antagonists | >0.9999 | >0.9999 | >0.9999 |
Table 5
Statistical parameters for effects of CNO on gonadotropin-releasing hormone (GnRH)-green fluorescent protein (GFP) neuron firing rate in diestrous females (Figure 5), p-values <0.05 are in bold font.
| GnRH-GFP neurons | F | p | ||
|---|---|---|---|---|
| AAV-mCherry vs. AAV-Gq vs. AAV-Gq in neurons | (2,23)=45.50 | <0.0001 | ||
| Control vs. CNO vs. wash | (2,46)=45.50 | <0.0001 | ||
| Interaction | (4,46)=30.11 | <0.0001 | ||
| Bonferroni | Con vs. CNO | Con vs. wash | CNO vs. wash | |
| AAV-mCherry | >0.9999 | >0.9999 | >0.9999 | |
| AAV-Gq | >0.9999 | >0.9999 | >0.9999 | |
| AAV-Gq with infected neurons | <0.0001 | <0.0001 | 0.0023 |
Additional files
-
Source data 1
Firing data for all recorded cells.
- https://cdn.elifesciences.org/articles/68205/elife-68205-data1-v2.xlsx
-
Transparent reporting form
- https://cdn.elifesciences.org/articles/68205/elife-68205-transrepform-v2.pdf
Download links
A two-part list of links to download the article, or parts of the article, in various formats.
Downloads (link to download the article as PDF)
Open citations (links to open the citations from this article in various online reference manager services)
Cite this article (links to download the citations from this article in formats compatible with various reference manager tools)
A role for glial fibrillary acidic protein (GFAP)-expressing cells in the regulation of gonadotropin-releasing hormone (GnRH) but not arcuate kisspeptin neuron output in male mice
eLife 10:e68205.
https://doi.org/10.7554/eLife.68205


