The landscape of regulatory genes in brain-wide neuronal phenotypes of a vertebrate brain
- Institute of Neuroscience, State Key Laboratory of Neuroscience, Center for Excellence in Brain Science and Intelligence Technology, Chinese Academy of Sciences, China
- University of Chinese Academy of Sciences, China
- Shanghai Center for Brain Science and Brain-Inspired Intelligence Technology, China
- School of Future Technology, University of Chinese Academy of Sciences, China
Figures
Figure 1 with 2 supplements
Molecular classification of whole-brain cells in larval zebrafish.
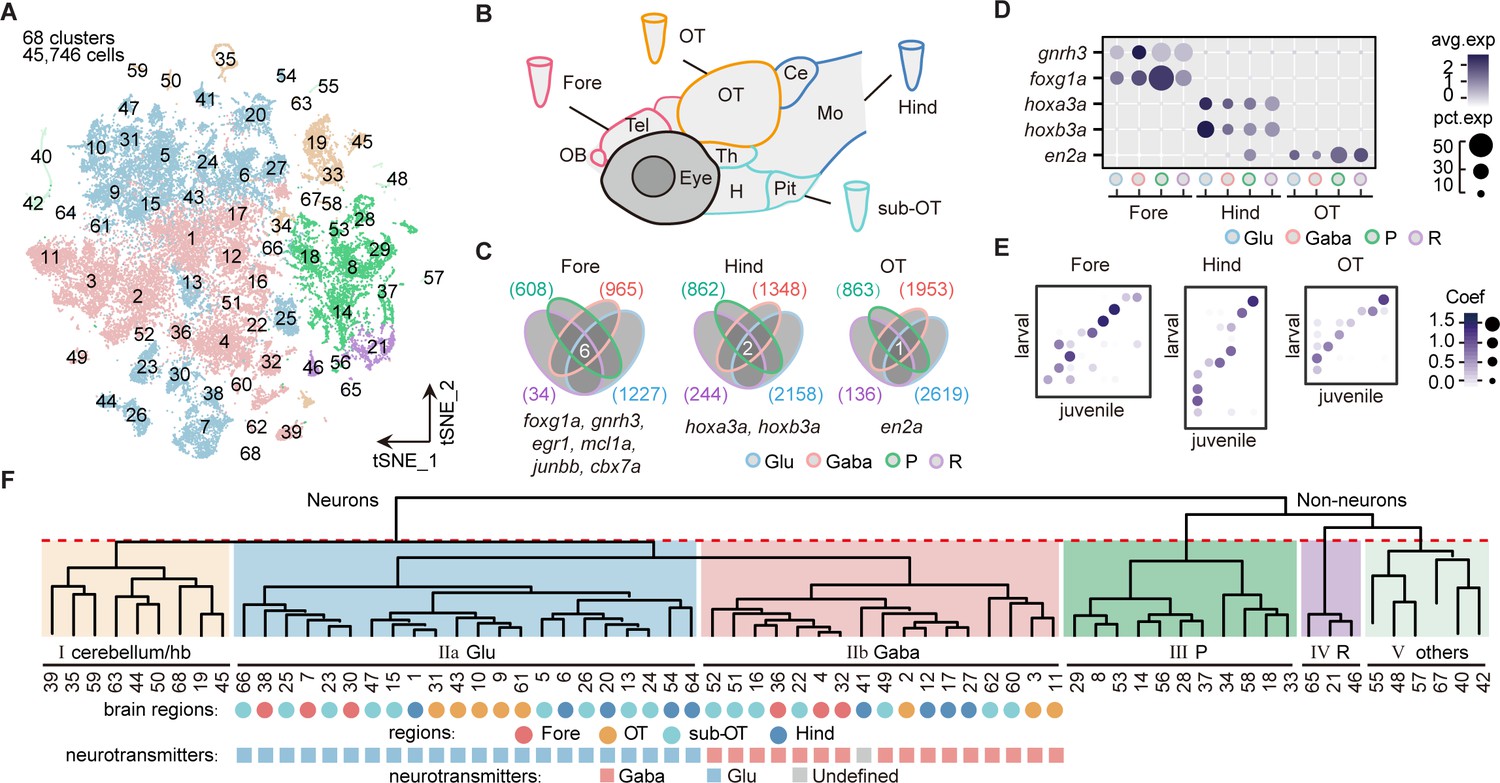
(A) The t-distributed stochastic neighbor embedding (t-SNE) plot of 45,746 single-cell transcriptomes pooled from whole brains (n = 4) and four different individual brain regions (n = 2 each). The pooled cells were aggregated into 68 clusters, marked by a number. Each color-coded the major cell type as F. (B) The schematic showing different samples separately examined by single-cell RNA-sequencing on 10× Genomics Drop-seq platform: whole brain (n = 4), forebrain (Fore, n = 2), optic tectum (OT, n = 2), hindbrain (Hind, n = 2), and the region underneath the optic tectum (sub-OT, n = 2). OB: olfactory bulb; Tel: telencephalon; OT: optic tectum; Th: thalamus; H: hypothalamus; Pit: pituitary; Ce: cerebellum; MO: medulla oblongata. (C) Venn plots showing the differentially expressed genes in four major cell types identified by cell-type marker genes (vglut+, glutamatergic neurons, Glu; gad1b+, GABAergic neurons, Gaba; pcna+, neuroprogenitors, P; cx43+, radial astrocytes, R) in three brain regions (Fore, Hind, and OT). Commonly expressed genes in all cell types for a given brain region were identified as region-specific genes: six for forebrain (Fore), one for optic tectum (OT), and one for hindbrain (Hind), with genes listed below. (D) Dot plot showing the expression levels of region-specific marker genes in four major cell types (colored circles as C) in three brain regions. The gray level represents the average expression; dot size represents the percentage of cells expressing the marker genes. (E) Lawson-Hanson algorithm for non-negative least squares (NNLS) analysis showed cell clusters of Fore, OT, and Hind exhibited a high correlation with their counterparts of the juvenile zebrafish. Degree of correlation in marker genes is coded by the gray level and size of circle. (F) The dendrogram for the taxonomy of 68 identified clusters based on effector gene profiles (n = 1099). Main branches of neuronal and non-neuronal cells were classified into six branches (red dashed line) that include: I, cerebellum and habenula (hb); IIa, glutamatergic neurons (Glu); IIb, inhibitory neurons (Gaba); III, neuroprogenitors (P); IV, radial astrocytes (R); V, others, including microglia, endothelial cells, and oligodendrocytes. The colored dots and squares below indicate their regional origins and neurotransmitter-type, respectively.
-
Figure 1—source data 1
Bioinformatics processing of raw reads of single-cell samples.
- https://cdn.elifesciences.org/articles/68224/elife-68224-fig1-data1-v3.xlsx
-
Figure 1—source data 2
The annotation of 68 clusters of whole-brain sample.
- https://cdn.elifesciences.org/articles/68224/elife-68224-fig1-data2-v3.xlsx
-
Figure 1—source data 3
The regional origins and neurotransmitter-type annotation of each whole-brain cluster with well-known markers.
- https://cdn.elifesciences.org/articles/68224/elife-68224-fig1-data3-v3.xlsx
-
Figure 1—source data 4
Top 20 marker genes of whole-brain larval zebrafish 68 clusters.
- https://cdn.elifesciences.org/articles/68224/elife-68224-fig1-data4-v3.xlsx
-
Figure 1—source data 5
Marker genes of major six cell type in whole brain.
- https://cdn.elifesciences.org/articles/68224/elife-68224-fig1-data5-v3.xlsx
Figure 1—figure supplement 1
Molecular classification of whole-brain cells in larval zebrafish brain.
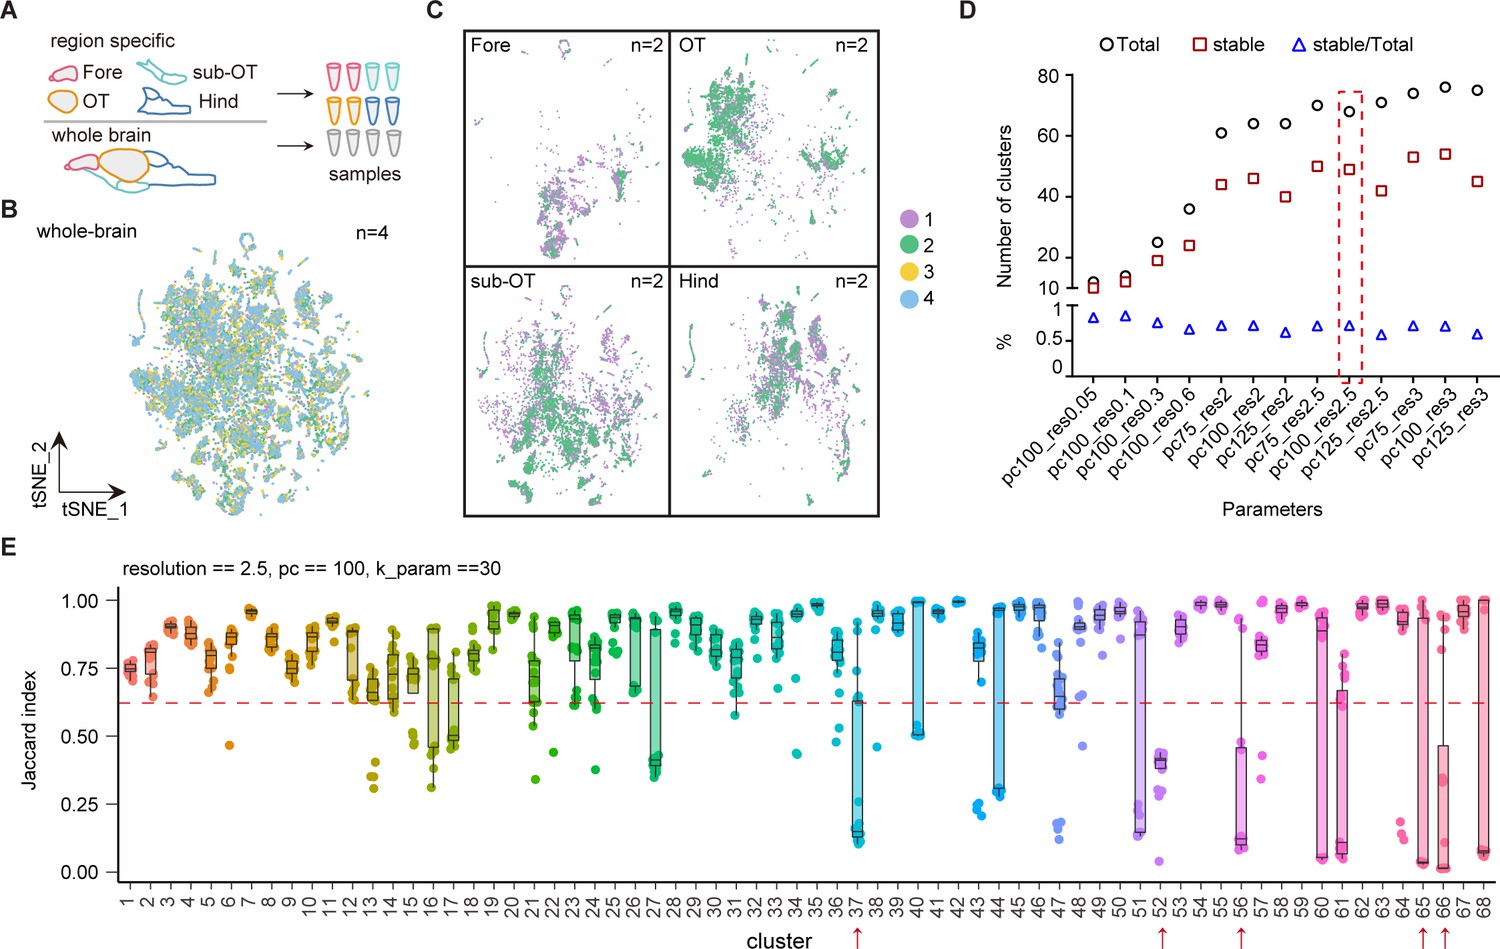
(A) The schematic showing each samples of whole brain and different brain regions. (B) t-Distributed stochastic neighbor embedding (t-SNE) plot of pooled single-cell transcriptome data from whole-brain samples (n = 4). Four whole-brain replicates were largely overlapping in the plot. Numbers of repeats are color-coded. (C) t-SNE plots of pooled single-cell transcriptome data from four different brain region (n = 2, each). Two replicates from forebrain (Fore), optic tectum (OT), hindbrain (Hind), and the region underneath the optic tectum (sub-OT) were largely overlapping in the plots. Different replicates were coded by different colors shown on the right. (D) The plot showing the number of total clusters, stable clusters, and the ratio of stable/total using different parameters to subsamples and re-clustering using R package ‘scclusteval’. (E) The JaccardRainCloundPlot gives an intuitive sense of the stability of clusters (with 0.6 cutoffs) with 68 whole-brain clusters in Figure 1A. Red line indicated the 0.6 cutoff of Jaccard index to evaluate the cluster stability. Red arrowhead indicated unstable clusters.
Figure 1—figure supplement 2
Molecular classification of whole-brain cells in larval zebrafish brain.
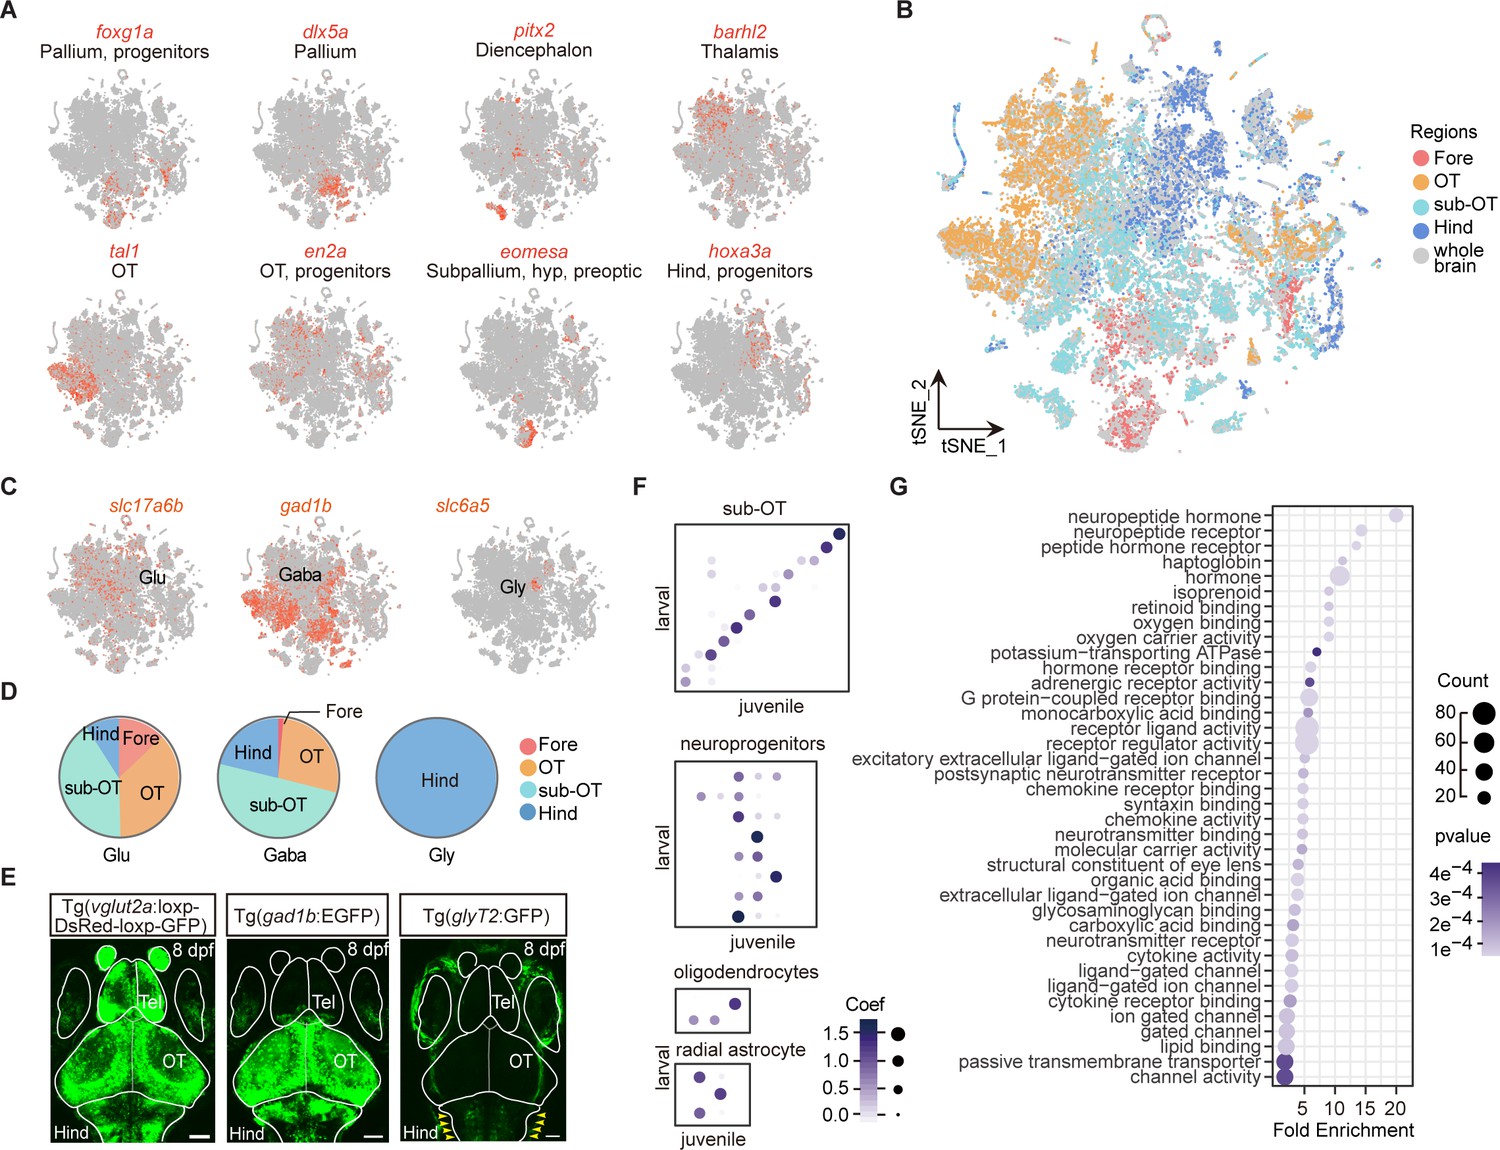
(A) t-Distributed stochastic neighbor embedding (t-SNE) plots showing the expression (in red) of specific markers (eomesa, foxg1a, dlx5a, pitx2 as markers for the forebrain; tal1, en2a as markers for the optic tectum; phox2a, and hoxa3a as makers for the hindbrain). (B) The 68 clusters obtained in Figure 1A were further marked by their regional origins in colors. (C) The t-SNE plots of glutamatergic marker vesicular glutamate transporter 2a (vglut2a, shown as slc17a6b), GABAergic marker gad1b, and glycinergic maker glycine transporter 2 (glyT2, shown as slc6a5). (D) Pie charts showing the compositions of glutamatergic, GABAergic, and glycinergic neurons in four different brain regions: forebrain (Fore), optic tectum (OT), and the region underneath the optic tectum (sub-OT) and hindbrain (Hind) (colored dots). (E) Representative images showing whole-brain maps of three major neuronal types using transgenic fishlines with specific labeling of neurons expressing different neurotransmitters. Glutamatergic neurons: Tg (vglut2a:loxp-DsRed-loxp-GFP); GABAergic neurons: Tg (gad1b:EGFP); glycinergic neurons: Tg (glyT2:GFP). Solid lines marked the boundaries between brain regions. Tel, telencephalon. Scale bars: 100 μm. Red arrowhead indicated the signal of glyT2+ neurons which were enriched in the hindbrain. (F) The NNLS (Lawson-Hanson algorithm for non-negative least squares) analysis using cluster-specific marker genes (top 20) showed that cell clusters of the sub-OT and non-neuronal type exhibit a high correlation with their counterparts of the juvenile zebrafish brain previously reported, with the degree of correlation in marker genes coded by the gray level and size of circle. (G) Gene Ontology (GO) analysis of 1402 variable genes in Figure 1A. Here, we shown the effector genes related to different molecular function. Dots represent term enrichment, degrees of enrichments are color-coded, and sizes of dots represent the percentage of each enrichment category.
Figure 2 with 1 supplement
Molecular classification of neuromodulator-type neurons.
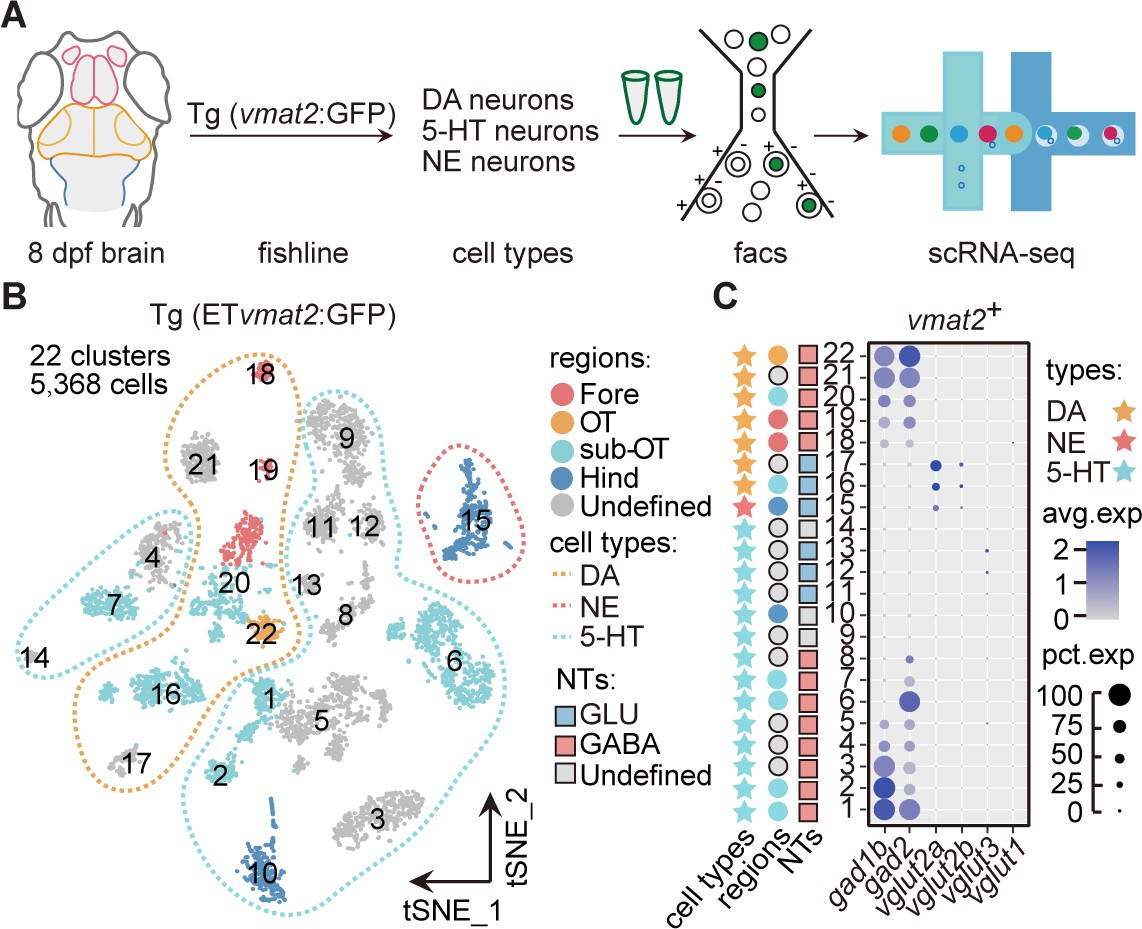
(A) The schematic showing the procedure of collecting single-cell transcriptomes of neuromodulator neurons with fluorescence-activated cell sorting (FACS). Using Tg (ETvmat2:GFP) fishline, we could isolate dopaminergic (DA), serotonergic (5-HT), and norepinephrinergic (NE) neurons. (B) The t-distributed stochastic neighbor embedding (t-SNE) plot of 5368 cells obtained from Tg (ETvmat2:GFP) fishline expressing monoaminergic neuromodulators, showing 22 clusters, each marked by a number, color-coding brain regions and cell type of each cluster. (C) Dot plot showing the expression of glutamatergic marker (vglut2a/vglut2b/vglu1/vglu3) and GABAergic marker (gad1b/gad2) in each of the 22 vmat2+ clusters in B. The neurotransmitter phenotypes were color-coded. Empty squares depict the ones with undefined neurotransmitter phenotypes. The average expression levels of these genes for all cells in each cluster were coded by the gray level. The percentage of cells expressing each gene within each cluster was coded by dot size.
-
Figure 2—source data 1
The annotation of neuromodulator-type neuronal types with well-known markers.
- https://cdn.elifesciences.org/articles/68224/elife-68224-fig2-data1-v3.xlsx
Figure 2—figure supplement 1
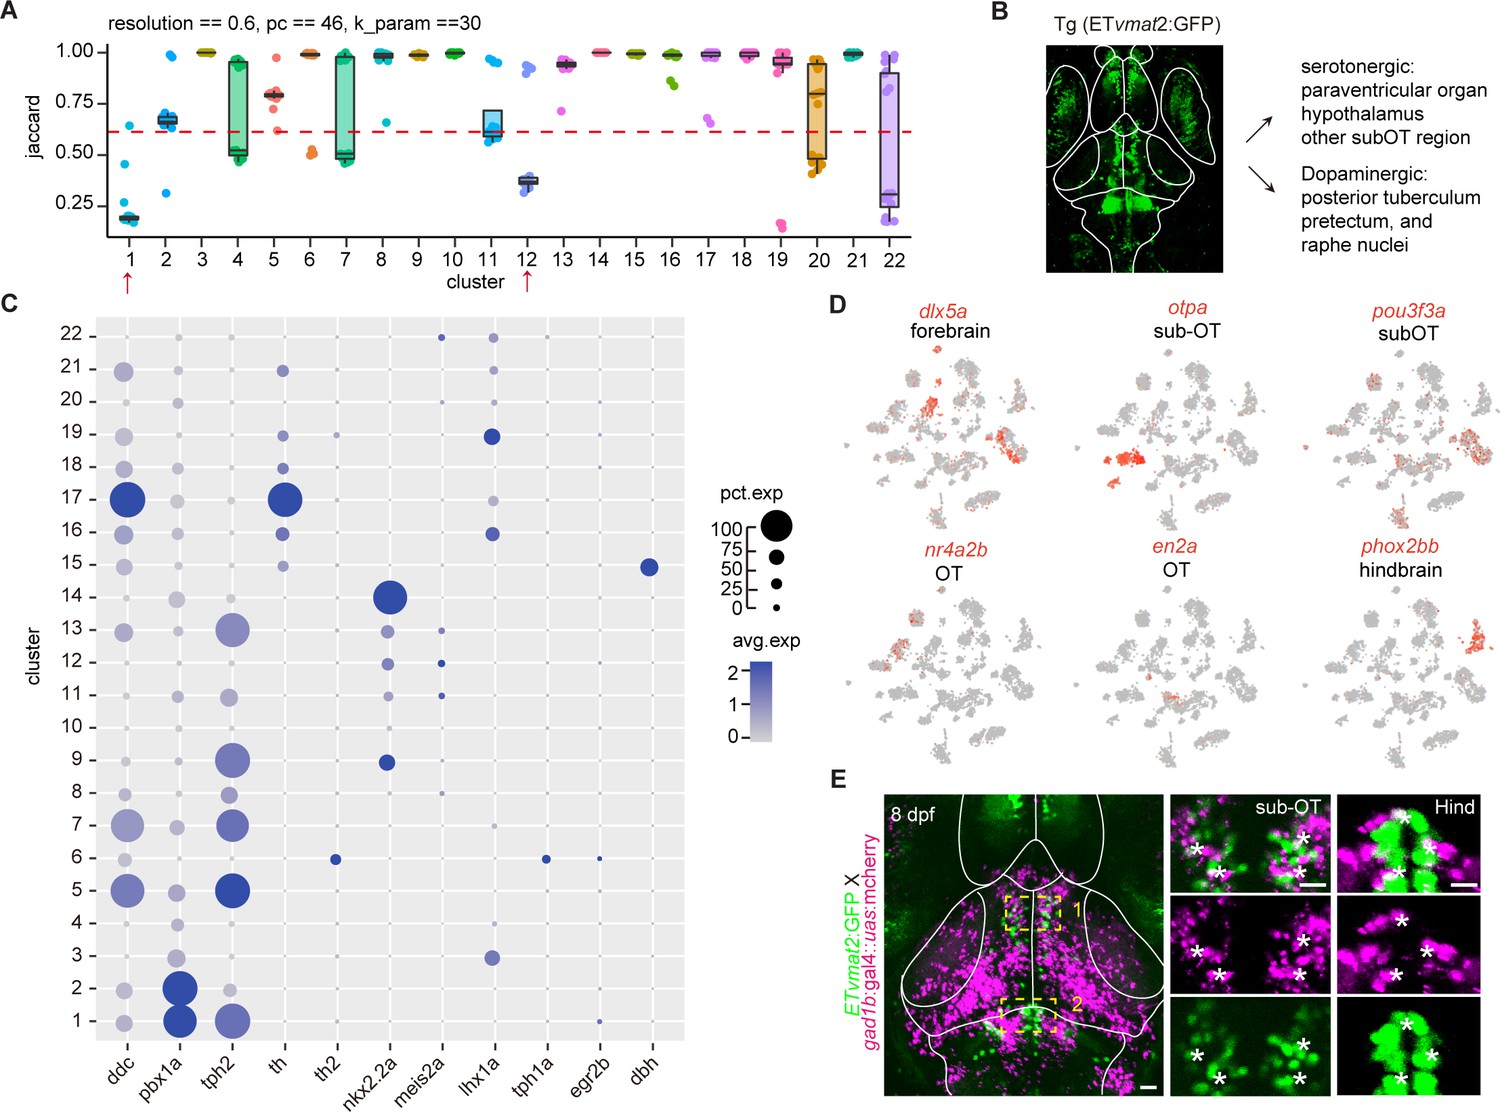
Molecular classification of neuromodulator neurons.
(A) The JaccardRainCloundPlot showing the stability of vmat2+ neuromodulator clusters in Figure 2B. Red line indicated the 0.6 cutoff of Jaccard index to evaluate the cluster stability. Red arrowhead indicated unstable clusters. (B) Representative image of fishline Tg (ETvmat2:GFP). The fishline labeled different monoaminergic neuronal types. Scale bars: 100 μm. (C) Dot plot showing the cell-type-specific markers of 22 vmat2+ neuromodulator clusters, with the average level of their expressions in all cells of each cluster was color-coded, percentage of gene expression was indicated by dot size. (D) t-Distributed stochastic neighbor embedding (tSNE) plots showing the expression of different brain region-specific markers (dlx5a, otpa, nr4a2b, en2a) in 22 vmat2+ neuromodulator clusters. (E) Representative confocal images of 8 dpf Tg (ETvmat2:GFP) and Tg (gad1b:gal4::uas:mcherry) zebrafish. Scale bars: 100 μm. Right: magnified images showing localization of vmat2 and gad1b in hindbrain (Hind), and the regions underneath the optic tectum (sub-OT). Scale bars: 20 μm.
Figure 3 with 4 supplements
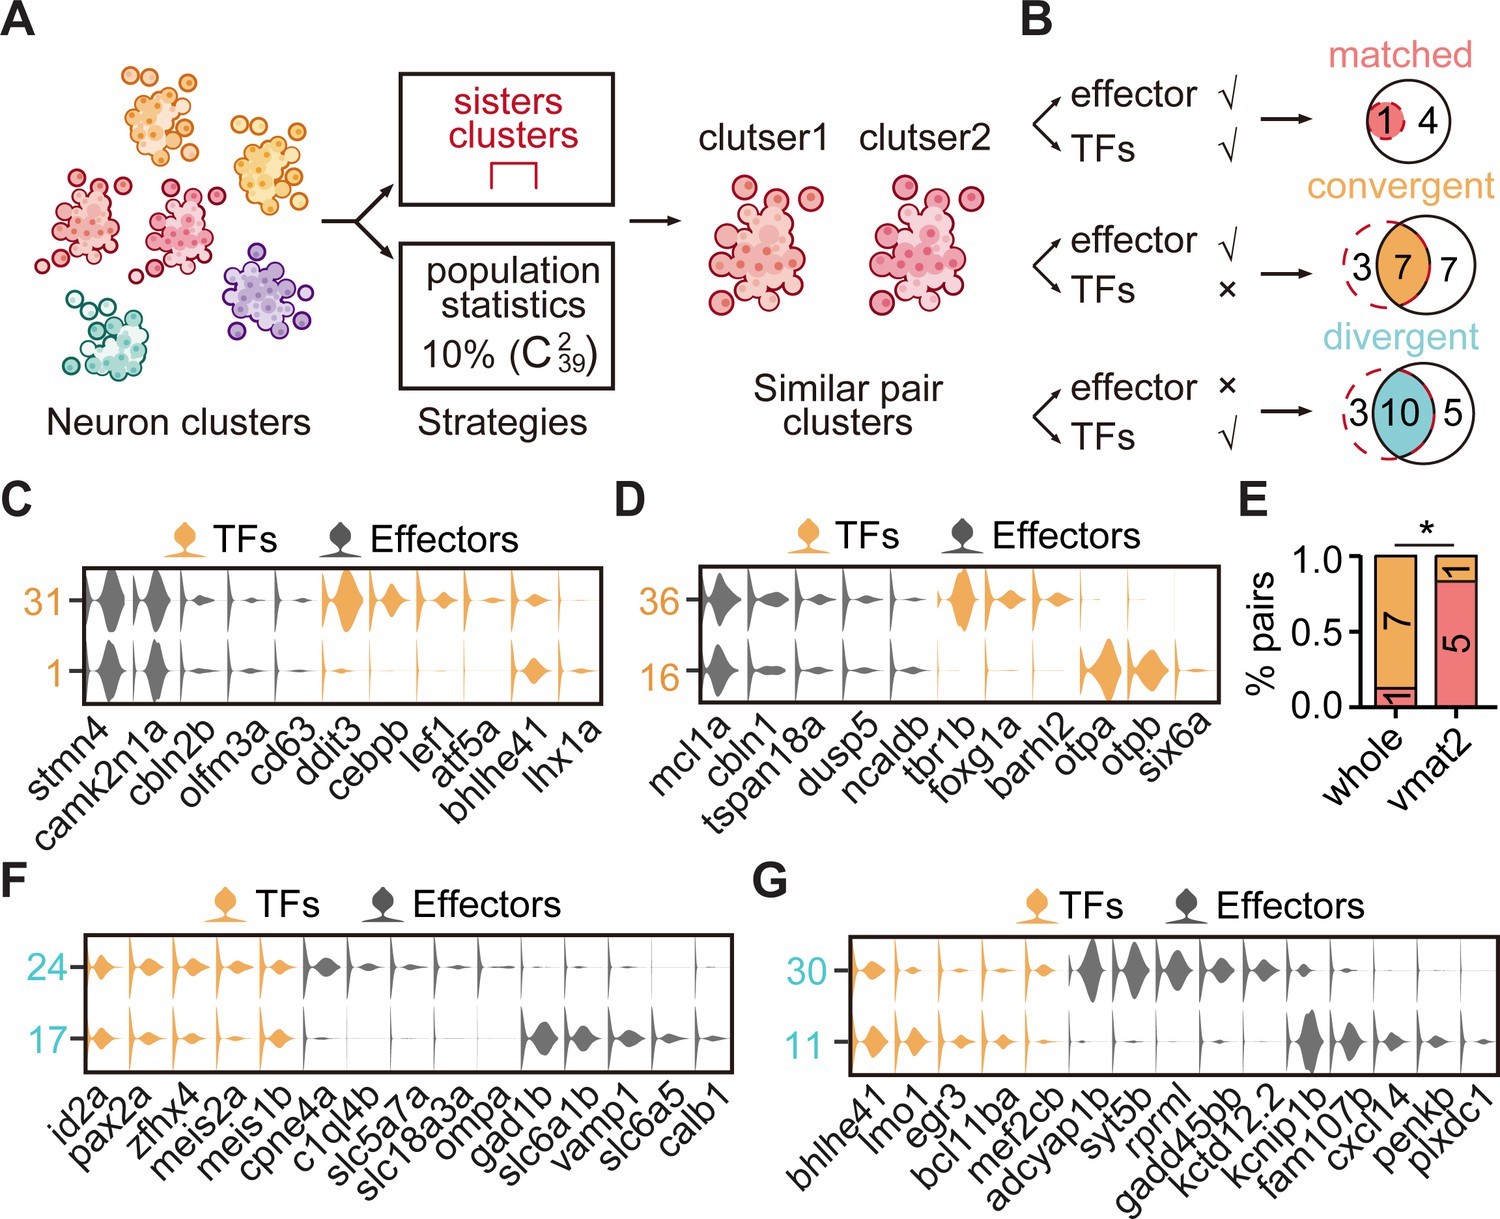
The transcription factor (TF) regulatory landscape in whole-brain neuronal clusters.
(A) Schematic showing the strategies to assess the cluster similarity based on effector gene and TF profiles. We focused on clusters of whole-brain glutamatergic/GABAergic neurons and neuromodulator neurons. Similar pair clusters were identified by two strategies: the first strategy was based on hierarchical sister clusters. The second strategy was based on population-level statistical analysis, in which we calculated and ranked the distances of every two clusters from 39 neurotransmitter-type clusters () and chose the ones with the lowest 10% distance as similar pair clusters. (B) Left: schematic showing the criteria of three patterns: pair clusters that were similar in both TF and effector gene profiles as ‘matched pattern’, those pair clusters that were similar in effector gene profiles but not in TF profiles as ‘convergent pattern’, and those pair clusters that were similar in TF profiles but not in effector gene profiles as ‘divergent pattern’. Right: the plot showing the number of each pattern using two strategies in A. The red dashed circle showing the number of cluster pairs with given pattern based on hierarchical sister cluster analysis; the black solid circle showing the number of cluster pairs with given pattern based on population-level statistical analysis. (C–D) Violin plots showing the expression of TFs (yellow) or effector genes (black) in glutamatergic and GABAergic similar pair clusters of convergent pattern. (E) The bar plot showing the proportions of different patterns for neuronal clusters with neurotransmitter or neuromodulator types. The numbers of each pattern were indicated. Fisher′s exact test was used to test the significant association of different patterns, p = 0.02564, *p < 0.05. (F–G) Violin plots showing the expression of TF profiles (yellow) or effector gene profiles (black) in neuronal clusters of divergent pattern.
Figure 3—figure supplement 1
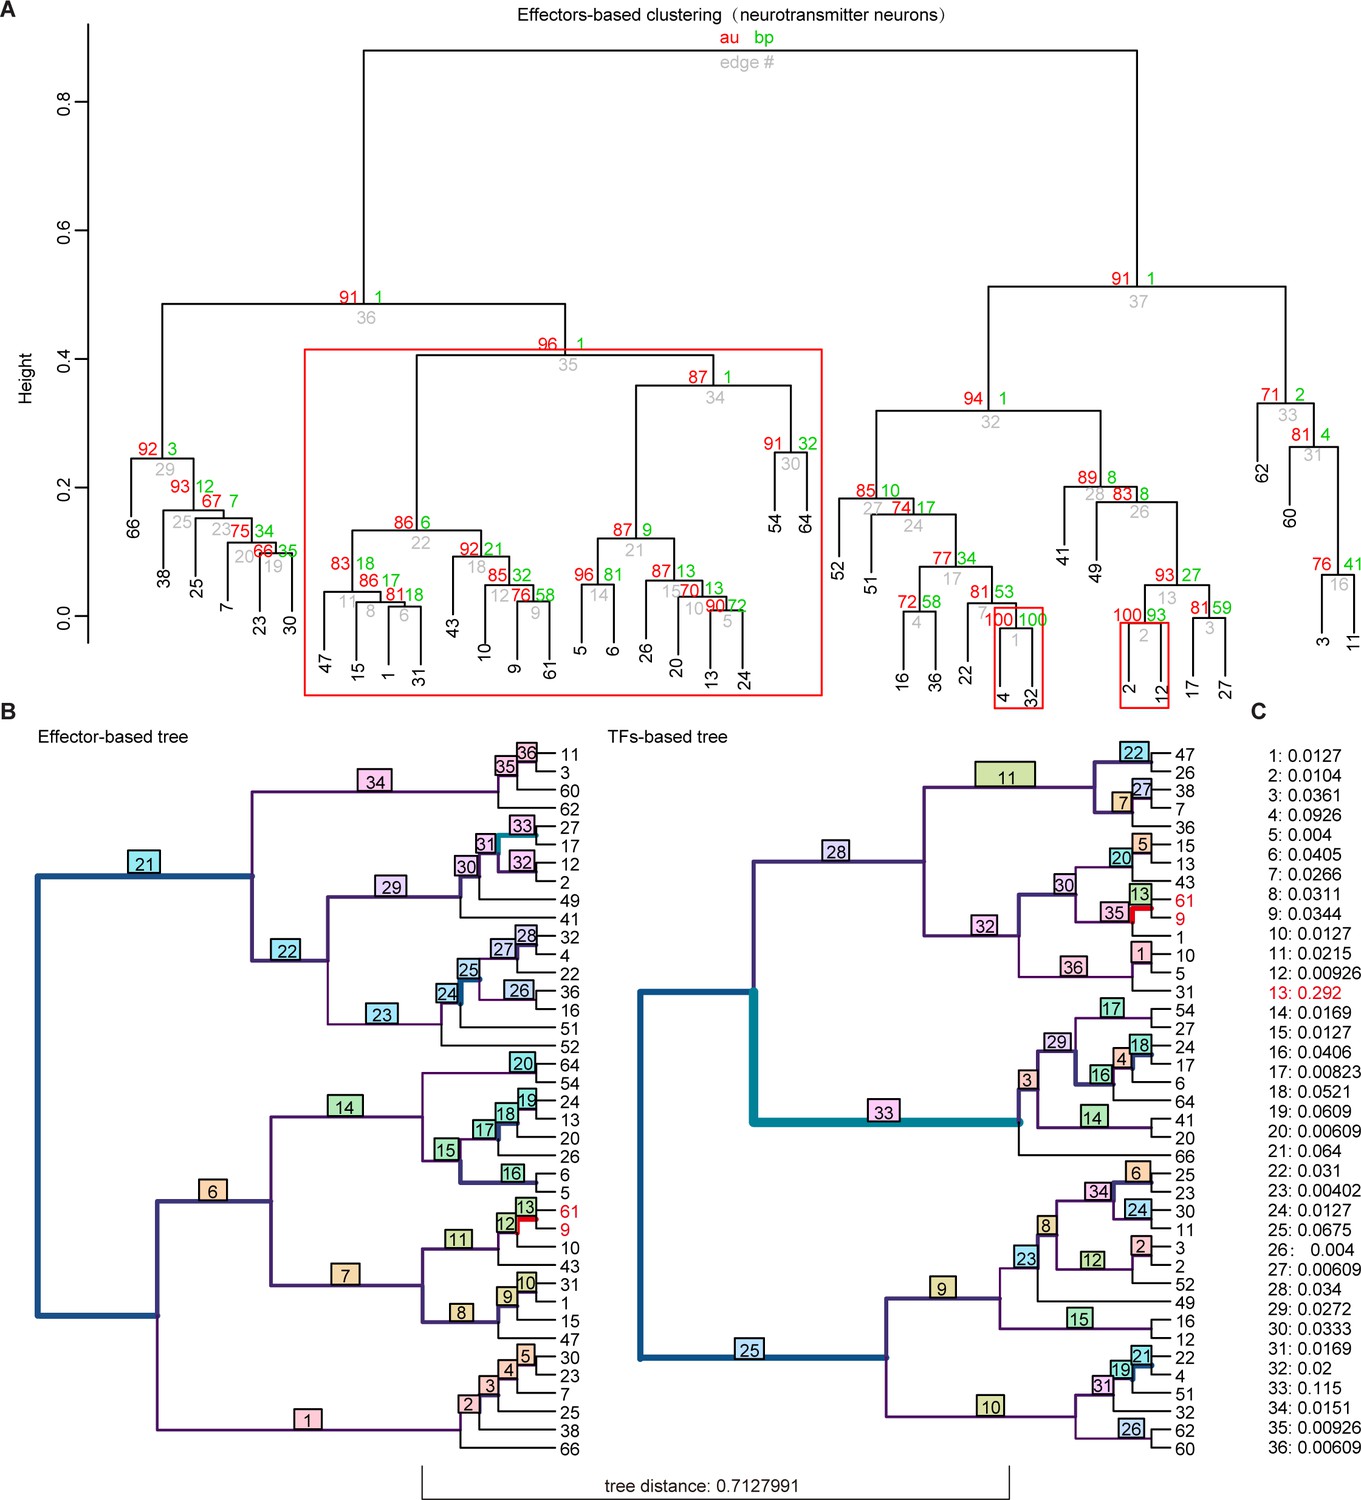
Hierarchical clustering analysis of whole-brain glutamatergic/GABAegric neurotransmitter-type neurons based on effector gene and transcription factor (TF) profiles.
(A) Hierarchical clustering of 39 glutamatergic/GABAegric neurotransmitter-type neurons based on 1099 effector gene profiles in highly variable genes. Red boxes were highlighted to indicate the terminus sister clusters strongly supported by pvclust (AU > 0.95, p < 0.05). (B) Visualizing the matching nodes between TF-based tree and effector gene-based tree with R package ‘TreeDist’. Red line indicated the matching node (node 13, Clusters 9 and 61). Each split was labeled with a measure of similarity score. Bottom tree distance (0.7127991) indicated the different organization of TF-based and effector-based tree. (C) Similarity score of each split in (B).
Figure 3—figure supplement 2
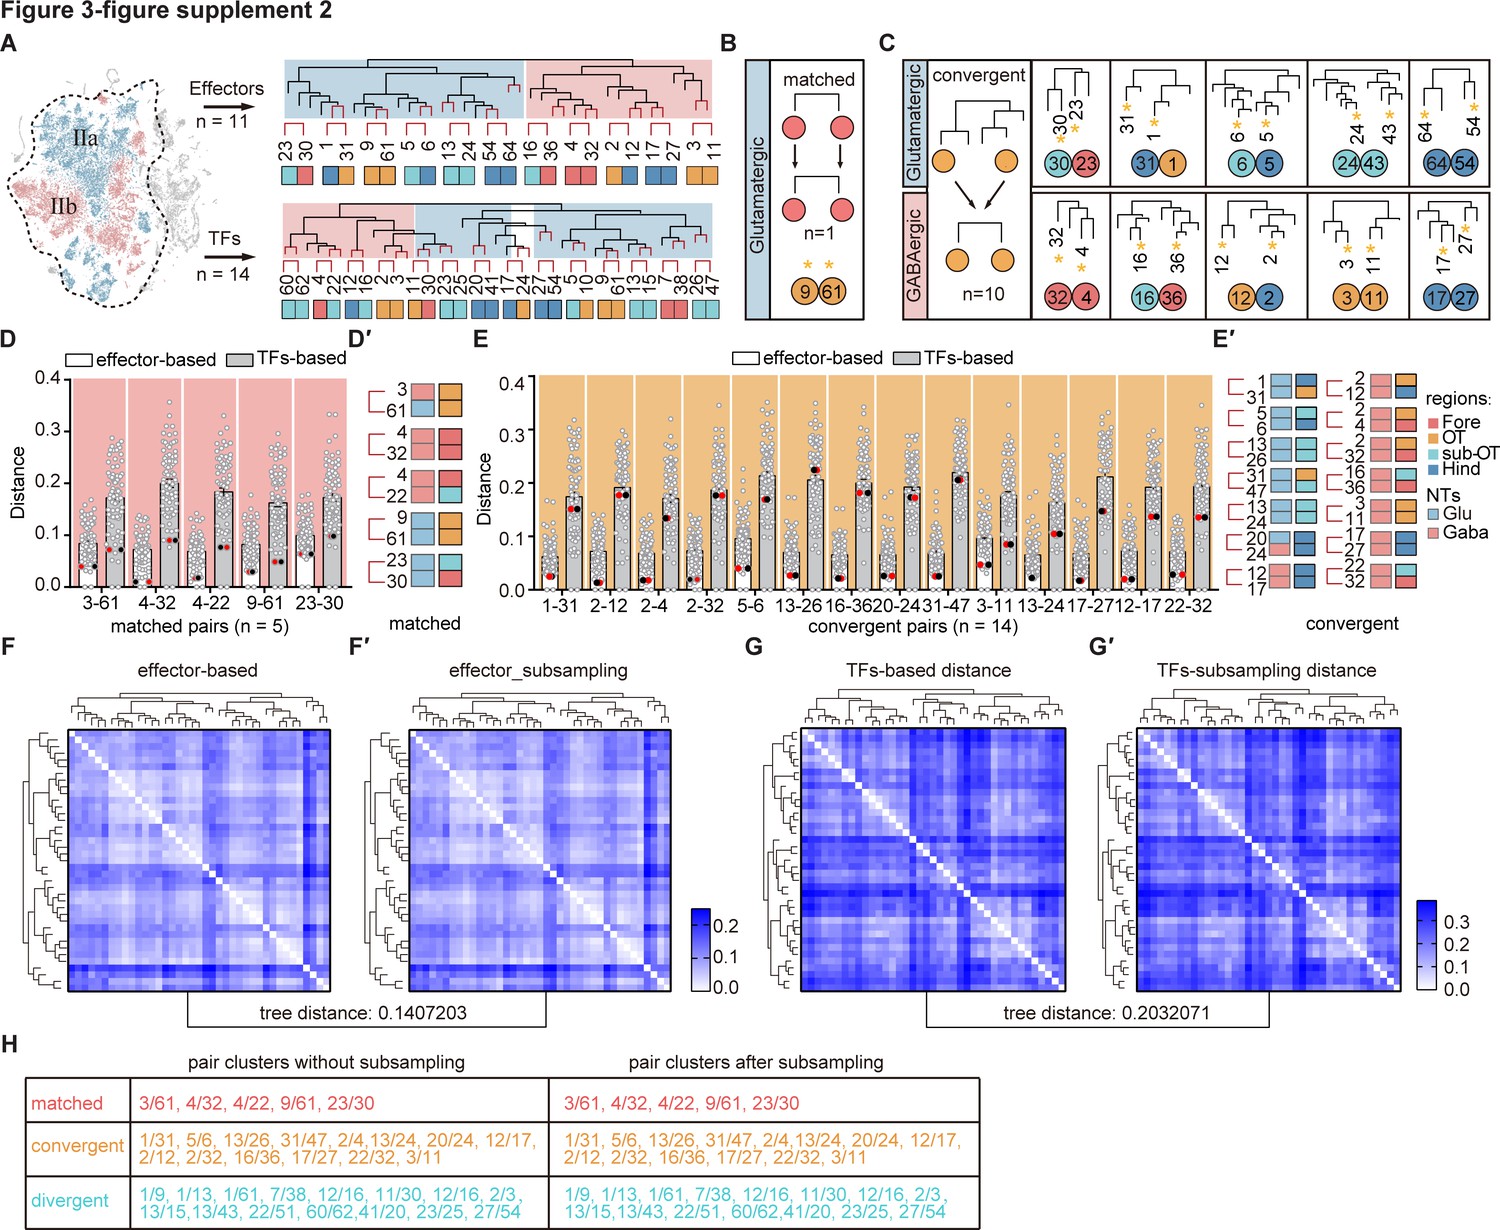
The transcription factor (TF) regulatory landscape in whole-brain glutamatergic/GABAergic neuronal clusters.
(A) Schematic showing the sister clusters identification based on hierarchical clustering of 39 whole-brain glutamatergic/GABAergic neurotransmitter neuronal clusters (IIa: glutamatergic neurons and IIb: GABAergic neurons, in blue and red region of t-distributed stochastic neighbor embedding [t-SNE] plot, respectively). Upper hierarchical clustering was based on 1099 effector genes, red lines indicated 11 terminus sister pairs. The bottom hierarchical clustering was based on 283 TFs, red lines indicated 14 terminus sister pairs. (B) A schematic for matched pattern (left) and a summary table (right) showing that neuronal clusters at similar termini of TF-based hierarchy were matched as sister cluster pairs within effector gene-based hierarchy (n = 1). (C) A schematic for convergent pattern (left) and a summary table (right) showing that glutamatergic/GABAergic neuromodulator-type neuronal clusters at different termini of TF-based hierarchy were found as sister cluster pairs within effector gene-based hierarchy (n = 10). (D) Scatter plot showing the distance distribution of glutamatergic/GABAergic neurotransmitter-type neuronal clusters with matched pattern (shown below) according to the effector-based (white) and TFs-based (gray) distance. Distance defined as (1 − (Pearson correlation coefficient between clusters))/2. Red and black dots showed the distance of each pair clusters. In matched patter, the red and black dots were the lowest distance in both effector gene-based (white) and TF-based (gray) distances. (E) The table showing the brain regions and neurotransmitter type of each pair clusters with matched pattern (n = 5). Regional origins and neurotransmitter type are color-coded. (F) Scatter plot showing the distance distribution of glutamatergic/GABAergic neurotransmitter-type neuronal clusters with convergent pattern (shown below) with other clusters according to the effector-based (white) and TFs-based (gray) distance. Distance defined as (1 − (Pearson correlation coefficient between clusters))/2. Red and black dots showed the distance of each pair clusters. In convergent pattern, the red and black dots were the lowest distance in effector gene-based (white) distances, but not the lowest distance in TF-based (gray) distances. (G) The table showing the brain regions and neurotransmitter type of each pair clusters with convergent pattern (n = 14). Regional origins and neurotransmitter type are color-coded. (H) Heatmap showing the distances distribution of 39 glutamatergic/GABAergic neurons based on effector gene profiles. The hierarchical clustering in the heatmap is similar as Figure 3—figure supplement 2A (upper). (I) Heatmap showing the distances distribution of 39 glutamatergic/GABAergic neurons based on subsampling 80% of effector genes. The hierarchical clustering in the heatmap is similar as Figure 3—figure supplement 2A (upper). The tree distance before and after subsampling was 0.1407203 (calculated by ‘TreeDist’). (J) Heatmap showing the distances distribution of 39 glutamatergic/GABAergic neurons based on TF profiles. The hierarchical clustering in the heatmap is similar as Figure 3—figure supplement 2A (bottom). (K) Heatmap showing the distances distribution of 39 glutamatergic/GABAergic neurons based on subsampling 80% of TF profiles. The hierarchical clustering in the heatmap is similar as Figure 3—figure supplement 2A (bottom). The tree distance before and after subsampling was 0.2032071 (calculated by ‘TreeDist’). (L) Summary table showing the pairs of neuronal clusters with three patterns before and after subsampling. Re-identified patterns using subsampling completely recapitulated those pairs identified using the population-level statistical analysis based on total genes.
Figure 3—figure supplement 3
Similar pair clusters of neuromodulator-type neurons.
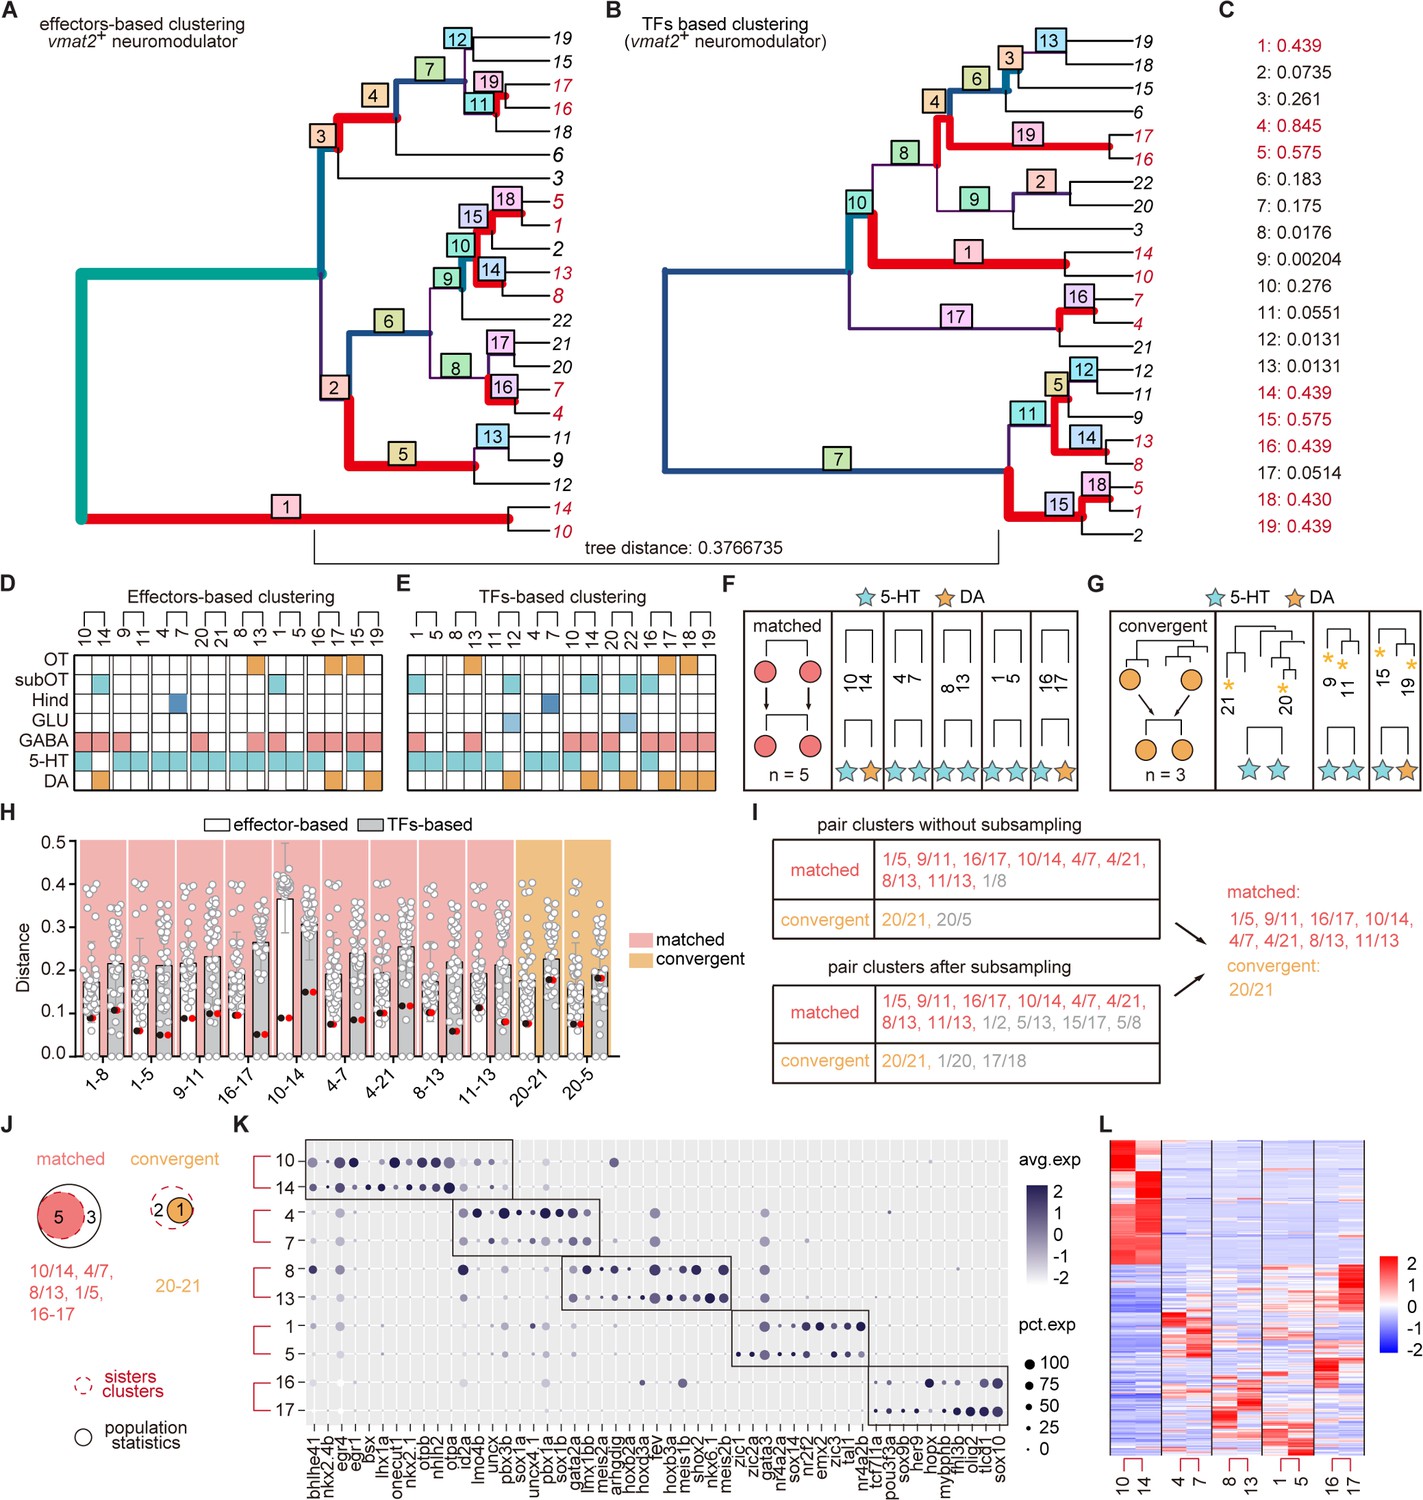
(A-B) Hierarchical clustering of neuromodulator-type neurons based on 1783 effector genes or 319 transcription factors (TFs) in highly variable genes. The tree plots visualizing the matching nodes between TF-based tree and effector gene-based tree with R package ‘TreeDist’. Red line indicated the matching node. Bottom tree distance (0.3766735) indicated the similarity organization of TF-based and effector-based tree. (C) Each split node in (A-B) were labeled with a measure of similarity score. Matching nodes were highlighted. (D-E) The table showing the terminus sister pairs of vmat2+ neuromodulator neurons from effector gene-based (D) or TF-based (E) hierarchical sister cluster analysis. The neuromodulator identities, brain region origins, and co-expression neurotransmitters were color-coded. (F-G) A schematic for matched pattern (F), convergent pattern (G) showing five and three similar neuromodulator pairs with matched and convergent pattern, respectively, based on hierarchical sister cluster analysis. The neuromodulator identities were color-coded. (H) Scatter plots showing the distribution of the distances of clusters of each vmat2+ neuromodulator-type clusters exhibiting matched (light red) and convergent (light orange) patterns to other clusters using the effector-based (white) or TF-based (gray) population-level statistical analysis. Red and black dots represented the distances between two similar clusters. In matched pattern, the red and black dots had the lowest distances in both effector gene-based (white) distance cohort, and TF-based (gray) distance cohort. In convergent pattern, the red and black dots had the lowest distance in effector gene-based (white) cohort, but had higher distances in TF-based (gray) distance cohort. (I) Summary table showing the pairs of similar neuromodulator clusters with two patterns in (H) or after subsampling (I). (J) Venn plots showing the number of each pattern using two strategies (hierarchical sister cluster and population-level statistical analysis) in Figure 3A. The red dashed circle showing the number of cluster pairs with given pattern based on hierarchical sister clusters; the black solid circle showing the number of cluster pairs with given pattern based on population-level statistical analysis. (K) Dot plot showing the TFs expression in matched terminus pairs from vmat2+ neuromodulator neurons. Sister clusters in a pair exhibited similar TFs expression patterns (red box). (L) Pheatmap showing the similar effector gene expression between each sister clusters of vmat2+ neuromodulator neurons with matched pattern.
Figure 3—figure supplement 4
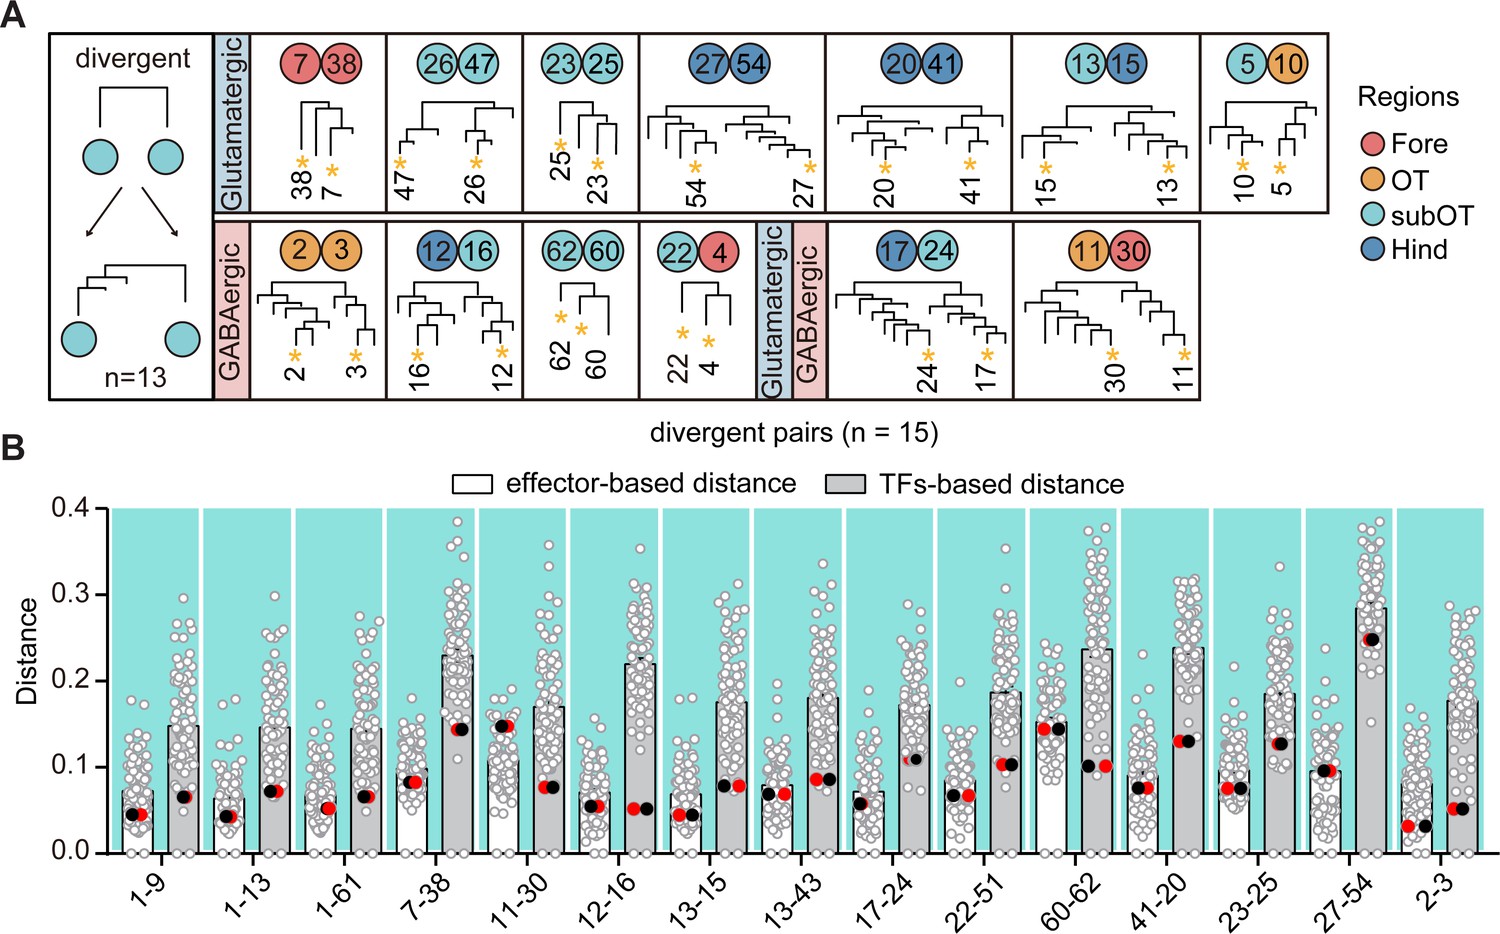
Divergent pattern of glutamatergic/GABAergic neurotransmitter-type neuronal clusters.
(A) A schematic for divergent pattern (left) and a summary table (right) showing that neuronal clusters as sister cluster pairs within transcription factor (TF)-based hierarchy were divergent at different termini within effector gene-based hierarchy (n = 13). Colored dots represent the regional origins of each cluster. (B) Scatter plot showing the distance distribution of glutamatergic/GABAergic neurotransmitter-type neuronal clusters with divergent pattern (shown with fork) with other clusters according to the effector-based (white) and TF-based (gray) distance measures. Distance defined as (1 − (Pearson correlation coefficient between clusters))/2. Red and black dots showing the distance of each pair clusters with divergent pattern. In divergent pattern, the red and black dots were the lowest distances in TF-based (gray) distance, but not the lowest distance in effector gene-based (white) distances.
Figure 4 with 1 supplement
Combinatorial transcription factors (TFs) in marking tectal morphological subclasses.
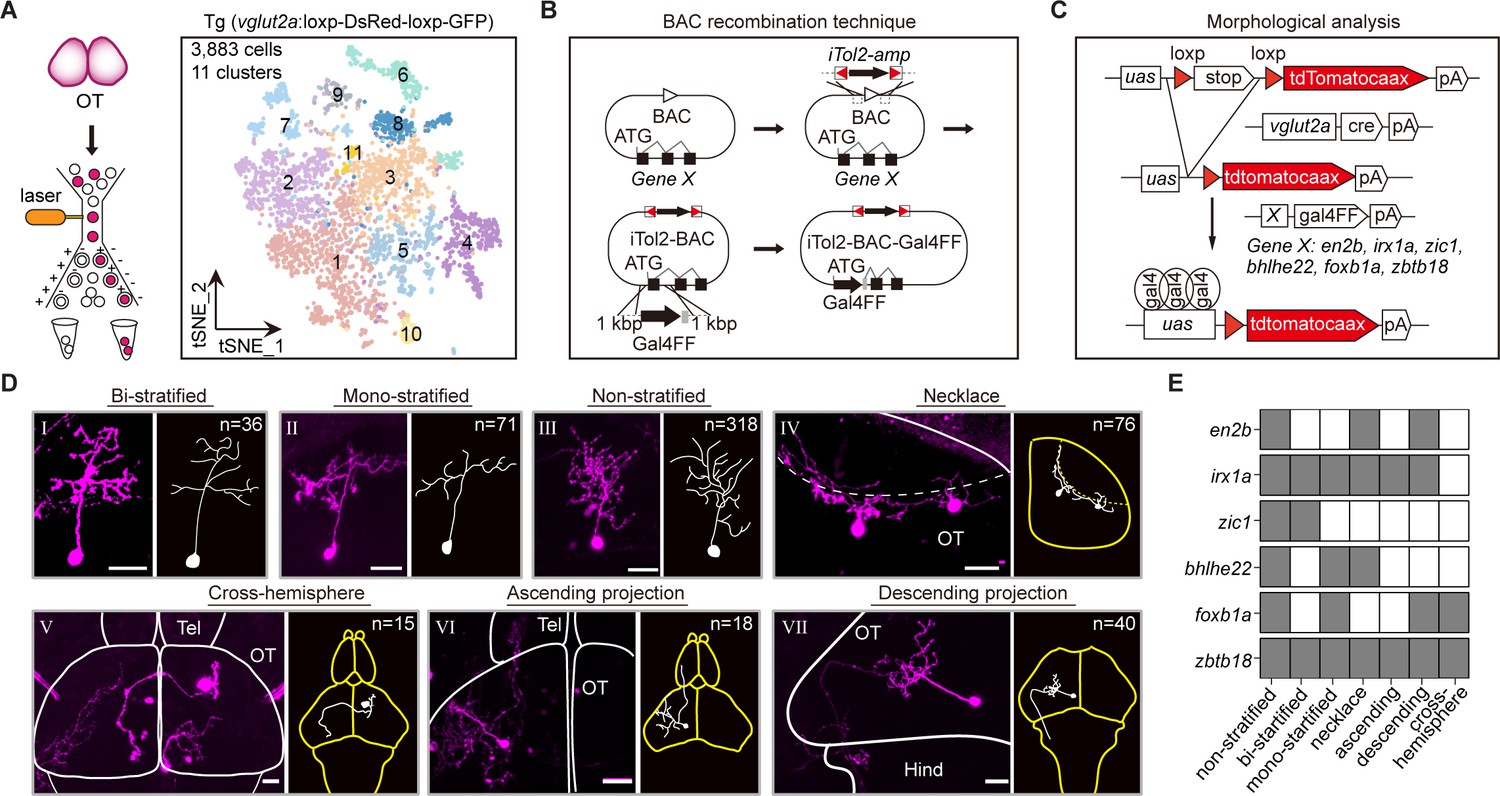
(A) Left: the schematic showing the procedure of collecting single-cell transcriptomes of tectal glutamatergic neurons with fluorescence-activated cell sorting (FACS) using Tg (vglut2a:loxp-DsRed-loxp-GFP) fishline. Right: the t-distributed stochastic neighbor embedding (t-SNE) plot of 3, 883 cells obtained from Tg (vglut2a:loxp-DsRed-loxp-GFP) fishline labelling glutamatergic neurons in the optic tectum showing 11 clusters, each color-coded and marked by a number. (B) Schematic showing the designing of the Gal4FF BAC plasmids for six TF marker genes, covering all 11 clusters of tectal glutamatergic neurons shown in A. (C) Schematic showing the method for single TF-based labeling of tectal glutamatergic neurons. CRE expressed in glutamatergic neurons was used to excise loxp and drive fluorescent tdTomatocaax expression. (D) Representative images of seven subclasses of tectal glutamatergic neurons with distinct morphological subclasses using the method described in (B–C). The number of neurons collected for each subclass was shown. Insets depicted the morphological characteristics. Neurons with ascending and descending projections were those projecting to the forebrain and hindbrain, respectively. Solid lines marked the boundaries between brain regions. Dashed lines marked the boundary of the tectal neuropile. Scale bars: 20 μm. (E) The matrix showing the expressions of six TFs in each of seven morphological subclasses. The black squares represented TFs could label particular morphological subclasses, and no expression was indicated by white squares.
-
Figure 4—source data 1
The annotation of transcription factors (TFs) expression in each tectal glutamatergic clusters.
- https://cdn.elifesciences.org/articles/68224/elife-68224-fig4-data1-v3.xlsx
-
Figure 4—source data 2
Gene labeled morphological analysis of tectal glutamatergic neurons.
- https://cdn.elifesciences.org/articles/68224/elife-68224-fig4-data2-v3.xlsx
Figure 4—figure supplement 1
Combinatorial transcription factors (TFs) in marking tectal morphological subclasses.
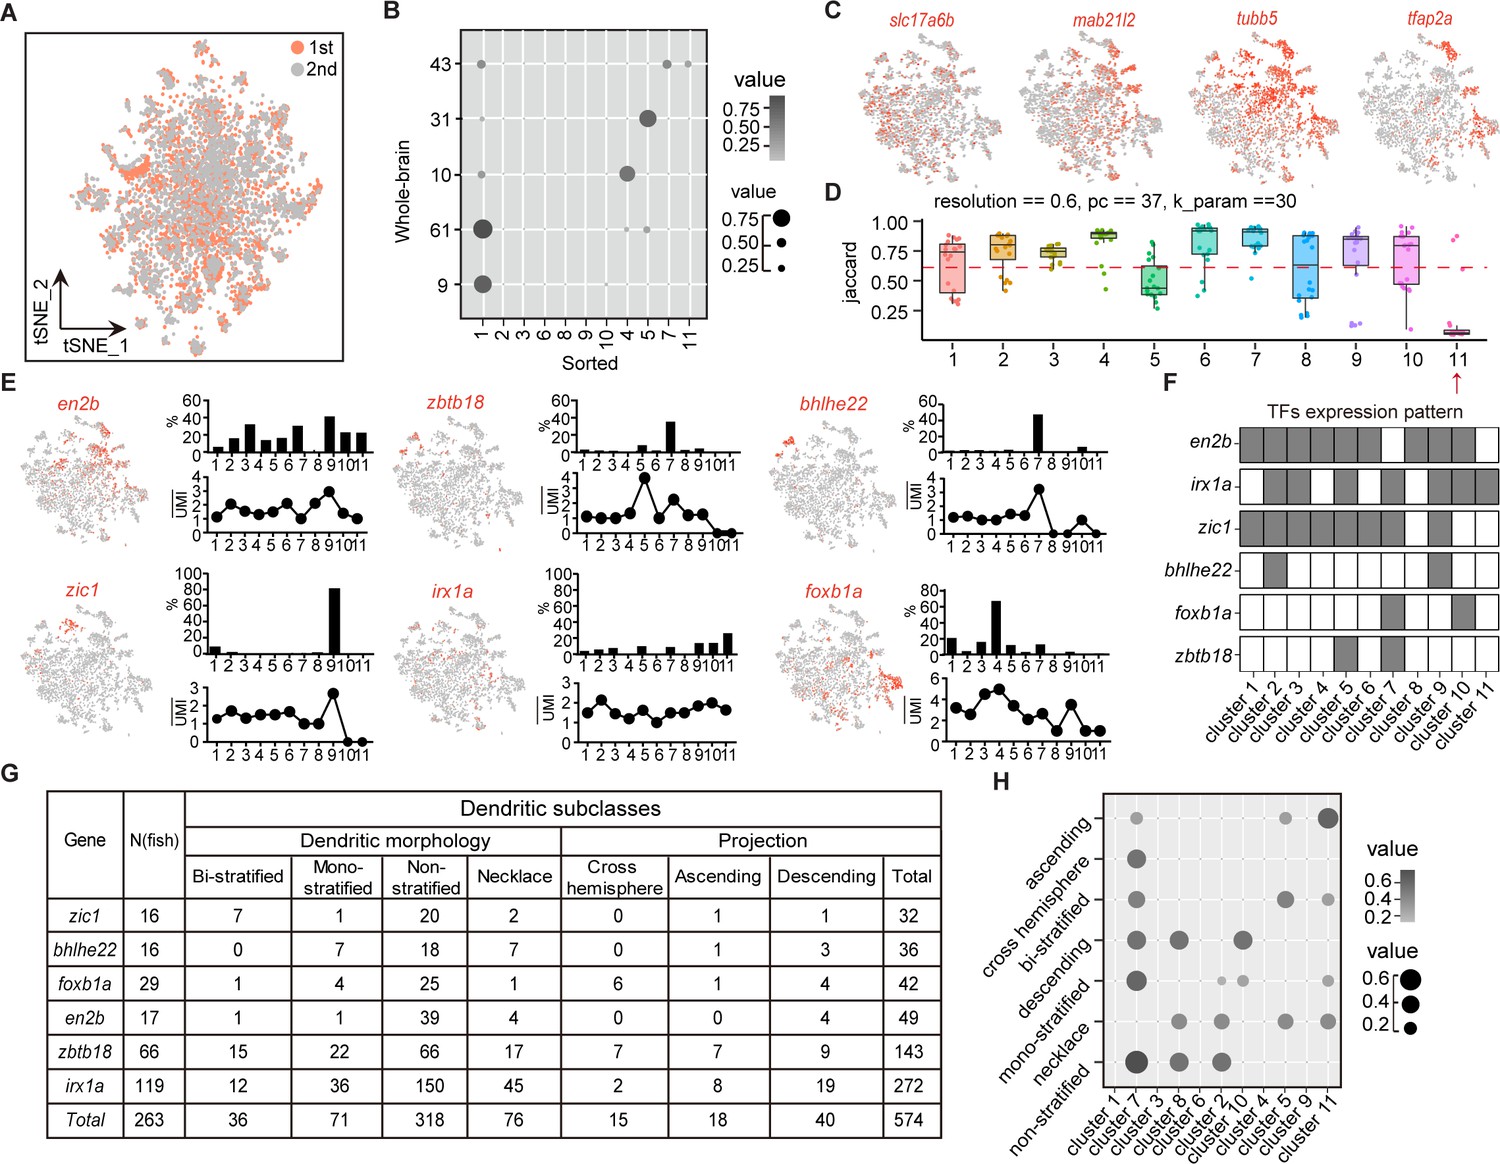
(A) Canonical correlation analysis (CCA) of cells from two independent experiments of Tg (vglut2a:loxp-DsRed-loxp-gfp), two rounds overlapping indicated data reproducibility. Two rounds of data were color-coded. (B) Lawson-Hanson algorithm for non-negative least squares (NNLS) analysis showing the relationship of transcriptome-based clusters of tectal glutamatergic neurons from sorted samples with Tg (vglut2a:loxp-DsRed-loxp-gfp) and whole-brain samples. Sorted clusters could cover all clusters from whole-brain sample. The correltion coefficiency was both color-coded and size-coded. (C) t-Distributed stochastic neighbor embedding (tSNE) plots of expression of mab21l2 and vglut2a (shown with slc17a6b) in sorted tectal glutamatergic neurons. Tubb5 and tfap2a are the marker genes of clusters of tectal glutamatergic neurons. (D) The JaccardRainCloundPlot showing the stability of tectal glutamatergic neuronal clusters in Figure 4A. Red line indicated the 0.6 cutoff of Jaccard index to evaluate the cluster stability. Red arrowhead indicated unstable clusters. (E) Left: tSNE plot showing the expression of TF in the clusters of tectal glutamatergic neurons. Right: the percentages of TF-expressed cells in each of 11 clusters (upper) and the averaged UMI of each TF-expressed cell in each cluster (bottom). (F) The matrix showing the expressions of six TFs in each of 11 tectal glutamatergic neurons. The labeled were indicated by black squares and no expression was indicated by white squares. (G) The matrix showing 574 neurons expressing each of six TFs in E. All neurons were categorized into seven morphological subclasses: bi-stratified (n = 36), mono-stratified (n = 71), non-stratified (n = 318), necklace (n = 76), cross-hemisphere (n = 15), ascending projection (n = 18), and descending projection (n = 40). (H) NNLS analysis showing the correlation of morphological subclasses and transcriptome clusters. The correltion coefficiency was both color-coded and size-coded.
Figure 5 with 1 supplement
The post-transcriptional regulatory landscape in neurons with different terminal features but similar transcription factor (TF) profiles.
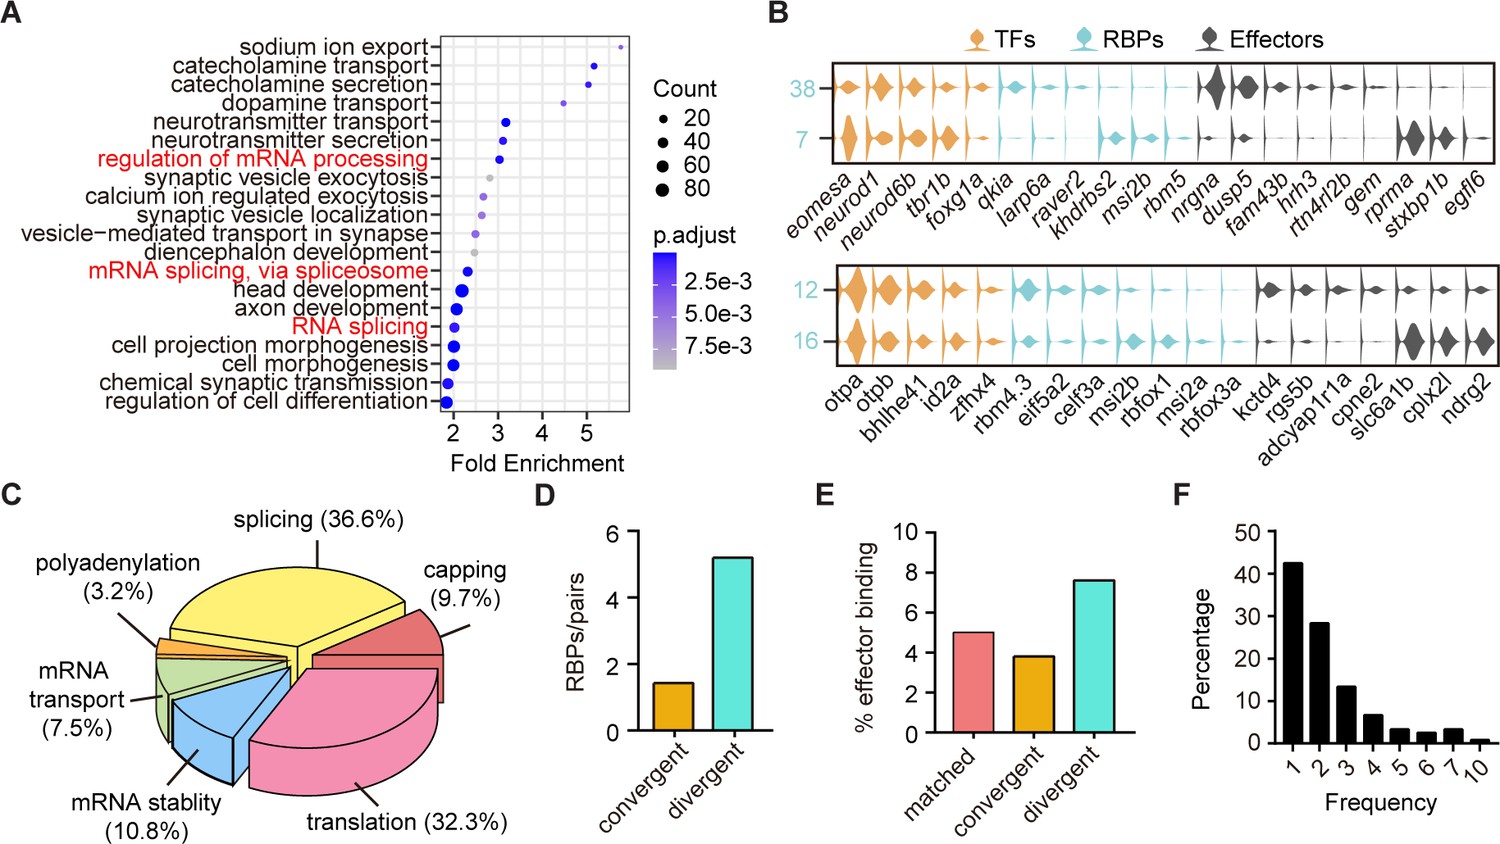
(A) Dot plot showing Gene Ontology (GO) analysis of differentially expressed genes between each pair clusters with divergent pattern. Red highlighted the category of post-transcriptional regulators. The number of genes in each category was coded by dot size, p.adjust of each category was color-coded. (B) Violin plots showing the expression of genes encoding TFs (yellow), RNA-binding proteins (RBPs) (blue), and effector genes (black) in two pairs of neuronal clusters with divergent pattern (7/38 were glutamatergic neurons, 12/16 were GABAergic neurons). (C) 3D pie plot showing the functional annotation of differentially expressed RBP genes identified in A. (D) Bar plot showing the number of pattern-specific RBPs per pair in different patterns. Each pattern was color-coded. (E) Bar plot showing the effector binding target proportion of pattern-specific RBPs. Each pattern was color-coded. (F) Bar plot showing the percentage of one RBP used as differentially expressed genes between pair clusters with different patterns.
-
Figure 5—source data 1
Differentially gene expression between sister pair clusters with matched, convergent, and divergent patterns.
- https://cdn.elifesciences.org/articles/68224/elife-68224-fig5-data1-v3.xlsx
-
Figure 5—source data 2
The p-value of differential gene expression between sister pair clusters.
- https://cdn.elifesciences.org/articles/68224/elife-68224-fig5-data2-v3.xlsx
-
Figure 5—source data 3
Annotation the function of RNA-binding proteins (RBPs).
- https://cdn.elifesciences.org/articles/68224/elife-68224-fig5-data3-v3.xlsx
-
Figure 5—source data 4
The binding sites of pattern specific RNA-binding proteins (RBPs).
- https://cdn.elifesciences.org/articles/68224/elife-68224-fig5-data4-v3.xlsx
-
Figure 5—source data 5
The combinatorial usage of RNA-binding proteins (RBPs).
- https://cdn.elifesciences.org/articles/68224/elife-68224-fig5-data5-v3.xlsx
Figure 5—figure supplement 1
The post-transcriptional regulatory landscape in neurons with different terminal features but similar transcription factor (TF) profiles.
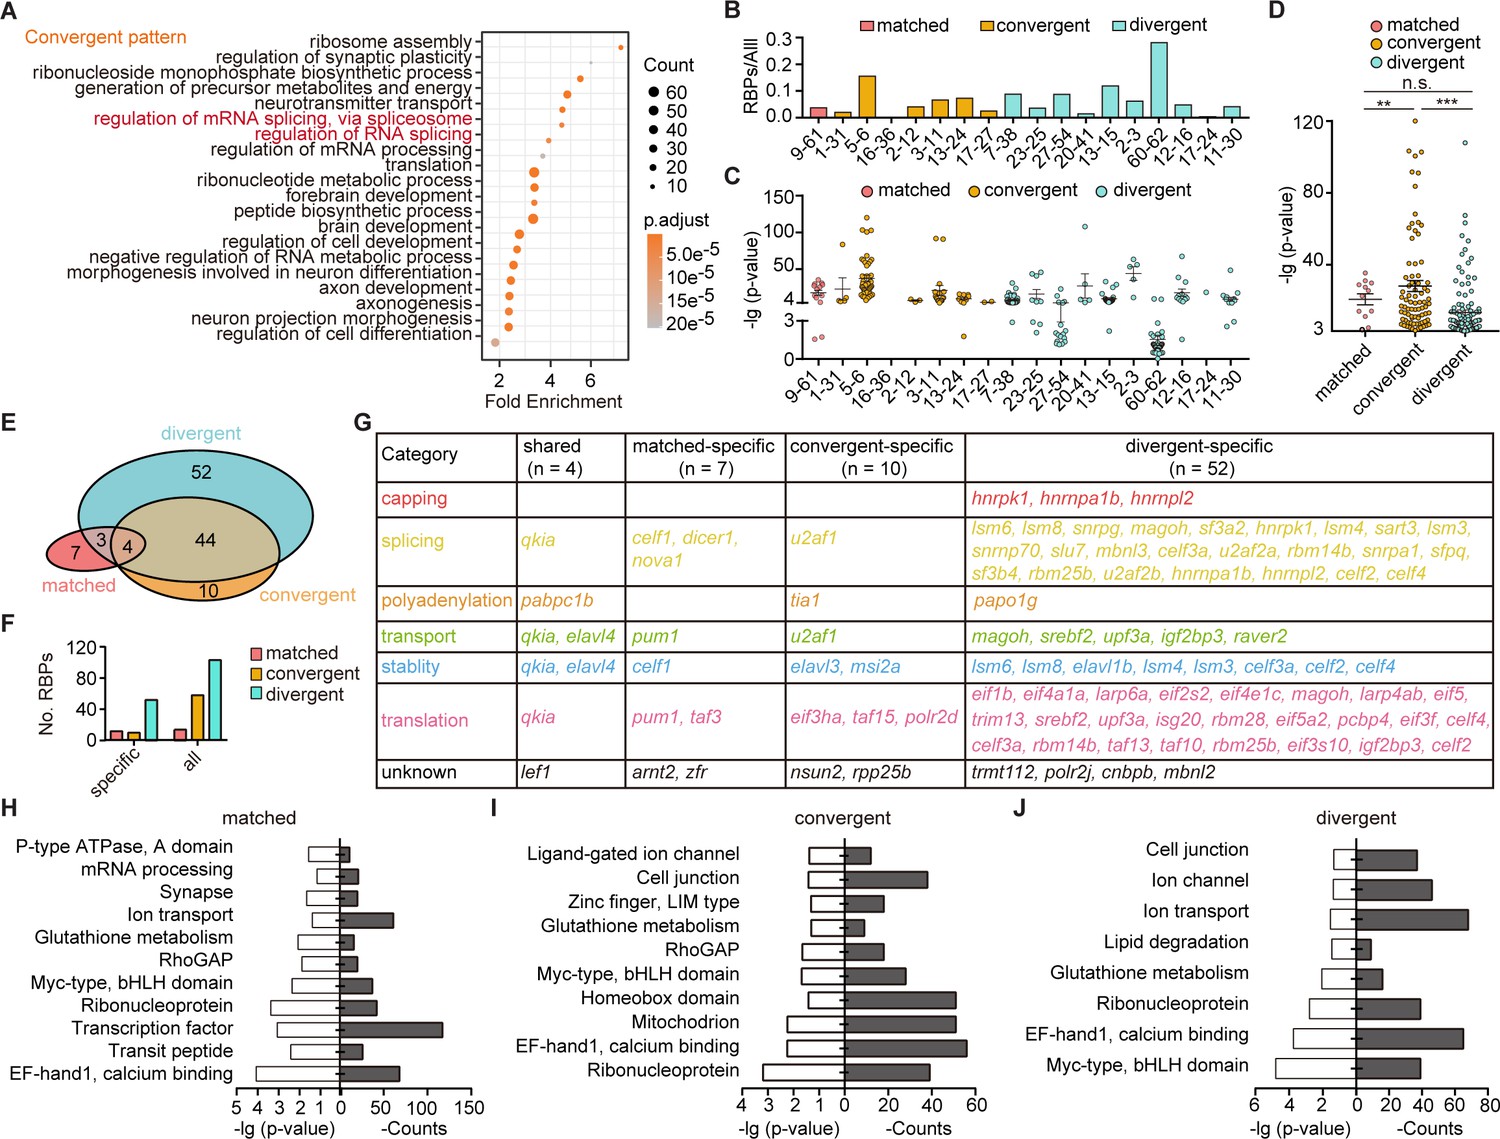
(A) Dot graph showing the Gene Ontology (GO) analysis of differentially expressed genes between neuronal clusters with convergent pattern. Red highlighted the category of post-transcriptional regulators. The number of genes in each category was coded by dot size. The p.adjust of each category was color-coded. (B) Bar plot showing the ratio of differentially expressed RNA-binding proteins (RBPs) and all markers between pairs with matched, convergent, and divergent patterns. Different patterns are color-coded. (C) Dot plot showing the p-value of RBPs used as differentially expressed genes between pair clusters with matched, convergent, and divergent patterns. Different patterns are color-coded (mean ± SEM). (D) Scatter plot showing the p-value of RBPs which were used to distinguish pair clusters in each pattern. Each pattern was color-coded (mean ± SEM, matched: 20.73 ± 3.086, convergent: 28.1 ± 3.079, divergent: 13.33 ± 1.493, **p-value < 0.01, ***p-value < 0.001, ns, no significant difference; t-test). (E) Venn plot showing the RBPs used as differentially expressed genes between paired clusters with different pattern. Each pattern was color-coded. (F) Bar plot showing the number of pattern-specific RBPs in each patterns. Each pattern was color-coded. (G) The matrix showing the functional category of RBPs which specifically distinguished pair clusters with matched, convergent, and divergent patterns or shared by all three patterns. Different RBPs functions are color-coded. (H–J) Bar plots showing the GO analysis of target sites of pattern-specific RBPs (H, matched pattern; I, convergent pattern; and J, divergent pattern) using the oRNAment database.
Figure 6
Organization of transcriptional and post-transcriptional regulators in the specification of brain-wide neuronal clusters.
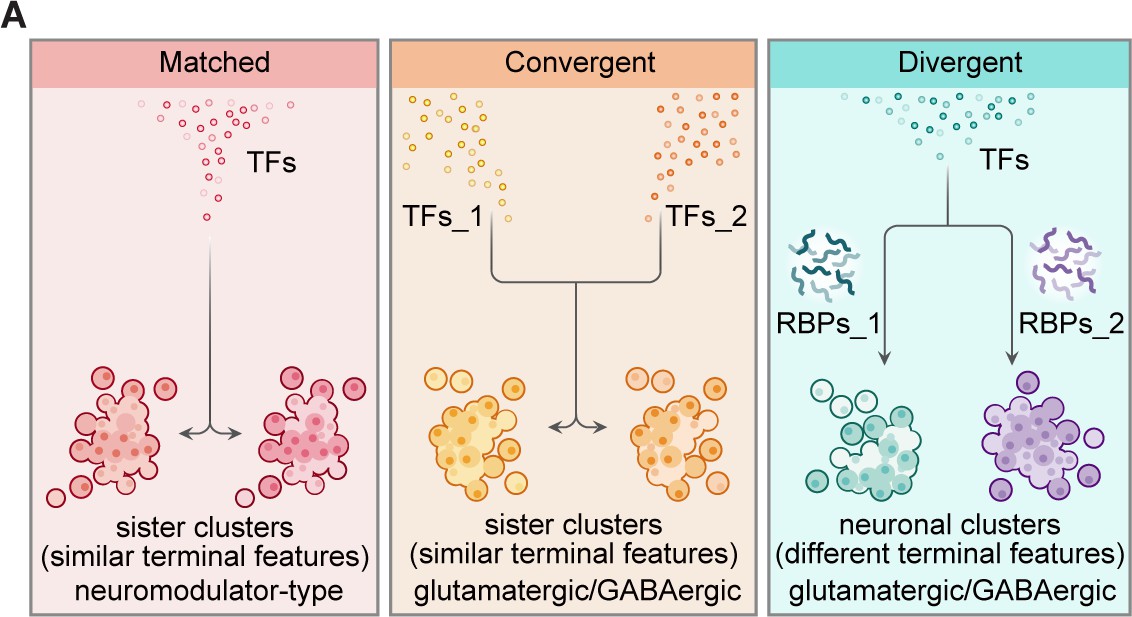
(A) Graphic summary describes the general organization of transcription factors (TFs) and post-transcriptional regulators in the specification of neuronal clusters at the whole-brain level. Effector genes describe the terminal features of whole-brain neuronal classification. Neuronal clusters with similar terminal features (named ‘sister clusters’) can share TF profiles (‘matched’, left), or exhibit distinct TF profiles (‘convergent’, middle). Besides, neuronal clusters with distinct effector gene profiles (terminal features) can share TFs profiles (‘divergent’, right), and in each pairs, two neuronal clusters are differentially marked by the expression of RNA-binding proteins (RBPs) at the post-transcriptional levels. Moreover, sister clusters with ‘convergent’ and ‘divergent’ patterns are glutamatergic/GABAergic neurons, whereas sister clusters with ‘matched’ pattern are neuromodulator-type neurons.
Tables
Key resources table
| Reagent type (species) or resource | Designation | Source or reference | Identifiers | Additional information |
|---|---|---|---|---|
| Strain, strain background (Danio rerio) | Wild type | Dr William | AB | |
| Strain, strain background (Danio rerio) | gad1b:EGFP | Wang et al., 2020 | ZDB-TGCONSTRCT-210507–9 | Tg (gad1b:EGFP) |
| Strain, strain background (Danio rerio) | vglut2a:loxp-DsRed:loxp-GFP | Satou et al., 2012 | ZDB-FISH-150901–9050 | Tg (vglut2a:loxp-DsRed:loxp-GFP) |
| Strain, strain background (Danio rerio) | glyT2:GFP | McLean et al., 2007 | ZDB-ALT-070514–1 | Tg (glyT2:GFP) |
| Strain, strain background (Danio rerio) | vmat2:GFP | Wen et al., 2008 | ZDB-PUB-080102–11 | Tg (ETvmat2:GFP) |
| Strain, strain background (Danio rerio) | elavl3: H2B-GCaMP6s | Freeman et al., 2014 | ZDB-TGCONSTRCT-190827–1 | Tg (elavl3: H2B-GCaMP6s) |
| Recombinant DNA reagent | pTol2-10xUAS:loxp-stop-loxp-tdtomato | This paper | We made this plasmid by ligated three PCR fragments: loxp-stop-loxp, tdTomatocaax and 10× uas backbone | |
| Recombinant DNA reagent | vglut2a:cre | This paper | BAC plasmid use BAC (CH211-111D5) | |
| Recombinant DNA reagent | zic1:gal4FF | This paper | BAC plasmid use BAC (CH211-95F4) | |
| Recombinant DNA reagent | bhlhe22:gal4FF | This paper | BAC plasmid use BAC (CH211-277b21) | |
| Recombinant DNA reagent | en2b:gal4FF | This paper | BAC plasmid use BAC (DKEY-265A7) | |
| Recombinant DNA reagent | foxb1a:gal4FF | This paper | BAC plasmid use BAC (CH211-2C17R) | |
| Recombinant DNA reagent | zbtb18:gal4FF | This paper | BAC plasmid use BAC (CH211-221N23) | |
| Recombinant DNA reagent | irx1a:gal4FF | This paper | BAC plasmid use BAC (CH73-211K12) | |
| Commercial assay or kit | Single Cell 3' Library and Gel Bead kit v2 Chip kit | 10× Genomics | 120237 | scRNA-seq |
| Commercial assay or kit | dsDNA High Sensitivity Assay Kit | AATI | DNF-474–0500 | scRNA-seq |
| Commercial assay or kit | ClonExpressMultiS One Step Cloning Kit | Vazyme | Cat#C112-01/02 | Prepare recombinant plasmid |
| Chemical compound, drug | papain | Worthington Biochemical Corporation | LS003126 | Prepare papain solution to dissociation cells |
| Chemical compound, drug | DNase I | Sigma | Cat#DN25 | Prepare papain solution to dissociate cells |
| Chemical compound, drug | L-cysteine | Sigma | Cat#C6852 | Prepare papain solution to dissociate cells |
| Chemical compound, drug | DMEM/F12 | Invitrogen | Cat#11330032 | Prepare papain solution to dissociate cells |
| Chemical compound, drug | 45% glucose | Gibco | Cat#04196545SB | Prepare wash buffer during dissociation |
| Chemical compound, drug | HEPES | Sigma | Cat#H4034 | Prepare wash buffer during dissociation |
| Chemical compound, drug | FBS | Gibco | Cat#10270106 | Prepare wash buffer during dissociation |
| Chemical compound, drug | DPBS | Invitrogen | Cat#14190–144 | Prepare wash buffer during dissociation |
| Chemical compound, drug | MS222 | Sigma | Cat#A5040 | Anaesthesia |
| Chemical compound, drug | Low melting agarose | Sigma | Cat#A0701 | Embedded fish |
| Software, algorithm | R 3.5.1 | R-project | https://www.r-project.org/ | Data analysis |
| Software, algorithm | Cell Ranger Single Cell Software Suite (v2.1.0) | 10× Genomics | https://support.10xgenomics.com | scRNA-seq data analysis |
| Software, algorithm | Seurat | https://satijalab.org/seurat/ | http://satijalab.org/seurat/ | scRNA-seq data analysis |
| Software, algorithm | bioDist | https://www.bioconductor.org | https://www.bioconductor.org/packages/release/bioc/html/bioDist.html | |
| Software, algorithm | scclusteval | R-package, Jaccard index | https://github.com/crazyhottommy/scclusteval; Tang et al., 2020 | Jaccard index could be used to evaluate the robustness of clusters |
| Software, algorithm | TreeDist | R-package, calculate two tree similarity | https://github.com/ms609/TreeDist; Smith, 2021 | Calculate tree distance |
| Software, algorithm | FIJI | PMID:22743772 | http://fiji.sc/ | Analysis image |
| Software, algorithm | GraphPad Prism | GraphPad Software | https://www.graphpad.com | Data analysis |
| Software, algorithm | FV10-ASW 4.0 Viewer | Olympus | https://www.olympus-global.com | Analysis image |
| Software, algorithm | clusterProfiler | R-package | https://bioconductor.org/packages/release/bioc/html/clusterProfiler.html | GO analysis |
| Software, algorithm | NNLS | R-package, non-negative least squares solver from Lawson and Hanson | https://github.com/rdeits/NNLS.jl; Deits, 2021 | Compare correlation of clusters |
Additional files
Download links
A two-part list of links to download the article, or parts of the article, in various formats.
Downloads (link to download the article as PDF)
Open citations (links to open the citations from this article in various online reference manager services)
Cite this article (links to download the citations from this article in formats compatible with various reference manager tools)
The landscape of regulatory genes in brain-wide neuronal phenotypes of a vertebrate brain
eLife 10:e68224.
https://doi.org/10.7554/eLife.68224


