LMO2 is essential to maintain the ability of progenitors to differentiate into T-cell lineage in mice
- Department of Immunology, Tokai University School of Medicine, Japan
- Institute of Medical Sciences, Tokai University, Japan
- Laboratory of Medical Omics Research, Kazusa DNA Research Institute, Japan
- Department of Omics Medicine, Graduate School of Medicine, Chiba University, Japan
- Department of Innovative Medical Science, Tokai University School of Medicine, Japan
- Department of Hematology and Oncology, Tokai University School of Medicine, Japan
Figures
Figure 1 with 1 supplement
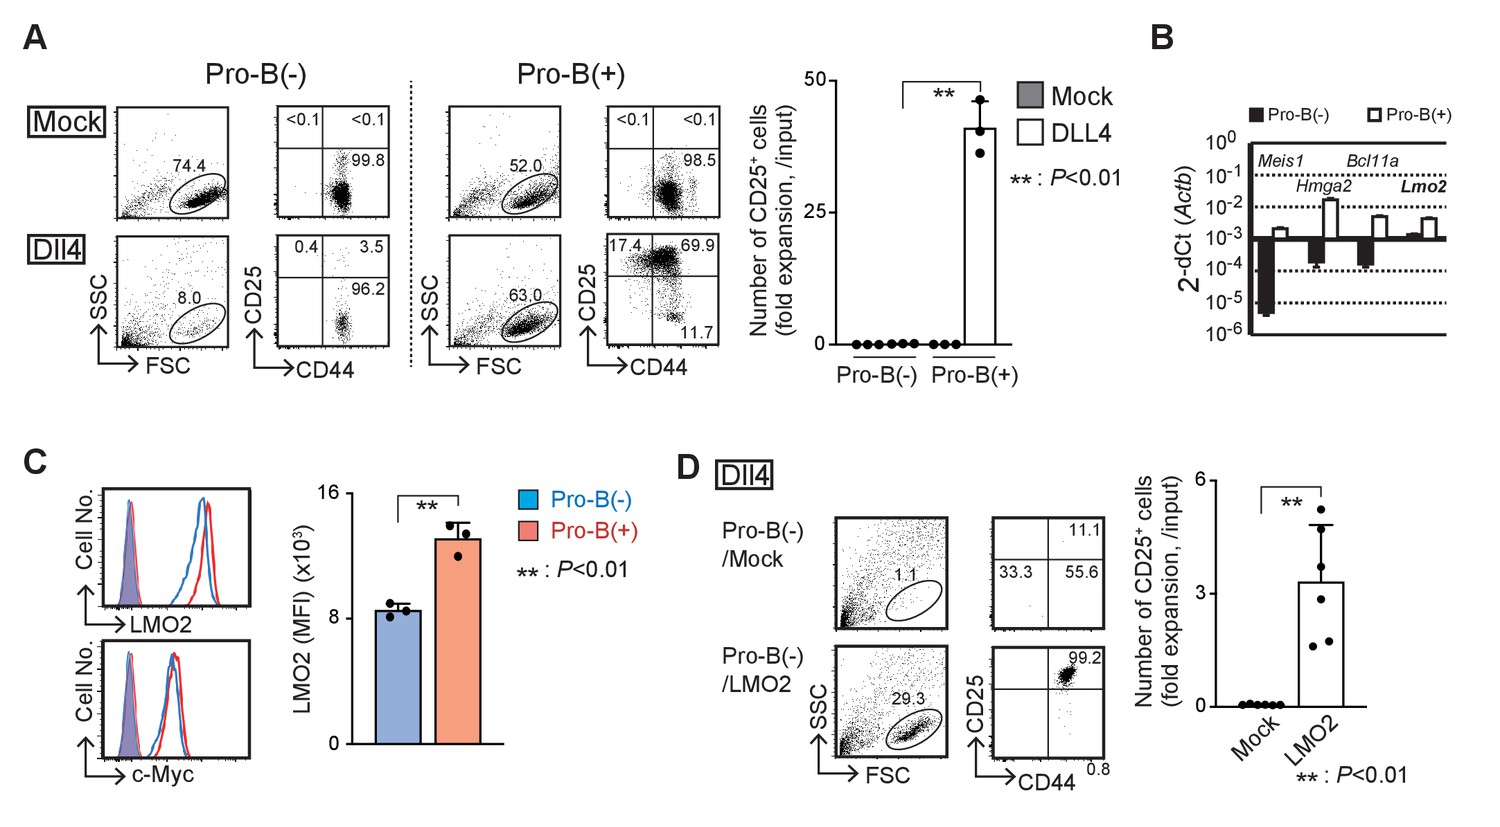
LMO2 is critical for the maintenance of T-cell differentiation potential in Ebf1-deficient pro-B cells.
(A) Establishment of Ebf1-deficient pro-B cell lines with or without differentiation potential to the T-cell lineage. Lineage markers (CD19, Gr1, TER119, NK1.1)-negative, c-kit-positive cells in Ebf1−/− FL were cultured on TD7 or OP9 cells, and Ebf1-deficient pro-B cell lines were established. Stably growing pro-B cells with or without T-cell potential (pro-B(+) or pro-B(−)) were cultured on OP9-Mock (Mock) or OP9-Dll4 (Dll4) cells with Flt3L, SCF, and IL7 for 6 days and analyzed for the expression of CD44 and CD25 (right panels) in the lymphoid cell gate (FSC vs. SSC, left panels) by flow cytometry. The numbers in the profiles indicate the relative percentages in each corresponding quadrant or fraction. Numbers of CD25+ cells (fold expansion/input) are shown with standard deviation (SD) (right). Statistical analysis was performed using the two-tailed Student’s t-test. **p<0.01. Data are representative of three independent experiments with similar results. (B) Reverse transcription (RT)-quantitative PCR (qPCR) detection of Meis1, Hmga2, Bcl11a, or Lmo2 transcripts in pro-B(−) (closed columns) and pro-B(+) (open columns) cells. Data represent the mean values of three independent biological replicates, and all values are normalized to the expression of Actb. Error bars indicate SD. Three independent experiments were performed, and similar results were obtained. (C) Representative intracellular staining profiles of LMO2 and c-Myc in pro-B(−) (open blue line) and pro-B(+) (open red line) cells are shown. Closed lines (orange) represent staining with control rabbit mAb of pro-B(−) and pro-B(+), which were completely merged. The average mean fluorescent intensity (MFI) of LMO2 is shown with SD (right). A two-tailed Student’s t-test was used for statistical analysis. **p<0.01. Three independent experiments were performed with similar results. (D) Introduction of Lmo2 is sufficient to maintain the T-cell differentiation potential in pro-B cells. Empty vector- or Lmo2-transduced pro-B(−) cells (pro-B(−)/Mock or pro-B(−)/LMO2) were cultured on OP9-Dll4 for 6 days and analyzed for the expression of CD44 and CD25 (right panels) in lymphoid cell gate (left panels) and rat CD2+ (lentivirus-infected) CD45+ fraction. Numbers of CD25+ cells (relative expansion/input) are shown with SD (right). **p<0.01 by two-sided Student’s t-test. Six independent experiments were performed with similar results.
-
Figure 1—source data 1
Raw data used to generate the graph in Figure 1A.
- https://cdn.elifesciences.org/articles/68227/elife-68227-fig1-data1-v1.xlsx
-
Figure 1—source data 2
Raw data used to generate the graph in Figure 1B.
- https://cdn.elifesciences.org/articles/68227/elife-68227-fig1-data2-v1.xlsx
-
Figure 1—source data 3
Raw data used to generate the graph in Figure 1C.
- https://cdn.elifesciences.org/articles/68227/elife-68227-fig1-data3-v1.xlsx
-
Figure 1—source data 4
Raw data used to generate the graph in Figure 1D.
- https://cdn.elifesciences.org/articles/68227/elife-68227-fig1-data4-v1.xlsx
Figure 1—figure supplement 1
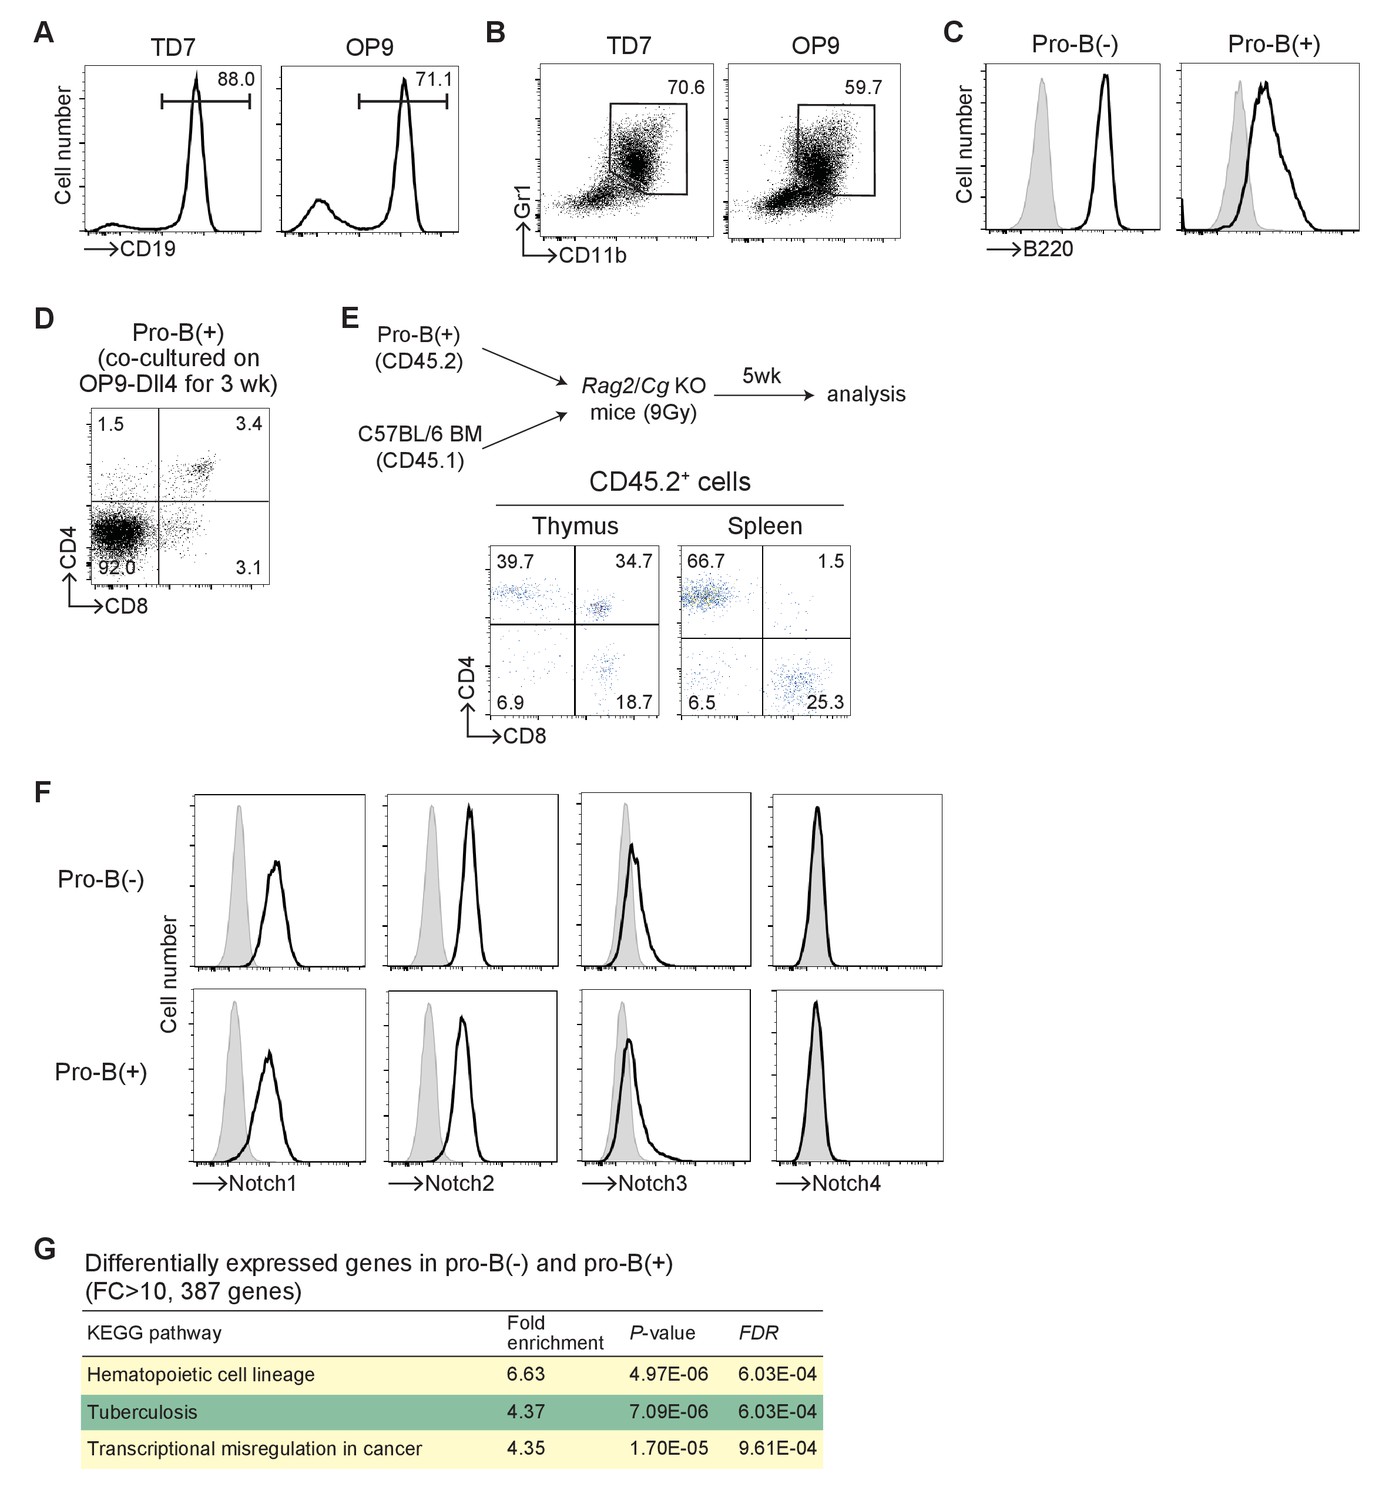
Characterization of pro-B(+) and pro-B(−) cells.
(A) The stromal cell line TD7 can support B-cell differentiation. BM progenitor cells from C57BL/6 mice were co-cultured with the TD7 or OP9 thymic stromal cells for 6 days. Representative CD19 profiles in lymphocytes are shown. Results represent two independent biological replicates. (B) Lin+ cells are generated more frequently on TD7 than on OP9 monolayers. Fetal liver-derived HSCs from Ebf1-deficient mice were cultured on TD7 or OP9 monolayers for 3 days. Representative CD11b/Gr1 profiles among the CD45+ lymphocytes are shown. Results are representative of two independent biological replicates. (C) Pro-B(−) and pro-B(+) cells express intermediate levels of B220. B220 expression in pro-B(−) and pro-B(+) cells is shown. Results represent three independent replicates. (D) Pro-B(+) cells were co-cultured with OP9-Dll4, 1 ng/ml of IL-7, and 5 ng/ml of Flt3L for 3 weeks. Thereafter, the cells were subjected to flow cytometric analysis. A representative CD4/CD8 profile in lymphocytes is shown. Results represent two independent biological replicates. (E) Pro-B(+) cells (5 × 10⁶, CD45.2) were mixed with BM cells obtained from wild-type congenic mice (2 × 10⁵, CD45.1) and transplanted into the lethally irradiated (9 Gy) Rag2/Cg-deficient hosts. The recipient mice were analyzed after 5 weeks of transplantation. Flow cytometric analysis of thymocytes and splenocytes was performed. Representative CD4/CD8 profiles among the CD45.2+ thymocytes (left) and splenocytes (right) are shown. Results are representative of two independent biological replicates. (F) Pro-B(−) and pro-B(+) cells express comparable levels of Notch receptors on their surface. Representative Notch1, Notch2, Notch3, and Notch4 profiles on pro-B(−) and pro-B(+) cells are shown. Results are representative of two independent biological replicates. (G) Kyoto Encyclopedia of Genes and Genomes (KEGG) pathway annotation of the differentially expressed genes in pro-B(+) and pro-B(−) cells (Supplementary file 1, FC > 10, n = 387) was performed using the DAVID analysis tools (https://david.ncifcrf.gov/). Top three KEGG pathway annotations are shown. Data are based on two independent biological replicates.
Figure 2 with 1 supplement
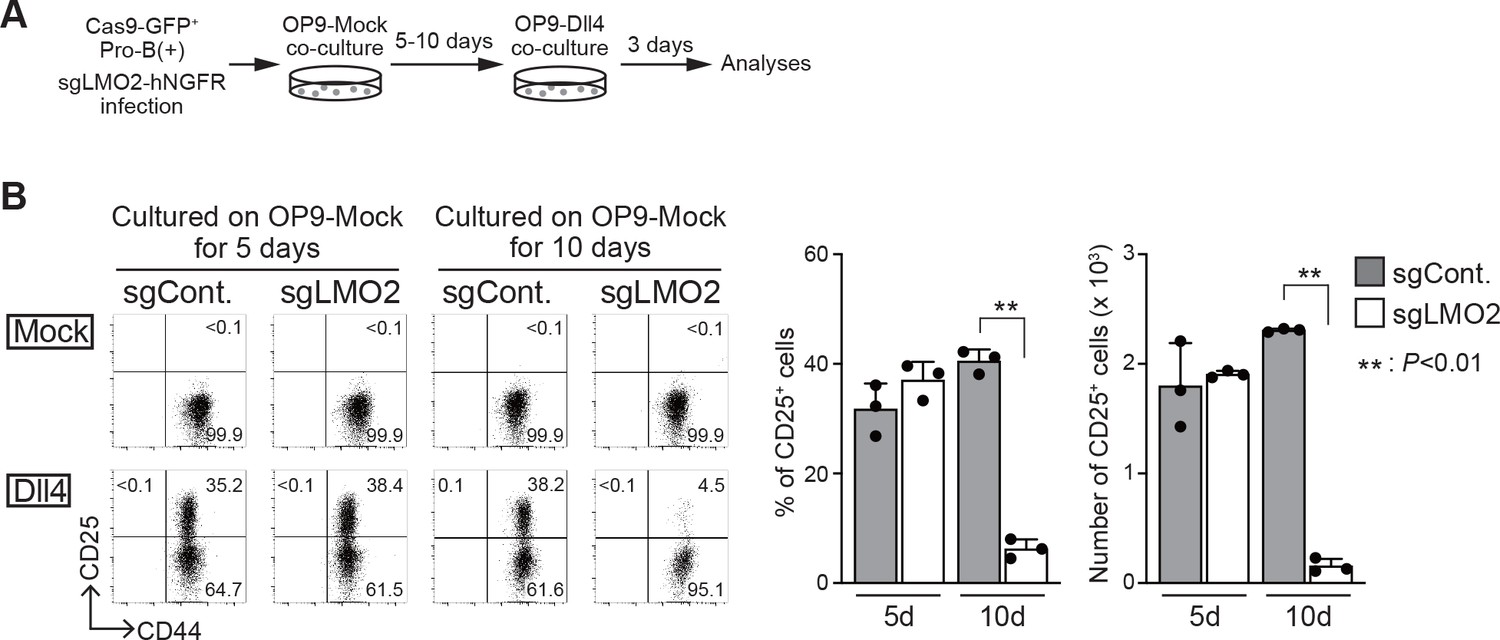
Loss of Lmo2 leads to the differentiation arrest in pro-B(+) cells.
(A) An experimental scheme for the deletion of Lmo2 using the CRISPR/Cas9 system in pro-B cell lines is shown. (B) Retroviral vectors encoding sgRNA against luciferase (sgCont.) or LMO2 (sgLMO2) were introduced into Cas9-expressing (GFP+) pro-B(+) cells. Five (cultured on OP9-Mock for 5 days, left panels) or 10 days (cultured on OP9-Mock for 10 days, right panels) after co-cultured on OP9-Mock cells following the infection, pro-B cells were cultured again on OP9-Mock (Mock) or OP9-Dll4 (Dll4) stromal cells for 3 days. GFP+hNGFR+ sgRNA-transduced cells were gated and analyzed for CD44 and CD25 expression (left). The percentages and numbers of CD25+ cells among GFP+hNGFR+ sgRNA-transduced cells, cultured on OP9-Dll4, are shown with SD (right). The data represent the mean values of three independent biological replicates. Each value is indicated by a closed circle. **p<0.01 by two-sided Student’s t-test.
-
Figure 2—source data 1
Raw data used to generate the graph in Figure 2B.
- https://cdn.elifesciences.org/articles/68227/elife-68227-fig2-data1-v1.xlsx
Figure 2—figure supplement 1
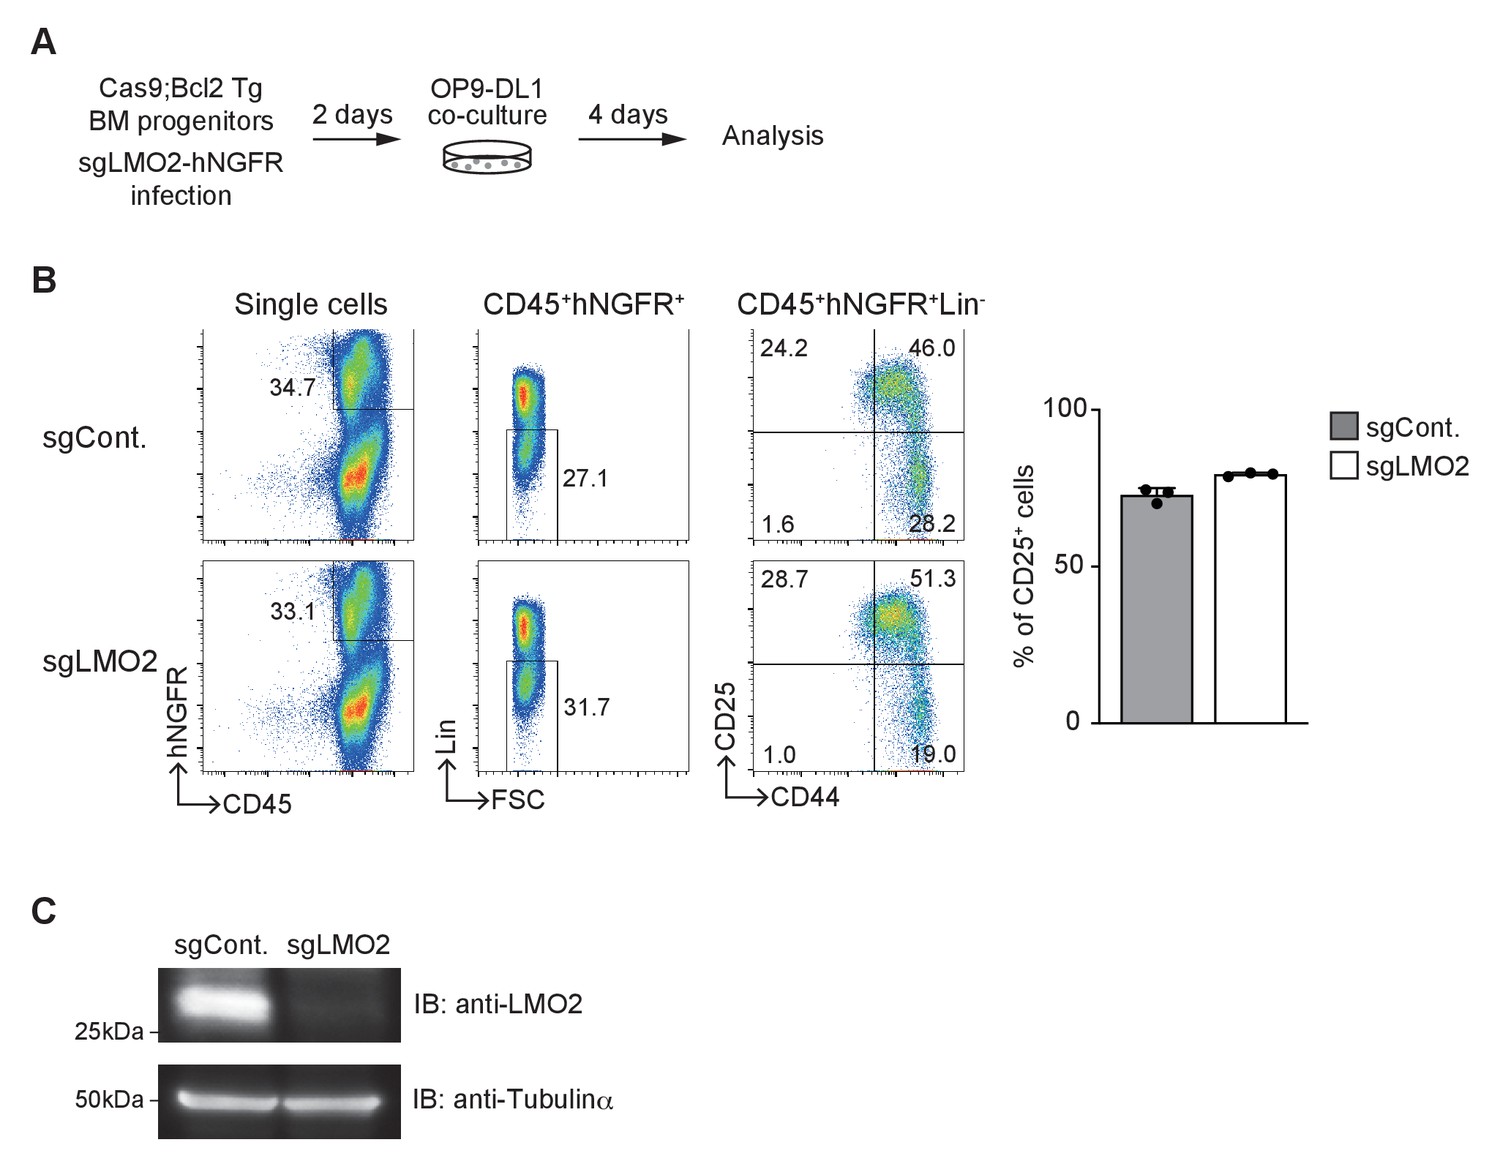
CRISPR/Cas9-mediated deletion of Lmo2 in BM progenitors.
(A) Experimental scheme for Lmo2 deletion in primary BM progenitor cells using the CRISPR/Cas9 system is shown. (B) Flow cytometric analysis of BM progenitors transduced with sgRNA and co-cultured with OP9-Dll1 for 4 days. Representative CD45/hNGFR (sgRNA) profiles in single cells, FSC/Lin profiles in CD45+hNGFR+ cells, and CD44/CD25 profiles in CD45+hNGFR+Lin- cells are shown. Results are representative of three biological replicates. Percentages of CD25+ cells among the CD45+hNGFR+Lin- cells are shown with SD (right). (C) Specific depletion of targeted LMO2 protein. Four days after sgRNA transduction in Figure 2A, lysates from retrovirus-infected GFP+hNGFR+ Pro-B(+) cells were subjected to immunoblotting for LMO2. Two independent experiments were performed with similar results.
-
Figure 2—figure supplement 1—source data 1
Original data used to generate the panels in Figure 2—figure supplement 1C.
- https://cdn.elifesciences.org/articles/68227/elife-68227-fig2-figsupp1-data1-v1.pdf
-
Figure 2—figure supplement 1—source data 2
Raw data used to generate the graph in Figure 2—figure supplement 1B.
- https://cdn.elifesciences.org/articles/68227/elife-68227-fig2-figsupp1-data2-v1.xlsx
Figure 3 with 1 supplement

LMO2 regulates survival of Ebf1-deficient pro-B cells via Bcl11a/Bcl2 pathway.
(A) RT-qPCR detection of Meis1, Hmga2, and Bcl11a transcripts in Lmo2- (red column), Meis1-transfected (green column) pro-B(−) cells, parent pro-B(−) (black column), and pro-B(+) (white column) cells, as shown in Figure 1B. Two independent experiments were performed with similar results. (B) Overexpression of Bcl2 improves cell survival of pro-B(−) cells. Pro-B(+) cells (open column) and empty vector (mock) or human BCL2 (Bcl2)-transduced pro-B(−) cells were cultured on OP9-Mock or OP9-Dll4 for 2 days. After culturing, the dead cells were detected by staining for Annexin V and 7-AAD in CD45+ and hNGFR+ (retrovirus-infected) cell populations (Figure 3—figure supplement 1). The cell death index was calculated as the difference in the percentage of dead cells in pro-B cells after co-culturing with OP9-Mock and OP9-Dll4. The data represent the mean values of three independent biological replicates with SD. **p<0.01 by two-sided Student’s t-test. (C) Bcl2 overexpression does not provide differentiation potential in pro-B(−) cells. Pro-B(−) or pro-B(+) cells with human BCL2 (pro-B(−)/Bcl2, pro-B(+)/Bcl2) were cultured on OP9-Dll4 as shown in Figure 1D. After culturing, the live cells were analyzed for the expression of CD44 and CD25 (left). The data represent the mean values of percentages of CD25+ cells in three independent biological replicates with SD (right). ***p<0.001 by two-sided Student’s t-test.
-
Figure 3—source data 1
Raw data used to generate the graph in Figure 3A.
- https://cdn.elifesciences.org/articles/68227/elife-68227-fig3-data1-v1.xlsx
-
Figure 3—source data 2
Raw data used to generate the graph in Figure 3B.
- https://cdn.elifesciences.org/articles/68227/elife-68227-fig3-data2-v1.xlsx
-
Figure 3—source data 3
Raw data used to generate the graph in Figure 3C.
- https://cdn.elifesciences.org/articles/68227/elife-68227-fig3-data3-v1.xlsx
Figure 3—figure supplement 1
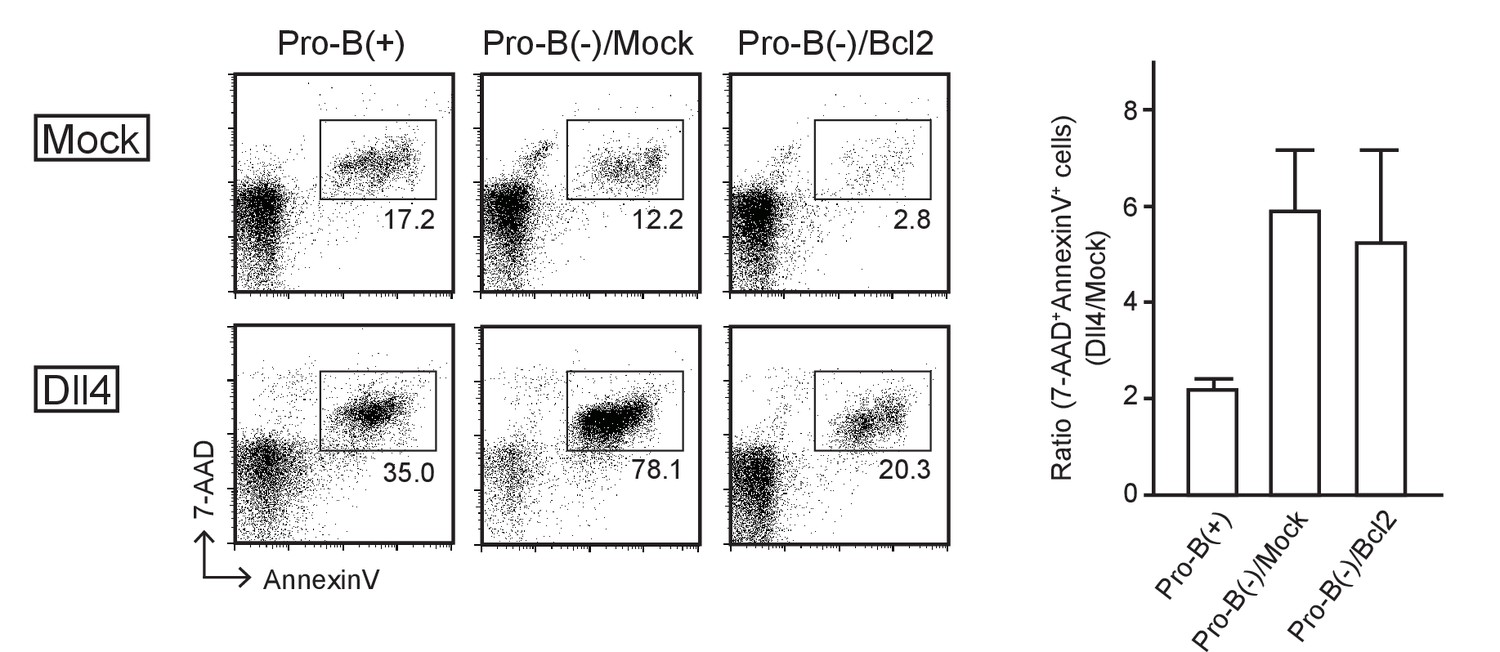
Overexpression of Bcl2 improves the cell survival in pro-B(−) cells.
Pro-B(+) cells and empty vector (mock) or human BCL2-transduced pro-B(−) cells (pro-B(−)/Mock or pro-B(−)/Bcl2) were cultured on OP9-Mock (Mock) or OP9-Dll4 (Dll4) for 2 days. After the cultures, the dead cells were detected by the staining of both AnnexinV and 7-AAD in CD45+ and hNGFR+ (retrovirus-infected) cell population. Numbers in the profiles indicate the relative percentages for each corresponding fraction. Three independent experiments were performed with similar results. The ratio of AnnexinV+7-AAD+ cells in pro-B cells co-cultured with OP9-Mock and OP9-Dll4 (OP9-Dll4/OP9-Mock) is shown with SD (right).
-
Figure 3—figure supplement 1—source data 1
Raw data used to generate the graph in Figure 3—figure supplement 1.
- https://cdn.elifesciences.org/articles/68227/elife-68227-fig3-figsupp1-data1-v1.xlsx
Figure 4 with 1 supplement
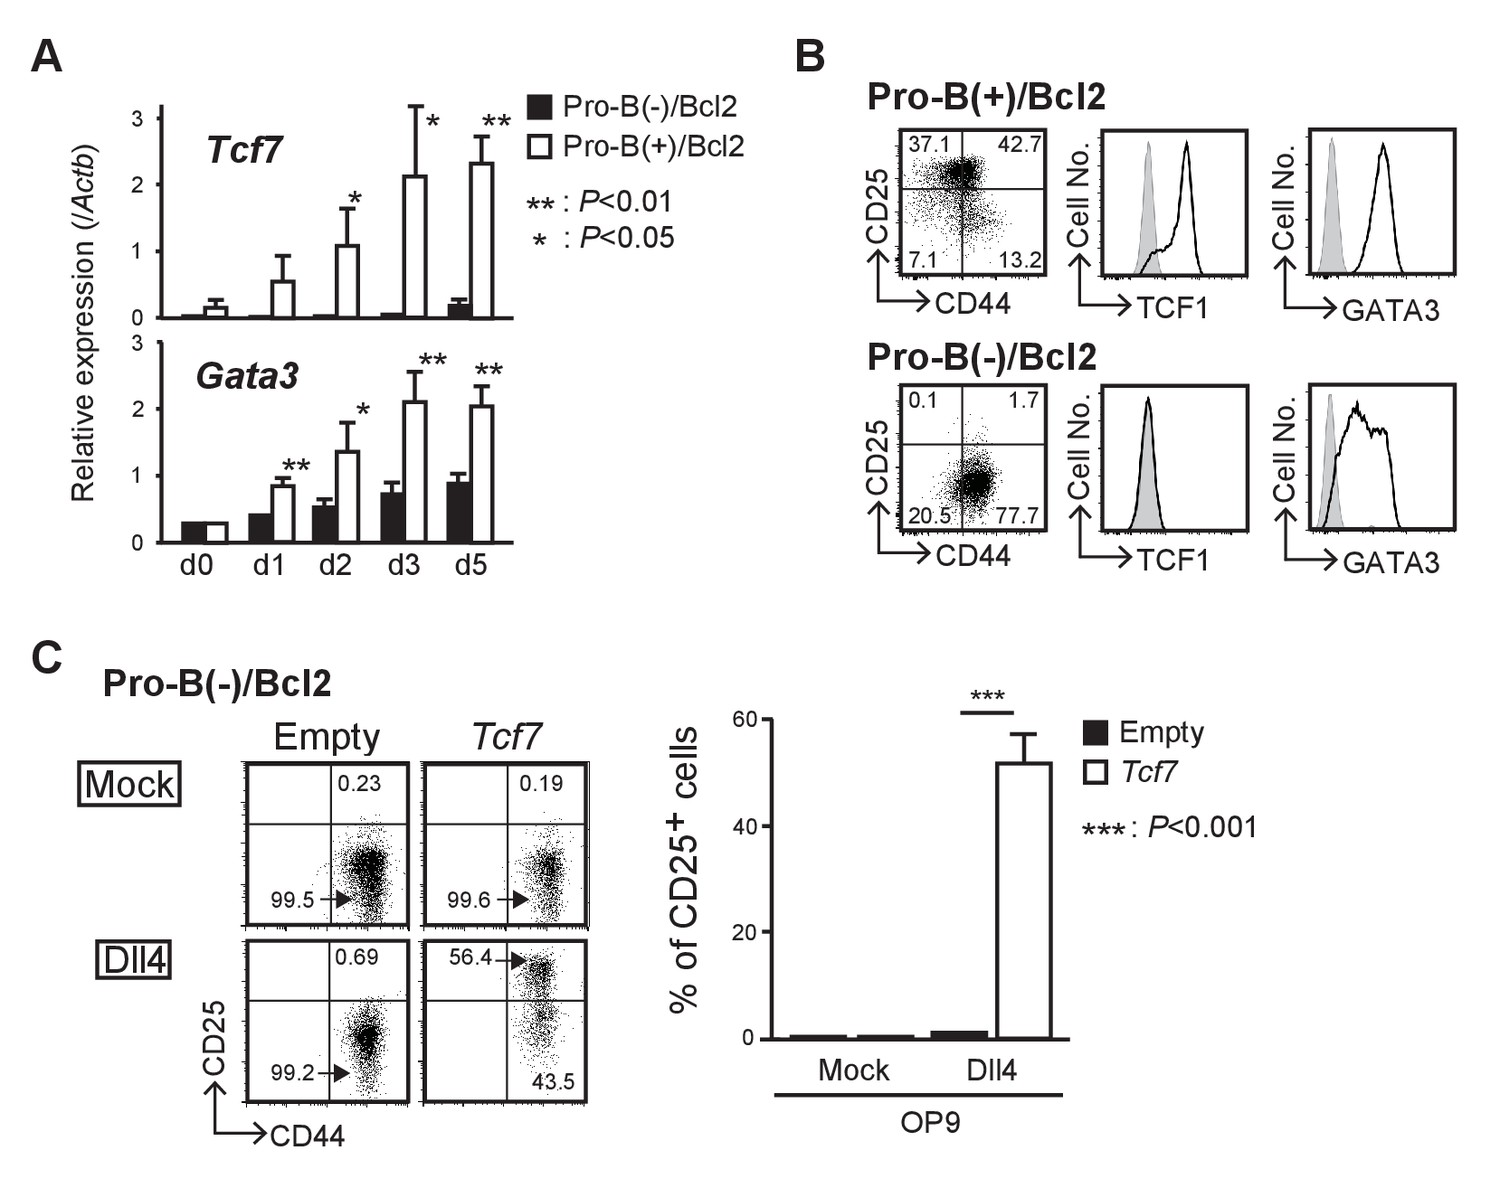
LMO2 is required for activation of Tcf7 after Notch signaling.
(A) Expression levels of Tcf7 and Gata3 in pro-B(−) and pro-B(+) cells with exogenous BCL2, at 0–5 days after the culture on OP9-Dll4, were analyzed by RT-qPCR. The relative expression (/Actb) is shown with SD. *p<0.05, **p<0.01 by two-sided Student’s t-test. (B) Intracellular staining of TCF1 or GATA3 in pro-B(+)/Bcl2 (upper panels) and pro-B(−)/Bcl2 (lower panels) was performed at day 7 after Notch stimulation; representative expression profiles of CD44 and CD25 are also shown (left). Results are representative of three independent experiments. (C) Introduction of Tcf7 provides differentiation potential for T-cell lineage to pro-B(−)/Bcl2. Pro-B(−)/Bcl2 cells were infected with either empty control or Tcf7-containing lentivirus, and the cells were co-cultured on OP9-Mock (upper panels) or OP9-Dll4 (lower panels) for 3 days. Lentivirus-infected cells were analyzed for the expression of CD44 and CD25. Three independent experiments were performed with similar results. The percentages of CD25+ cells are shown with SD (right). ***p<0.001 by two-sided Student’s t-test.
-
Figure 4—source data 1
Raw data used to generate the graph in Figure 4A.
- https://cdn.elifesciences.org/articles/68227/elife-68227-fig4-data1-v1.xlsx
-
Figure 4—source data 2
Raw data used to generate the graph in Figure 4C.
- https://cdn.elifesciences.org/articles/68227/elife-68227-fig4-data2-v1.xlsx
Figure 4—figure supplement 1
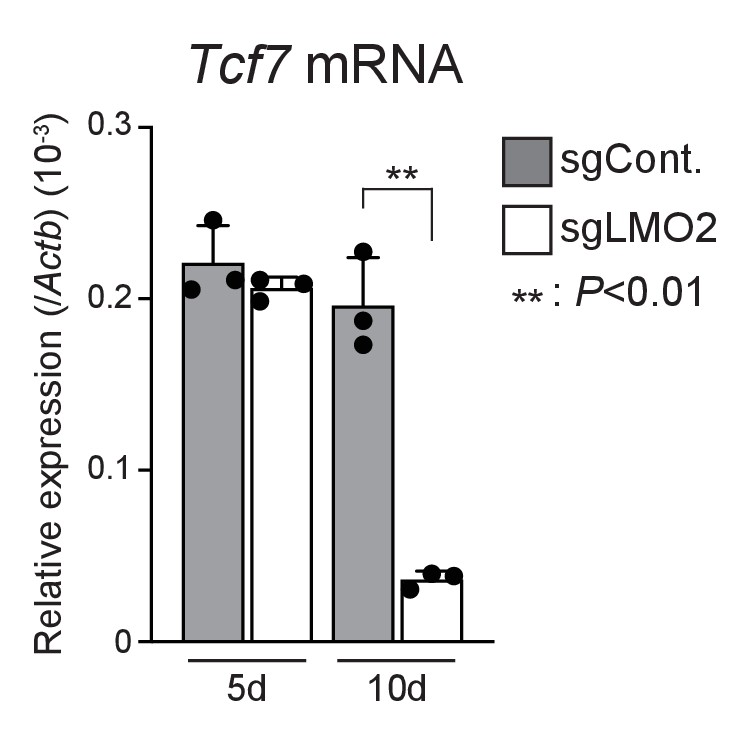
Down-regulation of Tcf7 in Lmo2-deficient pro-B(+) cells.
Expression levels of Tcf7 in Cas9-expressing pro-B(+) cells co-cultured with OP9-Mock for 5 or 10 days after sgRNA transduction (Figure 2A) were analyzed using RT-qPCR.
Relative expression of Actb is shown with SD. *p<0.05, **p<0.01 by two-sided Student’s t-test. Data are based on three biological replicates.
-
Figure 4—figure supplement 1—source data 1
Raw data used to generate the graph in Figure 4—figure supplement 1.
- https://cdn.elifesciences.org/articles/68227/elife-68227-fig4-figsupp1-data1-v1.xlsx
Figure 5 with 1 supplement
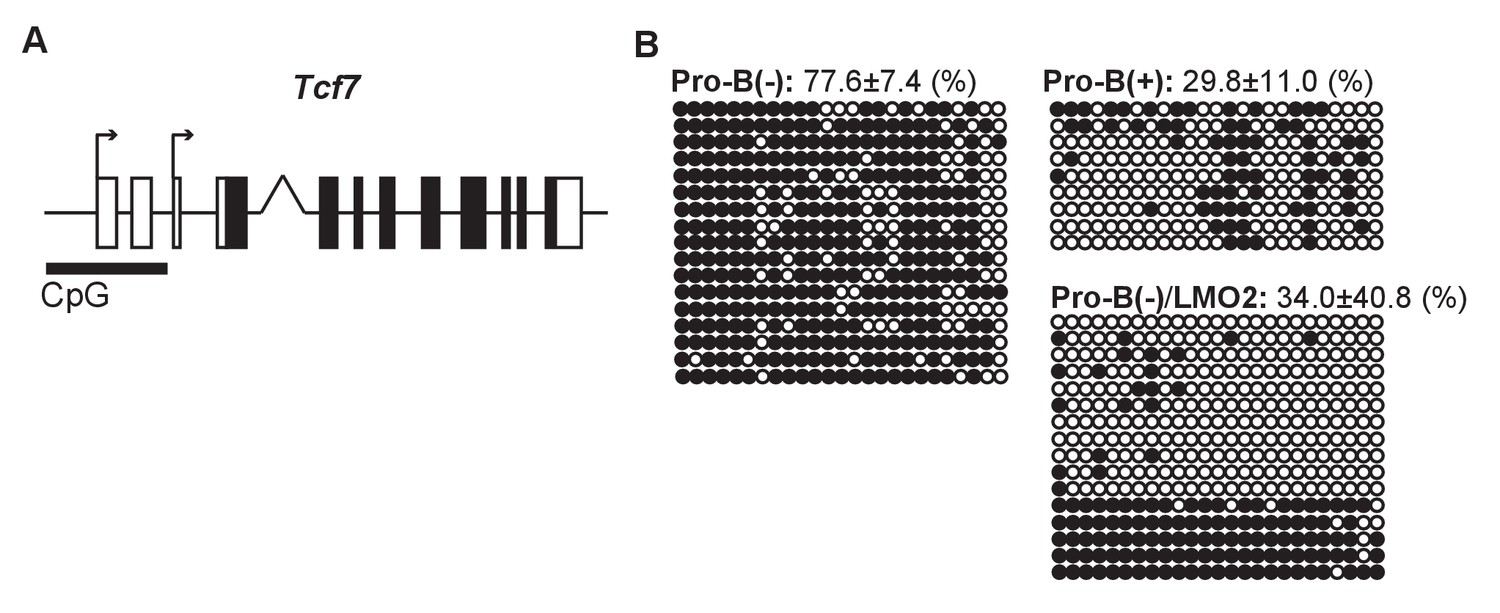
DNA methylation status of the Tcf7 locus is maintained by LMO2.
(A) A CpG island at the transcriptional start sites (TSSs) of the Tcf7 locus, which contains 25 potential CpG methylation sites. (B) The DNA methylation status of CpG island at the TSSs of the Tcf7 locus was determined by bisulfite sequencing in pro-B(−), pro-B(+), and LMO2-transduced pro-B(−) cells (pro-B(−)/LMO2). Bisulfite-converted genomic DNA around the TSSs of Tcf7 was amplified using PCR, and each PCR product was sequenced. The 25 horizontal circles each represent a CpG sequence derived from a single PCR product (17 clones from pro-B(−) cells, 9 clones from pro-B(+) cells, and 16 clones from pro-B(−)/LMO2 cells). Closed and open circles indicate methylated and demethylated CpG sites, respectively. The frequencies of the methylated CpGs are shown with SD. Data are based on two independent pooled experiments.
Figure 5—figure supplement 1
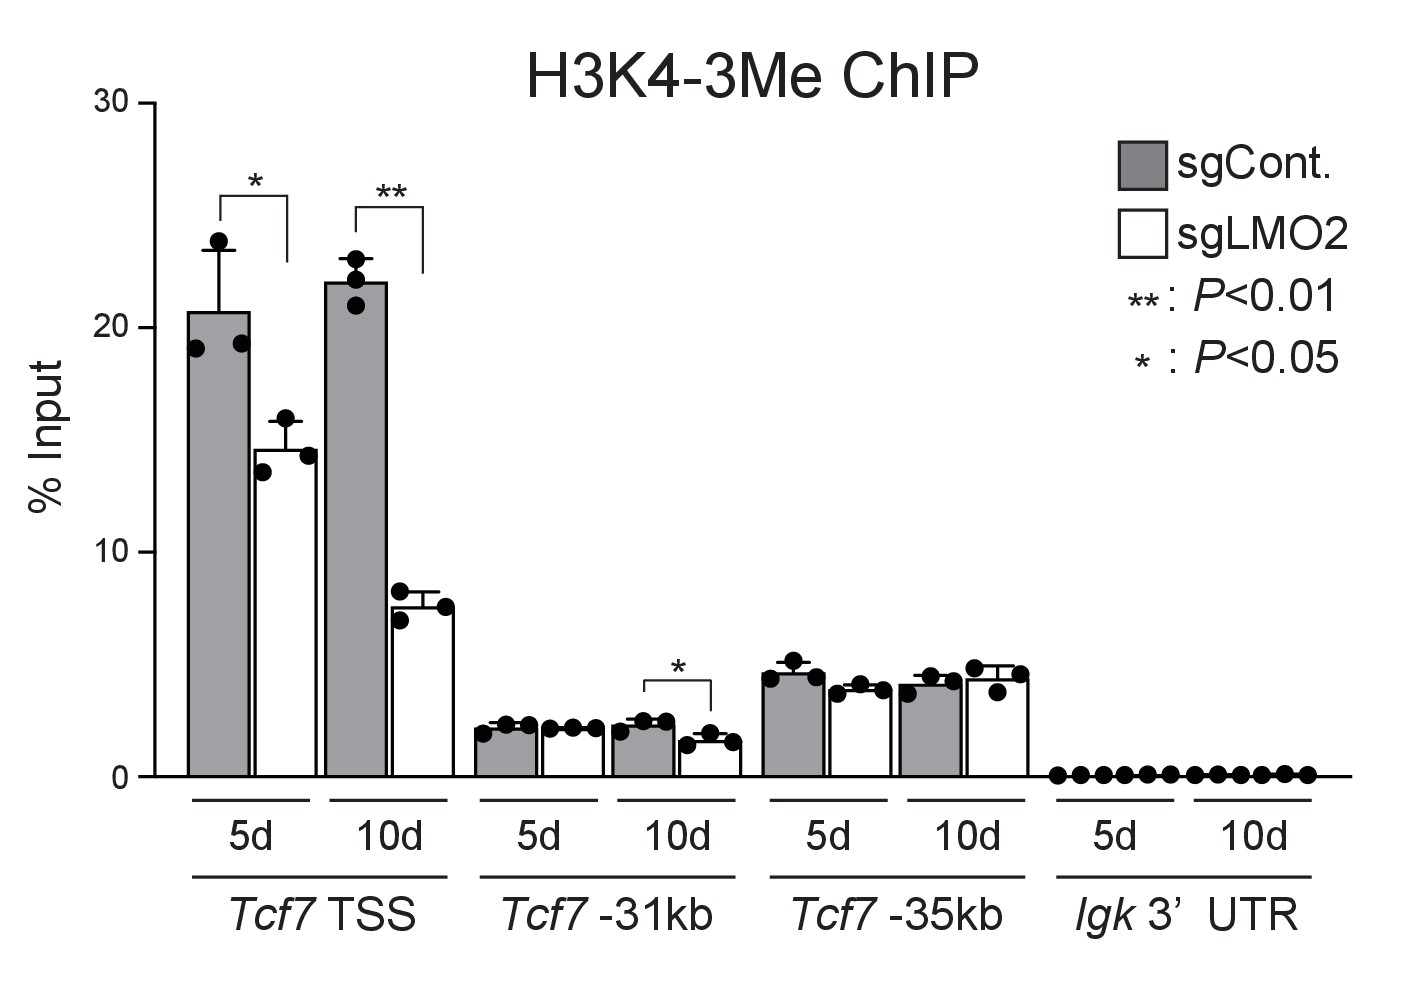
H3K4-3Me levels around the Tcf7 locus in Lmo2-deficient cells.
Cas9-expressing pro-B(+) cells were co-cultured with OP9-Mock for 5 or 10 days after sgRNA transduction (Figure 2A) and then purified.
H3K4-3Me levels around the Tcf7 locus were determined using the ChIP assay and qPCR analysis. The mean values (% input) are shown with SD. Data are based on three independent experiments. *p<0.05, **p<0.01 by two-sided Student’s t-test.
-
Figure 5—figure supplement 1—source data 1
Raw data used to generate the graph in Figure 5—figure supplement 1.
- https://cdn.elifesciences.org/articles/68227/elife-68227-fig5-figsupp1-data1-v1.xlsx
Figure 6 with 1 supplement
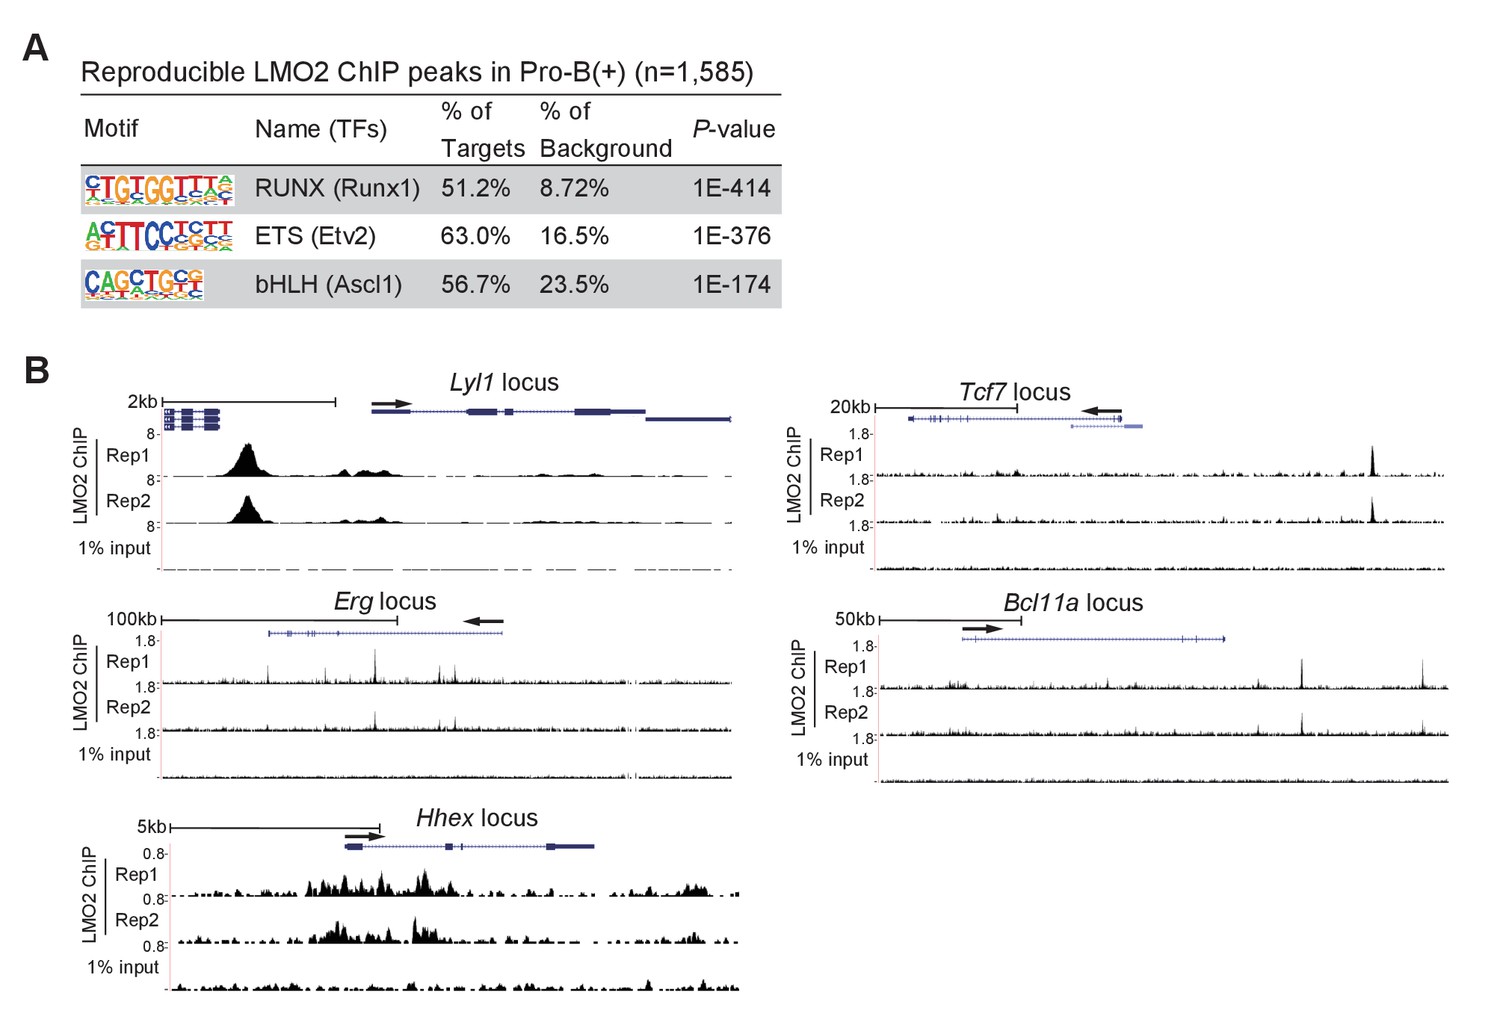
LMO2 binds to the upstream region of the Tcf7 locus.
(A) LMO2 ChIP-seq analyses were performed using the pro-B(+) cell line. The top three enriched sequence motifs among the 1585 reproducible LMO2 peaks are shown. Data are based on ChIP-seq peaks scored as reproducible in two replicate samples. (B) ChIP-seq tracks showing two replicates of LMO2 binding profiles around the Lyl1, Erg, Hhex, Tcf7, and Bcl11a loci in pro-B(+) cell line with tracks for 1% input.
Figure 6—figure supplement 1
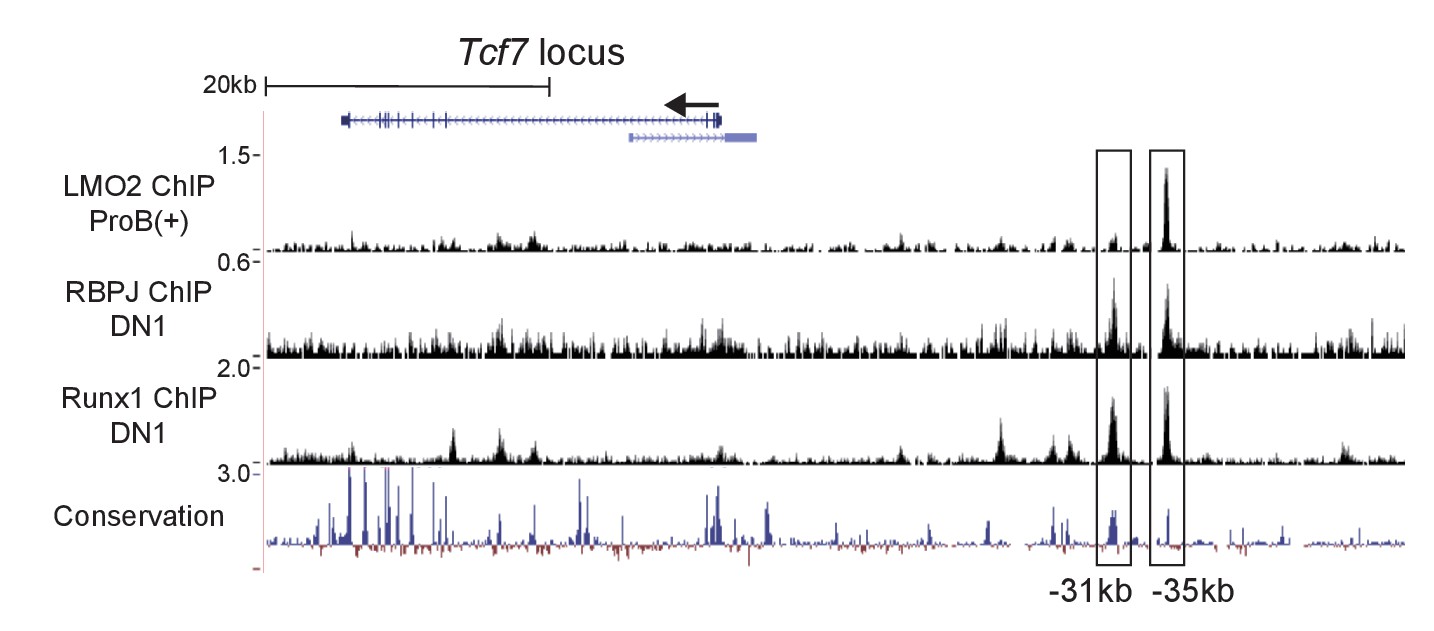
LMO2 binds to one of the RBPJ and Runx1 binding sites at the Tcf7 locus.
ChIP-seq tracks show binding profiles of LMO2 in pro-B(+) cells, and RBPJ and Runx1 in DN1 cells (GSE148441, GSE110020) around the Tcf7 locus. The conservation track is also shown at the bottom. The −31 and −35 kb RBPJ binding sites are labeled with rectangles. Data are representative of two independent experiments.
Tables
Key resources table
| Reagent type (species) or resource | Designation | Source or reference | Identifiers | Additional information |
|---|---|---|---|---|
| Genetic reagent (Mus musculus) | Ebf1+/- | Pongubala et al., 2008 | Provided by Dr. Grosschedl, Max Planck Institute of Immunobiology and Epigenetics | |
| Genetic reagent (Mus musculus) | B6.Cg-Tg(BCL2)25Wehi/J | Jackson Laboratory | Stock# 002320 | |
| Genetic reagent (Mus musculus) | B6.Gt(ROSA)26Sortm1.1(CAG-cas9*,-EGFP)Fezh/J | Jackson Laboratory | Stock# 024858 | |
| Cell line (Mus musculus) | OP9 | Yokoyama et al., 2013 | Stromal cell line derived from fetal murine calvaria (B6 x C3H, op/op) | |
| Cell line (Mus musculus) | TD7 | This paper | Mouse fetal thymus (B6, E15.5)-derived mesenchymal cell line | |
| Cell line (Mus musculus) | Pro-B(+) | This paper | Ebf1-deficient fetal liver-derived hematopoietic progenitor cell line | |
| Cell line (Mus musculus) | Pro-B(−) | This paper | Ebf1-deficient fetal liver-derived hematopoietic progenitor cell line | |
| Cell line (Mus musculus) | OP9-Dll4 | Hirano et al., 2020 | ||
| Cell line (Homo sapiens) | HEK293T | Hirano et al., 2020 | RRID:CVCL_0063 | |
| Cell line (Homo sapiens) | PLAT-E | Hirano et al., 2020 | RRID:CVCL_B488 | |
| Antibody | FITC anti-mouse CD4 (Rat monoclonal) | BD Biosciences | Cat# 561835 RRID:AB_10894386 | FC (1:500) |
| Antibody | PE anti-mouse CD4 (Rat monoclonal) | BD Biosciences | Cat# 561829 RRID:AB_10926205 | FC (1:500) |
| Antibody | APC anti-mouse CD8a (Rat monoclonal) | BioLegend | Cat# 100711 RRID:AB_312750 | FC (1:500) |
| Antibody | APCCy7 anti-mouse CD8a (Rat monoclonal) | BioLegend | Cat# 100713 RRID:AB_312752 | FC (1:500) |
| Antibody | PerCpCy5.5 anti-mouse CD11b (Rat monoclonal) | BioLegend | Cat# 101227 RRID:AB_893233 | FC (1:500) |
| Antibody | PECy7 anti-mouse CD19 (Rat monoclonal) | Tonbo Biosciences | Cat# 60-0193 RRID:AB_2621840 | FC (1:250) |
| Antibody | PerCpCy5.5 anti-mouse CD25 (Rat monoclonal) | eBioscience | Cat# 45-0251-82 RRID:AB_914324 | FC (1:1000) |
| Antibody | APC-e780 anti-mouse CD25 (Rat monoclonal) | eBioscience | Cat# 47-0251-82 RRID:AB_1272179 | FC (1:200) |
| Antibody | FITC anti-mouse CD44 (Rat monoclonal) | BioLegend | Cat# 103005 RRID:AB_312956 | FC (1:500) |
| Antibody | APCCy7 anti-mouse CD44 (Rat monoclonal) | BioLegend | Cat# 103027 RRID:AB_830784 | FC (1:500) |
| Antibody | PECy7 anti-mouse CD45 (Rat monoclonal) | eBioscience | Cat# 25-0451-82 RRID:AB_2734986 | FC (1:400) |
| Antibody | APC anti-mouse CD45 (Rat monoclonal) | BioLegend | Cat# 103111 RRID:AB_312976 | FC (1:1000) |
| Antibody | PE anti-mouse CD45.1 (Mouse monoclonal) | BioLegend | Cat# 110727 RRID:AB_893348 | FC (1:250) |
| Antibody | PerCpCy5.5 anti-mouse CD45.2 (Mouse monoclonal) | BioLegend | Cat# 109807 RRID:AB_313444 | FC (1:250) |
| Antibody | PerCpCy5.5 anti-mouse B220 (Rat monoclonal) | BioLegend | Cat# 103235 RRID:AB_893356 | FC (1:200) |
| Antibody | APCCy7 anti-mouse Thy1.2 (Rat monoclonal) | BioLegend | Cat# 105327 RRID:AB_10613280 | FC (1:1000) |
| Antibody | FITC anti-mouse Gr-1 (Rat monoclonal) | BioLegend | Cat# 108405 RRID:AB_313370 | FC (1:500) |
| Antibody | Biotin anti-mouse Gr-1 (Rat monoclonal) | eBioscience | Cat# 13-5931-86 RRID:AB_466802 | FC (1:300) |
| Antibody | Biotin anti-mouse TER119 (Rat monoclonal) | eBioscience | Cat# 13-5921-85 RRID:AB_466798 | FC (1:300) |
| Antibody | Biotin anti-mouse CD11b (Rat monoclonal) | eBioscience | Cat# 13-0112-86 RRID:AB_466361 | FC (1:300) |
| Antibody | Biotin anti-mouse CD11c (Armenian Hamster monoclonal) | eBioscience | Cat# 13-0114-85 RRID:AB_466364 | FC (1:300) |
| Antibody | Biotin anti-mouse CD19 (Rat monoclonal) | eBioscience | Cat# 13-0193-85 RRID:AB_657658 | FC (1:300) |
| Antibody | Biotin anti-mouse NK1.1 (Rat monoclonal) | eBioscience | Cat# 13-5941-85 RRID:AB_466805 | FC (1:300) |
| Antibody | Biotin anti-mouse CD3ε (Armenian Hamster monoclonal) | eBioscience | Cat# 13-0031-82 RRID:AB_466319 | FC (1:300) |
| Antibody | PE anti-rat CD2 (Mouse monoclonal) | BioLegend | Cat# 201305 RRID:AB_2073811 | FC (1:500) |
| Antibody | PE anti-human NGFR (Mouse monoclonal) | eBioscience | Cat# 12-9400-42 RRID:AB_2572710 | FC (1:500) |
| Antibody | PE Hamster IgG (Armenian Hamster monoclonal) | BioLegend | Cat# 400907 RRID:AB_326593 | FC (1:200) |
| Antibody | PE anti-mouse Notch1 (Armenian Hamster monoclonal) | BioLegend | Cat# 130607 RRID:AB_1227719 | FC (1:200) |
| Antibody | PE anti-mouse Notch2 (Armenian Hamster monoclonal) | BioLegend | Cat# 130707 RRID:AB_1227725 | FC (1:200) |
| Antibody | PE anti-mouse Notch3 (Armenian Hamster monoclonal) | BioLegend | Cat# 130507 RRID:AB_1227733 | FC (1:200) |
| Antibody | PE anti-mouse Notch4 (Armenian Hamster monoclonal) | BioLegend | Cat# 128407 RRID:AB_1133997 | FC (1:200) |
| Antibody | Alexa Fluor 647 Mouse IgG1 (Mouse monoclonal) | BioLegend | Cat# 400130 RRID:AB_2800436 | FC (2 µl per test) |
| Antibody | Alexa Fluor 647 anti-GATA3 (Mouse monoclonal) | BD Biosciences | Cat# 560068 RRID:AB_1645316 | FC (8 µl per test) |
| Antibody | Rabbit-IgG (Rabbit monoclonal) | Cell Signaling Technology | Cat# 3900 RRID:AB_1550038 | FC (1:500) |
| Antibody | Anti-TCF1 (Rabbit monoclonal) | Cell Signaling Technology | Cat# 2203 RRID:AB_2199302 | FC (1:100) |
| Antibody | Anti-LMO2 (Rabbit monoclonal) | Abcam | Cat# ab91652 RRID:AB_2049879 | FC (1:200) ChIP (2ug/sample) |
| Antibody | Anti-c-Myc (Rabbit monoclonal) | Cell Signaling Technology | Cat# 5605 RRID:AB_1903938 | FC (1:100) |
| Antibody | DyLight 488 anti-rabbit IgG (Donkey polyclonal) | BioLegend | Cat# 406404 RRID:AB_1575130 | FC (1:250) |
| Antibody | DyLight 649 anti-rabbit IgG (Donkey polyclonal) | BioLegend | Cat# 406406 RRID:AB_1575135 | FC (1:500) |
| Antibody | Anti-Tubulinα (Mouse monoclonal) | Sigma | Cat# T6199 RRID:AB_477583 | WB (1:1000) |
| Antibody | Anti-LMO2 (Mouse monoclonal) | Novus | Cat# NB110-78626 RRID:AB_1084895 | WB (1:1000) ChIP (2 µg/sample) |
| Antibody | Anti-human LMO2 (Goat polyclonal) | R&D Systems | Cat# AF2726 RRID:AB_2249968 | ChIP (2 µg/sample) |
| Antibody | Anti-H3K4me3 (Rabbit polyclonal) | Millipore | Cat# 07-473 RRID:AB_1977252 | ChIP (5 µl/sample) |
| Recombinant DNA reagent (plasmid) | pCMV-VSV-G-RSV-Rev | RIKEN BRC | Cat# RDB04393 | Lentiviral packaging plasmid |
| Recombinant DNA reagent (plasmid) | pCAG-HIVgp | RIKEN BRC | Cat# RDB04394 | Lentiviral packaging plasmid |
| Recombinant DNA reagent (plasmid) | pLVS-EF-IR2 | This paper | Lentiviral vector with IRES-rat CD2 | |
| Recombinant DNA reagent (plasmid) | mLmo2/pLVS-EF-IR2 | This paper | pLVS-EF-IR2 Lentiviral vector encoding mLmo2 | |
| Recombinant DNA reagent (plasmid) | mTcf7/pLVS-EF-IR2 | This paper | pLVS-EF-IR2 Lentiviral vector encoding mTcf7 | |
| Recombinant DNA reagent (plasmid) | GCDN | Hirano et al., 2015 | Retroviral vector with IRES-human NGFR | |
| Recombinant DNA reagent (plasmid) | hBCL2/GCDN | This paper | GCDN Retroviral vector encoding hBCL2 | |
| Recombinant DNA reagent (plasmid) | mMeis1/GCDN | This paper | GCDN Retroviral vector encoding mMeis1 | |
| Recombinant DNA reagent (plasmid) | mHmga2/GCDN | This paper | GCDN Retroviral vector encoding mHmga2 | |
| Recombinant DNA reagent (plasmid) | Cas9-GFP | Hosokawa et al., 2018 | Retroviral vector to express Cas9 and GFP | |
| Recombinant DNA reagent (plasmid) | E42-dTet | Hosokawa et al., 2018 | Retroviral vector to express sgRNA and human NGFR | |
| Recombinant DNA reagent (plasmid) | sgRNA against Luciferase (control) | Hosokawa et al., 2018 | 5’-ggcatttcgcag cctaccg-3’ | |
| Recombinant DNA reagent (plasmid) | sgRNA against LMO2 #1 | This paper | 5’-tcgatggccgag gacattg-3’ | |
| Recombinant DNA reagent (plasmid) | sgRNA against LMO2 #2 | This paper | 5’-aatgtcctcggc catcgaa-3’ | |
| Recombinant DNA reagent (plasmid) | sgRNA against LMO2 #3 | This paper | 5’-gaaagccatcga ccagtac-3’ | |
| Sequence-based reagent | ActB (Forward) | This paper | PCR primers | 5’-tacagcccgggg agcat-3’ |
| Sequence-based reagent | ActB (Reverse) | This paper | PCR primers | 5’-acacccgccac cagttc-3’ |
| Sequence-based reagent | Meis1 (Forward) | This paper | PCR primers | 5’-gacgctttaaag agagataaagatgc-3’ |
| Sequence-based reagent | Meis1 (Reverse) | This paper | PCR primers | 5’- catttctcaaa aatcagtgctaaga -3’ |
| Sequence-based reagent | Hmga2 (Forward) | This paper | PCR primers | 5’-aaggcagcaaaa acaagagc-3’ |
| Sequence-based reagent | Hmga2 (Reverse) | This paper | PCR primers | 5’-gccgtttttctc caatggt-3’ |
| Sequence-based reagent | Bcl11a (Forward) | This paper | PCR primers | 5’-ccaaacaggaac acacatagcaga-3’ |
| Sequence-based reagent | Bcl11a (Reverse) | This paper | PCR primers | 5’-ggggattagagc tccgtgt-3’ |
| Sequence-based reagent | Gata3 (Forward) | This paper | PCR primers | 5’-ttatcaagccca agcgaag-3’ |
| Sequence-based reagent | Gata3 (Reverse) | This paper | PCR primers | 5’-tggtggtggtct gacagttc-3’ |
| Sequence-based reagent | Lmo2 (Forward) | This paper | PCR primers | 5’-gaggcgcctcta ctacaa-3’ |
| Sequence-based reagent | Lmo2 (Reverse) | This paper | PCR primers | 5’-gatccgcttgtcacaggatg-3’ |
| Sequence-based reagent | Tcf7 (Forward) | This paper | PCR primers | 5’-cagctcccccatactgtgag-3’ |
| Sequence-based reagent | Tcf7 (Reverse) | This paper | PCR primers | 5’-tgctgtctatatccgcaggaa-3’ |
| Sequence-based reagent | Tcf7 promoter region (Forward) | This paper | PCR primers | 5’-ttaagtttttattggtgaatgagtt-3’ |
| Sequence-based reagent | Tcf7 promoter region (Reverse) | This paper | PCR primers | 5’-aaaaaactccaaaaataaaacccac-3’ |
| Sequence-based reagent | Tcf7 TSS (Forward) | This paper | PCR primers | 5’-gcagcaagggttgcattt-3’ |
| Sequence-based reagent | Tcf7 TSS (Reverse) | This paper | PCR primers | 5’-ttgtctgtactgggctgtttacat-3’ |
| Sequence-based reagent | Tcf7 -31kb (Forward) | This paper | PCR primers | 5’-ttccatccaccgttttgttt-3’ |
| Sequence-based reagent | Tcf7 -31kb (Reverse) | This paper | PCR primers | 5’-ggcgtgtggtgggaatacta-3’ |
| Sequence-based reagent | Tcf7 -35kb (Forward) | This paper | PCR primers | 5’-ctgcaagcagctggaagtc-3’ |
| Sequence-based reagent | Tcf7 -35kb (Reverse) | This paper | PCR primers | 5’-cactggaagctgtgagtgatg-3’ |
| Sequence-based reagent | Igk 3’UTR (Forward) | This paper | PCR primers | 5’-ggcacatctgttgctttcgc -3’ |
| Sequence-based reagent | Igk 3’UTR (Reverse) | This paper | PCR primers | 5’-ggggtaggga gcaggtgtat-3’ |
| Peptide, recombinant protein | PerCpCy5.5 streptavidin | BioLegend | Cat# 405214 | FC (1:200) |
| Peptide, recombinant protein | Recombinant Mouse SCF | PeproTech | Cat# 250-03 | |
| Peptide, recombinant protein | Recombinant Human FLT3L | PeproTech | Cat# 300-19 | |
| Peptide, recombinant protein | Recombinant Mouse IL-7 | PeproTech | Cat# 217-17 | |
| Commercial assay or kit | Foxp3 / Transcription Factor Staining Set | eBioscience | Cat# 00-5523-00 | Used to detect TCF1 and GATA3 |
| Commercial assay or kit | Fixation/Permeabilization Solution Kit with BD GolgiStop | BD Biosciences | Cat# 554715 | Used to detect Lmo2 and c-Myc |
| Commercial assay or kit | Permeabilization Buffer Plus | BD Biosciences | Cat# 561651 | Used to detect Lmo2 and c-Myc |
| Commercial assay or kit | High Capacity cDNA Reverse Transcription Kit | Thermo Fisher Scientific | Cat# 4368814 | |
| Commercial assay or kit | NucleoSpin Tissue | TaKaRa Bio | Cat# 740952.50 | |
| Commercial assay or kit | MethylEasy Xceed | TaKaRa Bio | Cat# ME002 | |
| Commercial assay or kit | TaKaRa EpiTaq HS (for bisulfite-treated DNA) | TaKaRa Bio | Cat# R110A | |
| Commercial assay or kit | Mighty TA-cloning kit | TaKaRa Bio | Cat# 6028 | |
| Commercial assay or kit | Anti-Biotin MicroBeads | Miltenyi Biotec | Cat# 130-090-485 | |
| Commercial assay or kit | Dynabeads Protein A | Thermo Fisher Scientific | Cat# 10001D | |
| Commercial assay or kit | Dynabeads Protein G | Thermo Fisher Scientific | Cat# 10003D | |
| Commercial assay or kit | Dynabeads M-280 Sheep Anti-Rabbit IgG | Thermo Fisher Scientific | Cat# 11203D | |
| Commercial assay or kit | NE-PER Nuclear and Cytoplasmic Extraction Reagents | Pierce | Cat# 78833 | |
| Commercial assay or kit | PCR purification Kit | Qiagen | Cat# 28004 | |
| Commercial assay or kit | Fast SYBR Green Master Mix | Thermo Fisher Scientific | Cat# 4385614 | |
| Commercial assay or kit | NEBNext Ultra II DNA Library Prep with Sample Purification Beads | NEB | Cat# E7103S | |
| Commercial assay or kit | NEBNext Multiplex Oligos for Illumina | NEB | Cat# E7500S | |
| Chemical compound, drug | Trizol reagent | Thermo Fisher Scientific | Cat# 15596026 | |
| Chemical compound, drug | 7-AAD | BioLegend | Cat# 420403 | FC (1:50) |
| Chemical compound, drug | Alexa Fluor 647 Annexin V | BioLegend | Cat# 640911 | FC (1:40) |
| Chemical compound, drug | DSG (disuccinimidyl glutarate) | Thermo Fisher Scientific | Cat# 20593 | 1 mg/ml |
| Software, algorithm | FlowJo | BD Biosciences | RRID:SCR_008520 |
Additional files
-
Supplementary file 1
Microarray analysis of pro-B(+) and pro-B(−) cells.
- https://cdn.elifesciences.org/articles/68227/elife-68227-supp1-v1.xlsx
-
Transparent reporting form
- https://cdn.elifesciences.org/articles/68227/elife-68227-transrepform-v1.docx
Download links
A two-part list of links to download the article, or parts of the article, in various formats.
Downloads (link to download the article as PDF)
Open citations (links to open the citations from this article in various online reference manager services)
Cite this article (links to download the citations from this article in formats compatible with various reference manager tools)
LMO2 is essential to maintain the ability of progenitors to differentiate into T-cell lineage in mice
eLife 10:e68227.
https://doi.org/10.7554/eLife.68227


