Stimulus-specific plasticity in human visual gamma-band activity and functional connectivity
- Ernst Strüngmann Institute (ESI) for Neuroscience in Cooperation with Max Planck Society, Germany
- International Max Planck Research School for Neural Circuits, Germany
- Brain Imaging Center, Goethe University Frankfurt, Germany
- Donders Institute for Brain, Cognition and Behaviour, Radboud University Nijmegen, Netherlands
Figures
Figure 1
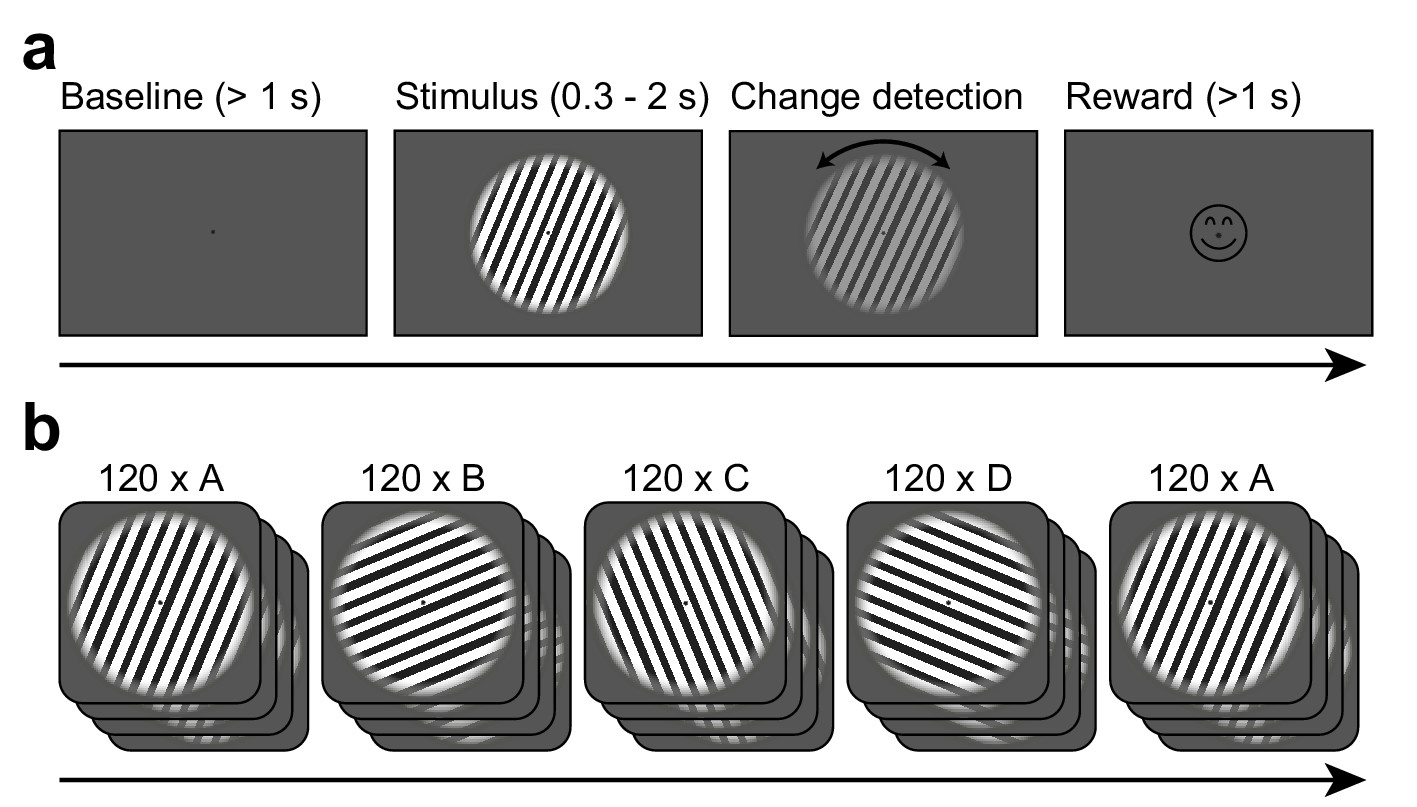
Task design.
(a) Each trial started when gaze fixation was attained. A gray background was shown as a 1 s baseline, followed by a central grating (diameter = 22.9 deg). Between 0.3 and 2.0 s after grating onset, a contrast decrement and a small rotation were applied to the grating. The subject needed to report the rotation direction using a button press. Upon button press, a smiley was shown regardless of accuracy. Afterwards, a new trial was initiated. (b) The per-trial grating orientation followed a blocked ABCDA-pattern: 120 trials each of one of four possible orientations were shown, followed by another 120 trials of the orientation shown in the first block. There was no break or change of any kind between the blocks.
Figure 2 with 1 supplement
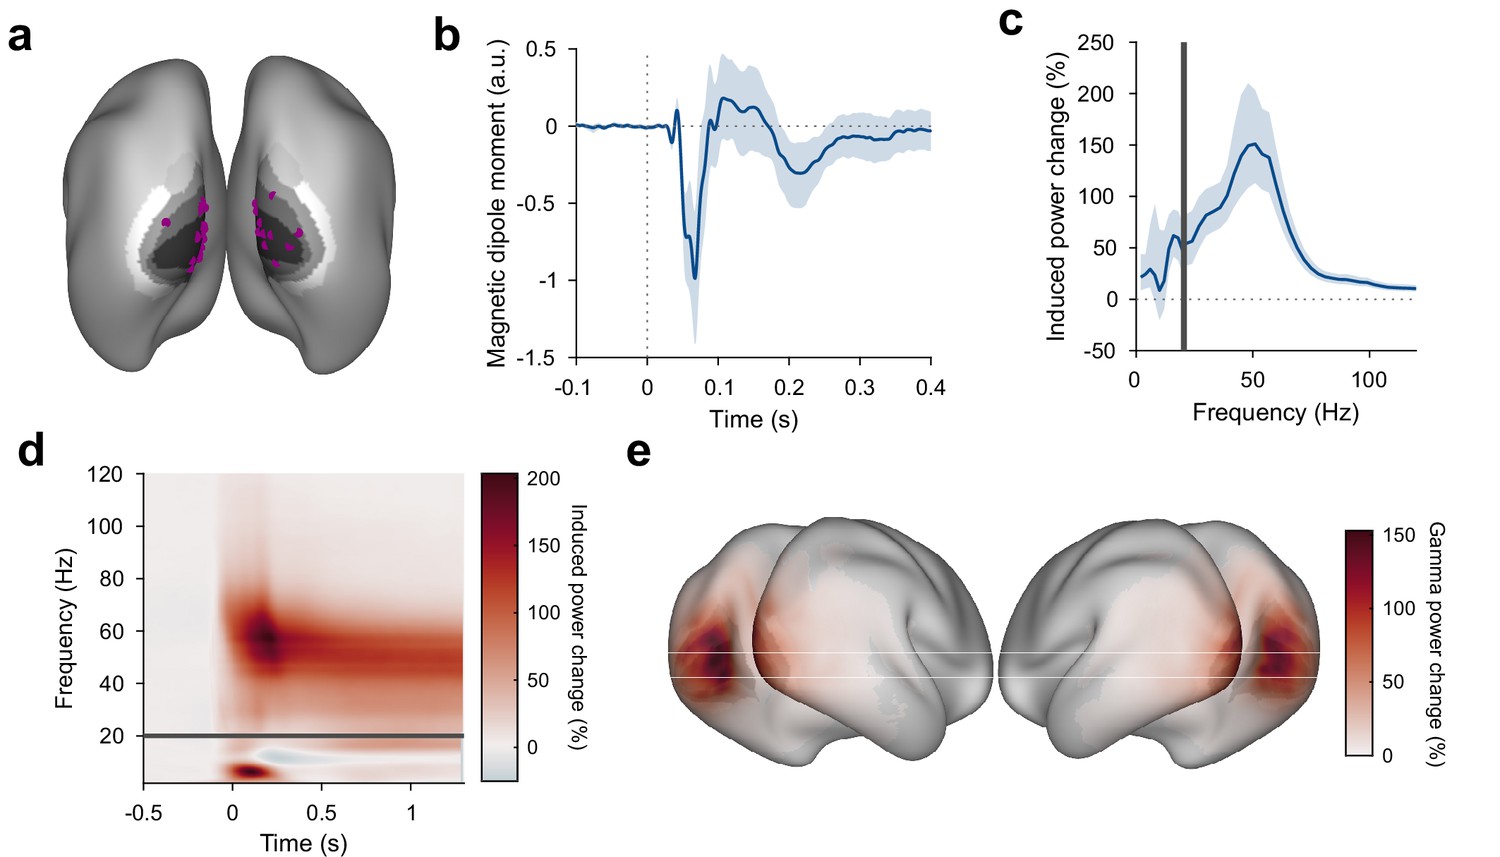
Stimulus-induced ERF and gamma-band response in visual cortex.
(a) Each violet dot shows the selected dipole with the strongest visually induced gamma of one subject. Black-to-white shading indicates areas V1, V2, V3, V3A, and V4. All selected dipoles were located in areas V1 or V2. All analyses referring to activity in V1/V2 used the MEG data projected into these dipoles. (b) Average V1/V2 magnetic dipole moment in response to stimulus onset. (c) Average stimulus-induced power change in V1/V2, calculated as per-trial power from 0.3 to 1.3 s post-stimulus divided by average power during the 1 s baseline. Error bars in (b, c) show 95% confidence intervals based on a bootstrap across subjects. (d) Average stimulus-induced power change in V1/V2 as a function of time and frequency. In (c, d), power values from 1 to 20 Hz (below the gray bar) were computed using Hann tapering, power values of higher frequencies were computed using multi-tapering and line noise was removed using DFT filters. (e) Average stimulus-induced gamma-power change (individual gamma peak ±10 Hz), source projected to all cortical dipoles. Values are significance-masked using a tmax-corrected permutation test. Black-to-white shading indicates areas V1, V2, V3, V3A, and V4.
Figure 2—figure supplement 1
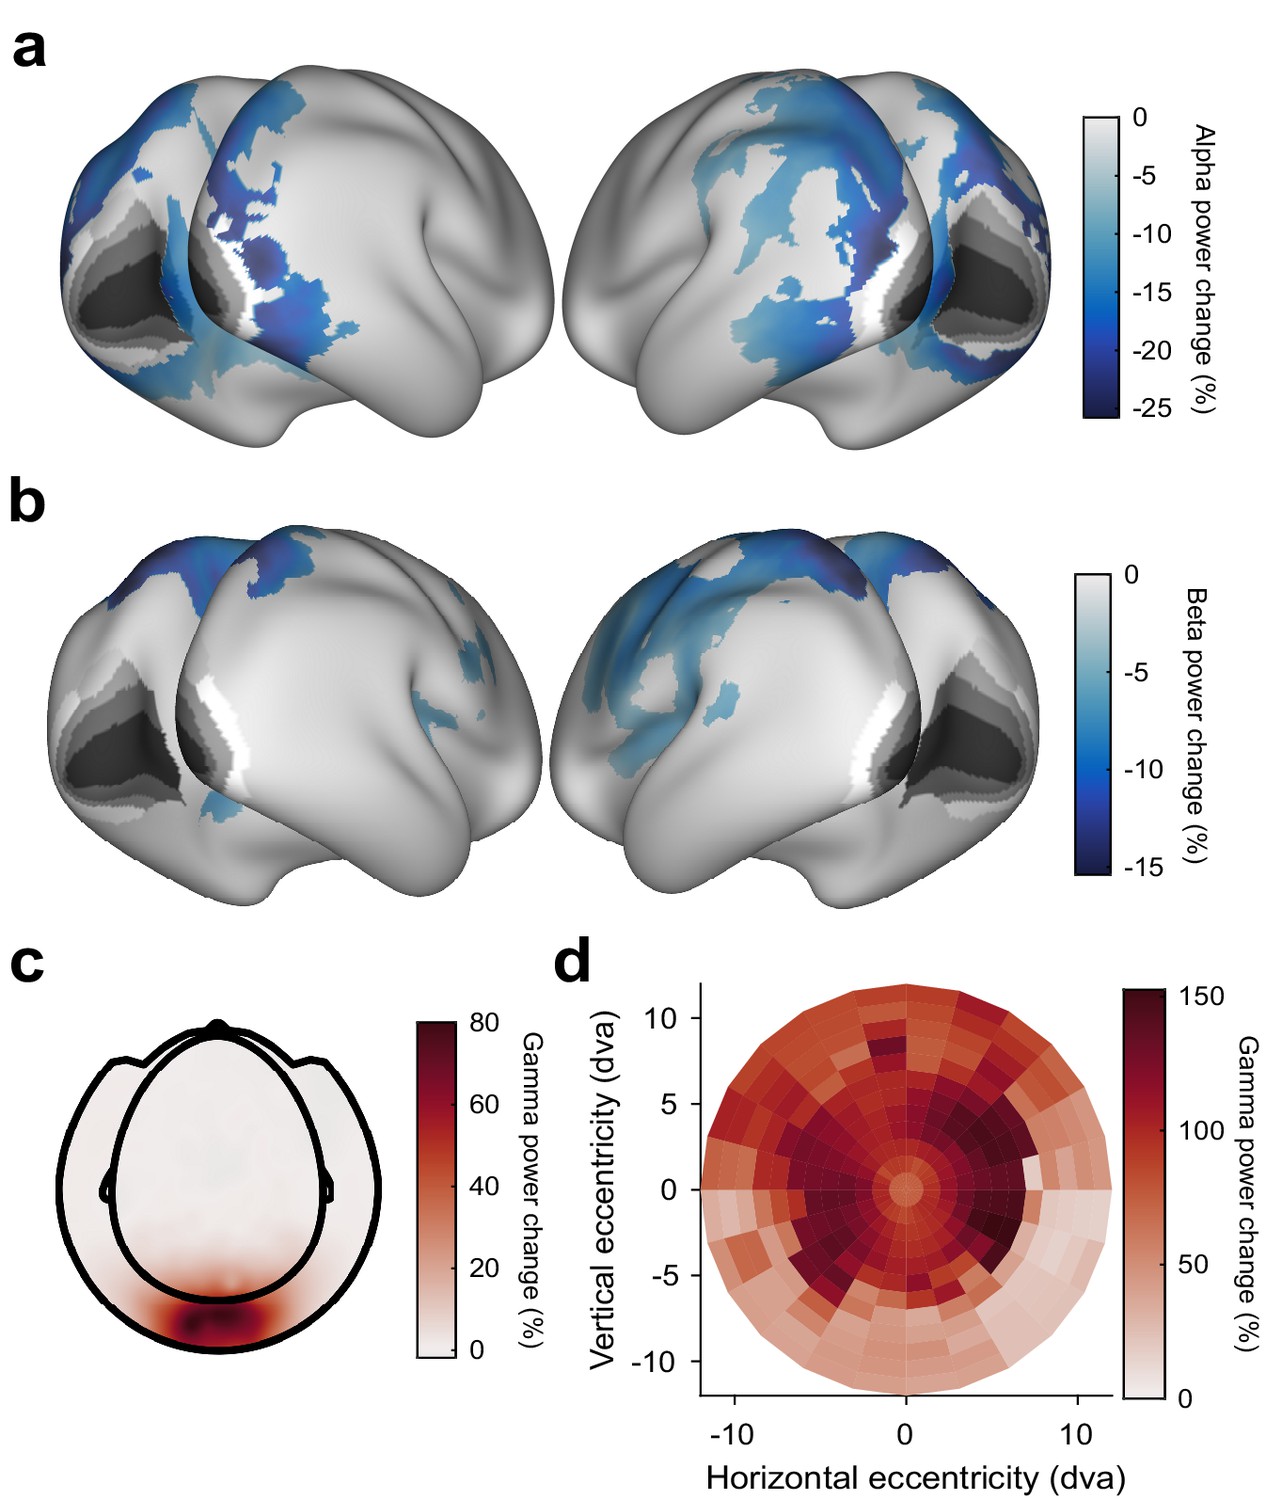
Stimulus-induced power changes.
(a) Average stimulus-induced alpha-power change (at individual alpha frequency), source-localized to all cortical dipoles. Values are significance-masked using a tmax-corrected paired permutation test. Black-to-white shading indicates areas V1, V2, V3, V3A, and V4, as in Figure 2. Note that alpha-power changes are absent in those areas. (b) Same as (a), but for power changes at the individual beta frequency. (c) Average stimulus-induced gamma-power change on the sensor level. (d) Gamma-power changes (color code) as a function of cortical retinotopic representation (x- and y-axis). Gamma-power changes were first projected into source dipoles. For each dipole in area V1, a group-average retinotopic atlas aligned to the HCP-MMP 1.0 template brain (Benson et al., 2018) was used to find the corresponding retinotopic position. Subsequently, gamma-power changes were projected from source space into retinotopic space. Gamma-power changes were strongest at the representation of the parafoveal eccentricities.
Figure 3 with 3 supplements
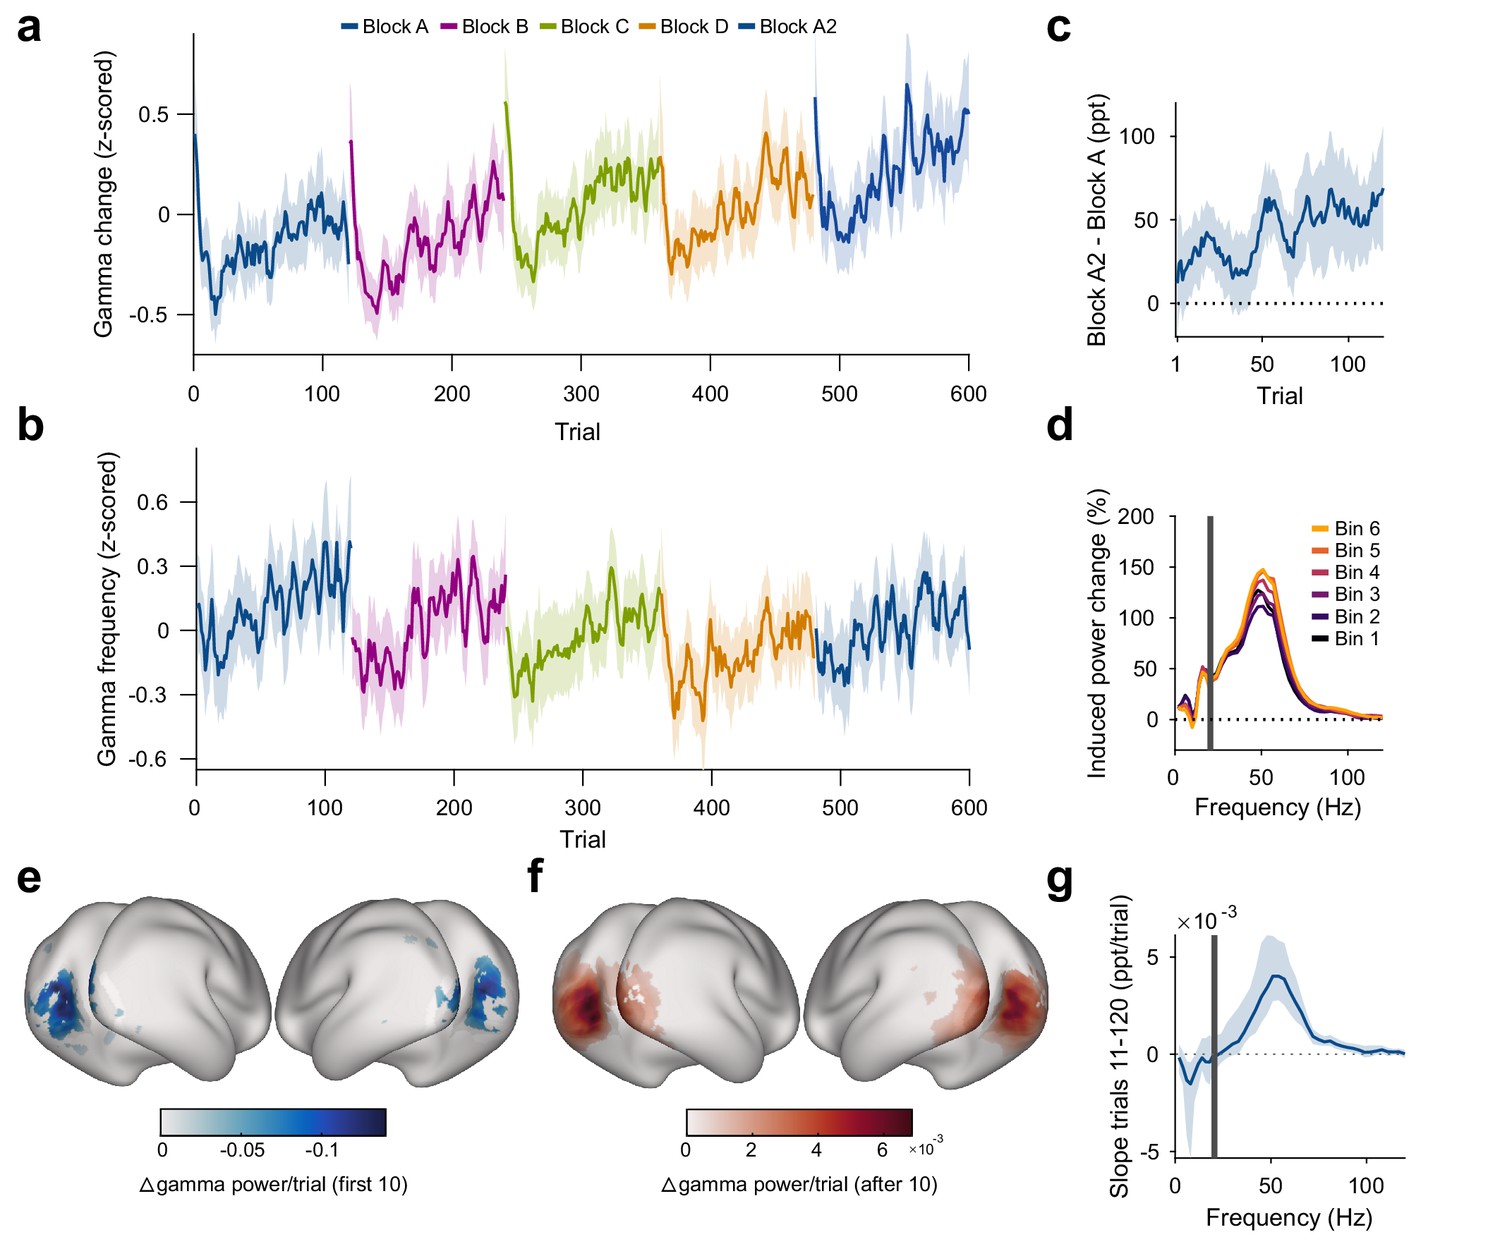
Repetition effects on gamma power and peak frequency are stimulus specific.
(a) Stimulus-induced gamma power in V1/V2, on a per-trial basis. (b) Peak frequency of stimulus-induced gamma in V1/V2, on a per-trial basis. Values in (a, b) were z-scored within subjects. (c) Within-subject differences in stimulus-induced V1/V2 gamma power between the second and the first block of a given oriented grating (A2 minus A). Note that induced gamma power also showed an increase with stimulus-independent trial number, which is controlled for in the regression model presented in Results. In (a–c), the average and the 95% bootstrap confidence intervals were computed using a five-trial-wide running window. (d) Stimulus-induced power-change spectra in V1/V2 during the 120 presentations of a given stimulus, plotted in sequential 20-presentation bins. Power values from 1 to 20 Hz (left of the gray bar) were computed using Hann tapering, power values of higher frequencies were computed using multi-tapering. Line noise was removed using DFT filters. (e) Spatial distribution of the early gamma power decrease: For each cortical dipole, a regression line was fit to induced gamma power as a function of stimulus repetitions 1–10. Subject-averaged slopes (significance-masked, tmax-corrected) are shown. (f) Spatial distribution of the late gamma increase: For each cortical dipole, a regression line was fit to induced gamma power as a function of stimulus repetitions 11–120. Subject-averaged slopes (significance-masked, tmax-corrected) are shown. In (e, f), black-to-white shading indicates areas V1, V2, V3, V3A, and V4. (g) For each frequency, a linear regression across repetitions was fit to the per-trial visually induced power change in V1/V2 during the late trials (trials 11–120). Average slope and 95% bootstrap CI over subjects is shown. The corresponding analysis for the early trials (trials 1–10) is shown in Figure 3—figure supplement 1d. All results in this figure show averages over all participants.
Figure 3—figure supplement 1
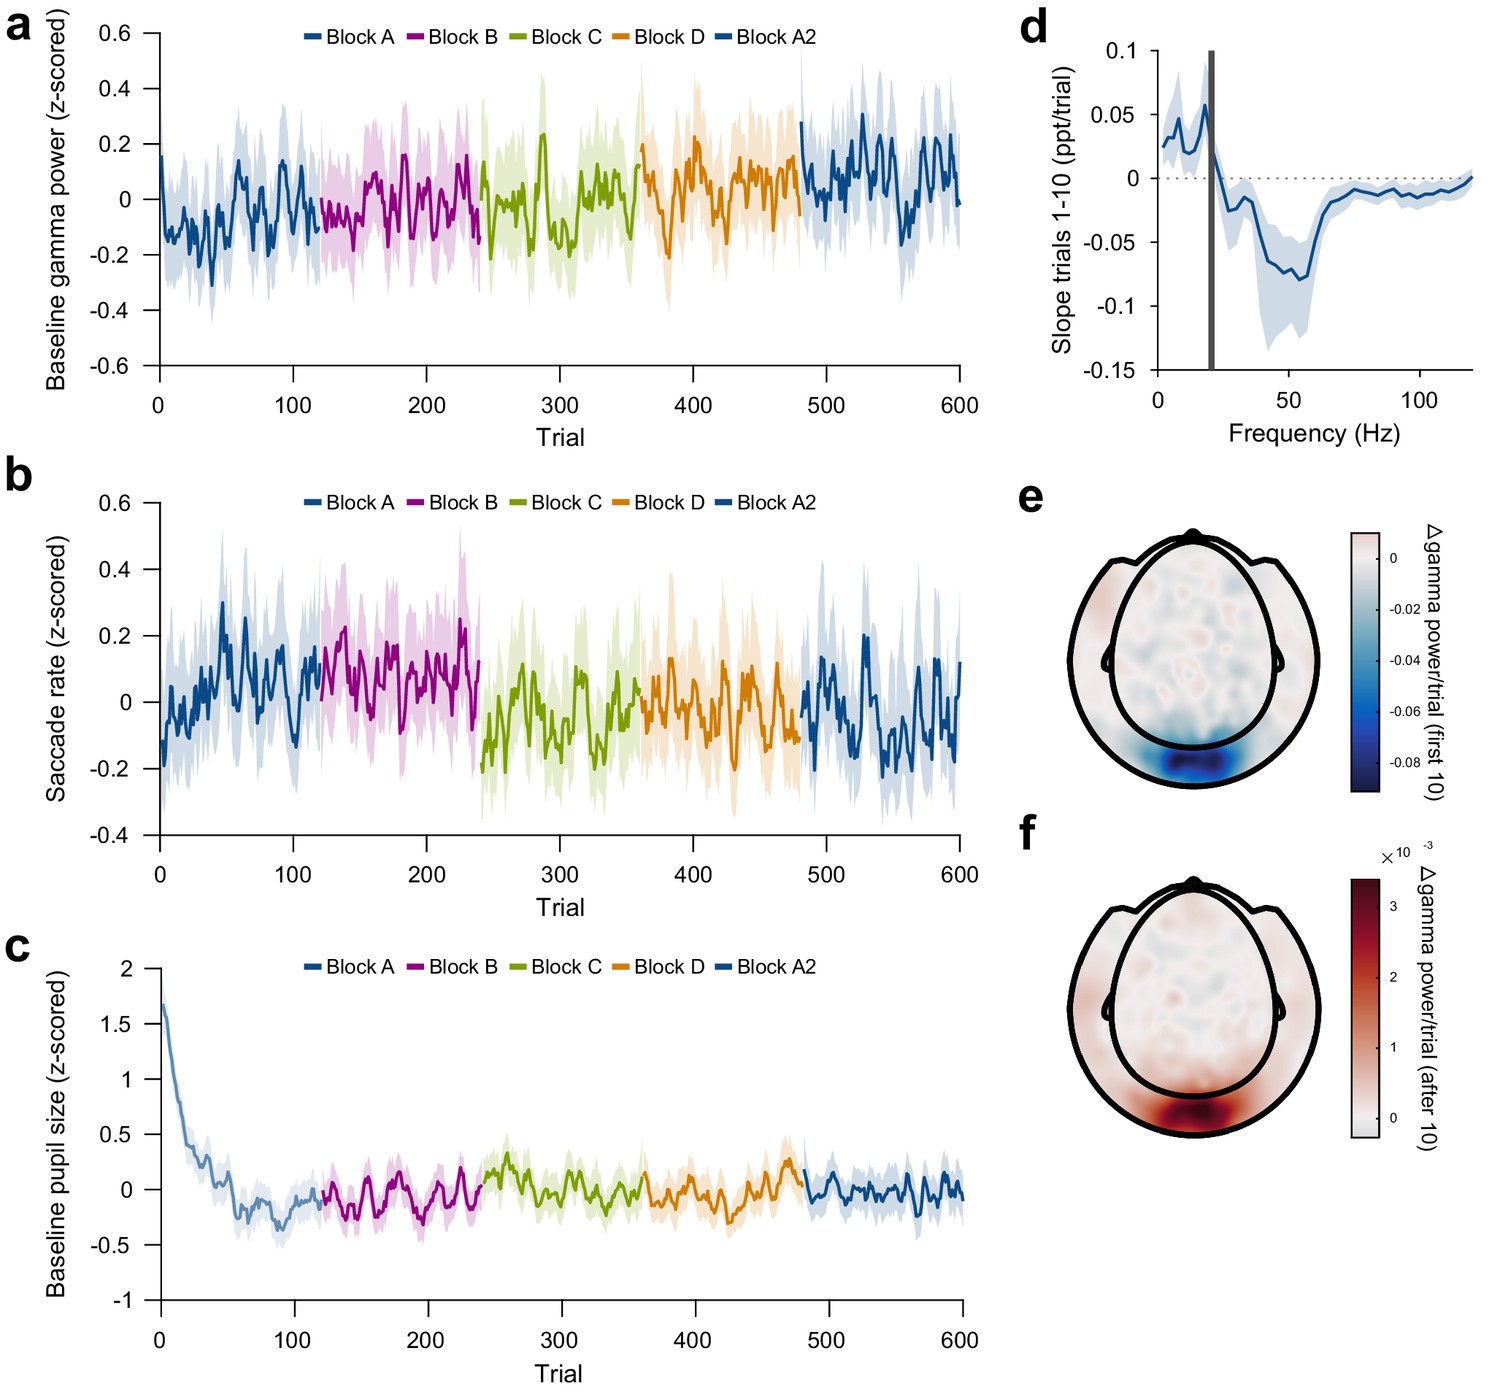
Control analyses of repetition-induced gamma changes.
(a) Same as Figure 3a, but for gamma power in the baseline period (last second before stimulus onset). Baseline gamma power showed an increase with overall trial number, but there was no effect of stimulus-specific repetition number. (b) Same as Figure 3a, but for microsaccade rate. Microsaccade rate showed a decrease with overall trial number, but there was no effect of stimulus-specific repetition number. (c) Pupil size during the trial baseline (−0.3 to 0 s), on a per-trial basis. Baseline pupil size showed a slow decrease after the beginning of the experiment, but no changes at block boundaries. Values in (a–c) were z-scored within subjects and then averaged over subjects. (d) Same as Figure 3e, but for the early trials (trials 1–10). For each frequency, a linear regression across repetitions was fit to the per-trial visually-induced power change in V1/V2 during the early trials (trials 1–10). Average slope and 95% bootstrap CI over subjects is shown. (e) Spatial distribution of the early repetition-related gamma-power decrease: For each MEG gradiometer, a regression line was fit over stimulus repetitions 1–10. Subject-averaged slopes are shown. (f) Same as (d), but for repetitions 11–120.
Figure 3—figure supplement 2
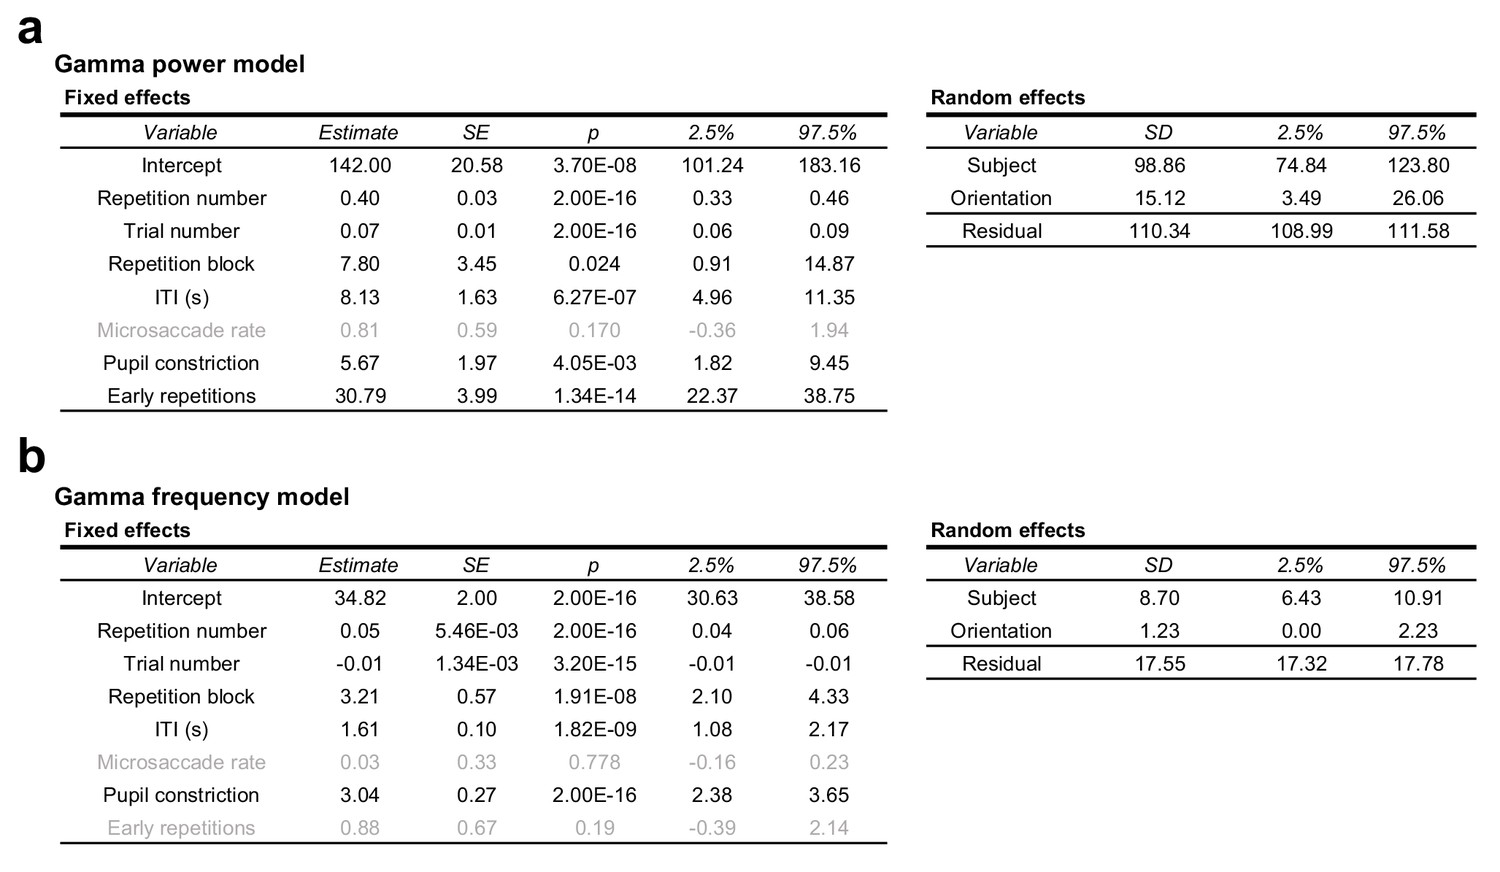
Full regression model of gamma power and peak-frequency changes.
(a) Random intercepts linear mixed regression model describing per-trial stimulus-induced percent gamma power changes from the baseline. Grey text indicates non-significant effects. (b) Same as (a), but describing per-trial stimulus-induced gamma peak frequency. For both models, see Experimental procedures.
Figure 3—figure supplement 3
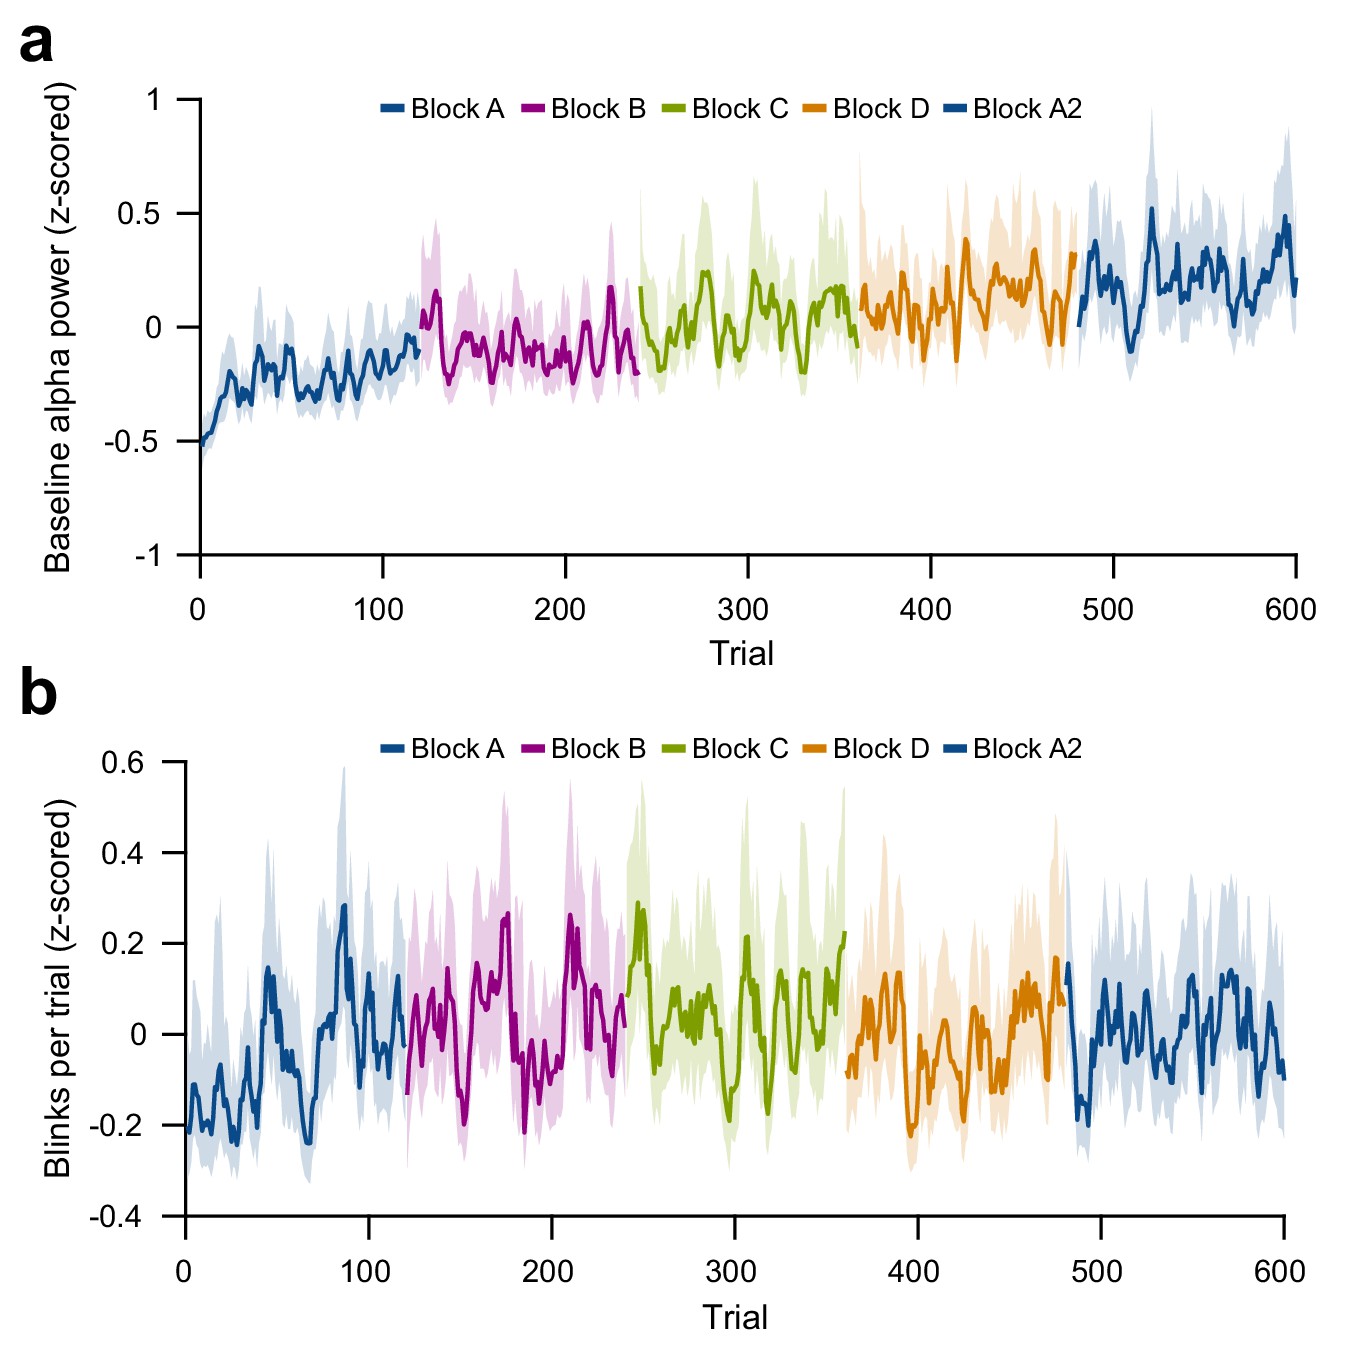
Per-trial changes in baseline alpha power and blink number.
(a) Per-trial average alpha power during the pre-stimulus baseline interval, z-scored within subjects. (b) Per-trial number of blinks during the trial interval, on a per-trial basis, z-scored within subjects and averaged over subjects. For plots (a) and (b), average and 95% bootstrap confidence intervals were computed using a five-trial-wide running window within each block.
Figure 4 with 1 supplement
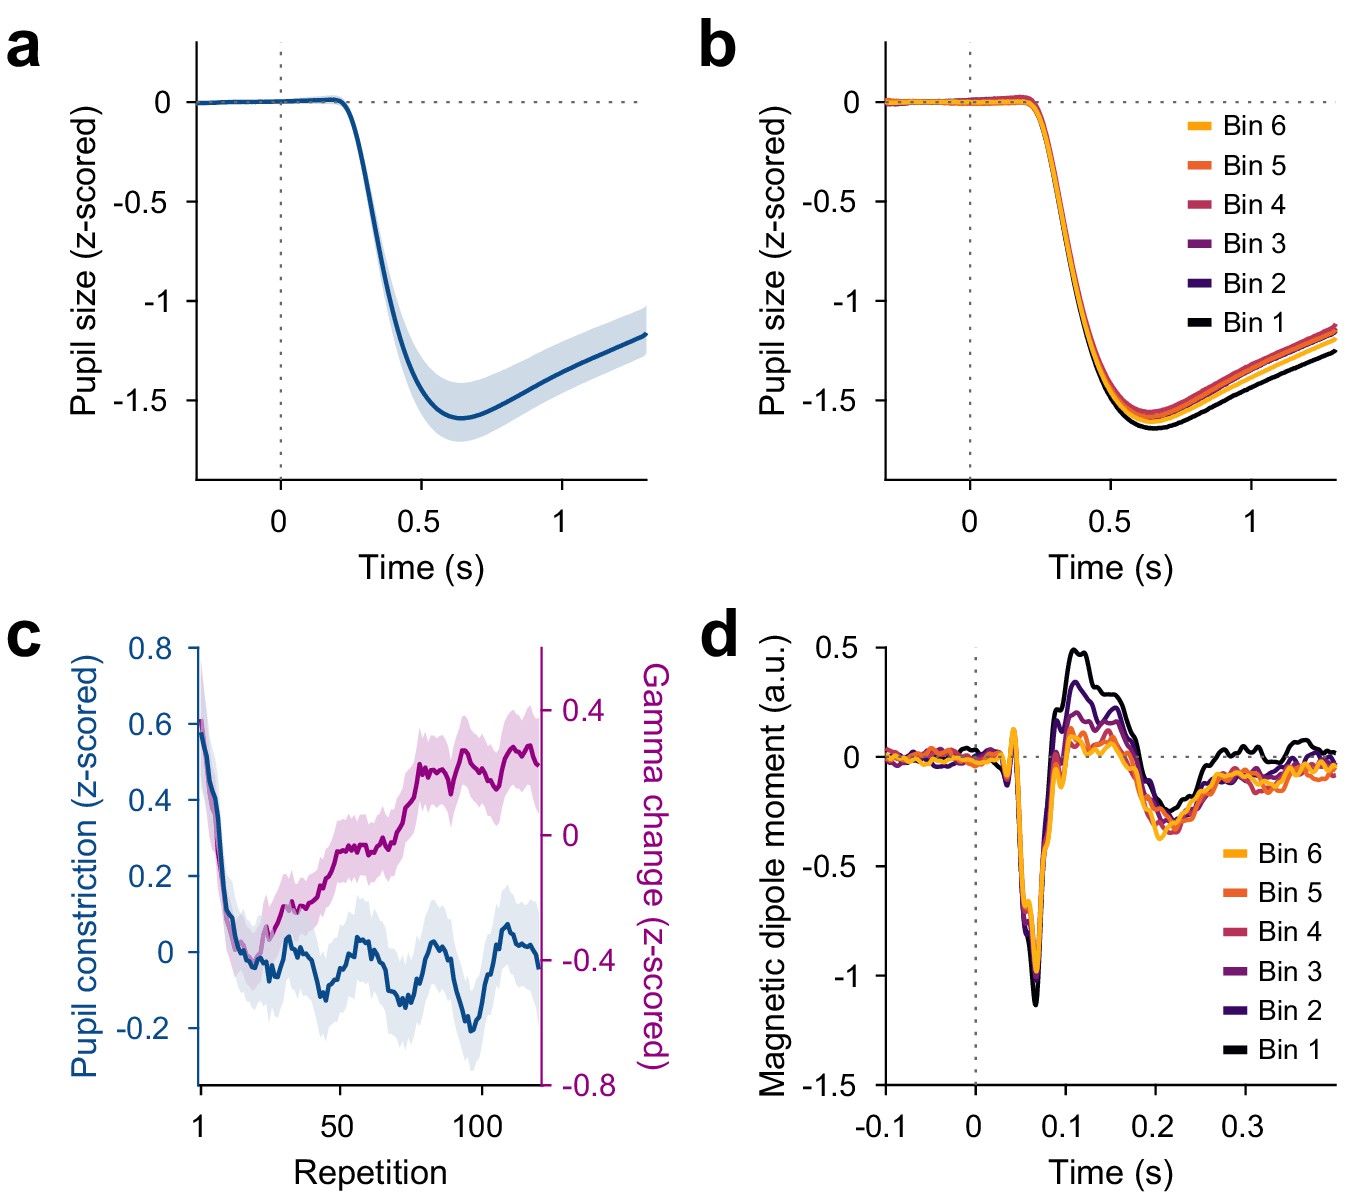
Repetition effects on pupil constriction and ERF.
(a) Average pupil size as a function of time post-stimulus onset, z-scored relative to the baseline. A pupillary light reflex to the luminance increase at stimulus onset can be seen. All pupil plots exclude block A because pupil size at the beginning of the experiment was confounded by slow adaptation to the projector illumination (see Figure 4—figure supplement 1a). (b) Same as (a), but averaged for bins of 20 stimulus repetitions each. (c) Blue: Per-repetition average pupil constriction (defined as the per-trial difference between mean pupil size during the 300 ms baseline period and the 0.5–1.2 s post-stimulus period, z-scored within subjects). Violet: Per-repetition stimulus-induced gamma power change in V1/V2 (z-scored within subjects), for comparison. The average and the 95% bootstrap confidence intervals were computed using a five-trial-wide running window. (d) Magnetic dipole moment in V1/V2 in response to stimulus onset, averaged for bins of 20 stimulus repetitions each.
Figure 4—figure supplement 1
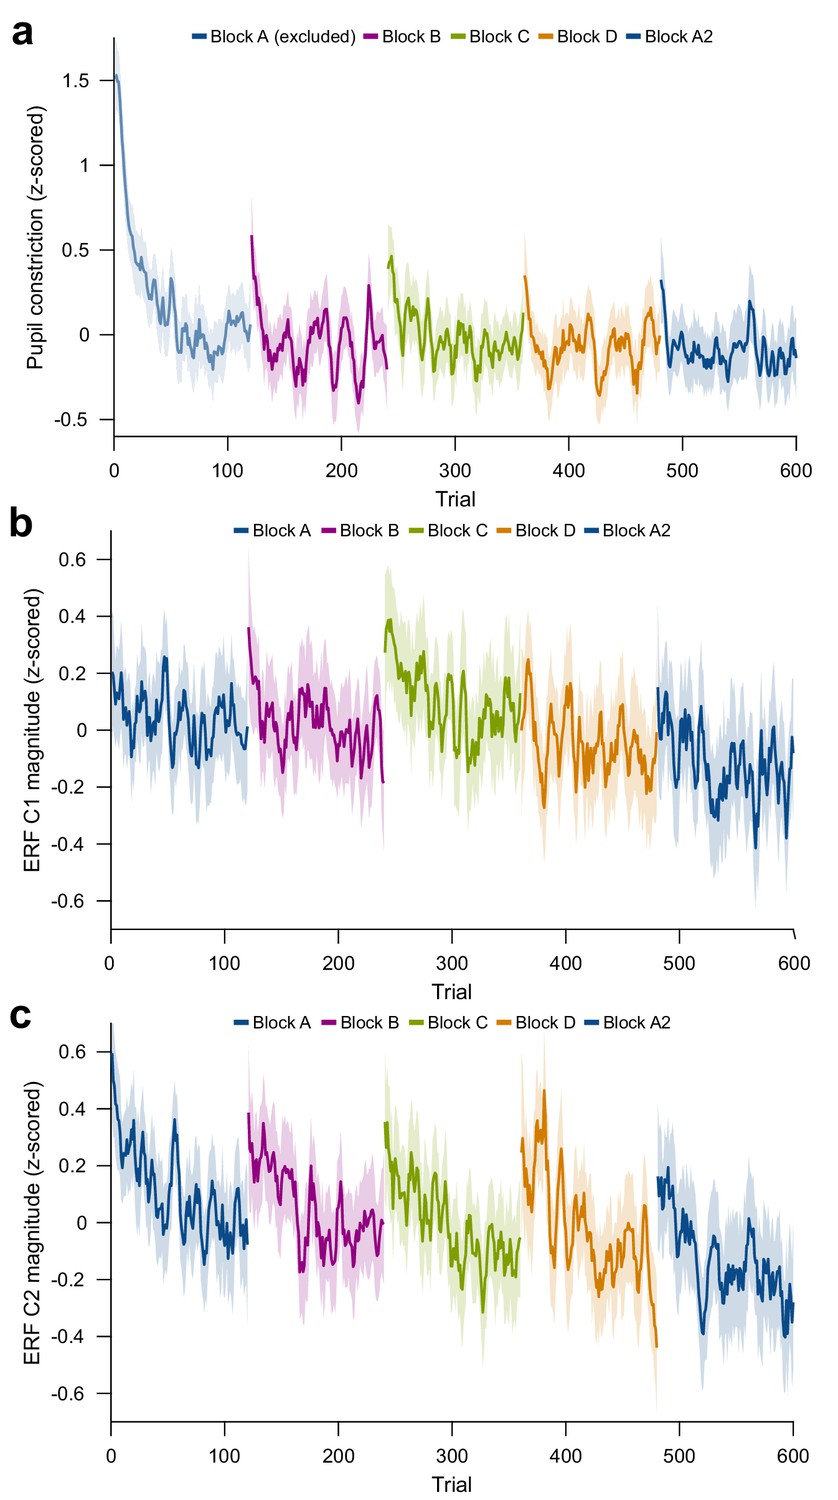
Per-trial changes in pupil constriction and ERF magnitude.
(a) Per-trial average pupil constriction (the difference between pupil size before stimulus onset and 0.5 s–1.2 s after stimulus onset) as a function of trial number. The first block is confounded by ongoing pupil size adaptation to the changed level of ambient light and projector illumination at the beginning of the experiment and was excluded from pupil-size analyses. (b) Per-trial average magnitude of the ERF C1 component (55–70 ms post-stimulus). (c) Per-trial average magnitude of the ERF C2 component (90–180 ms post-stimulus). For plots (a), (b), and (c), values were z-scored within subjects. Average and 95% bootstrap confidence intervals were computed using a five-trial-wide running window within each block.
Figure 5 with 1 supplement

Repetition effects on GC are strongest for gamma in the feedforward direction.
(a) Bivariate GC spectra between areas V1 and V4 (FF = feedforward, i.e. V1-to-V4, FB = feedback, i.e. V4-to-V1). GC was separately computed for early repetitions (trials 11–50, i.e. after the early gamma decrease) and late repetitions (trials 81–120). Error regions reflect 95% CIs. Inferential statistics are based on a non-parametric permutation test cluster-corrected for multiple comparisons across frequencies (Maris and Oostenveld, 2007). Horizontal green bar indicates significant cluster for FF GC. (b) Same analysis as in (a), but for areas V4 and IPS1, with feedforward being V4-to-IPS1 and feedback being IPS1-to-V4. (c) Total number of per-frequency significant differences between late and early repetition GC spectra between all areas (green = feedforward, gray = feedback). (d) All areas used for the analysis, plotted onto a semi-inflated average cortical surface. Area and surface definitions were taken from the HCP MMP1.0 atlas (Glasser et al., 2016a). (e) Changes in gamma GC from early to late trials, separately for the feedforward direction (upper matrix half, enclosed by green triangle) and the feedback direction (lower matrix half, enclosed by gray triangle). Non-significant matrix entries are gray masked. To be considered significant, matrix entries had to pass a tmax-corrected paired permutation test including time-reversal testing (Vinck et al., 2015). Inset right: Changes in gamma power for each brain area from early to late repetitions (significance based on a tmax-corrected paired permutation test; non-significant areas are gray masked). (f) The analysis of (e) was repeated per subject, and for the individually significant matrix entries, GC changes were averaged, separately for the feedforward (x-axis) and feedback (y-axis) direction; each dot corresponds to one subject. Across subjects, repetition-related GC changes were larger in the feedforward than the feedback direction ().
Figure 5—figure supplement 1
Conceptual replication of Michalareas et al., 2016.
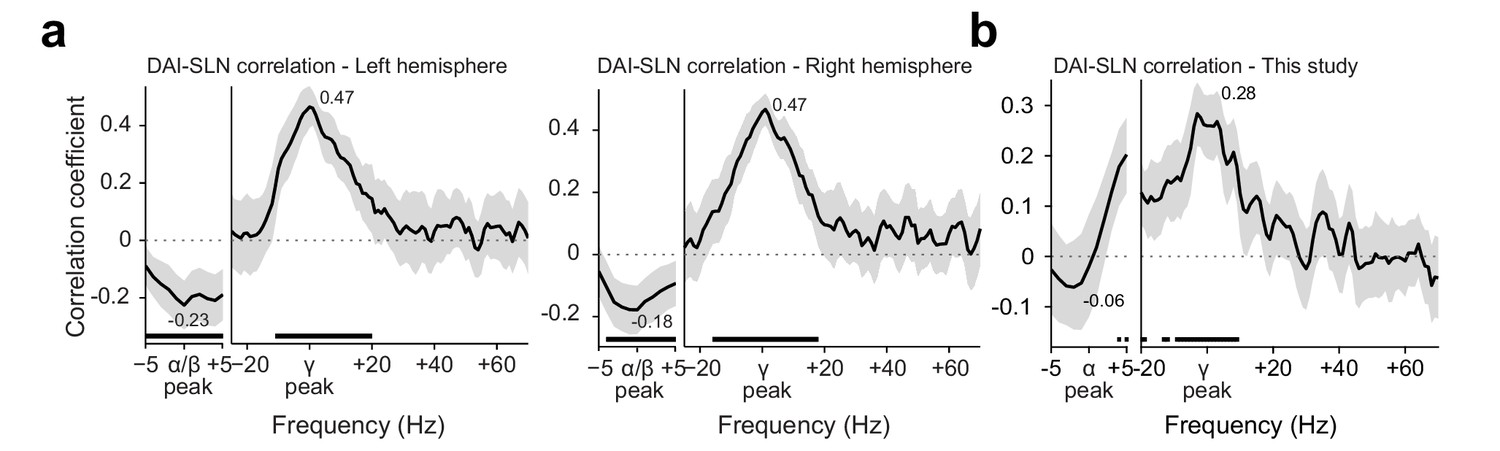
(a) Replotting of the data previously published in Figure 6 of Michalareas et al., 2016. The graphs show the Spearman correlation coefficient, across pairs of brain areas, between a metric of GC asymmetry (DAI, per frequency) and a metric of the feedforward character of the corresponding anatomical projection (SLN). The DAI metric is the directed influence asymmetry index from brain area A to brain area B, defined as (DAIA-to-B = [GCA-to-B – GCB-to-A]/[GCA-to-B + GCB-to-A]). The SLN metric is the supragranular labeled neuron proportion, a graded anatomical metric (defined in the macaque) of the degree to which an anatomical projection is of feedforward character (i.e., originating in supragranular layers; Barone et al., 2000). DAI was positively related with SLN in the subject-defined gamma band, and negatively related to SLN in the subject-defined alpha/beta band. Lines show the average over subjects, and error bands represent standard error of the mean across subjects. Significance was computed using cluster-based nonparametric testing against zero (Maris and Oostenveld, 2007). (b) Similar analysis for the dataset recorded here, using the same seven brain areas. The same positive relation was found in the subject-specific gamma band. A similar negative relation is visible in the subject-specific alpha band, but did not reach significance. Lines show the average over subjects, and error bands represent the bootstrapped 95% confidence interval, significance was computed using a tmax-corrected permutation test. SLN values from Chaudhuri et al., 2015.
Figure 6
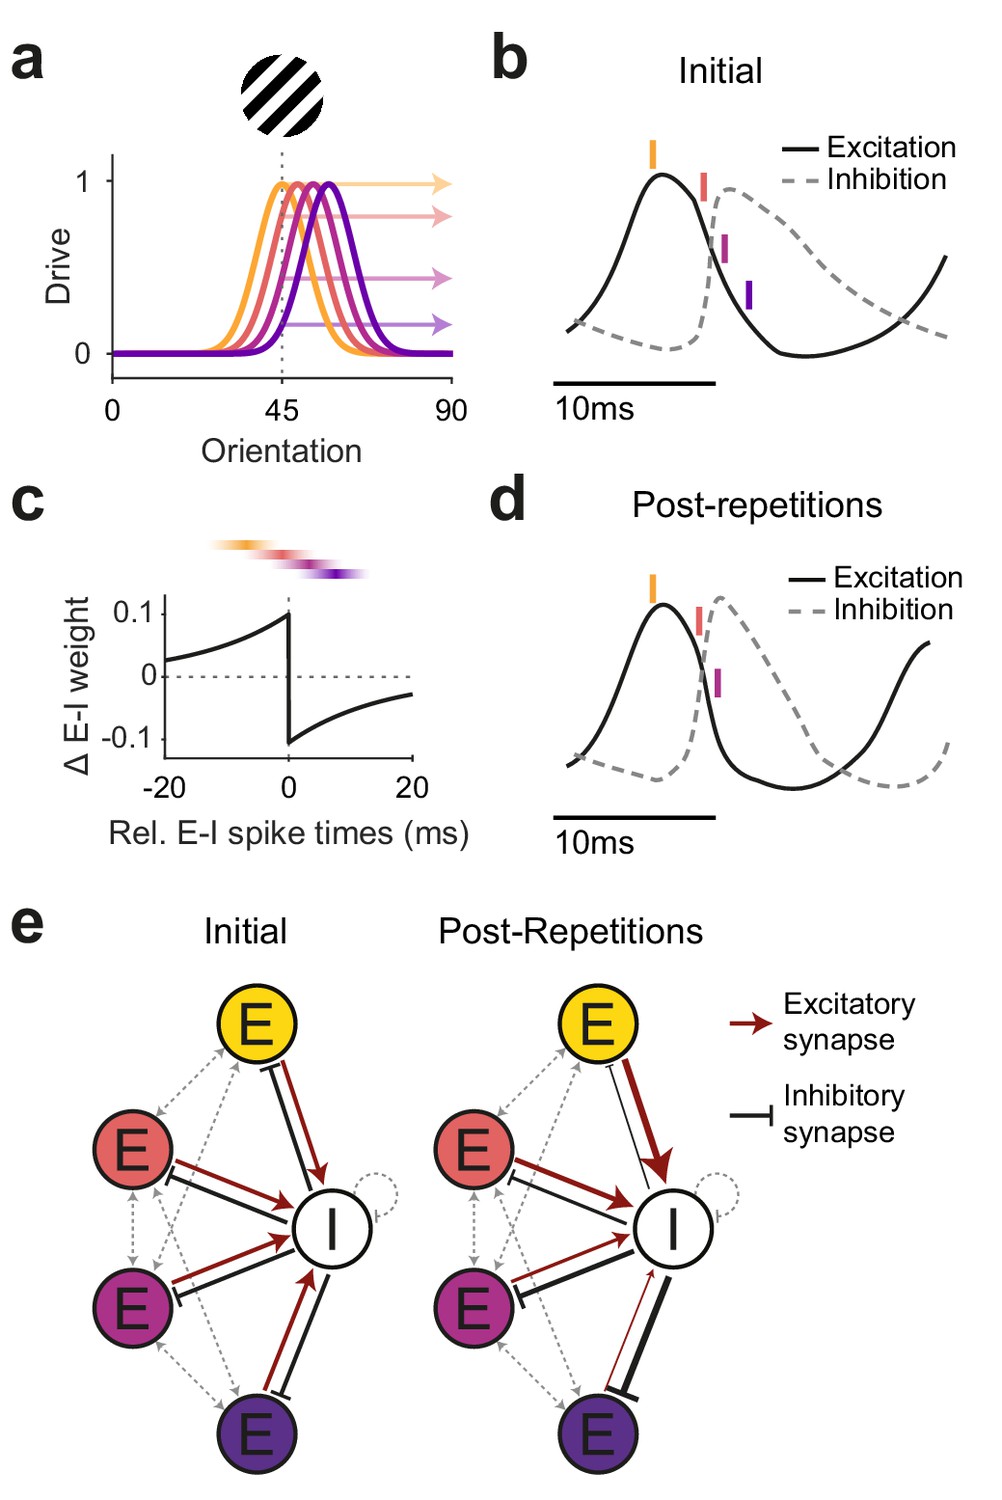
Illustration of a potential neuronal mechanism of repetition-induced gamma changes.
(a) Tuning curves of four example excitatory neurons (colored lines) and the drive they receive (colored arrows) for a stimulus of a given orientation (shown above the panel). (b) Local average excitatory inputs (black solid curve) and inhibitory inputs (gray dashed curve), adapted from Figure 6D of Salkoff et al., 2015, during a gamma cycle. Inhibitory inputs systematically lag excitatory inputs by a few milliseconds. Colored vertical lines indicate mean spike times of the four example neurons, color-coded according to (a). Their spike latencies during the gamma cycle are determined by their stimulus drive (Vinck et al., 2010). (c) A Hebbian STDP kernel, aligned to the average time of inhibitory spiking. The relative E-I spike timing between strongly driven/weakly driven excitatory neurons and the inhibitory neuron pool induces E-to-I synaptic weight increases/decreases, respectively. Note that the spike times shown in (b) are illustrations of the mean spike times of the respective neurons during the gamma cycle, whereas experimentally observed spike time distributions show substantial cycle-by-cycle variability. Thereby, for the two neurons with the strongest (yellow) and weakest (blue) drive, spike times occur almost exclusively during the positive or negative part of the STDP kernel, respectively. For the neuron with the second-strongest drive (red), spike times mostly overlap with the positive part, yet also partly with the negative part of the STDP kernel, and the reverse holds for the neuron with the second-weakest drive (purple). (d) The proposed mechanism should result in a modified E-I dynamic: Strengthened synaptic weights from strongly driven excitatory neurons to the inhibitory neuron pool accelerate the excitation-driven inhibition, thereby shortening the gamma cycle and increasing MUA-LFP gamma locking. (e) The proposed mechanism strengthens synaptic weights from strongly driven excitatory neurons to the local inhibitory interneuron pool. Furthermore, it strengthens inhibitory synaptic weights from the local inhibitory interneuron pool to the more weakly driven excitatory neurons.
Additional files
Download links
A two-part list of links to download the article, or parts of the article, in various formats.
Downloads (link to download the article as PDF)
Open citations (links to open the citations from this article in various online reference manager services)
Cite this article (links to download the citations from this article in formats compatible with various reference manager tools)
Stimulus-specific plasticity in human visual gamma-band activity and functional connectivity
eLife 10:e68240.
https://doi.org/10.7554/eLife.68240


