Metabolomic profiling reveals a differential role for hippocampal glutathione reductase in infantile memory formation
- Center for Neural Science, New York University, United States
Figures
Figure 1 with 1 supplement
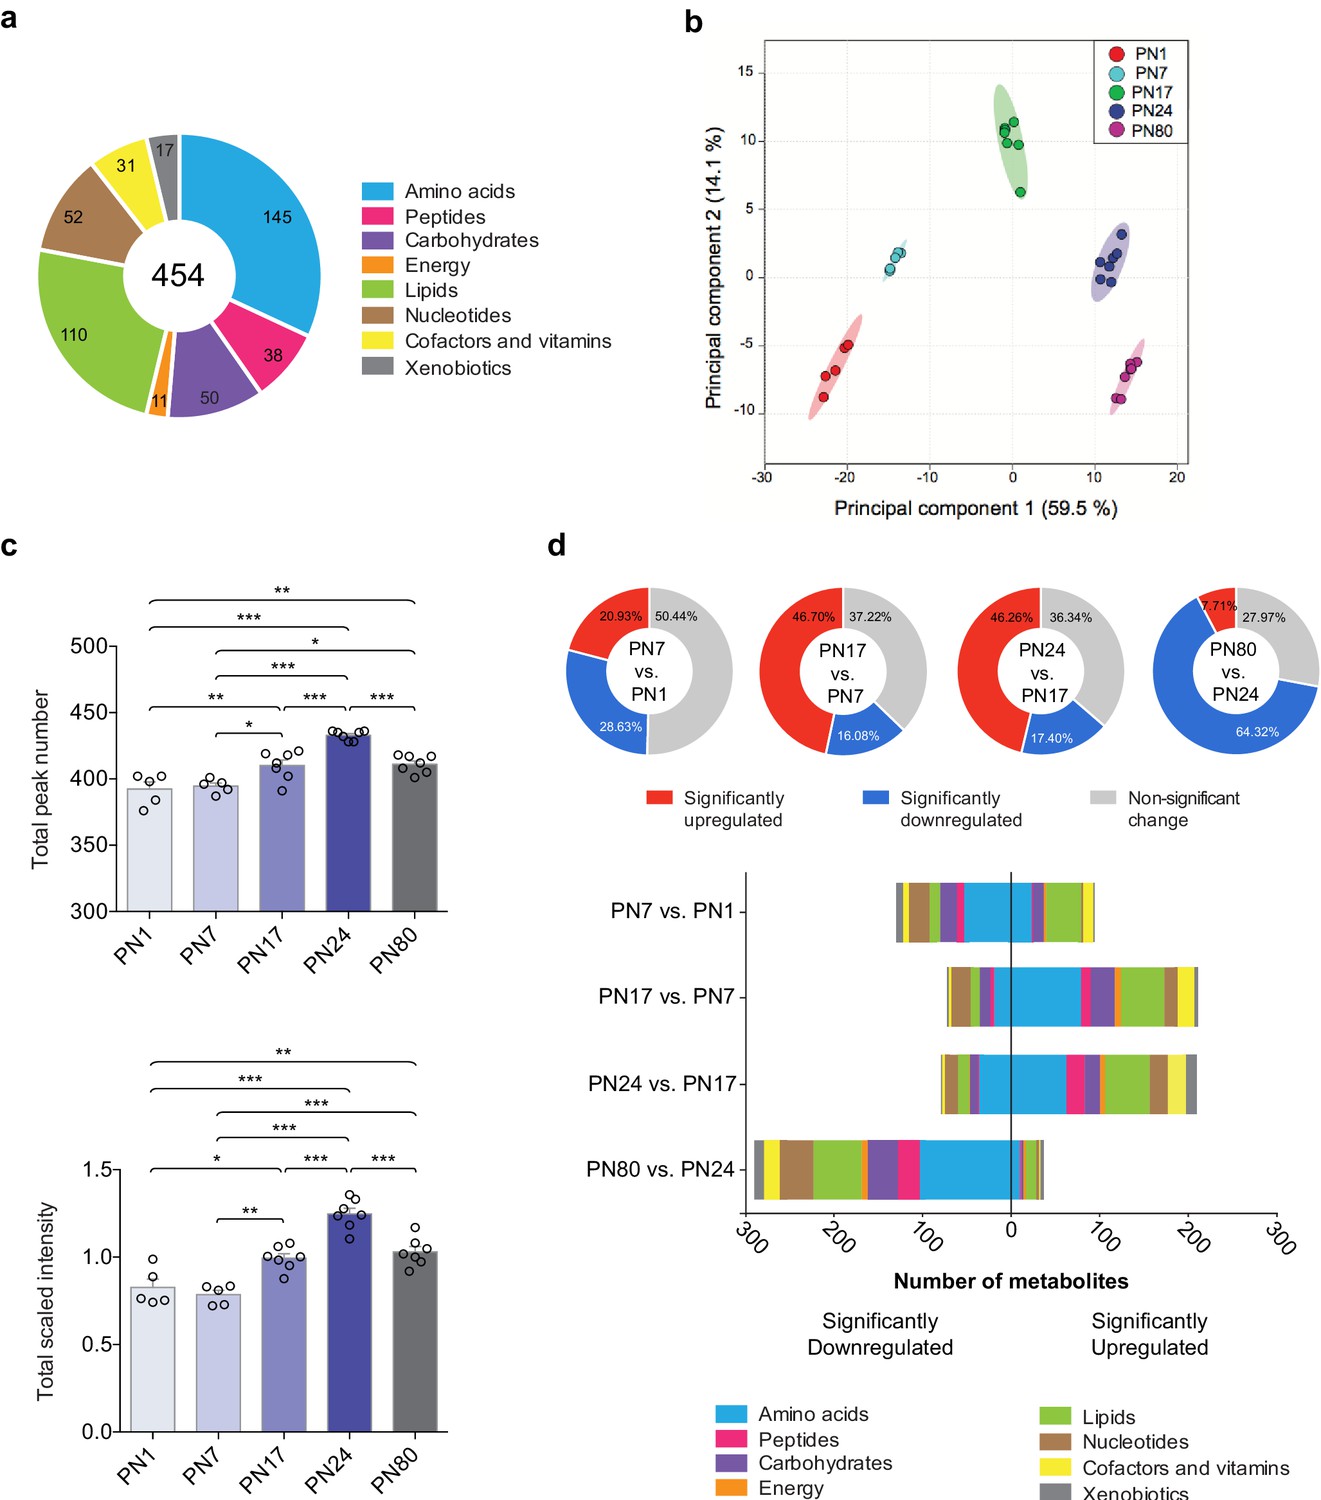
Overview of hippocampal metabolomic changes across postnatal developmental ages.
(a) Pie chart showing the total number (454) of metabolites identified in the whole rat hippocampus across developmental ages by untargeted ultrahigh performance liquid chromatography-tandem mass spectroscopy (UPLC-MS/MS). The metabolites belonged to eight different pathways: amino acids (145), carbohydrates (50), cofactors and vitamins (31), energy metabolism (11), lipids (110), nucleotides (52), peptides (38), and xenobiotics (17). (b) Principal component analysis (PCA) of untrained groups at different developmental ages: postnatal day 1 (PN1) (n = 5), PN7 (n = 5), PN17 (n = 7), PN24 (n = 7), and PN80 (n = 7). The PCA plot revealed a substantial separation of samples based on age; each dot represents a single sample. The samples distributed into five distinctive populations (without overlap) corresponding to the five developmental ages. Colored ellipses in the score plot depict 95% confidence areas. The first and second principal components explained 59.5% and 14.1% of the total variance, respectively. (c) Mean values ± s.e.m. of total numbers of identified metabolites and total peak intensities, after median scaling, of the untrained groups at each developmental age. *p < 0.05, **p < 0.01, ***p < 0.001 (one-way ANOVA followed by Tukey’s multiple comparisons test). (d) Total number of metabolites significantly upregulated and downregulated at each age in comparison with the previous age (PN7 vs. PN1, PN17 vs. PN7, PN24 vs. PN17, and PN80 vs. PN24) and distribution of the metabolites per pathway. Statistical significance: p < 0.05, q-value < 0.1 (one-way ANOVA followed by Tukey’s multiple comparisons test and estimation of the false discovery rate [FDR]); one experiment. See Figure 1—source data 1 for numerical values and detailed statistical information.
-
Figure 1—source data 1
Numerical values and detailed statistical information.
- https://cdn.elifesciences.org/articles/68590/elife-68590-fig1-data1-v1.xlsx
Figure 1—figure supplement 1
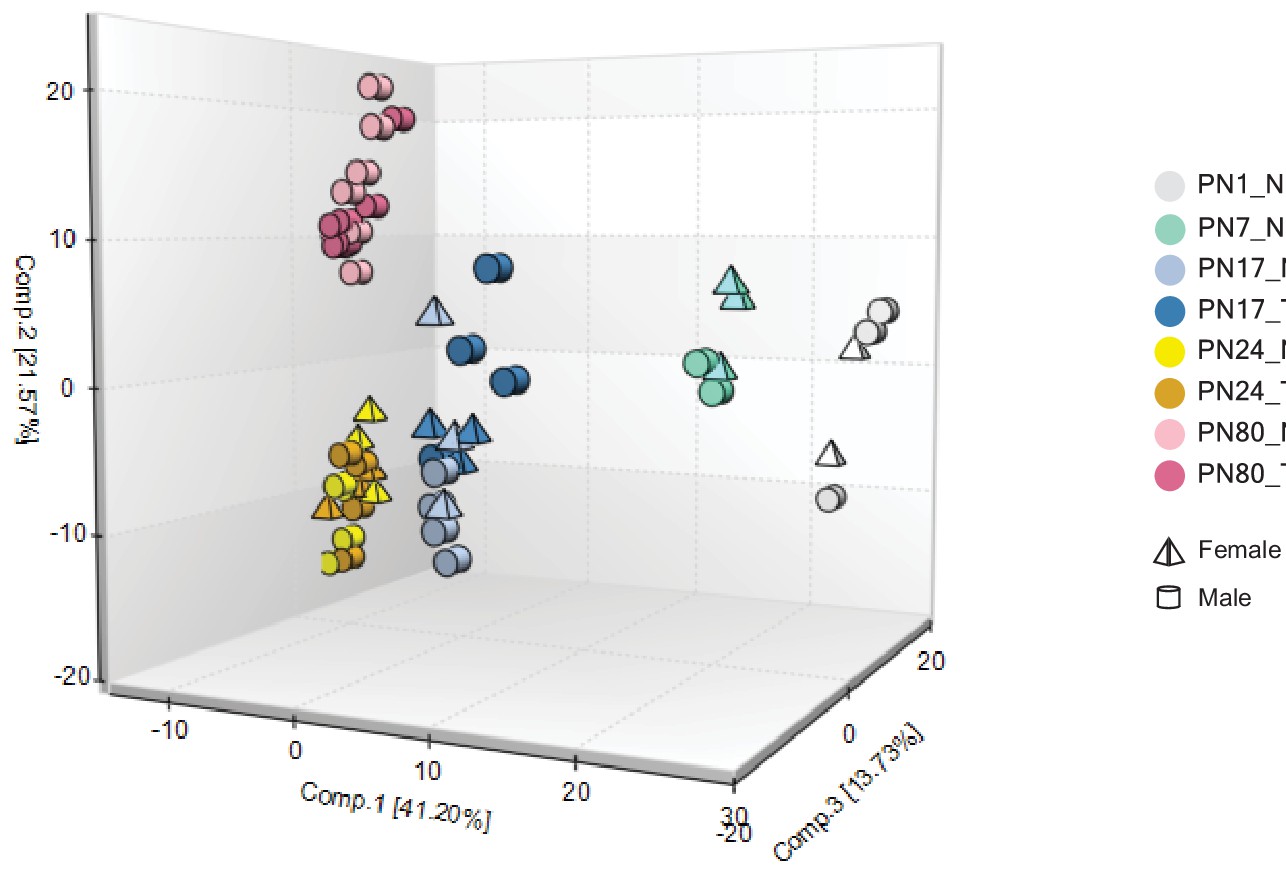
Principal component analysis (PCA) reveals no sex difference within the naive and trained groups.
PCA of the naive (N) and trained (T) groups at the different developmental ages: PN1_N (n = 5), PN7_N (n = 5), PN17_N (n = 7), PN17_T (n = 7), PN24_N (n = 7), PN24_T (n = 7), PN80_N (n = 7), and PN80_T (n = 7). The PCA score plot revealed a separation of samples based on developmental age but not based on sex or naive/trained conditions. The first, the second, and the third principal components explained 41.20%, 21.57%, and 13.73% of the total variance, respectively. See Figure 1—figure supplement 1—source data 1 for numerical values and detailed statistical information.
-
Figure 1—figure supplement 1—source data 1
Numerical values and detailed statistical information.
- https://cdn.elifesciences.org/articles/68590/elife-68590-fig1-figsupp1-data1-v1.xlsx
Figure 2
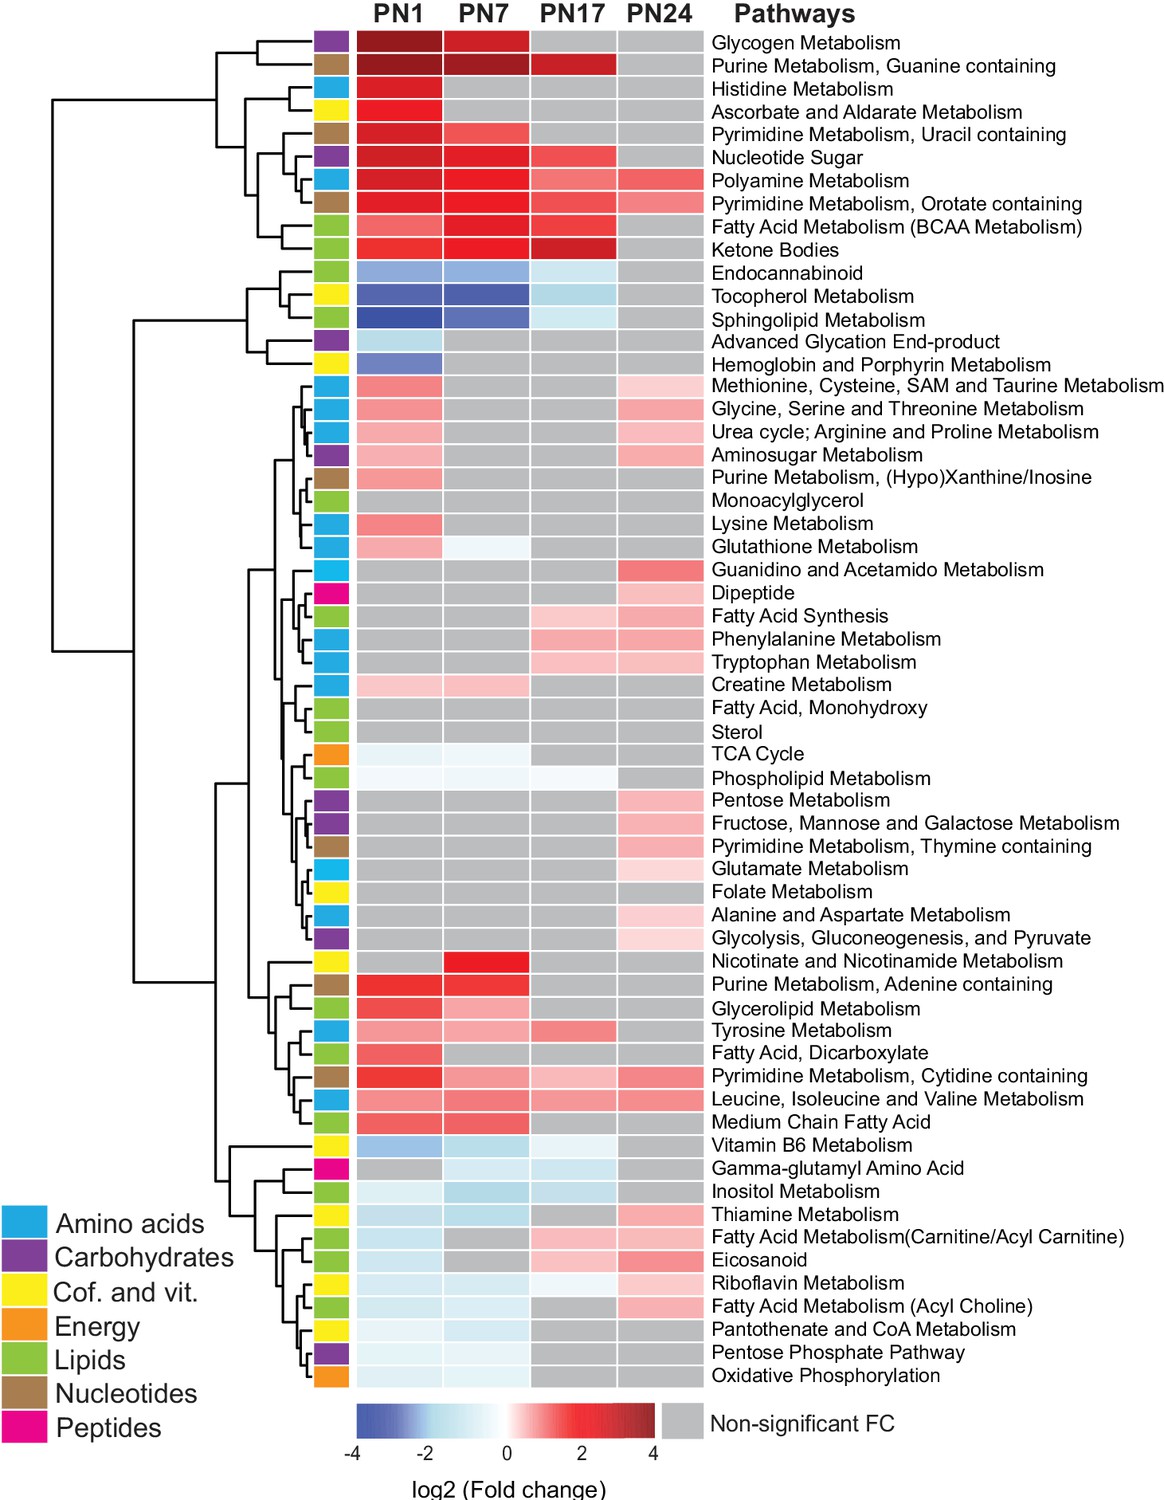
Changes in the main metabolic pathways across development compared to adult age.
Unsupervised hierarchical cluster analysis (HCA) of 59 metabolomic pathways grouped into seven main endogenous families of metabolites: amino acids, carbohydrates, cofactors and vitamins, energy metabolism, lipids, nucleotides, and peptides. HCA was generated using Euclidean distances based on the log2(fold change) values of mean peak intensities associated with each pathway at each age, relative to the corresponding values at postnatal day 80 (PN80). Red and blue boxes in the heatmap indicate significant positive and negative fold changes, respectively. Gray boxes indicate non-significant fold changes (FC). In the dendrogram, metabolomic pathways that undergo similar variations across development are clustered close to one another. Statistical significance: p < 0.05 (one-way ANOVA followed by Tukey’s multiple comparisons test). n = 5–7 rats per group; one experiment. See Figure 2—source data 1 for numerical values and detailed statistical information.
-
Figure 2—source data 1
Numerical values and detailed statistical information.
- https://cdn.elifesciences.org/articles/68590/elife-68590-fig2-data1-v1.xlsx
Figure 3
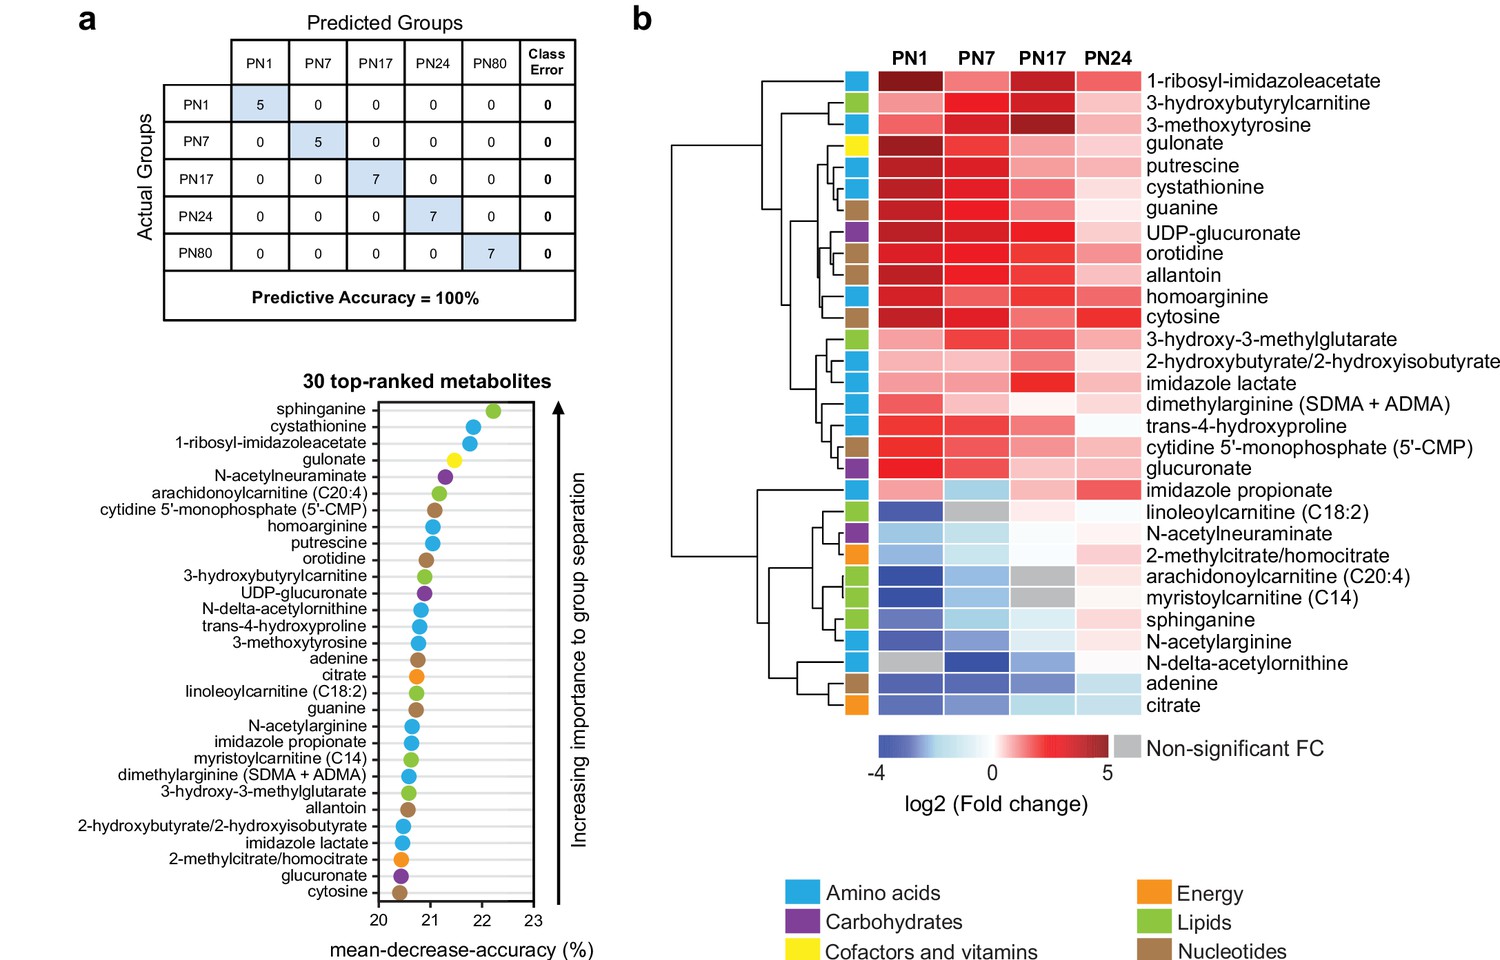
The 30 top-ranked metabolites that change in the hippocampus over post-natal development.
(a) Random forest (RF) analysis was used to identify the 30 top-ranked metabolites that contribute to the differences between the five untrained developmental groups. Variable permutations and measures of ‘mean decrease accuracy’ were used to identify the 30 top-ranked metabolites that make the largest contribution to the classification. As shown in the table, RF analysis yielded a predictive accuracy of 100% (random segregation of samples would give a predictive accuracy of 20%), confirming accurate classification of the samples into the five developmental groups. (b) Unsupervised hierarchical cluster analysis (HCA) of the 30 top-ranked metabolites identified after RF analysis. HCA was generated using Euclidean distances based on the log2(fold change) values of mean peak intensities associated with each metabolite at each age relative to the corresponding values at postnatal day 80 (PN80). Red and blue boxes in the heatmap indicate significant relative increases and decreases in metabolite levels, respectively. Gray boxes indicate non-significant fold change (FC) values. In the dendrogram, metabolites that undergo similar variations across development are clustered close to one another. Statistical significance: p < 0.05, q-value < 0.1 (one-way ANOVA followed by Tukey’s multiple comparisons test and estimation of the false discovery rate [FDR]). n = 5–7 rats per group; one experiment. See Figure 3—source data 1 for numerical values and detailed statistical information.
-
Figure 3—source data 1
Numerical values and detailed statistical information.
- https://cdn.elifesciences.org/articles/68590/elife-68590-fig3-data1-v1.xlsx
Figure 4
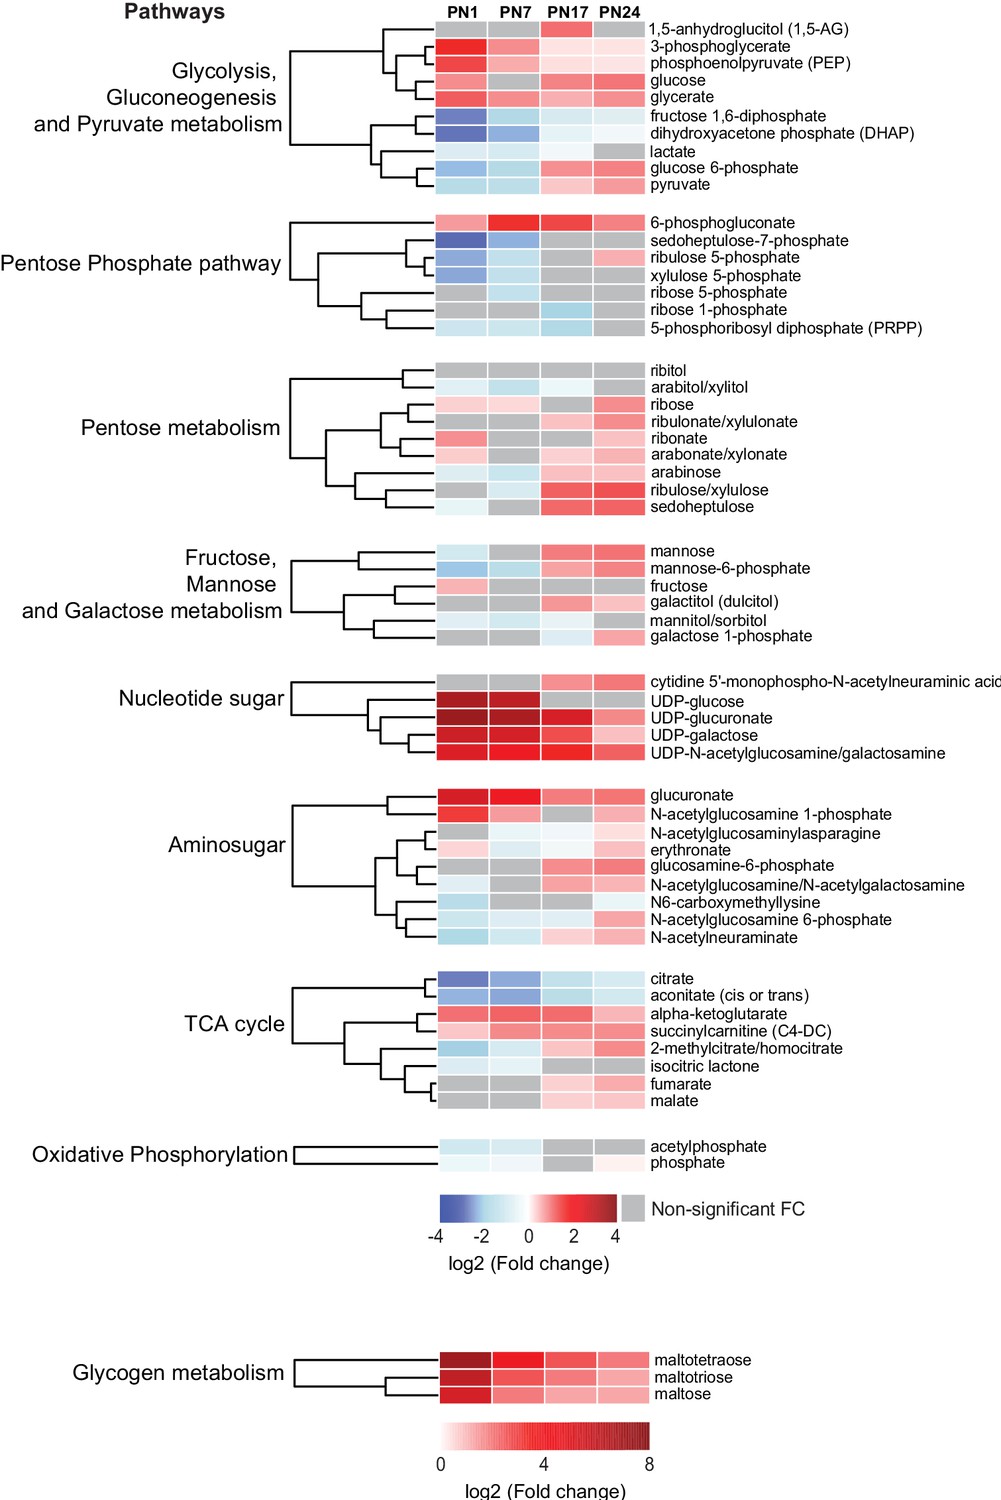
Changes in carbohydrates and tricarboxylic acid (TCA) cycle-related metabolites across development.
Unsupervised hierarchical cluster analysis (HCA) of 59 metabolites grouped into nine pathways: (1) glycolysis, gluconeogenesis, and pyruvate metabolism, (2) pentose phosphate pathway, (3) pentose metabolism, (4) fructose, mannose, and galactose metabolism, (5) nucleotide sugar, (6) aminosugar, (7) TCA cycle, (8) oxidative phosphorylation, and (9) glycogen metabolism. HCAs were generated using Euclidean distances based on the log2(fold change [FC]) values of mean peak intensities associated with each metabolite at each age relative to the corresponding values at postnatal day 80 (PN80). Red and blue boxes in the heatmap indicate significant relative increases and decreases in metabolite levels, respectively. Gray boxes indicate non-significant FC. In the dendrograms, metabolites that undergo similar variations across development are clustered close to one another. Statistical significance: p < 0.05, q-value <0.1 (one-way ANOVA followed by Tukey’s multiple comparisons test and estimation of the false discovery rate [FDR]). n = 5–7 rats per group; one experiment. See Figure 4—source data 1 for numerical values and detailed statistical information.
-
Figure 4—source data 1
Numerical values and detailed statistical information.
- https://cdn.elifesciences.org/articles/68590/elife-68590-fig4-data1-v1.xlsx
Figure 5

Metabolomic changes induced by learning in the hippocampus at postnatal day 17 (PN17), PN24, and PN80.
(a–c) Volcano plots depicting the relationship between the fold changes and p-values between trained and untrained rats at PN17 (a), PN24 (b), and PN80 (c). In the volcano plots, each dot represents a specific metabolite. The y-axis shows the negative log10 of p-values (a higher value indicates greater significance) and the x-axis shows the log2 of the fold changes between values of mean peak intensities of trained rats relative to untrained rats. The dashed lines depict the thresholds of significance. Gray dots represent non-significant fold changes; blue and red dots represent significantly downregulated and upregulated metabolites, respectively. The volcano plots show the names of the top-5 downregulated or upregulated metabolites at the three different developmental ages. (d, e) The pie charts depict the numbers of metabolites significantly altered at PN17 (d) and PN80 (e), in the main endogenous pathways: amino acids, carbohydrates, cofactors and vitamins, energy-related metabolites, lipids, nucleotides, and peptides. The bar graphs depict the metabolites significantly altered 1 hr after learning at PN17 (d) and PN80 (e), in descending order of magnitude based on the log2(fold changes) between values of mean peak intensities of trained rats relative to untrained rats. Statistical significance: p < 0.05; q-value < 0.1 (two-tailed unpaired Welch’s t-test and estimation of the false discovery rate [FDR]). n = 7 rats per group; one experiment. See Figure 5—source data 1 for numerical values and detailed statistical information.
-
Figure 5—source data 1
Numerical values and detailed statistical information.
- https://cdn.elifesciences.org/articles/68590/elife-68590-fig5-data1-v1.xlsx
Figure 6
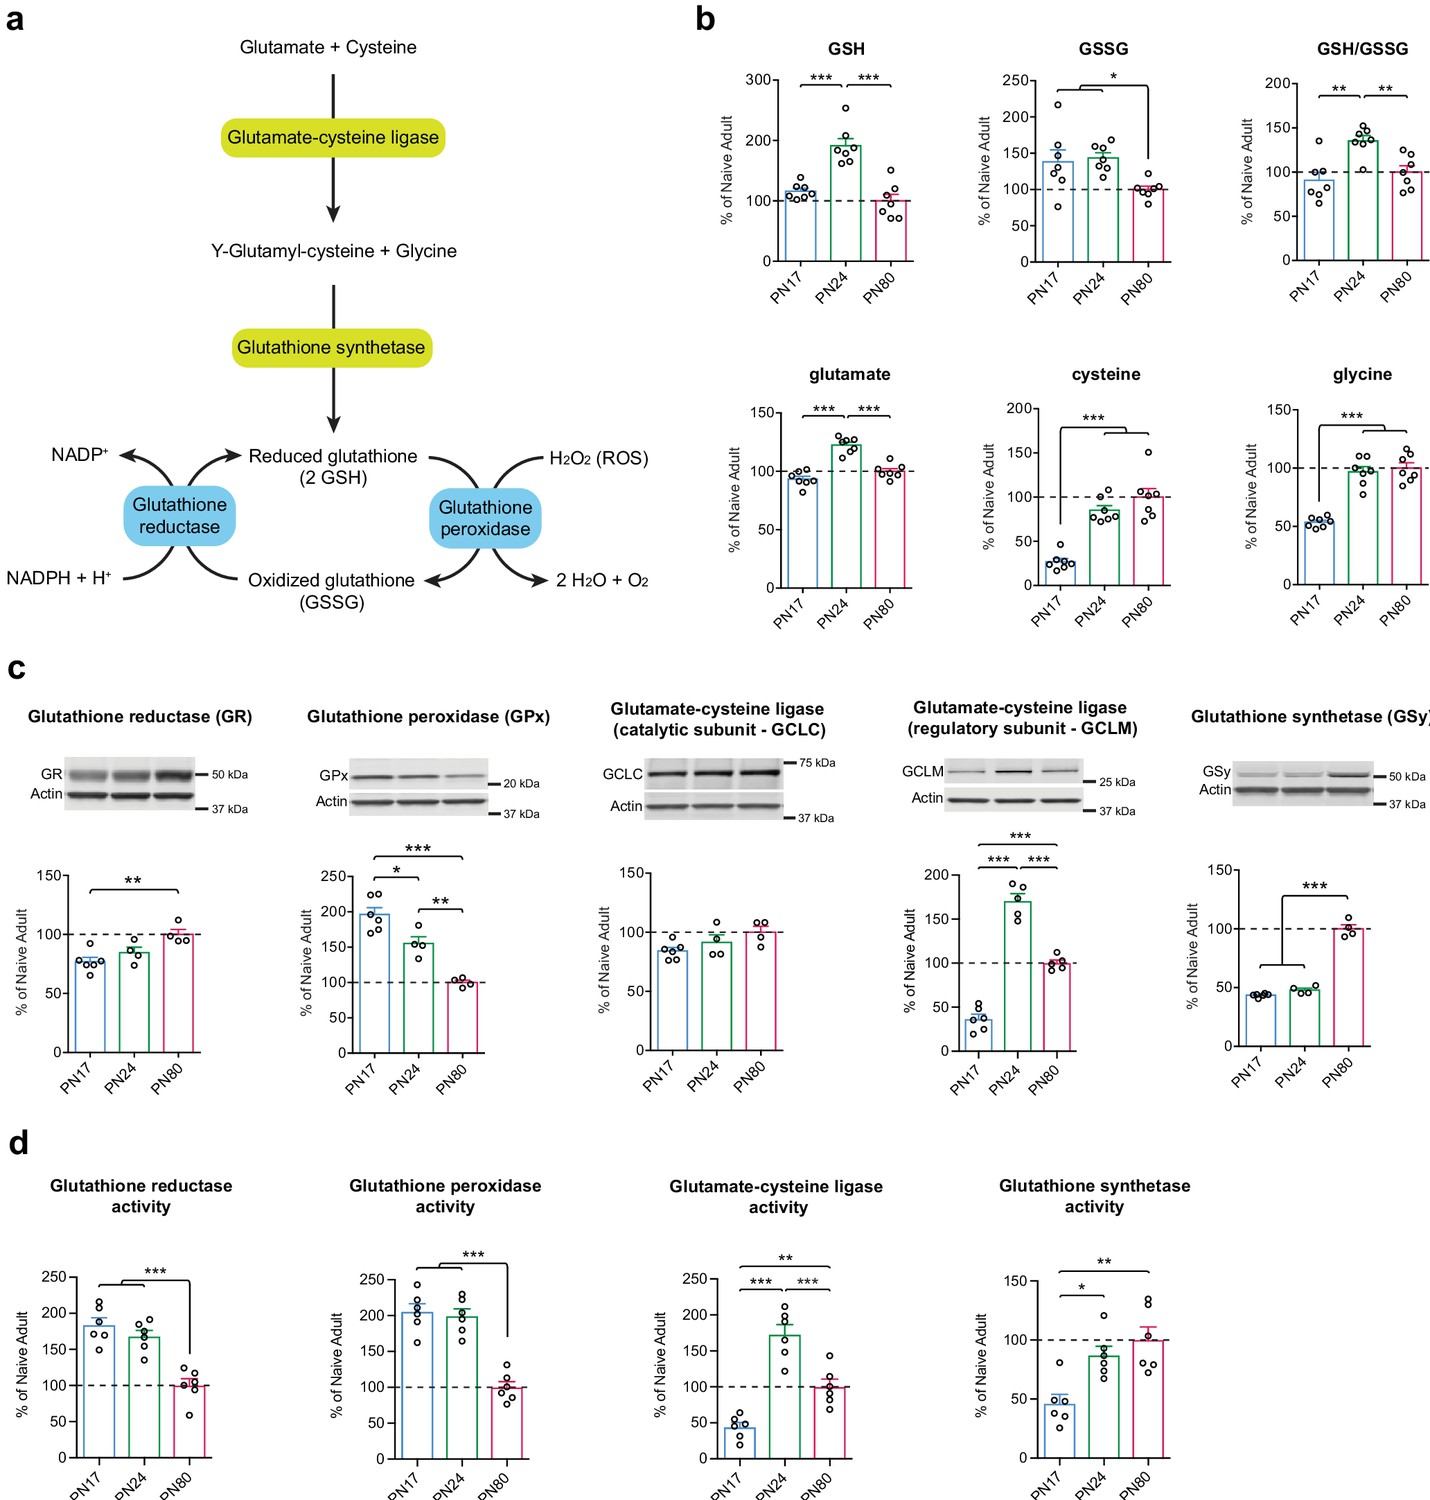
Glutathione-mediated antioxidant capacity is lower in the infant than in the juvenile and adult hippocampus.
(a) Scheme depicting the glutathione oxidation/reduction cycle and biosynthesis pathway. (b) Quantification by ultrahigh performance liquid chromatography-tandem mass spectroscopy (UPLC-MS/MS) of reduced (GSH) and oxidized (GSSG) forms of glutathione, of the GSH/GSSG ratio, and of the GSH amino acid precursors glutamate, cysteine, and glycine in hippocampal samples from postnatal day 17 (PN17), PN24, and PN80 (n = 7 rats per group; one experiment). Data are expressed as mean percentage ± s.e.m. of the value in naive adult group (PN80). *p < 0.05; **p < 0.01, ***p < 0.001 (one-way ANOVA followed by Tukey’s multiple comparisons test). (c) Representative examples and densitometric Western blot analyses of glutathione reductase (GR), glutathione peroxidase (GPx – isozyme 1), glutamate-cysteine ligase (catalytic subunit GCLC, and regulatory subunit GCLM), and glutathione synthetase (GSy), carried out with whole-protein extracts of dHC from PN17 (n = 6), PN24 (n = 4–5), and PN80 (n = 4–5) naive rats; two independent experiments. Actin was used as loading control. Data are expressed as mean percentage ± s.e.m. of the value in naive adult group. *p < 0.05, **p < 0.01, ***p < 0.001 (one-way ANOVA followed by Tukey’s multiple comparisons test). (d) Mean activity of GR, GPx, GCL, and GSy (expressed as the quantity, in nmol, of substrate transformed per minute and normalized to the total quantity of proteins in each sample, in mg) assayed in dHC protein extracts from PN17 (n = 6), PN24 (n = 6), and PN80 (n = 6) naive rats; two independent experiments. Data are expressed as mean percentage ± s.e.m. of the value in naive adult group. *p < 0.05, **p < 0.01, ***p < 0.001 (one-way ANOVA followed by Tukey’s multiple comparisons test). See Figure 6—source data 1 and Figure 6—source data 2 for numerical values and detailed statistical information.
-
Figure 6—source data 1
Numerical values.
- https://cdn.elifesciences.org/articles/68590/elife-68590-fig6-data1-v1.xlsx
-
Figure 6—source data 2
Detailed statistical information.
- https://cdn.elifesciences.org/articles/68590/elife-68590-fig6-data2-v1.docx
Figure 7
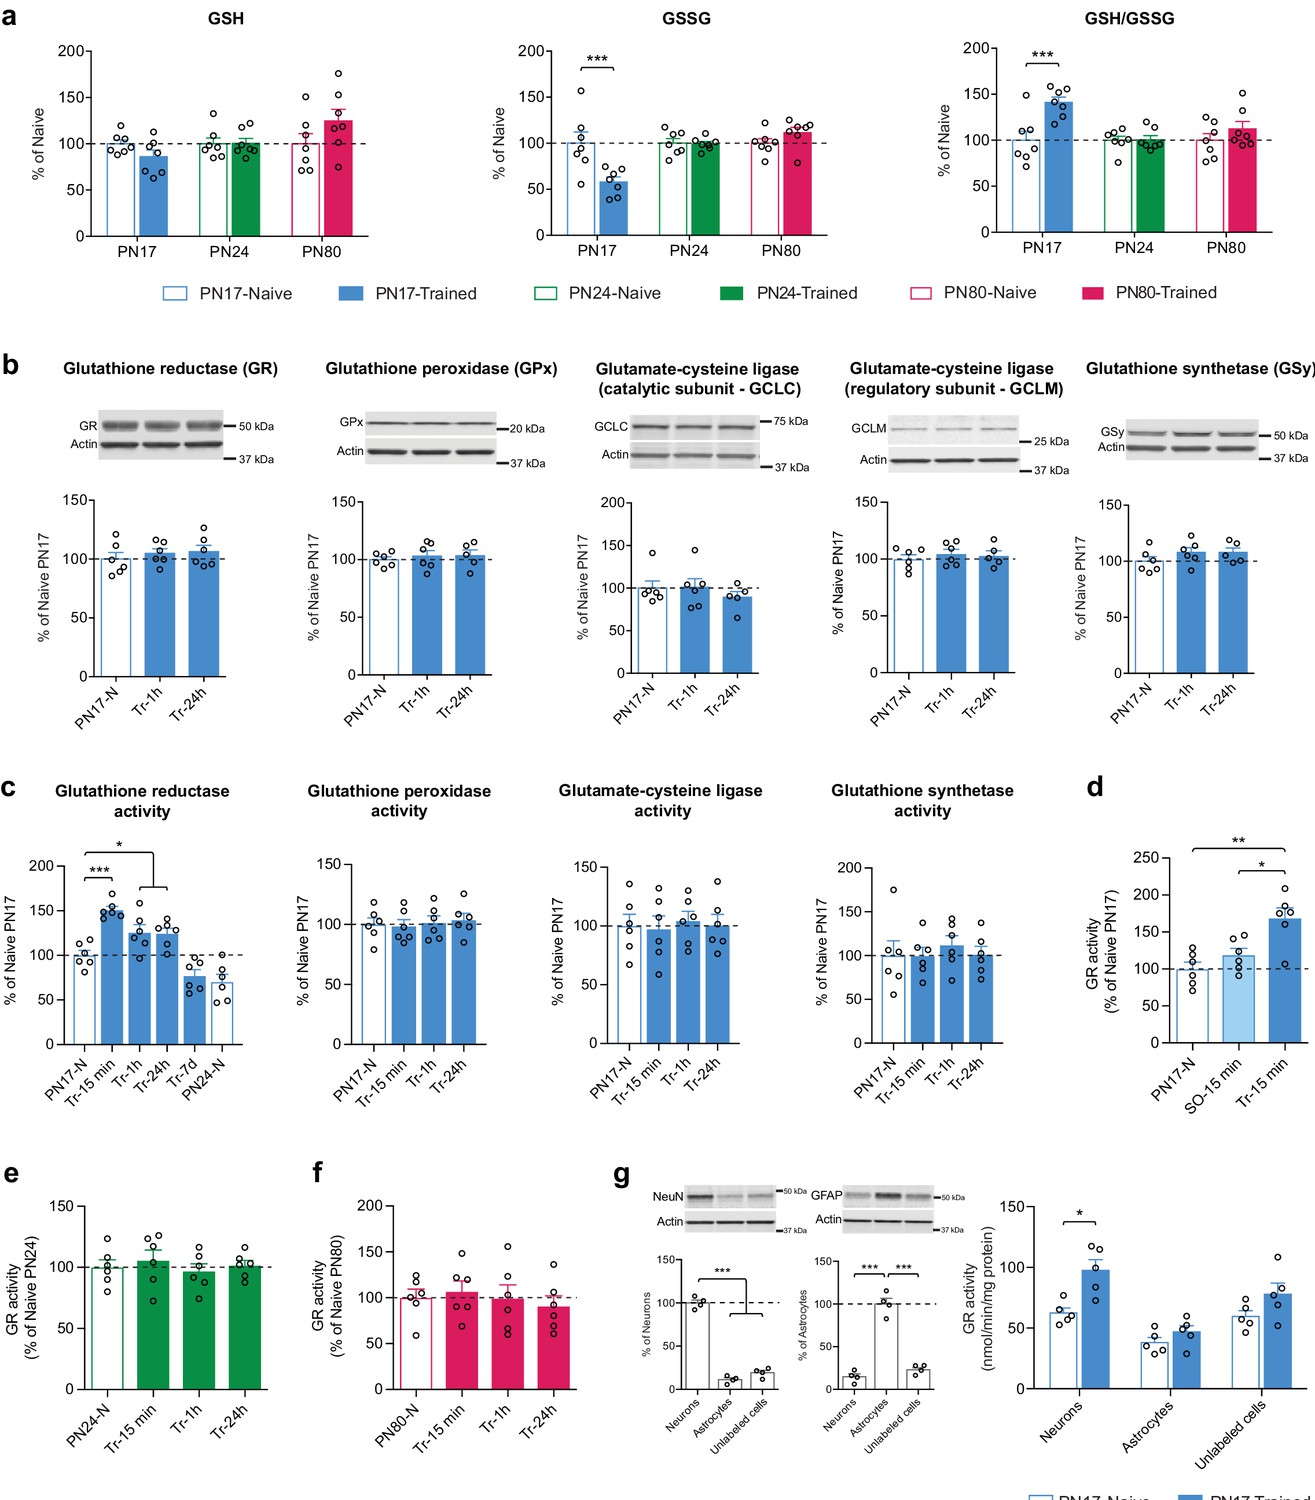
Infant episodic learning increases neuronal glutathione reductase (GR) activity.
(a) Quantification by ultrahigh performance liquid chromatography-tandem mass spectroscopy (UPLC-MS/MS) of reduced (GSH) and oxidized (GSSG) forms of glutathione and the GSH/GSSG ratio in whole hippocampus from PN17, PN24, and PN80, in the untrained condition and 1 hr after inhibitory avoidance (IA) training (n = 7 rats per group). Data are expressed as mean percentage ± s.e.m. of the value in naive group at each age. ***p < 0.001 (two-way ANOVA followed by Bonferroni’s multiple comparisons test). (b) Representative examples and densitometric Western blot analyses of GR, glutathione peroxidase isozyme 1 (GPx), glutamate-cysteine ligase (catalytic subunit GCLC, and regulatory subunit GCLM), and glutathione synthetase (GSy), carried out with whole-protein extracts of dHC from postnatal day 17 naive rats (PN17-N) and rats trained in IA at PN17 and euthanized 1 hr (Tr-1h) or 24 hr (Tr-24h) after training (n = 5–6 rats per group; two independent experiments). Actin was used as the loading control. Data are expressed as mean percentage ± s.e.m. of the value in PN17 naive rats. p > 0.05 (one-way ANOVA followed by Tukey’s multiple comparisons test). (c) Mean activity of GR, GPx, GCL, and GSy (expressed as the quantity, in nmol, of substrate transformed per minute and normalized to the total quantity of proteins in each sample, in mg) assayed in dHC protein extracts obtained from rats trained in IA at PN17 and euthanized 15 min, 1 hr, 24 hr, or 7 days after training (Tr-15min, Tr-1h, Tr-24h, and Tr-7d, respectively) (n = 6 rats per group; two independent experiments). To account for developmental differences, two groups of naive (N) rats were used: PN17 and PN24 (n = 6 rats per group). Data are expressed as mean percentage ± s.e.m of the value in PN17 naive rats. *p < 0.05, ***p < 0.001: significance vs. PN17 naive rats (one-way ANOVA followed by Dunnett’s multiple comparisons test); p > 0.05 for the comparison between PN24-N and Tr-7d groups (two-tailed unpaired Student’s t-test). (d) GR activity carried out with dHC protein extracts obtained from PN17 naive rats (PN17-N), from rats exposed to an immediate footshock without IA-context exposure (shock-only) and euthanized 15 min later (SO-15min) or from rats trained in IA at PN17 and euthanized 15 min later (Tr-15min) (n = 6 rats per group; two independent experiments). GR activity is expressed as mean percentage ± s.e.m of the value in PN17 naive rats. *p < 0.05, **p < 0.01 (one-way ANOVA followed by Tukey’s multiple comparisons test). (e) GR activity assayed in dHC protein extracts obtained from PN24 naive rats (PN24-N) and rats trained in IA at PN24 and euthanized 15 min, 1 hr, or 24 hr after training (Tr-15min, Tr-1h, and Tr-24h, respectively) (n = 6 rats per group; two independent experiments). GR activity is expressed as mean percentage ± s.e.m of the value in PN24 naive rats. p > 0.05 (one-way ANOVA followed by Dunnett’s multiple comparisons test). (f) GR activity assayed in dHC protein extracts obtained from PN80 naive rats (PN80-N) and rats trained in IA at PN80 and euthanized 15 min, 1 hr, or 24 hr after training (Tr-15min, Tr-1h, and Tr-24h, respectively) (n = 6 rats per group; two independent experiments). GR activity is expressed as mean percentage ± s.e.m of the value in PN80 naive rats. p > 0.05 (one-way ANOVA followed by Dunnett’s multiple comparisons test). (g) Representative examples and densitometric Western blot analyses of NeuN and GFAP carried out with whole-protein extracts of fluorescence-activated cell sorting (FACS)-sorted neurons (NeuN+), astrocytes (GFAP+), and unlabeled counter-selected cells from the dHC of PN17 naive rats (n = 4 x 3 rats per group; two independent experiments). Actin was used as the loading control. NeuN intensity values are expressed as mean percentage ± s.e.m. of the value in neurons (NeuN+) group; GFAP intensity values are expressed as mean percentage ± s.e.m. of the value in astrocytes (GFAP+) group. ***p < 0.001 (one-way ANOVA followed by Tukey’s multiple comparisons test). GR activity carried out with whole-protein extracts of FACS-sorted neurons (NeuN+), astrocytes (GFAP+), and unlabeled cells from the dHC of PN17 naive rats (PN17-N) and of rats trained in IA at PN17 and euthanized 15 min later (Tr-15min) (n = 5 x 3 rats per group; two independent experiments). GR activity is expressed as mean nmol/min/mg protein± s.e.m. *p < 0.05 (two-way ANOVA followed by Bonferroni’s multiple comparisons test). See Figure 7—source data 1, Figure 7—source data 2 for numerical values and detailed statistical information.
-
Figure 7—source data 1
Numerical values.
- https://cdn.elifesciences.org/articles/68590/elife-68590-fig7-data1-v1.xlsx
-
Figure 7—source data 2
Detailed statistical information.
- https://cdn.elifesciences.org/articles/68590/elife-68590-fig7-data2-v1.docx
Figure 8

Learning-induced increase in glutathione reductase (GR) activity is required for long-term memory formation in infant rats.
(a) GR activity carried out with dorsal hippocampus (dHC) protein extracts obtained from PN17 naive (N) and trained (Tr) rats that received a bilateral hippocampal injection of the selective GR inhibitor 2-acetylamino-3-[4-(2-acetylamino-2-carboxyethylsulfanylthiocarbonylamino)phenylthio-carbamoylsulfanyl]-propionic acid (2-AAPA) (100 or 200 μM) or Vehicle 15 min before inhibitory avoidance (IA) training. Rats were euthanized 15 min after training (n = 5 rats per group; two independent experiments). GR activity is expressed as mean percentage ± s.e.m. of the value in N-Vehicle group. *p < 0.05, **p < 0.01, ***p < 0.001 (one-way ANOVA followed by Tukey’s multiple comparisons test). (b) Mean latency ± s.e.m. (in seconds, s) of rats injected in the dHC (black arrow) with vehicle or 2-AAPA (100 or 200 μM) 15 min before IA training at PN17 (n = 6–8 rats per group; three independent experiments). Acq: latency to enter the dark side of the chamber at training (Tr). Rats were tested 7 days later (T1), and 2 days later received a reminder shock (RS), followed by another memory retention test 1 day later (T2). At T2, upon entering the shock compartment, rats were trained again (Tr) and tested 1 day later (T3). ***p < 0.001 (two-way repeated measures (RM) ANOVA followed by Bonferroni’s multiple comparisons test). (c–d) Mean latency ± s.e.m. of rats injected in the dHC (black arrow) with vehicle or 2-AAPA (100 μM) 15 min before IA training at PN24 (c), n = 7 rats per group (two independent experiments); or at PN80 (d), n = 6 rats per group (two independent experiments). Memory was tested 1 day after training (T1) and again 6 days later (T2). p > 0.05 (two-way RM ANOVA followed by Bonferroni’s multiple comparisons test). (e–g) Quantification of reduced form of glutathione (GSH) (e), oxidized form of glutathione (GSSG) (f) and of the GSH/GSSG ratio (g) in the dHC of PN17 naive rats (PN17-N) and rats trained in IA at PN17 and euthanized 15 min, 1 hr, or 24 hr after training (Tr-15min, Tr-1h, Tr-24h, respectively) (n = 6 rats per group; two independent experiments). Rats received a bilateral hippocampal injection of the selective GR inhibitor 2-AAPA (100 μM) or vehicle 15 min before IA training at PN17. Data are expressed as mean percentage ± s.e.m. of the value in N-Vehicle group. *p < 0.05, **p < 0.01, ***p < 0.001 (two-way ANOVA followed by Bonferroni’s multiple comparisons test). See Figure 8—source data 1, Figure 8—source data 2 for numerical values and detailed statistical information.
-
Figure 8—source data 1
Numerical values.
- https://cdn.elifesciences.org/articles/68590/elife-68590-fig8-data1-v1.xlsx
-
Figure 8—source data 2
Detailed statistical information.
- https://cdn.elifesciences.org/articles/68590/elife-68590-fig8-data2-v1.docx
Additional files
Download links
A two-part list of links to download the article, or parts of the article, in various formats.
Downloads (link to download the article as PDF)
Open citations (links to open the citations from this article in various online reference manager services)
Cite this article (links to download the citations from this article in formats compatible with various reference manager tools)
Metabolomic profiling reveals a differential role for hippocampal glutathione reductase in infantile memory formation
eLife 10:e68590.
https://doi.org/10.7554/eLife.68590


