Pioneer neutrophils release chromatin within in vivo swarms
- The Bateson Centre and Department of Infection, Immunity and Cardiovascular Disease, University of Sheffield Medical School, United Kingdom
- Australian Regenerative Medicine Institute, Monash University, Australia
- Department of Automatic Control and Systems Engineering, University of Sheffield, United Kingdom
Figures
Figure 1 with 4 supplements
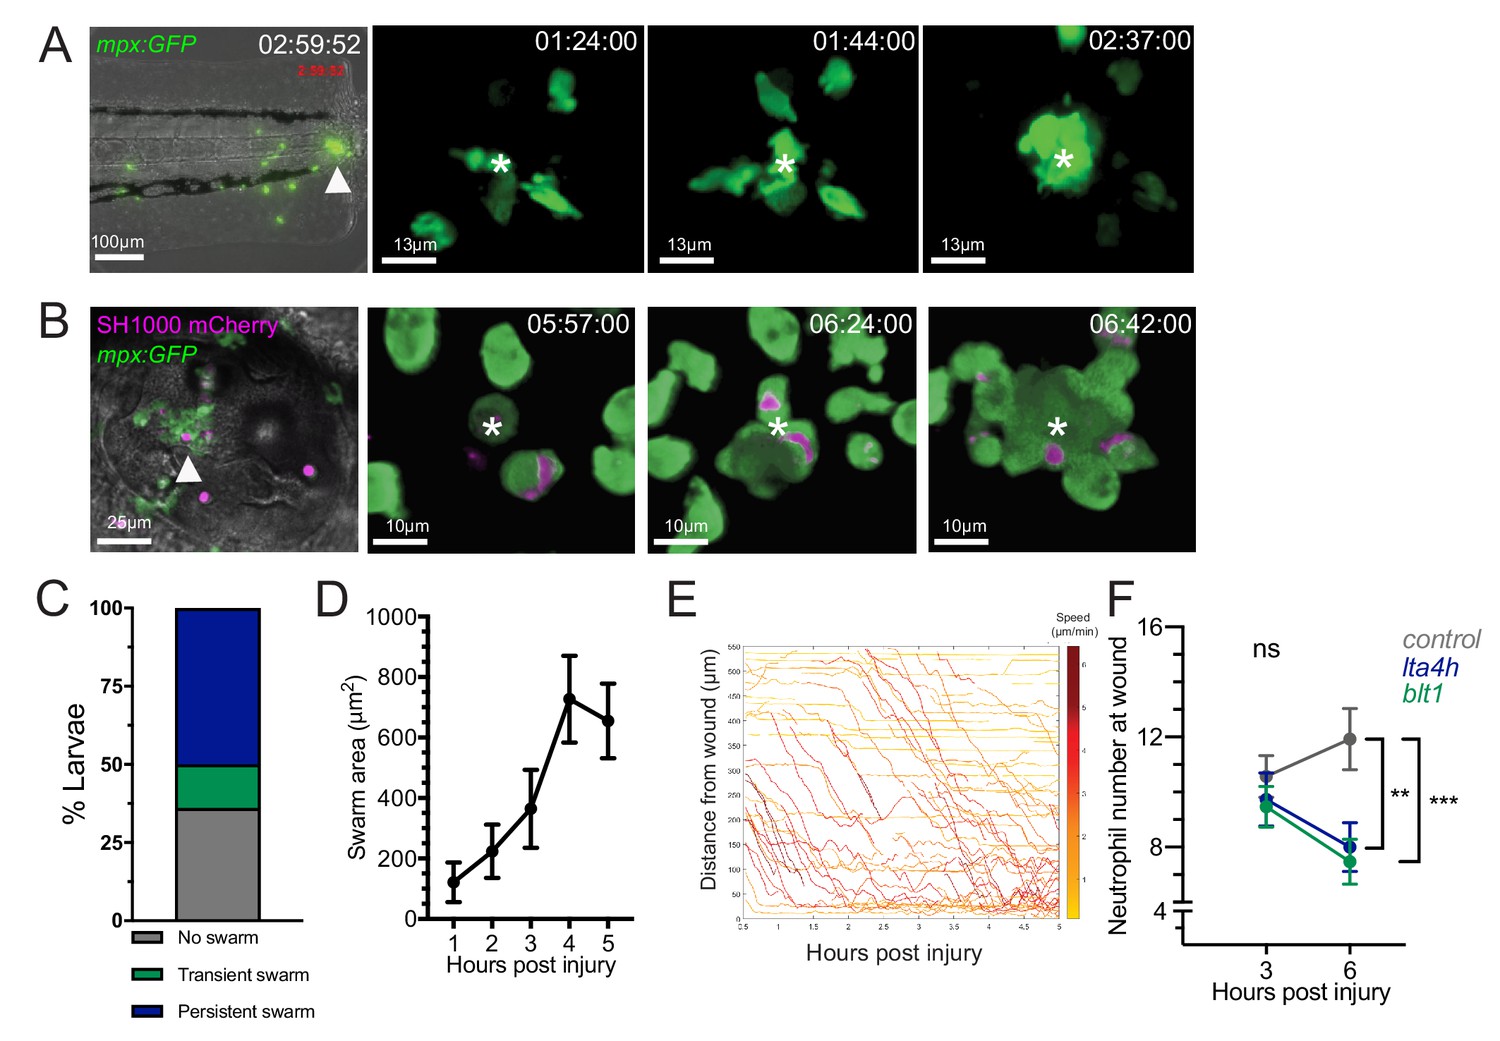
Neutrophil swarming occurs as part of the zebrafish inflammatory response.
(A) Zebrafish neutrophils swarm at sites of tissue damage. Representative image illustrating neutrophils swarming (arrowhead) at the wound site following tail fin transection in 3dpf mpx:GFP larvae. Image was taken using 20× magnification on a TE2000U inverted microscope (Nikon). Time stamp shown is relative to the start of the imaging period at 30 min post injury and is h:mm:ss. 3D reconstruction time course illustrating neutrophils swarming at the wound site (swarm centre is highlighted by white asterisk). Imaging was performed using a 40× objective spinning disk confocal microscope (Perkin Elmer). Time stamps shown are relative to time post-injury and are in hh:mm:ss. (B) Representative image illustrating neutrophil swarming (arrowhead) in otic vesicle infected with S. aureus (magenta). Time stamps shown are hh:mm relative to time post infection. 3D reconstruction time course illustrating neutrophils swarming (swarm centre is highlighted by white asterisk) within the otic vesicle of 2dpf mpx:GFP larvae injected with 2500 cfu S. aureus SH1000 pMV158mCherry. Imaging was performed using a 20× objective spinning disk confocal microscope. Time stamps shown are hh:mm:ss relative to time post injection. (C) The percentage of tailfin transected larvae that had no swarms, transient swarms, or persistent swarms after 6hpi. Data shown are from n = 14 larvae from five biological replicates (Figure 1—source data 1). (D) Area of neutrophil swarms measured at hourly intervals during the 5 hr imaging period. Error bars shown are mean ± SEM, n = 7 larvae with persistent swarms (Figure 1—source data 2). (E) Distance time plot demonstrating the early recruitment of neutrophils proximal to the wound site (<350 μm) followed by the later recruitment of more distant neutrophils. Tracks are colour coded based on their average speed (µm/min). (F) CRISPR/Cas9-mediated knockdown of LTB4 signalling reduces late neutrophil recruitment. Neutrophil counts at the wound site in control tyr crRNA injected larvae (grey line), lta4h crRNA injected larvae (blue line), and blt1 crRNA injected larvae (green line) at 3 and 6 hpi. Error bars shown are mean ± SEM. Groups were analysed using a two-way ANOVA and adjusted using Sidak’s multi comparison test. **p<0.008 n = 45 accumulated from three biological repeats (Figure 1—source data 3).
-
Figure 1—source data 1
Numerical data for the graph of Figure 1C.
- https://cdn.elifesciences.org/articles/68755/elife-68755-fig1-data1-v1.csv
-
Figure 1—source data 2
Numerical data for the graph of Figure 1D.
- https://cdn.elifesciences.org/articles/68755/elife-68755-fig1-data2-v1.csv
-
Figure 1—source data 3
Numerical data for the graph of Figure 1F.
- https://cdn.elifesciences.org/articles/68755/elife-68755-fig1-data3-v1.csv
Figure 1—figure supplement 1
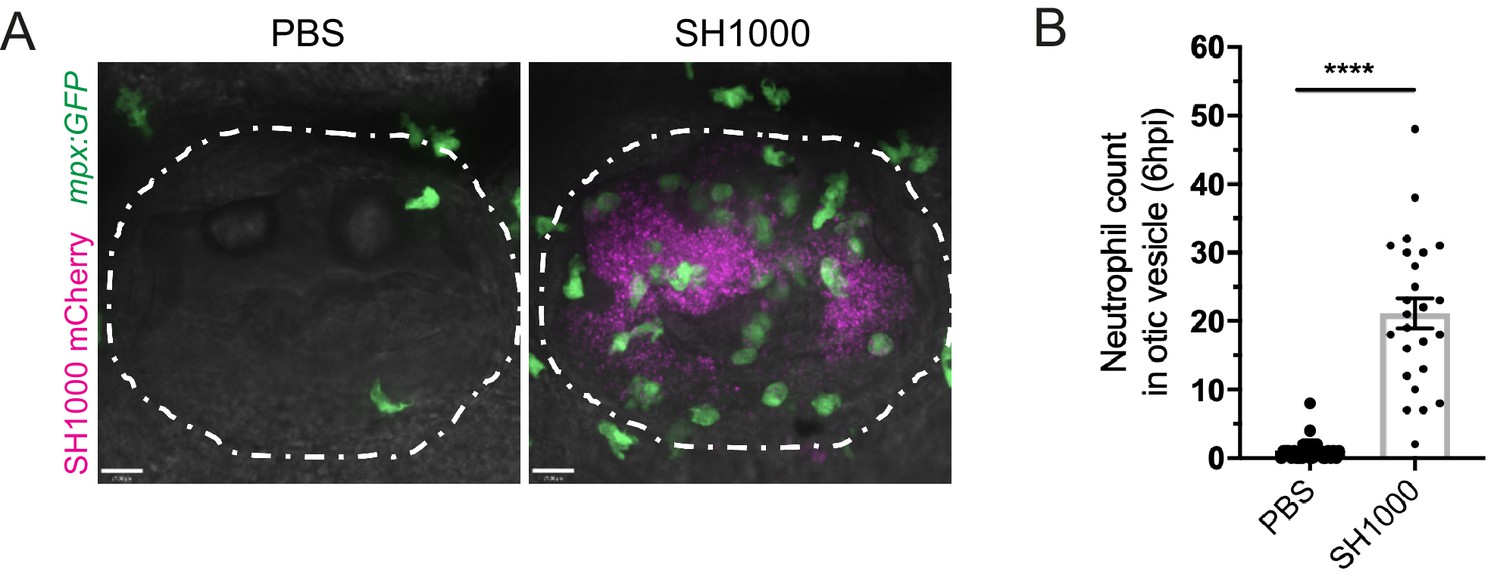
Neutrophil migration to the otic vesicle after Staphylococcus aureus infection.
(A) Neutrophils mobilised to the otic vesicle in response to S. aureus at 6 hpi. Otic vesicles of 2 dpf mpx:GFP larvae injected with a PBS vehicle control or 2500 cfu of S. aureus SH1000 pMV158mCherry. Otic vesicles are highlighted by white dashed area. (B) Number of neutrophils mobilised to the otic vesicle at 6 hpi. Error bars shown are mean ± SEM (****p<0.0001 from an unpaired t-test, n = 32 accumulated from three biological repeats) (Figure 1—figure supplement 1—source data 1).
-
Figure 1—figure supplement 1—source data 1
Numerical data for the graph of Figure 1—figure supplement 1B.
- https://cdn.elifesciences.org/articles/68755/elife-68755-fig1-figsupp1-data1-v1.csv
Figure 1—figure supplement 2
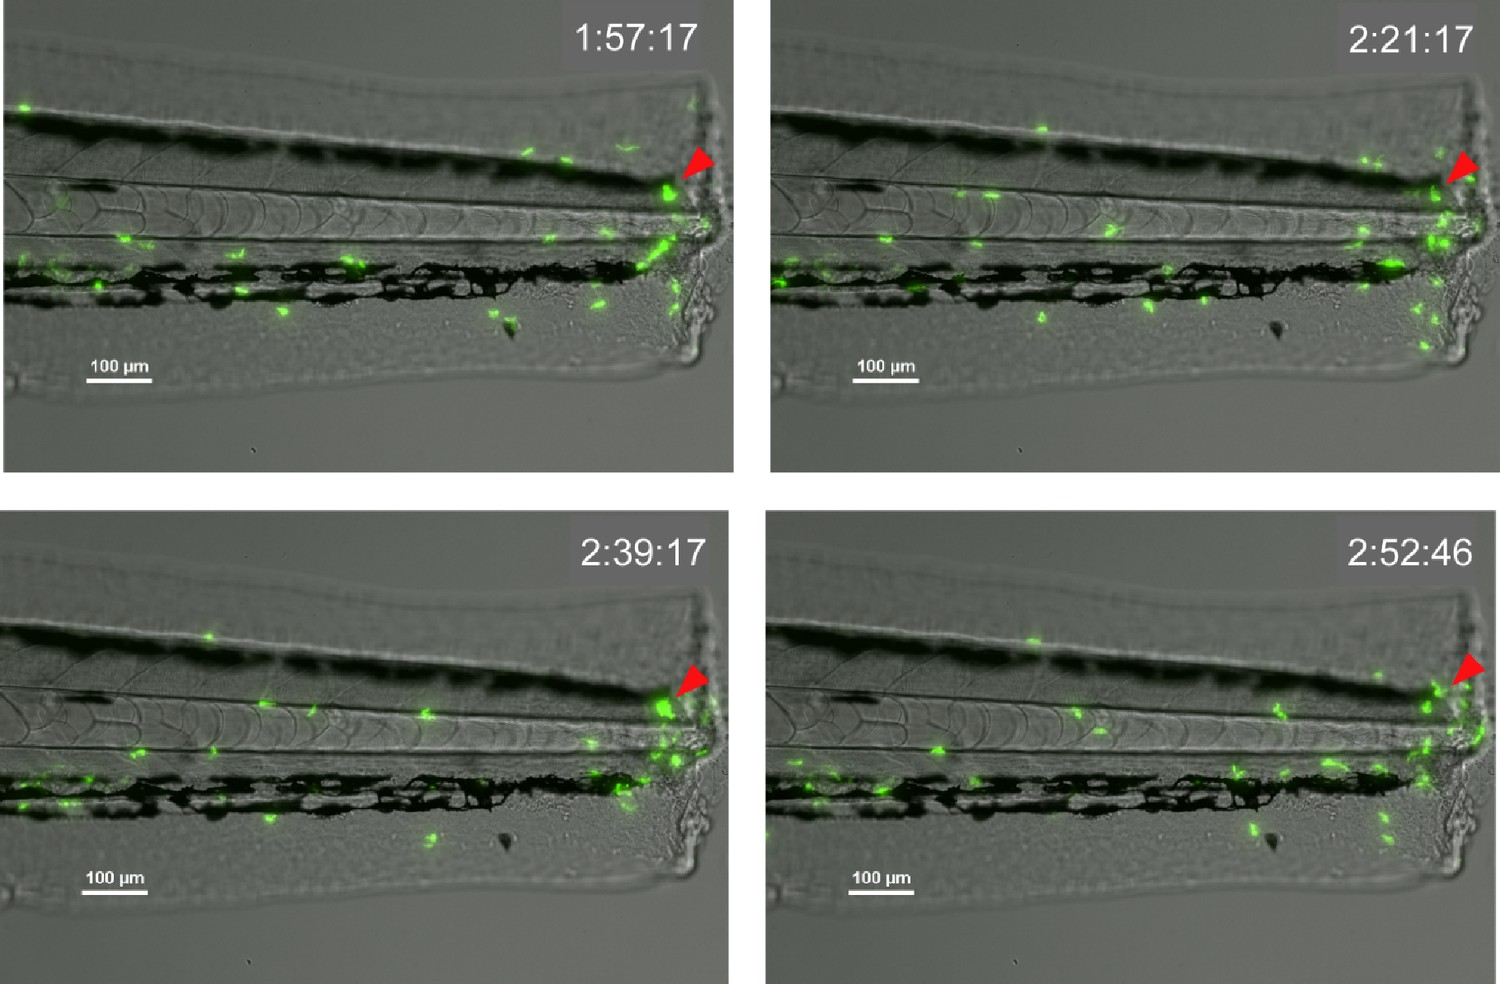
Transient neutrophil swarms at the tailfin wound.
Time course of mpx:GFP transgenic zebrafish larvae following tail-fin transection illustrating short-lived (<1 hr) transient neutrophil swarming at the wound site. Phases of coordinated migration resulting in cluster formation (red arrow) were observed within the imaging period, followed by cluster dissipation and re-formation. Time stamps shown in white (h:mm:ss) are relative to the start of imaging at 30 min post-injury.
Figure 1—figure supplement 3
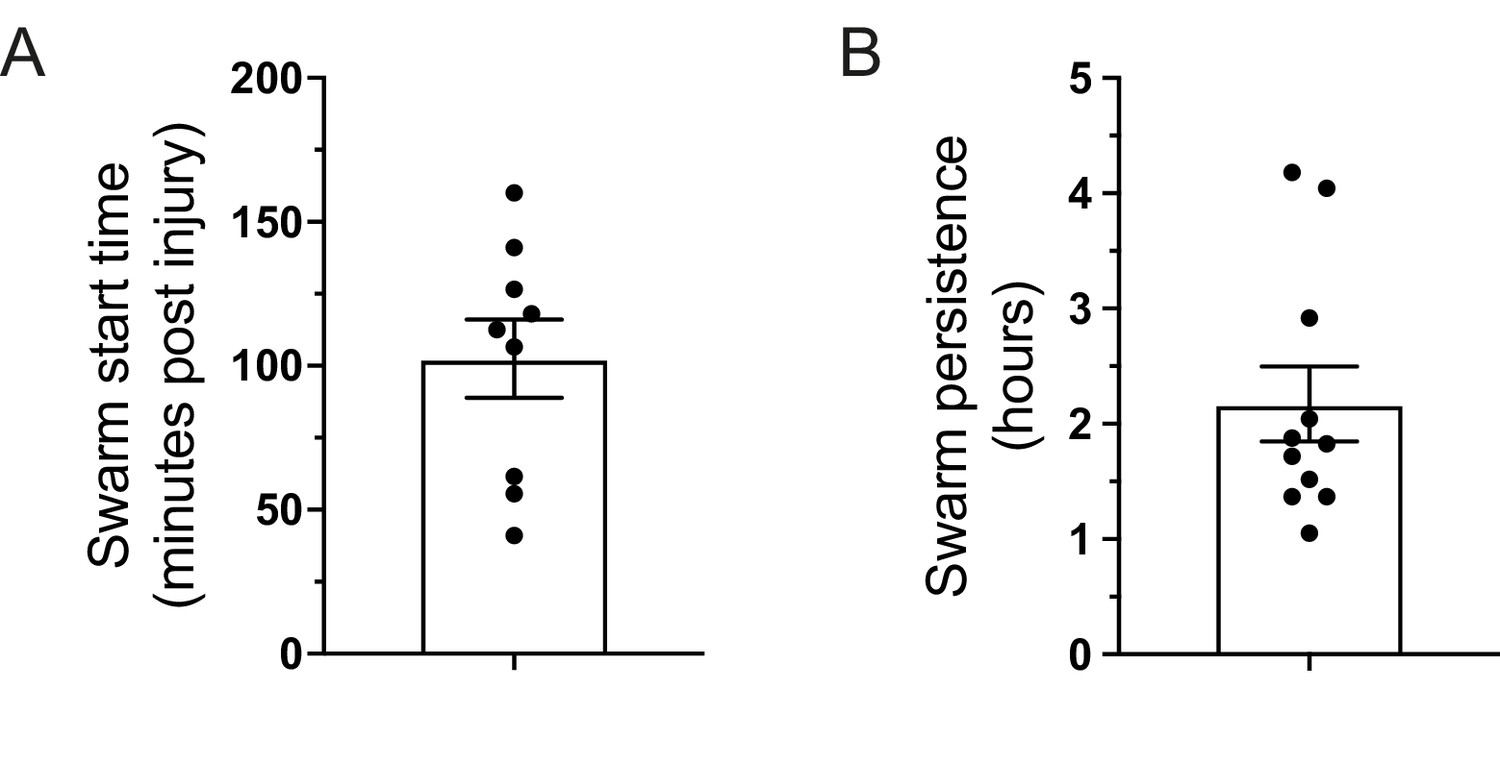
Characterisation of persistent neutrophil swarms.
(A) Time (minutes post-injury) in which persistent neutrophil swarms began to develop following tail-fin transection in zebrafish larvae (n = 9 larvae from five imaging runs) (Figure 1—figure supplement 3—source data 1). (B) Persistence time of neutrophil swarms measured during 5 hr imaging period (n = 11 larvae from five imaging runs) (Figure 1—figure supplement 3—source data 2).
-
Figure 1—figure supplement 3—source data 1
Numerical data for the graph of Figure 1—figure supplement 3A.
- https://cdn.elifesciences.org/articles/68755/elife-68755-fig1-figsupp3-data1-v1.csv
-
Figure 1—figure supplement 3—source data 2
Numerical data for the graph of Figure 1—figure supplement 3B.
- https://cdn.elifesciences.org/articles/68755/elife-68755-fig1-figsupp3-data2-v1.csv
Figure 1—figure supplement 4
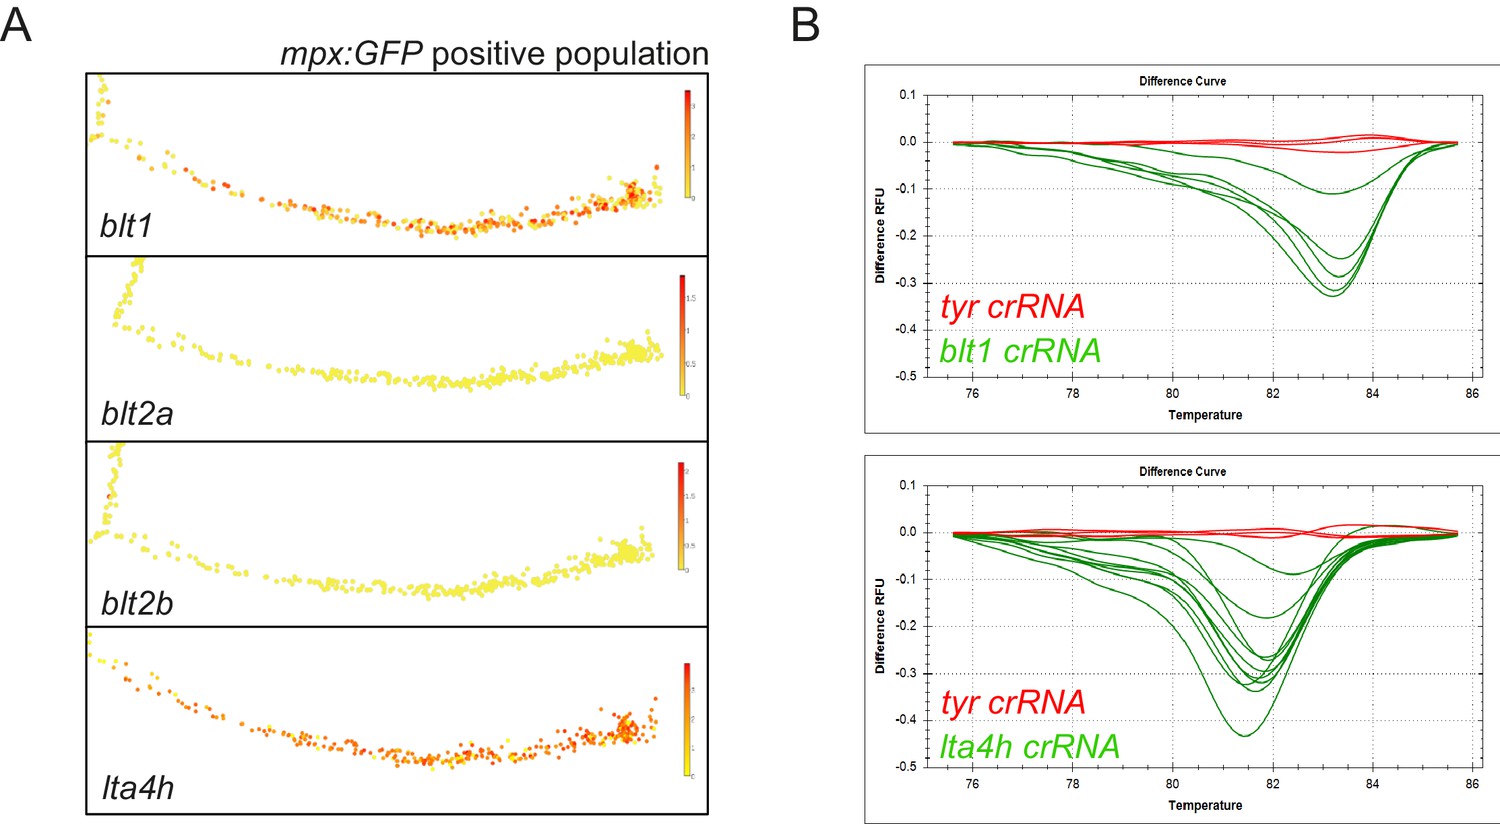
Expression of LTB4 signalling components in zebrafish neutrophils.
(A) Single-cell gene expression profiles of LTB4 signalling components expressed in the zebrafish neutrophil lineage, extracted from the Sanger BASiCz zebrafish blood atlas. Circles represent individual cells colour coded where red is high expression and yellow is no expression. (B) Genotyping example of successful CRISPR-induced indels by high-resolution melt analysis for blt1 and lta4h sgRNA injected larvae. Wild-type curves (red) from three representative control tyrosinase larvae and shifted, irregular melt curves (green) corresponding to mosaic heteroduplex PCR fragments formed as a result of CRISPR/Cas9 mutations.
Figure 2 with 1 supplement

Neutrophil swarms develop around an endogenous pioneer neutrophil.
(A) Reverse chronological time lapse sequence of a persistent neutrophil swarm where one individual neutrophil is visible at the swarm centre (asterisk) prior to neutrophil clustering (arrowhead). Time stamps shown are hh:mm:ss relative to injury time. (B) Chronological time lapse sequence of swarming neutrophils. The pioneer is marked with an arrowhead prior to the addition of further neutrophils to the swarm (asterisk). The result of migration is the aggregation of neutrophils to form clusters. (C) Distance-time plot (DTP) of individual cell migration paths of neutrophils at the wound relative to the pioneer neutrophil (blue plots are swarming neutrophils and green plots are nearest neighbour wound neutrophils that do not participate in the swarm). Tracks are relative to pioneer neutrophil position; swarming neutrophils migrate to the pioneer neutrophil, whilst non-swarming neutrophils do not (n = 4 larvae) (Figure 2—source data 1). (D) Representative image of pioneer and non-pioneer neutrophil morphology. Images were taken using a 40X objective lens on a spinning disk confocal microscope (Perkin Elmer). Scale bars are 20 μm. Quantification of pioneer neutrophil migration pattern in the frames preceding swarming. The circularity index (roundness) (E) (Figure 2—source data 2) and displacement (movement) (F) (Figure 2—source data 3) of pioneer neutrophils and wound neutrophils migrating at the wound site in the same time period (n = 5 larvae, unpaired t-test where *p<0.05 and **p<0.01). (G) Neutrophils were tracked from 30 min post injury. Parameters to study the migration patterns of pioneer and wound neutrophils were compared in the scouting and initiation phases. Neutrophil displacement (the linear distance each neutrophil travelled) (Figure 2—source data 4). Neutrophil speed (Figure 2—source data 5). Neutrophil meandering index (the displacement divided by the total length of the neutrophil track) (Figure 2—source data 6). Error bars are mean ± SEM. Groups were analysed using a two-way ANOVA and adjusted using Sidak’s multi comparison test. *p<0.05, **p<0.01, n = 5 larvae.
-
Figure 2—source data 1
Numerical data for the graph of Figure 2C.
- https://cdn.elifesciences.org/articles/68755/elife-68755-fig2-data1-v1.csv
-
Figure 2—source data 2
Numerical data for the graph of Figure 2E.
- https://cdn.elifesciences.org/articles/68755/elife-68755-fig2-data2-v1.csv
-
Figure 2—source data 3
Numerical data for the graph of Figure 2F.
- https://cdn.elifesciences.org/articles/68755/elife-68755-fig2-data3-v1.csv
-
Figure 2—source data 4
Numerical data for the graph of Figure 2G (Displacement).
- https://cdn.elifesciences.org/articles/68755/elife-68755-fig2-data4-v1.csv
-
Figure 2—source data 5
Numerical data for the graph of Figure 2G (Speed).
- https://cdn.elifesciences.org/articles/68755/elife-68755-fig2-data5-v1.csv
-
Figure 2—source data 6
Numerical data for the graph of Figure 2G (Meandering index).
- https://cdn.elifesciences.org/articles/68755/elife-68755-fig2-data6-v1.csv
Figure 2—figure supplement 1
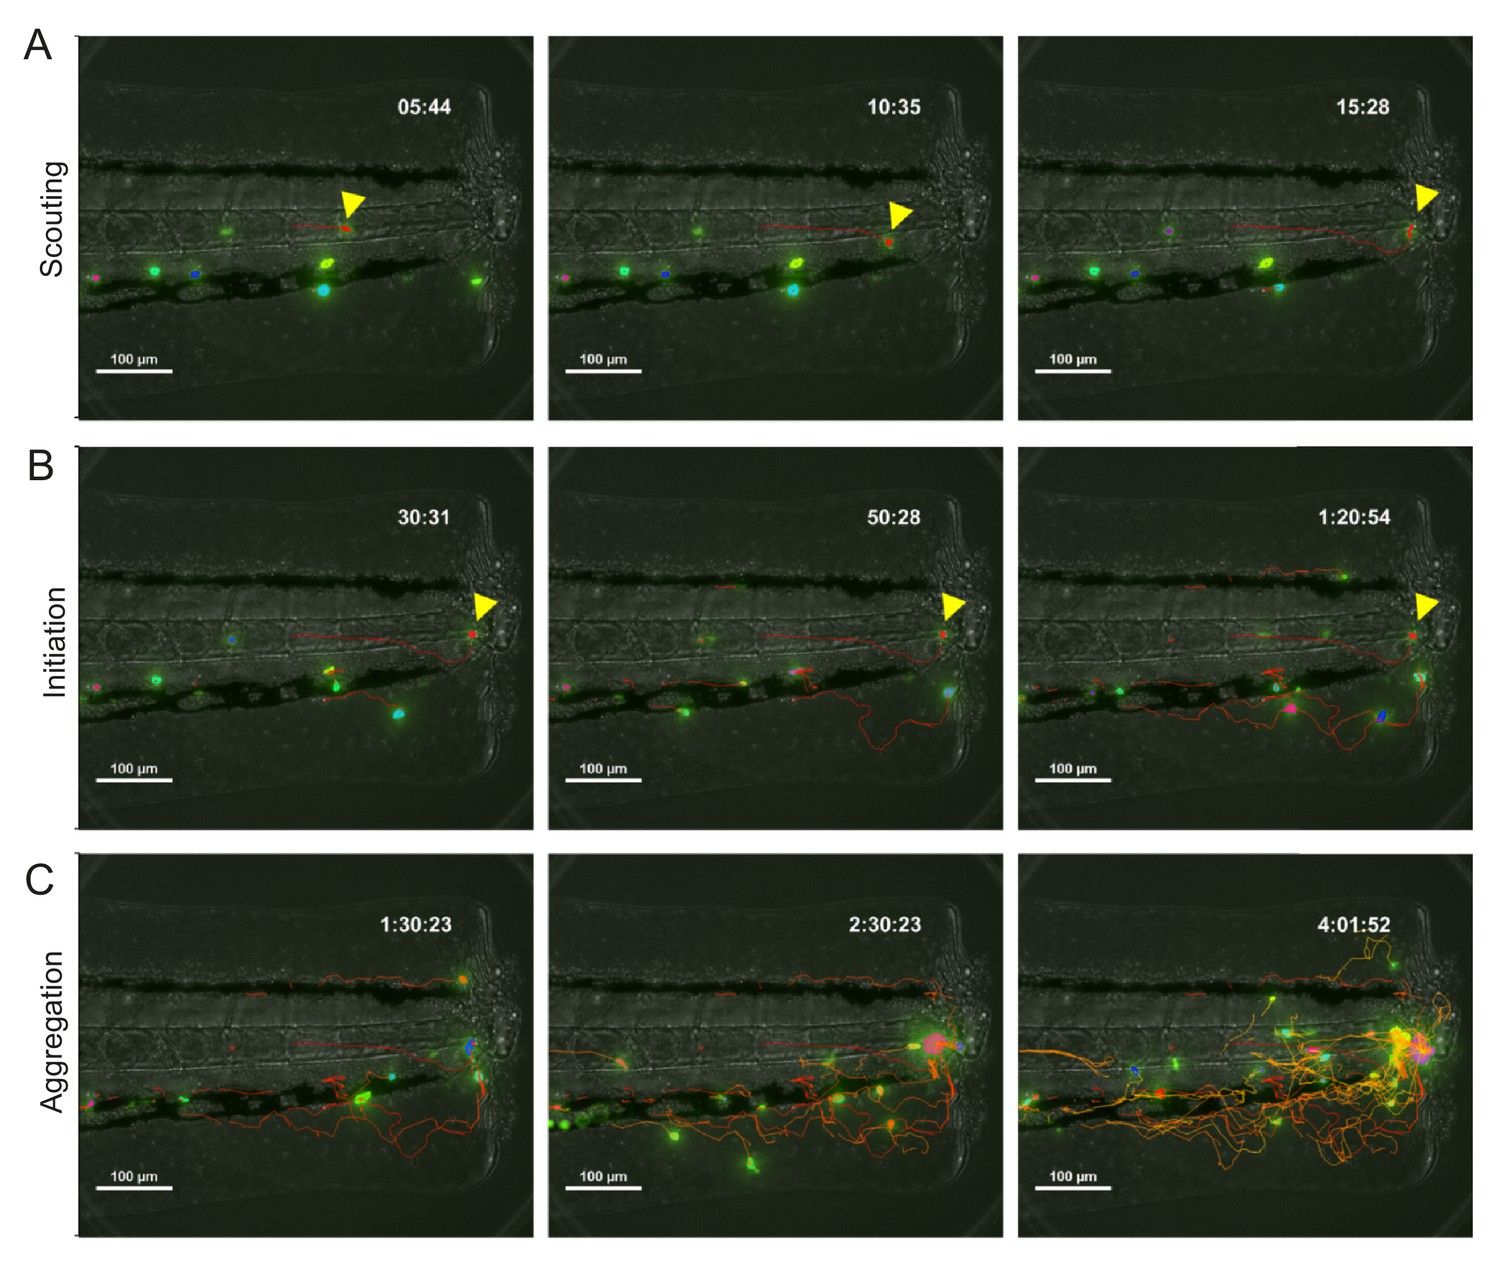
Phases of neutrophil swarming in zebrafish.
(A–C) Tracking of mpx:GFP neutrophils migration to a tailfin wound with automated tracking. Timestamp shows hh:mm:ss post wound. (A) The scouting phase involves the migration of the pioneer neutrophil (red arrowhead) to the wound. (B) The initiation phase sees the halt in migration of the pioneer (red arrowhead) and the migration of initial swarming neutrophils to the pioneer. (C) The aggregation phase involves addition of migrating neutrophils to form the swarm.
Figure 3
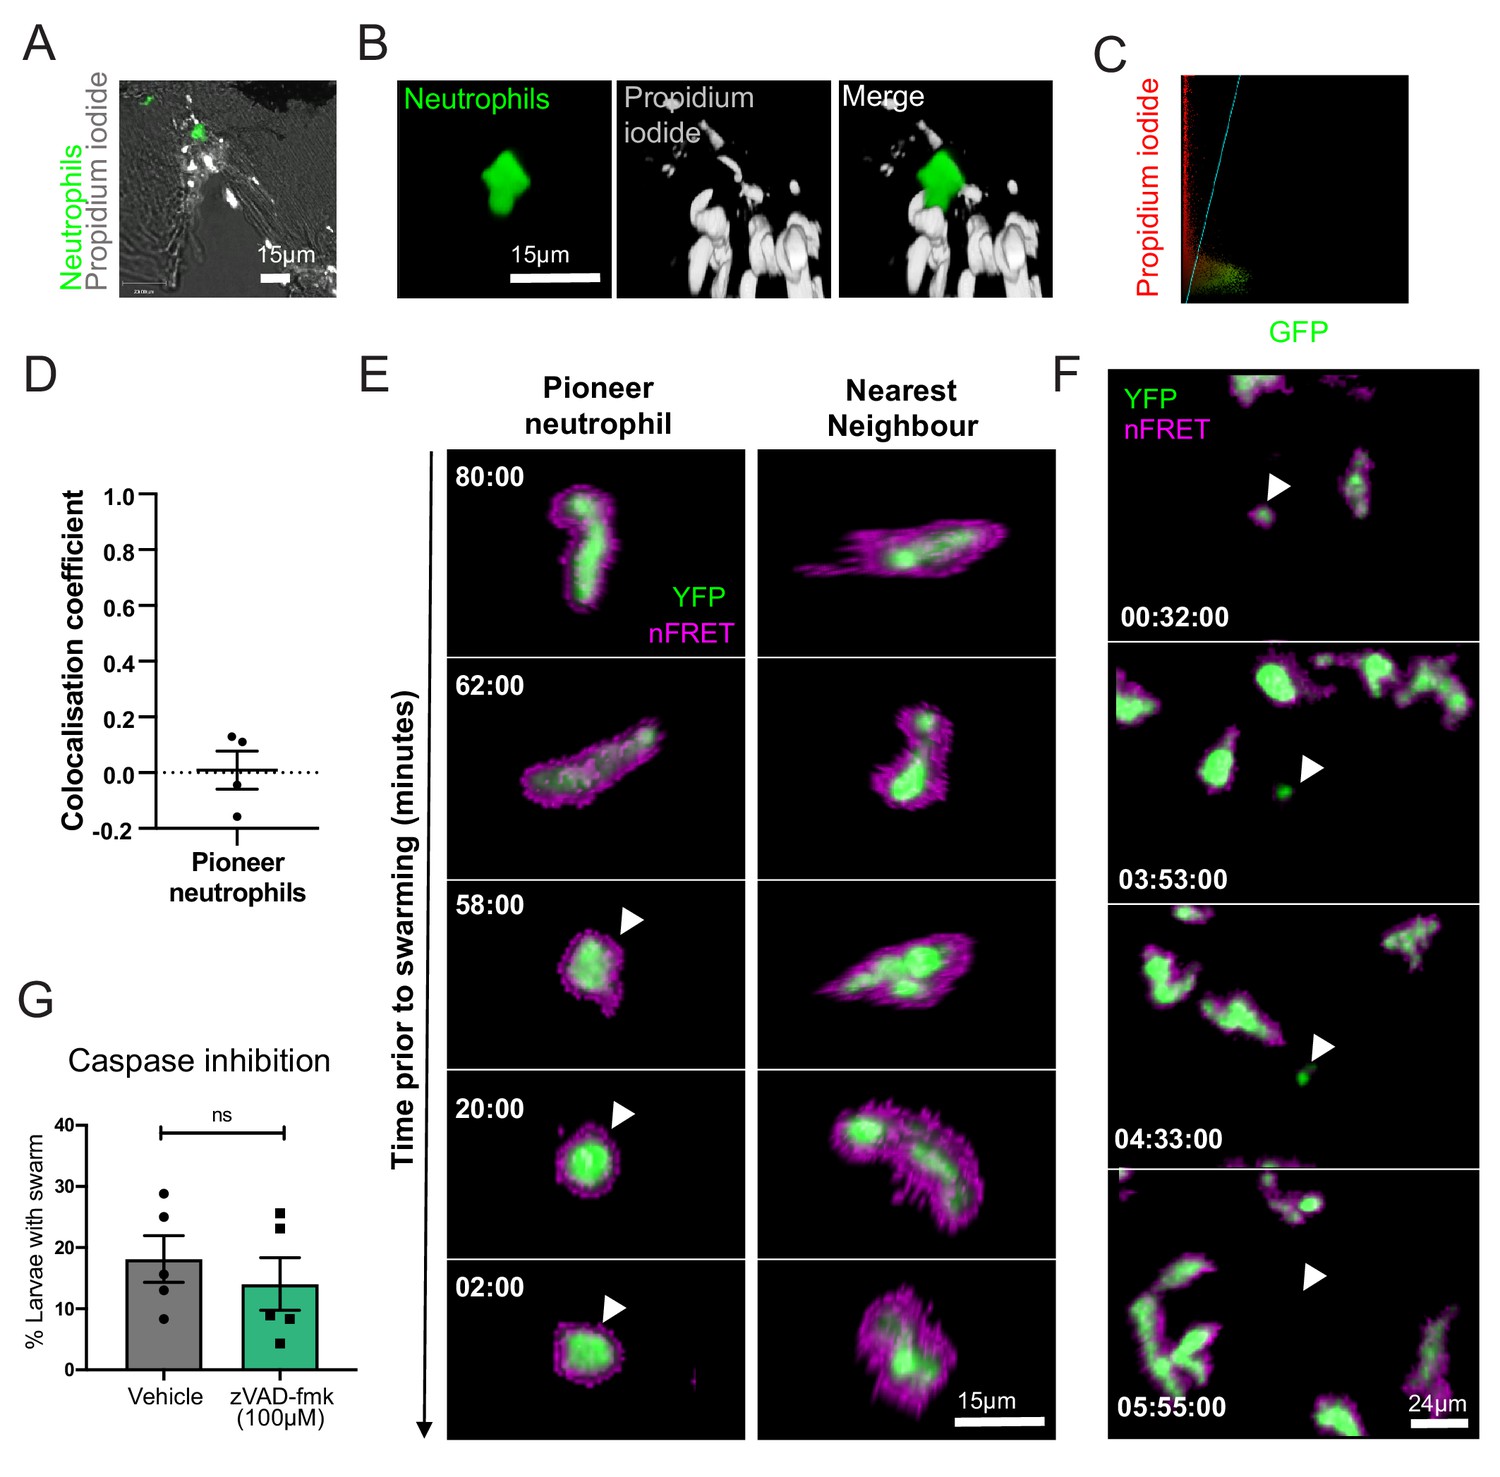
Pioneer neutrophils are not undergoing apoptosis prior to swarming.
(A–D) Pioneer neutrophils are not propidium iodide positive prior to swarming. (A) Single slice image showing tail fin of injured mpx:GFP larva (bright field), stained with propidium iodide (white). Image shows representative example of pioneer neutrophil at the wound site prior to the swarming response (green). (B) Representative 3D render of pioneer neutrophil during the initiation phase. Left tile shows mpx:GFP pioneer neutrophil, middle tile shows propidium iodide staining, and right tile shows the two merged. (C) Representative colocalisation analysis of pioneer neutrophils, where neutrophil signal (GFP) is on the x axis and propidium iodide signal (mCherry) is on the y axis. (D) Pearson’s colocalisation coefficient for pioneer neutrophils (data shown are mean ± SEM, n = 4 larvae) (Figure 3—source data 1). (E) Pioneer neutrophils are not apoptotic prior to swarming. 3 dpf mpx:FRET larvae were injured, and time lapse imaging was performed from 30 min post-injury for 6 hr. Neutrophil signal from the acceptor (green) and nFRET (magenta) are shown to illustrate neutrophil apoptosis. Representative example of a pioneer neutrophil and its nearest neighbour in the frames preceding neutrophil swarming. The initiation stage is observed 58 min prior to swarming (rounded pioneer neutrophil, arrowhead). nFRET signal is intact at all stages of migration prior to swarming in both the pioneer and nearest-neighbour non-pioneer neutrophil. Time stamps are mm:ss relative to the swarm start time (representative example of n = 6 neutrophils from five larvae). (F) Apoptotic neutrophils do not initiate swarming. Example of neutrophil apoptosis at the wound site demonstrated by loss of FRET signal around 4 hr post-injury (arrowhead), followed by the absence of neutrophil cluster formation in the same tissue region by the end of the imaging period. Time stamp is relative to injury time and is hh:mm:ss. (G) The percentage of larvae with neutrophil swarms at 3 hr post-injury after Caspase inhibition by zVAD-fmk or vehicle control treatment. Data shown are from n = 228 larvae accumulated from five biological replicates (Figure 3—source data 2). Paired data shows each individual experiment using the same batch of larvae over the treatment groups.
-
Figure 3—source data 1
Numerical data for the graph of Figure 3D.
- https://cdn.elifesciences.org/articles/68755/elife-68755-fig3-data1-v1.csv
-
Figure 3—source data 2
Numerical data for the graph of Figure 2G.
- https://cdn.elifesciences.org/articles/68755/elife-68755-fig3-data2-v1.csv
Figure 4
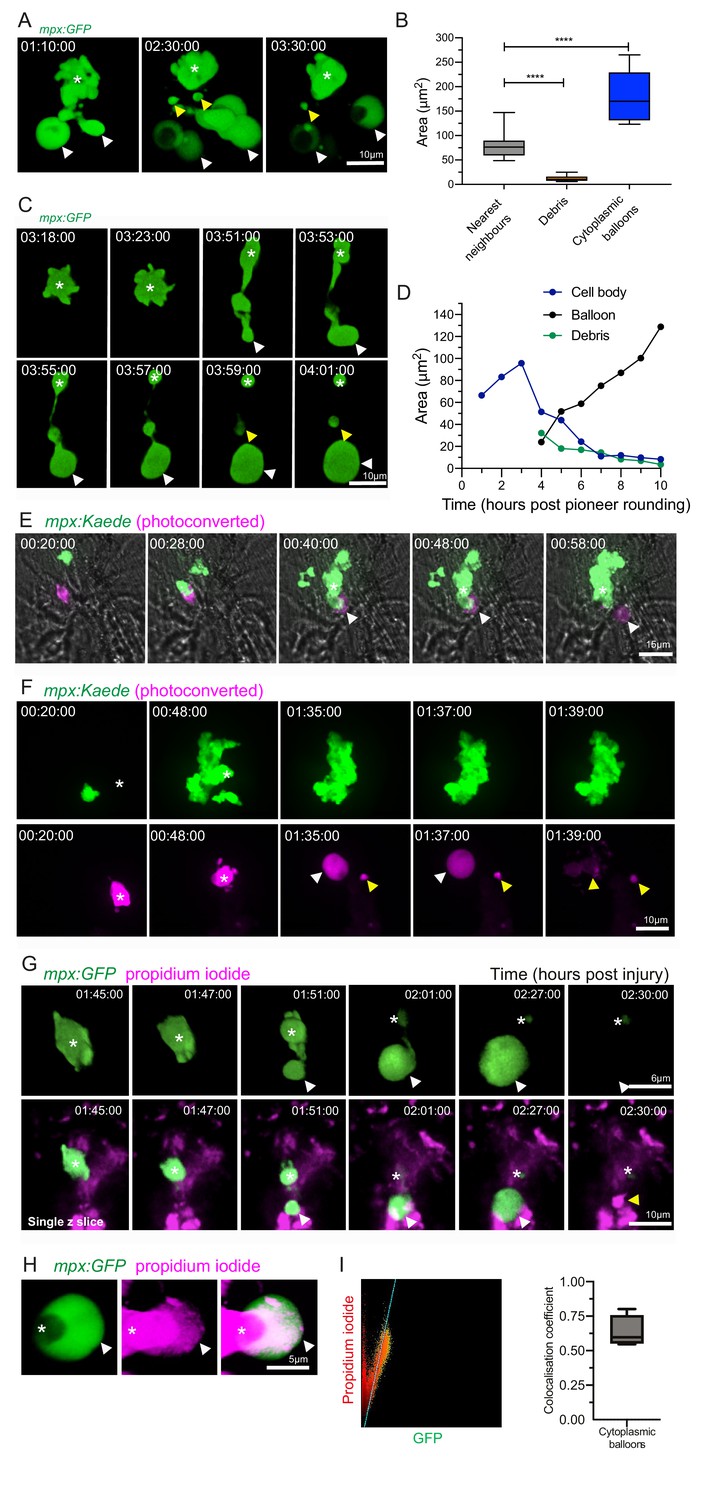
Catapult release of DNA-containing, balloon-like structures by pioneer neutrophils.
(A) 3D rendered time lapse sequence showing cell fragments around swarming neutrophils (swarm: asterisk, cytoplasmic balloon-like structures: white arrowheads, cell debris: yellow arrowheads). Time stamps are hh:mm:ss relative to injury time. Images were taken using a 40× objective lens on a Perkin-Elmer spinning disk confocal microscope. (B) The area of cellular debris and cytoplasmic vacuoles detected during swarm aggregation were measured alongside three nearest neighbour neutrophils at the wound site (error bars are SEM. Groups were analysed using an ordinary one-way ANOVA with Tukey’s multiple comparison, p<0.0001. N = 5 larvae) (Figure 4—source data 1). (C, D) Timelapse microscopy of catapult cytoplasmic balloon (white arrowhead) release from a single pioneer neutrophil (asterisk), leaving cell debris (yellow arrowhead). A plot of the areas of this event demonstrates that the cytoplasmic balloon grows as the cell body decreases (Figure 4—source data 2). The fluorescence of the debris is lost over the course of the timelapse. (E) A photoconversion approach to study pioneer neutrophils within developing clusters. 3 dpf mpx:Kaede larvae were injured and the neutrophil closest to the wound site was photoconverted from green to red fluorescence at 10 min post-injury. Larvae where the red neutrophil became the swarm-initiating pioneer neutrophil were analysed. Example time lapse of green wild-type swarming neutrophils which cluster around the magenta pioneer neutrophil. A swarm forms around this pioneer (asterisk) while a cytoplasmic balloon is released from the pioneer between 48–58 min post injury (identifiable from the magenta, white arrowhead). Time stamps are hh:mm:ss relative to time post injury. (F) A second example of a photoconverted pioneer neutrophil (asterisk) releasing an extracellular balloon (white arrowhead) and leaving cell debris in and around the swarm (yellow arrowheads). (G) A single confocal Z slice of propidium iodide staining (magenta) demonstrates that a pioneer neutrophil (asterisk), is PI negative until cytoplasmic balloon release (white arrowhead) that becomes PI positive over time (yellow arrowhead) and loses its green fluorescence. (H) A neutrophil (asterisk) cytoplasmic balloon (white arrowhead) becoming positive for propidium iodide. (I) Colocalisation of propidium iodide with neutrophil cytoplasmic fragments (Figure 4—source data 3).
-
Figure 4—source data 1
Numerical data for the graph of Figure 4B.
- https://cdn.elifesciences.org/articles/68755/elife-68755-fig4-data1-v1.csv
-
Figure 4—source data 2
Numerical data for the graph of Figure 4D.
- https://cdn.elifesciences.org/articles/68755/elife-68755-fig4-data2-v1.csv
-
Figure 4—source data 3
Numerical data for the graph of Figure 4I.
- https://cdn.elifesciences.org/articles/68755/elife-68755-fig4-data3-v1.csv
Figure 5

Zebrafish neutrophils release NETs in vitro.
(A) Purification of adult zebrafish neutrophils for in vitro stimulation. Viable neutrophils were purified from the kidneys of adult Tg(lyz:dsRed)nz50 adult zebrafish and separated by density gradient separation purification (i). Unstimulated lyz:dsRed neutrophils were visualised using a haemocytometer (ii) and by May Grünwald-staining of cytospin preparations (iii). NET release was observed using SYTOX green staining (example shown is after PMA treatment) (iv). (B) Morphological time course of NET release by Tg(lyz:dsRed)nz50 following in vitro stimulation after no stimulation (control), calcium ionophore treatment, PMA treatment, Staphylococcus aureus infection, or Candida albicans infection. Images shown are randomly selected fields of view. Neutrophils were detected by their transgenic dsRED signal (magenta) and the extracellular DNA of NETs was detected using SYTOX (green). Graphs display total magenta and green pixel values. Data are mean ± SD for 10 random fields of view/timepoint.
Figure 6 with 1 supplement
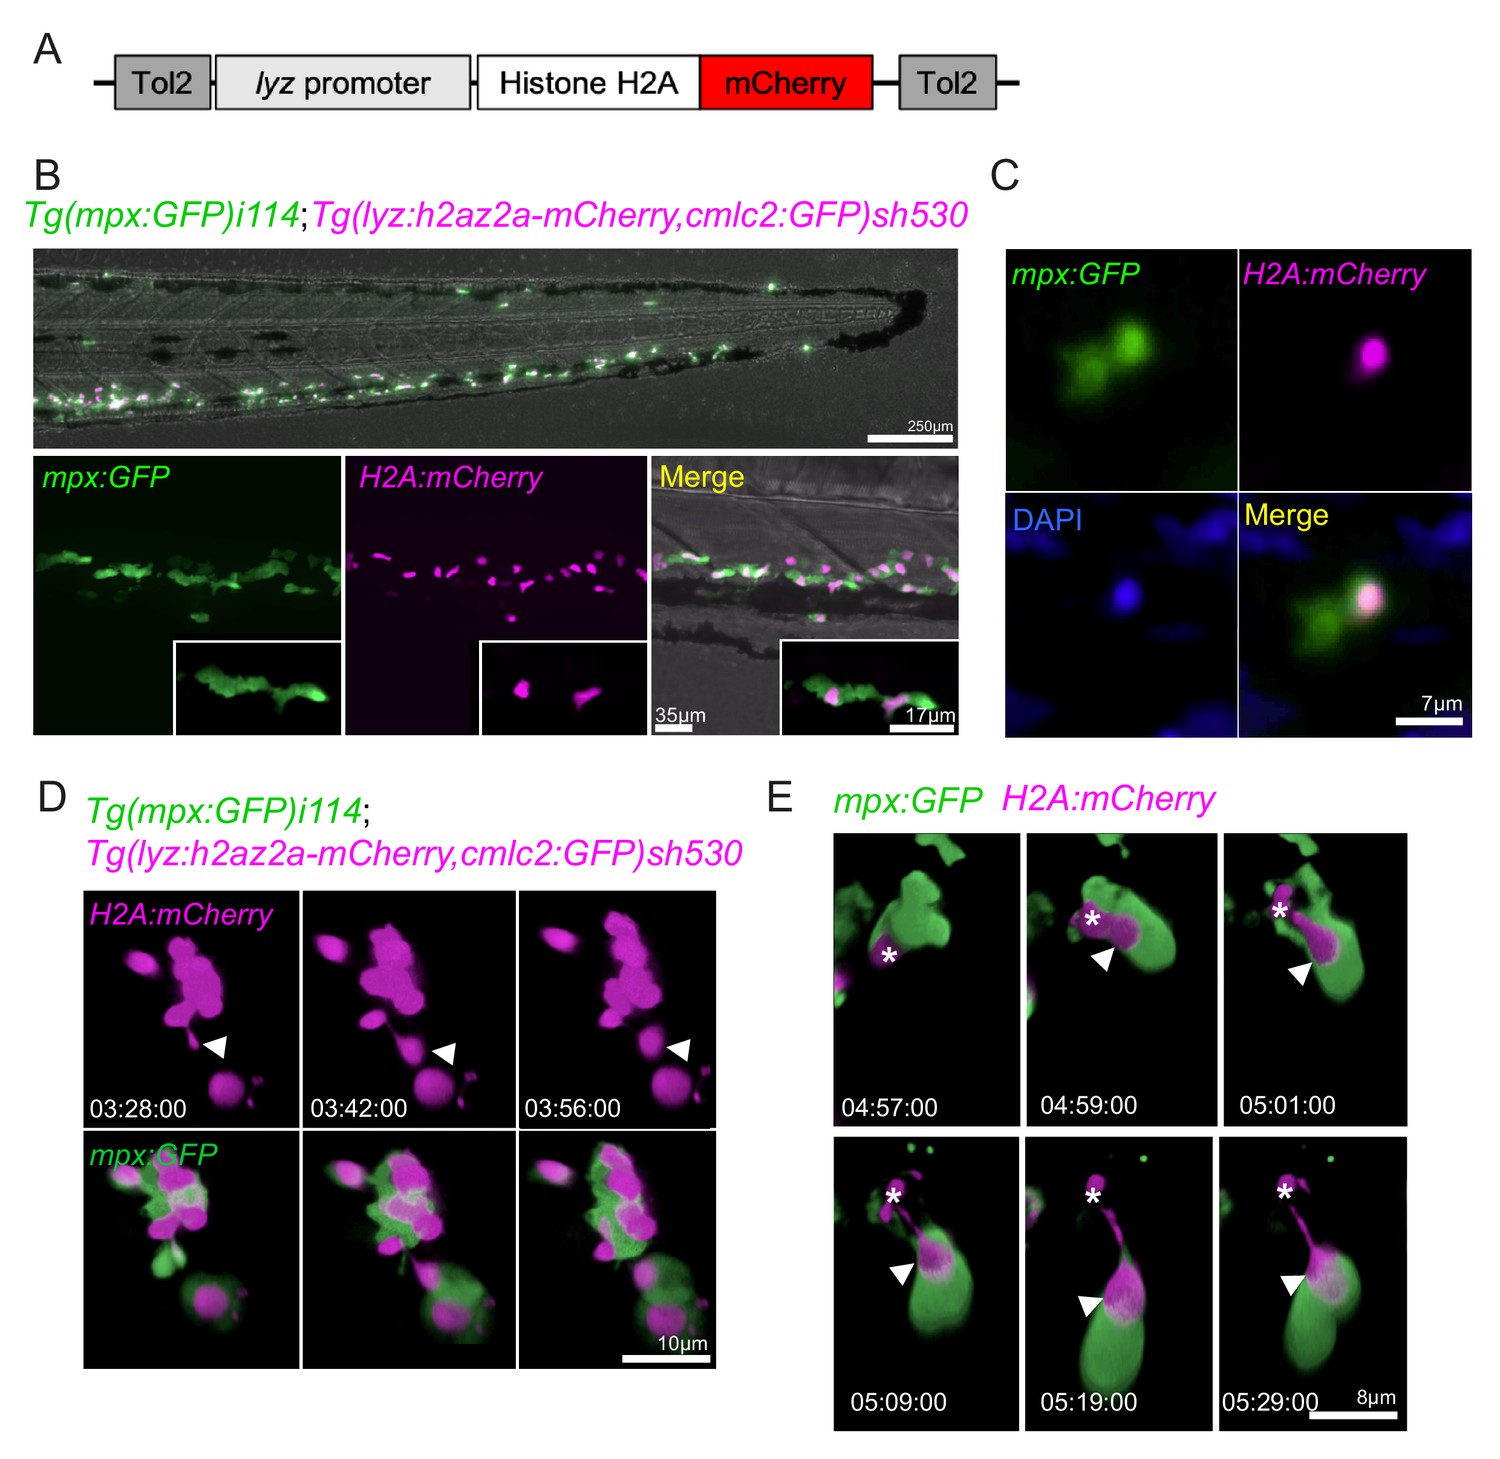
Neutrophils release histones early in swarm formation.
(A) Schematic of the lyz:H2A.mCherry construct made by Gateway cloning, which includes the neutrophil specific promoter (lyz), and the histone H2A gene fused to the fluorescent protein mCherry flanked by Tol2 arms to aid transgenesis. (B, C) Representative image of the stable TgBAC(mpx:GFP)i114;Tg(lyz:H2A.mCherry)sh530 transgenic line. (B) Image shows the caudal haematopoietic tissue of a 3 dpf sh530 larvae, where the H2A mCherry transgene is expressed in neutrophils. (C) 40× confocal image of the transgenic line, showing neutrophil histones labelled by the transgene. (D) Representative example of NET release from swarming neutrophils from six larvae. Time course of Tg(mpx:GFP)i114;Tg(lyz:h2az2a-mCherry,cmlc2:GFP)sh530 larva showing a single neutrophil and histone H2A (white arrows), undergoing NET-like morphological changes where histones are released from the centre of swarms in cytoplasmic vesicles. Time stamps are hh:mm:ss relative to time post injury. (E) A second example timelapse showing that histones are extruded from the nucleus during the cytoplasmic balloon release.
Figure 6—figure supplement 1
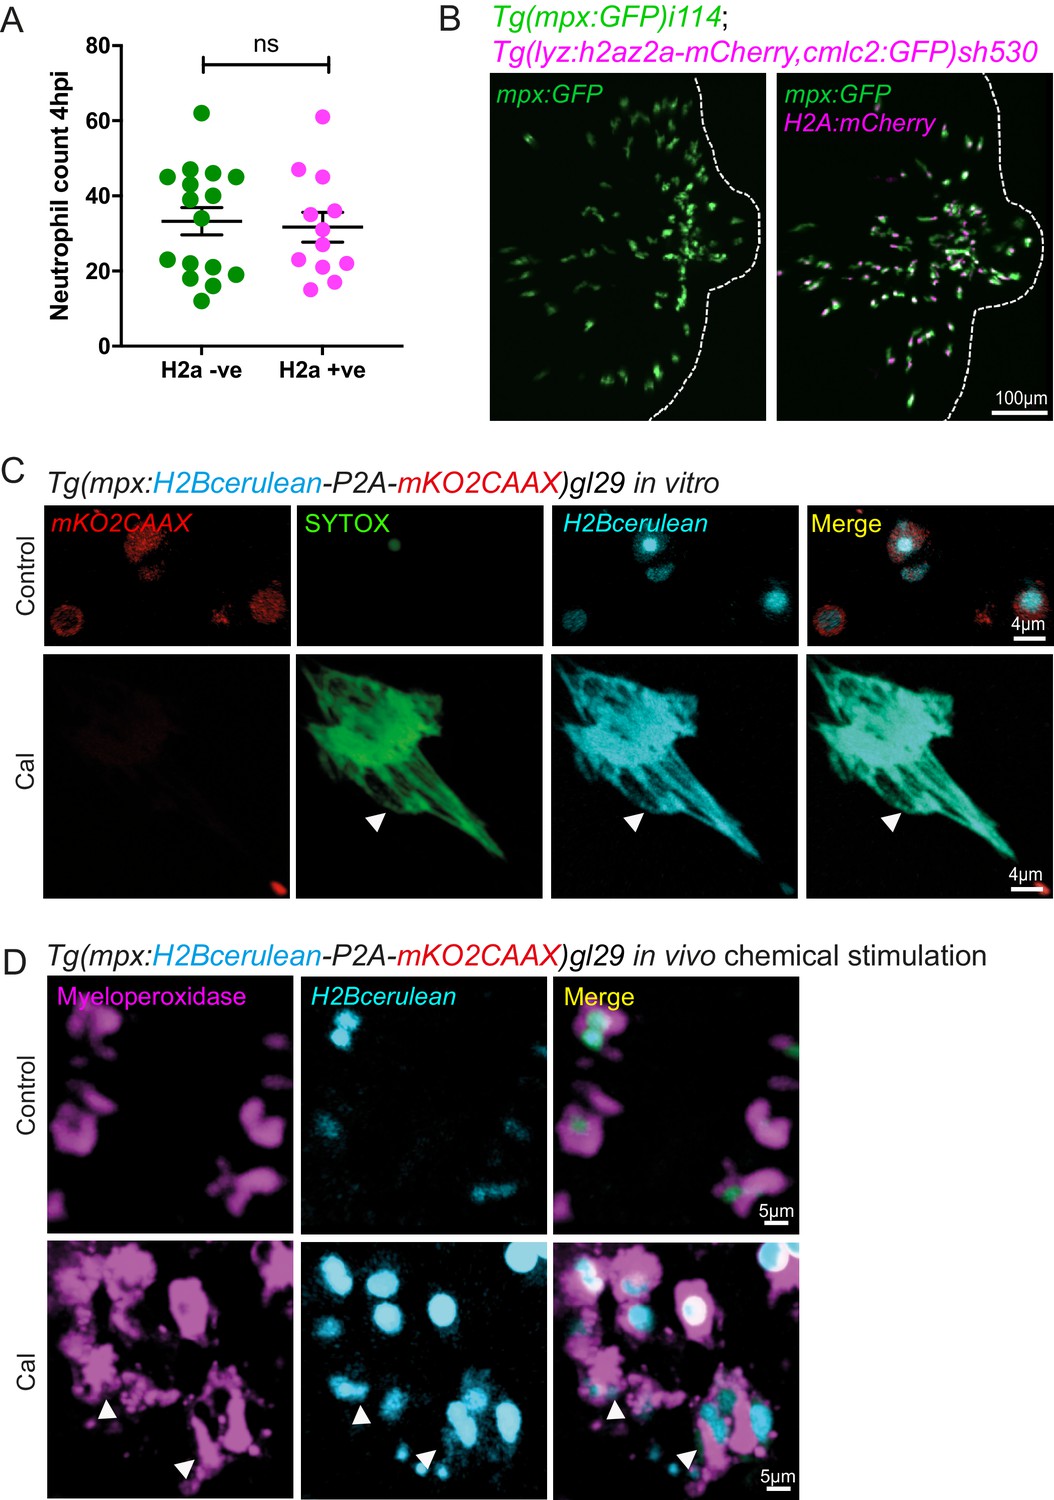
Validation of zebrafish histone transgenic lines.
(A) Neutrophil numbers at the tailfin wound at 4 hpi are not affected by the Lyz:H2az2a transgene in the double transgenic Tg(mpx:GFP)i114;Tg(lyz:h2az2a-mCherry,cmcl2:GFP)sh530 (Figure 6—figure supplement 1—source data 1). (B) Example confocal images of the double transgenic Lyz:H2az2a line showing histone labelling of neutrophils at a tailfin wound. (C) Colocalisation of H2B cerulean fluorescence and SYTOX-green stained DNA during in vitro NETosis. Viable unstimulated Tg(mpx:H2Bcerulean-P2A-mKO2CAAX) neutrophils display blue nuclear and red cytoplasmic fluorescence with minimal intracellular SYTOX green DNA staining. NETs released after calcium ionophore (Cal) stimulation show co-localised extracellular H2Bcerulean fluorescence and SYTOX-green stained DNA. In controls, there is a lack of overlap of blue and green signal in some nuclei demonstrating that co-localisation in the NET taken on the same microscopy settings is not an imaging artefact. (D) In vivo stimulation of transgenic H2Bcerulean zebrafish neutrophils following otic vesicle injection of calcium ionophore (Cal) or PBS injection (control). Unstimulated Tg(mpx:H2Bcerulean-P2A-mKO2CAAX) neutrophils display nuclear cerulean fluorescence surrounded by cytoplasmic immunoreactive myeloperoxidase (arrowheads). Following stimulation with Cal regions of dispersed extracellular H2Bcerulean fluorescence overlay with dispersed Myeloperoxidase immunoreactivity (arrowheads).
-
Figure 6—figure supplement 1—source data 1
Numerical data for the graph of Figure 6—figure supplement 1A.
- https://cdn.elifesciences.org/articles/68755/elife-68755-fig6-figsupp1-data1-v1.csv
Figure 7 with 1 supplement
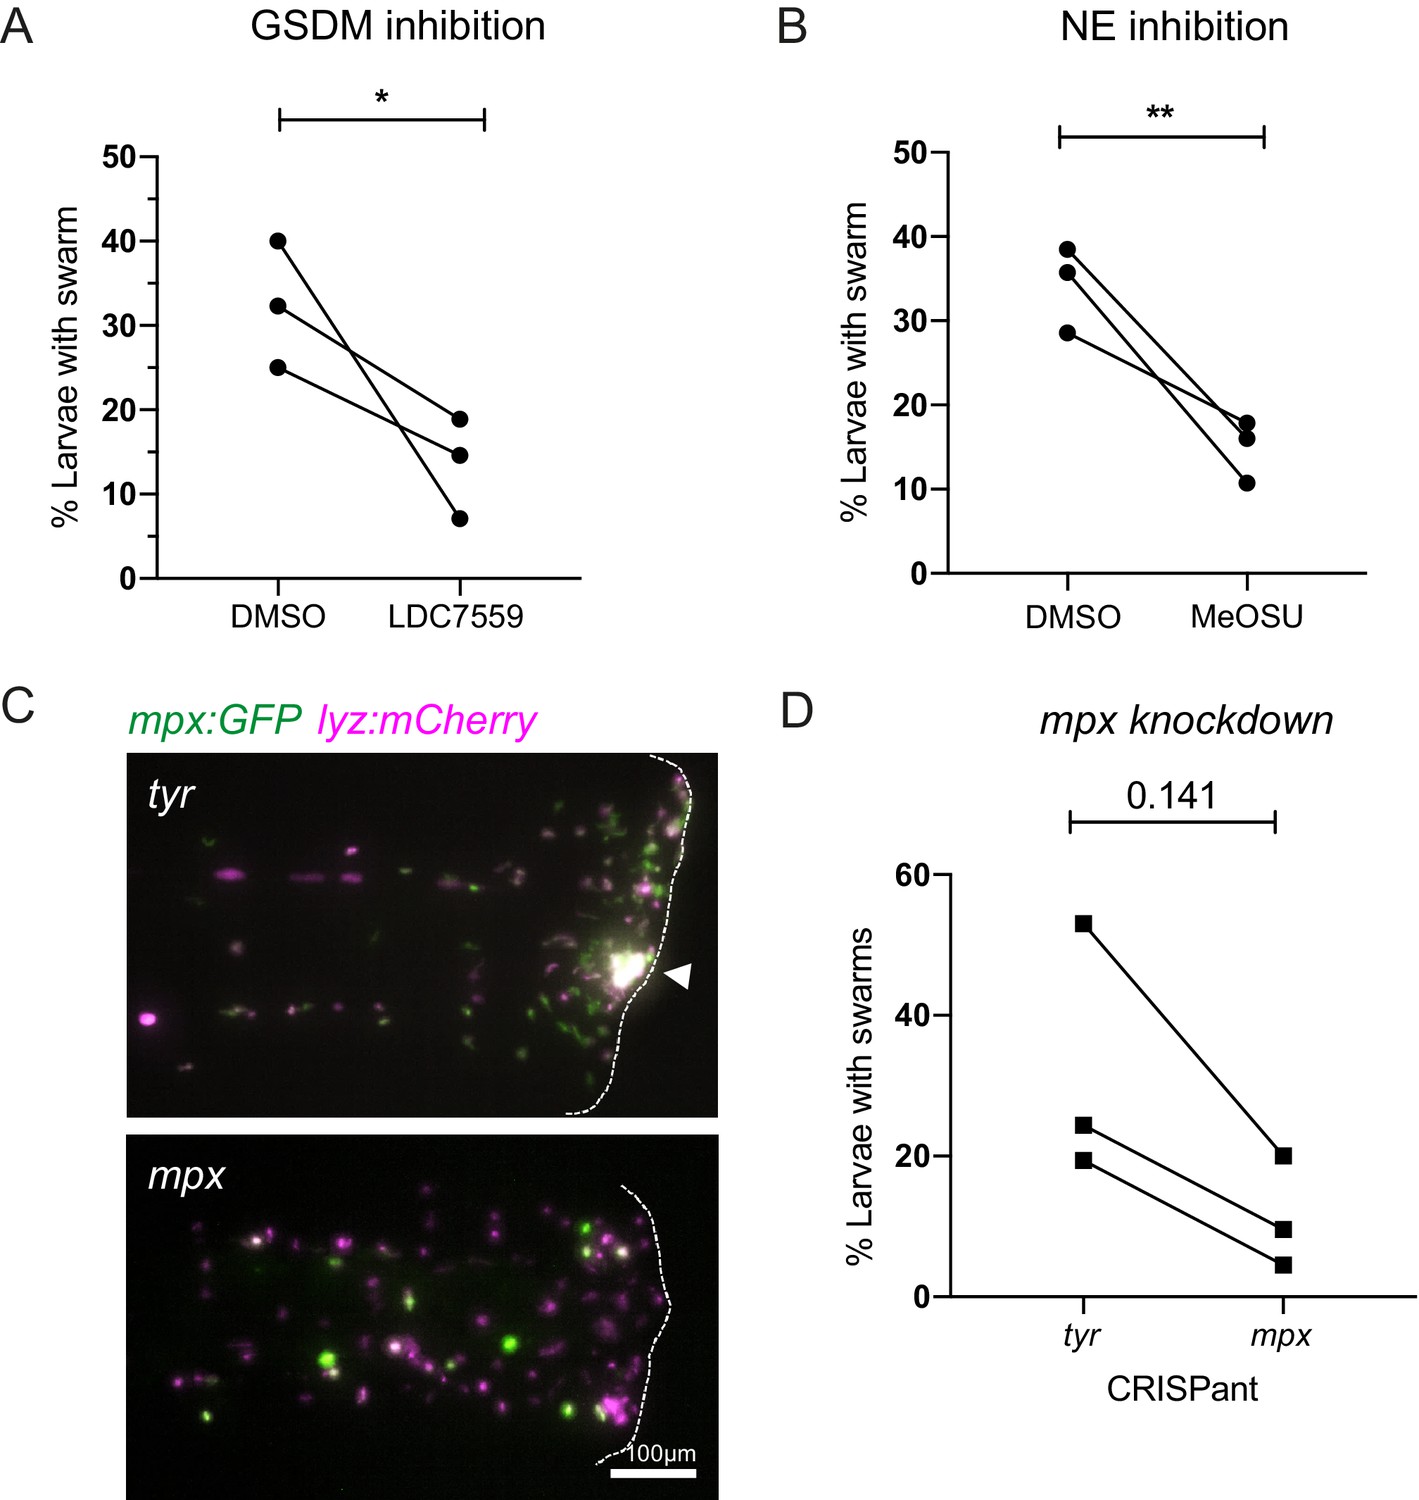
Inhibition of NET components, gasdermin D, neutrophil elastase, and myeloperoxidase decrease swarm frequency.
(A) The percentage of larvae with neutrophil swarms at 3 hr post injury after gasdermin inhibitor, LDC7559, or DMSO treatment. Data shown are mean with a minimum of 120 larvae analysed in each group, accumulated from three biological replicates. Joined data represent each individual experiment using larvae from the same zebrafish lay over the two treatment groups (Figure 7—source data 1). (B) The percentage of larvae with neutrophil swarms at 4 hr post injury after neutrophil elastase inhibitor, MeOSu-AAPV-CMK, treatment, or DMSO control. Data shown are mean, with greater than 73 larvae per group over three biological replicates. Joined data represent each individual experiment using larvae from the same zebrafish lay over the two treatment groups (Figure 7—source data 2). (C) Representative fluorescence micrographs of the double transgenic Tg(mpx:GFP);Tg(lyz:nfsβ-mCherry) after myeloperoxidase knockdown using CRISPR-Cas9 with tyrosinase knockdown as a negative control. The myeloperoxidase guide RNA targeted the promoter of mpx, therefore knocking down expression of green mpx:GFP while leaving lyz:mCherry intact. White arrowhead indicates the presence of a swarm at the wound (white dashed line). (D) The percentage of larvae with neutrophil swarms at 4 hr post-injury after mpx knockdown by CRISPR-Cas9 or tyr control. Data shown are mean, with a minimum of 115 larvae analysed in each group, accumulated from three biological replicates (Figure 7—source data 3). Joined data represent each individual experiment using larvae from the same zebrafish lay over the two treatment groups. p-values in (A), (C), and (D) are generated from unpaired t-tests.
-
Figure 7—source data 1
Numerical data for the graph of Figure 7A.
- https://cdn.elifesciences.org/articles/68755/elife-68755-fig7-data1-v1.csv
-
Figure 7—source data 2
Numerical data for the graph of Figure 7B.
- https://cdn.elifesciences.org/articles/68755/elife-68755-fig7-data2-v1.csv
-
Figure 7—source data 3
Numerical data for the graph of Figure 7D.
- https://cdn.elifesciences.org/articles/68755/elife-68755-fig7-data3-v1.csv
Figure 7—figure supplement 1
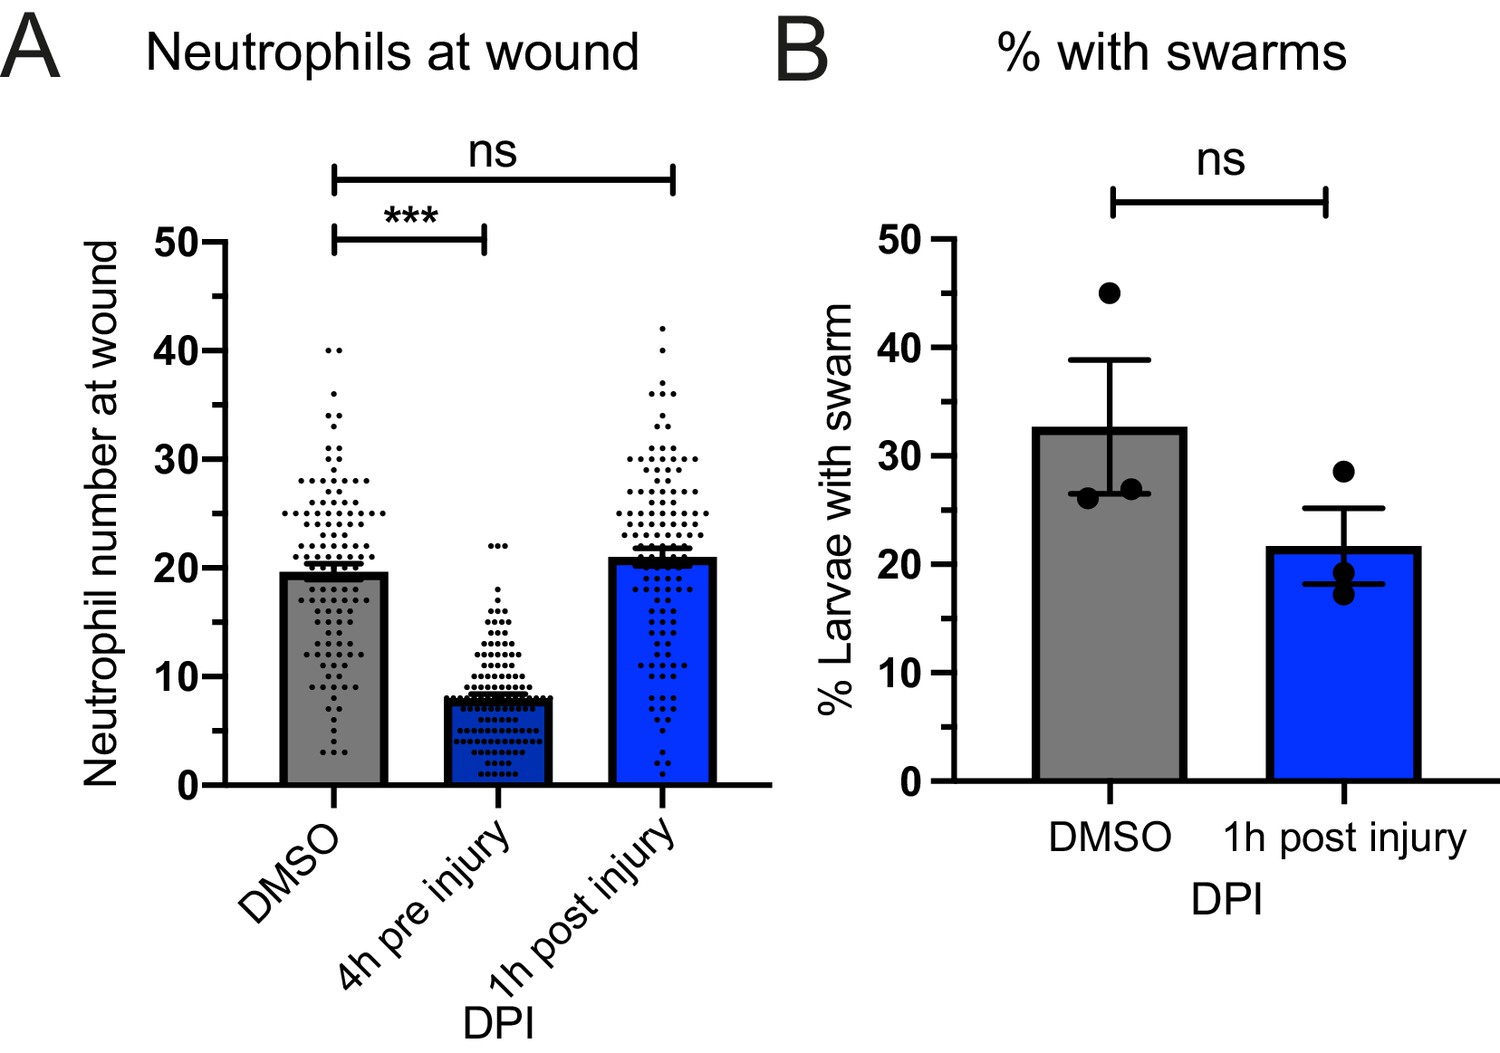
ROS inhibition by DPI and swarm frequency.
(A) Neutrophil numbers recruited to the tailfin wound at 4 hpi were reduced with 4 hr pre-treatment of DPI before injury as previously reported, but not with treatment from 1 hr post-injury. p-values are generated from an ordinary one-way ANOVA with Tukey’s multiple comparison. (B) The percentage of larvae with swarms at 3 hr post-injury was not reduced when treated from 1 hpi compared to DMSO controls. Data shown are mean with a minimum of 116 larvae analysed in each group, accumulated from three biological replicates. p-value (0.196) was generated from an unpaired t-test.
Videos
Video 1
A pioneer neutrophil stops migrating, rounds up, and becomes the centre of a persistent swarm.
A 280 min spinning disk confocal timelapse of a mpx:GFP positive neutrophil (filled arrowhead) migrating at the wound site, that stops migrating and adopts a rounded shape (hollow arrowhead), before becoming the centre of a nascent neutrophil swarm (asterisk).
Video 2
Neutrophil swarm response to Staphylococcus aureus.
A 100 min spinning disk confocal timelapse of neutrophils (mpx:GFP positive) swarming (asterisk at centre) around Staphylococcus aureus (SH1000 pMV158mCherry, red fluorescence) infection in the otic vesicle.
Video 3
Transient swarming and no swarming at a tailfin wound.
Spinning disk confocal timelapse examples of zebrafish mpx:GFP larvae that form transient swarms (white arrowheads) or no swarms at the tailfin wound (to the righthand side of the video).
Video 4
The scouting, initiation and aggregation phases of neutrophil swarming.
Spinning disk confocal timelapse of mpx:GFP larva with the brightfield overlaid image shows a developing swarm with scouting, initiation and aggregation phases of swarming labelled. The pioneer neutrophil is indicated by a cell track.
Video 5
Pioneer neutrophils are not undergoing apoptosis prior to swarming.
The pioneer neutrophil (mpx:GFP positive) is propidium iodide (PI, white) negative, shown using a 3D confocal micrograph. The pioneer neutrophil (asterisk) is Caspase FRET positive in the Tg(mpx:CFP-DEVD-YFP)sh237 transgenic line shown by spinning disk confocal timelapse with FRET.
Video 6
Catapult release of cytoplasmic balloon-like structures by pioneer neutrophils.
A spinning disk confocal timelapse of a nick wound in the mpx:GFP transgenic shows balloon-like structures (white arrowheads) released from the developing swarm. In the mpx:Kaede transgenic line the pioneer neutrophil was photoconverted to red and red cytoplasmic balloons were released at the wound (white arrowheads). Cytoplasmic balloons released from the swarming neutrophils become positive for propidium iodide (PI, red) indicated by white arrowheads.
Tables
Key resources table
| Reagent type (species) or resource | Designation | Source or reference | Identifiers | Additional information |
|---|---|---|---|---|
| Gene (Danio rerio) | TgBAC(mpx:EGFP)i114 | Renshaw et al., Blood 2011 | i114Tg RRID:ZFIN_ZDB-ALT-070118-2 | Transgenic |
| Gene (Danio rerio) | Tg(lyz:nfsβ-mCherry)sh260 | Buchan et al., 2019 | sh260TgRRID:ZFIN_ZDB-ALT-190925–14 | Transgenic |
| Gene (Danio rerio) | TgBAC(mpx:GAL4-VP16)sh256 | Prajsnar et al., Infection and Immunity, 2013 | sh256TgRRID:ZFIN_ZDB-ALT-131203–1 | Transgenic |
| Gene (Danio rerio) | Tg(UAS:kaede)s1999t | Isles et al., 2019a | s1999tTgRRID:ZFIN_ZDB-ALT-070314–1 | Transgenic |
| Gene (Danio rerio) | TgBAC(mpx:CFP-DEVD-YFP)sh237 | Robertson et al., 2016 | sh237TgRRID:ZFIN_ZDB-ALT-161012–5 | Transgenic |
| Gene (Danio rerio) | Tg(lyz:h2az2a-mCherry,cmlc2:GFP)sh530 | This paper | sh530Tg | Transgenic |
| Gene (Danio rerio) | Tg(mpx:H2Bcerulean-P2A-mKO2CAAX)gl29 | Manley et al., Journal of Leukocyte Biology and This paper | gl29Tg RRID:ZFIN_ZDB-ALT-151201–2 | Transgenic |
| Gene (Danio rerio) | Tg(lyz:dsRed)nz50 | Hall et al., BMC Developmental Biology 2019 | nz50Tg RRID:ZFIN_ZDB-ALT-071109–3 | Transgenic |
| Genetic reagent (Danio rerio) | ltah4 CRISPR-Cas9 guide RNA | This paper | ltah4 CRISPR | AGGGTCTGAAACTGGAGTCA(TGG) |
| Genetic reagent (Danio rerio) | blt1 CRISPR-Cas9 guide RNA | This paper | blt1 CRISPR | CAATGCCAATCTGATGGGAC(AGG) |
| Genetic reagent (Danio rerio) | myeloperoxidase CRISPR-Cas9 guide RNA | This paper | mpx CRISPR | GTTGTGCTGAATGTATGCAG(CGG) |
| Genetic reagent (Danio rerio) | tyrosinase CRISPR-Cas9 guide RNA | Isles et al., Frontiers in Immunology, 2019 | tyr CRISPR | GGACTGGAGGACTTCTGGGG(AGG) |
| Sequence-based reagent | lta4h_fw | This paper | PCR primer | GTGTAGGTTAAAATCCATTCGCA |
| Sequence-based reagent | lta4h_rev | This paper | PCR primer | GAGAGCGAGGAGAAGGAGCT |
| Sequence-based reagent | blt1_fw | This paper | PCR primer | GTCTTCTCTGGACCACCTGC |
| Sequence-based reagent | blt1_rev | This paper | PCR primer | ACACAAAAGCGATAACCAGGA |
| Recombinant DNA reagent | p5E-MCS lyz | Kwan et al., 2007 | Plasmid | Gateway compatible plasmid |
| Recombinant DNA reagent | p3E-PolyA | Kwan et al., 2007 | Plasmid | Gateway compatible plasmid |
| Recombinant DNA reagent | pDestTol2CG2 | Kwan et al., 2007 | Plasmid | Gateway destination vector |
| Recombinant DNA reagent | pME-h2a-mCherry | This paper | Plasmid | Gateway compatible plasmid |
| Strain, strain background (Staphylococcus aureus) | SH1000 pMV158mCherry | Pollitt et al., 2018 | SH1000 | Transgenic |
| Antibody | anti-mpx (rabbit polyclonal) | GeneTex | GeneTex: GTX128379 | (1:200) |
| Antibody | anti-eGFP (chicken polyclonal) | Abcam | Abcam: ab13970 | (1:2000) |
| Antibody | anti-rabbit Alexafluor 647 (goat polyclonal) | Jackson ImmunoResearch | Jackson ImmunoResearch: 111-605-045 | (1:1000) |
| Antibody | anti-chicken Alexafluor 488 (goat polyclonal) | Jackson ImmunoResearch | Jackson ImmunoResearch: 103-545-155 | (1:1000) |
| Chemical compound, drug | zVAD-fmk | Santa Cruz Biotechnology | Z-VAD-FMK (CAS 187389-52-2) | |
| Chemical compound, drug | LDC7559 | MedChem Express | CAS No.: 2407782-01-6 | |
| Chemical compound, drug | MeOSu-AAPV-CMK | Sigma-Aldrich | CAS No.: 65144-34-5 | |
| Chemical compound, drug | Diphenyleneiodonium chloride (DPI) | Sigma-Aldrich | CAS No.: 4673-26-1 | |
| Software, algorithm | NIS elements | Nikon | https://www.microscope.healthcare.nikon.com/products/software/nis-elements | |
| Software, algorithm | MatLab | MathWorks | https://www.mathworks.com/products/matlab.html | |
| Software, algorithm | BASiCz | Blood atlas of single cells in zebrafish | https://www.sanger.ac.uk/tool/basicz/ | |
| Software, algorithm | ChopChop | ChopChop | http://chopchop.cbu.uib.no/ | |
| Software, algorithm | Primer3 | ELIXIR | https://primer3.ut.ee/ | |
| Software, algorithm | Volocity | Quorum Technologies | https://quorumtechnologies.com/volocity | |
| Other | lta4h Synthetic SynRNA | Merck | lta4h CRISPR guide RNA | AGGGTCTGAAACTGGAGTCA(TGG) |
| Other | blt1 Synthetic SynRNA | Merck | blt1 CRISPR guide RNA | CAATGCCAATCTGATGGGAC(AGG) |
| Other | mpx Synthetic SynRNA | Merck | mpx CRISPR guide RNA | GTTGTGCTGAATGTATGCAG(CGG) |
| Other | tyr Synthetic SynRNA | Merck | tyr CRISPR guide RNA | GGACTGGAGGACTTCTGGGG(AGG). |
| Other | tracrSynthetic SynRNA | Merck | tracr CRISPR RNA |
Additional files
Download links
A two-part list of links to download the article, or parts of the article, in various formats.
Downloads (link to download the article as PDF)
Open citations (links to open the citations from this article in various online reference manager services)
Cite this article (links to download the citations from this article in formats compatible with various reference manager tools)
Pioneer neutrophils release chromatin within in vivo swarms
eLife 10:e68755.
https://doi.org/10.7554/eLife.68755


