Purkinje cell outputs selectively inhibit a subset of unipolar brush cells in the input layer of the cerebellar cortex
- Department of Neurobiology, Harvard Medical School, United States
Figures
Figure 1 with 1 supplement
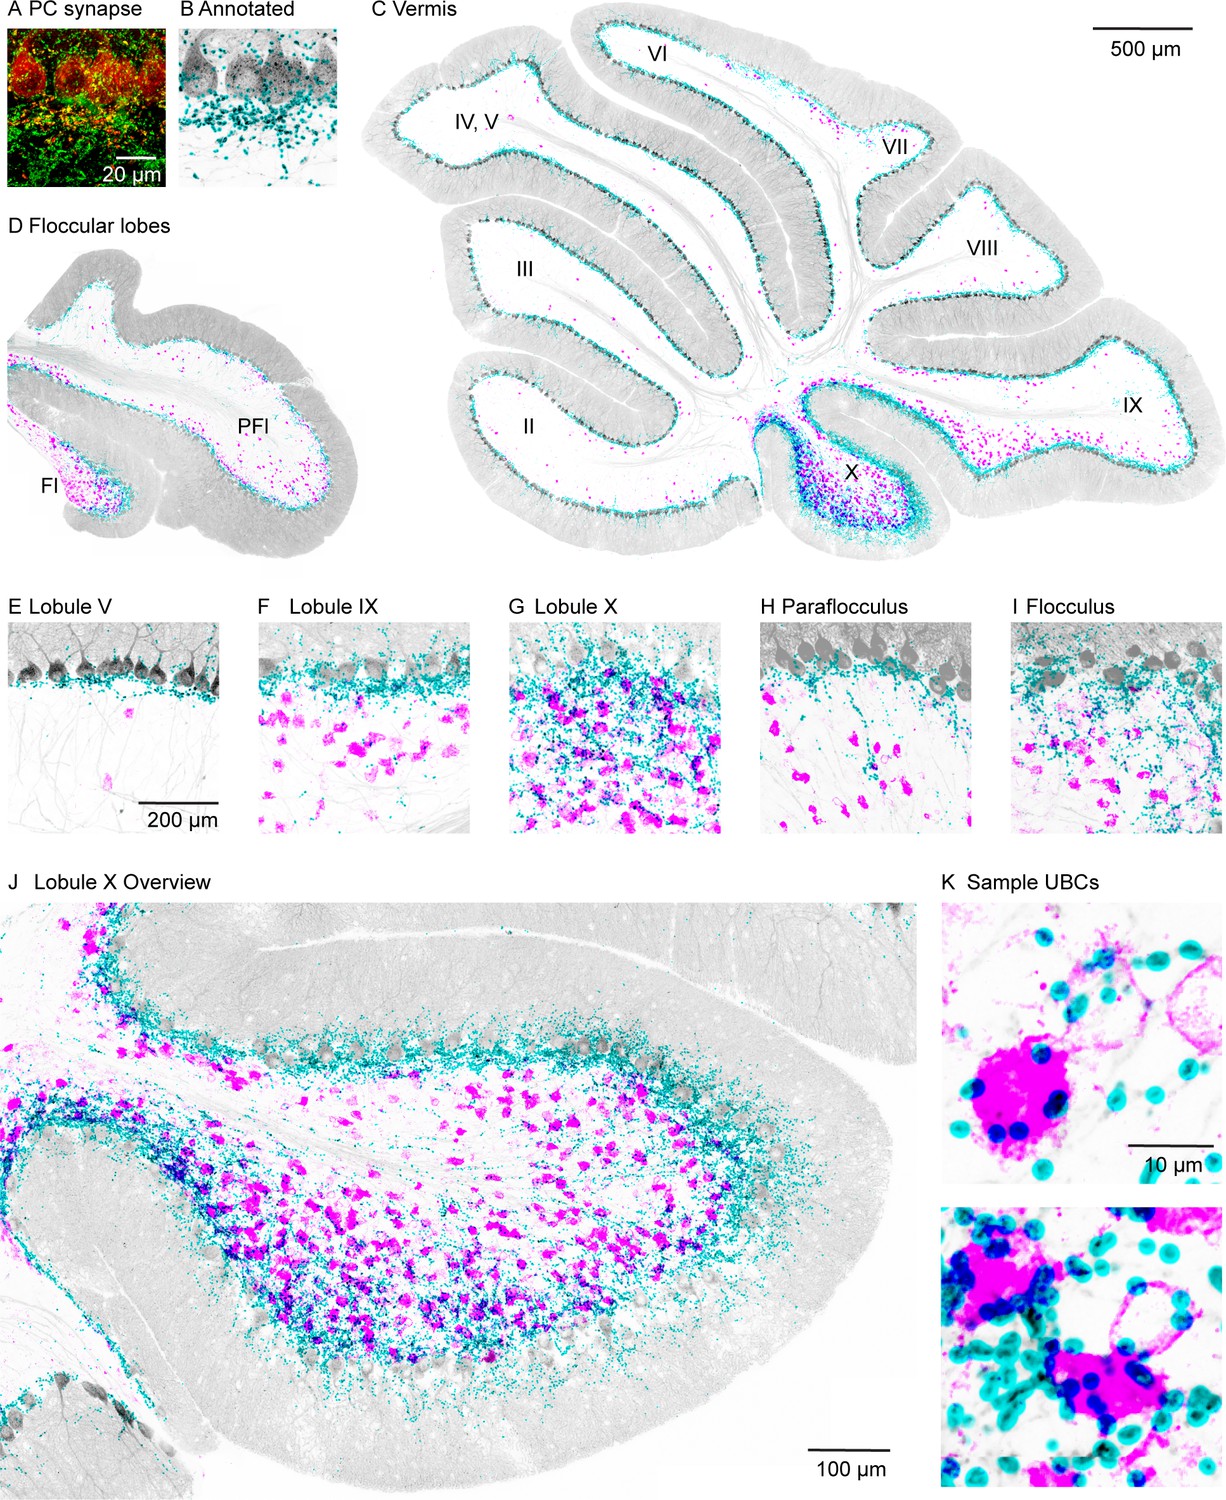
PC collateral synapses colocalized with mGluR1 UBCs in the vestibular lobules.
(A) Maximal intensity projection of a 15-µm confocal z-stack images of PC collateral synapses co-labeled by synaptophysin-tdTomato (red) and VGAT (green). (B) Annotated PC collateral synapses (cyan) and the synaptophysin-tdTomato signal (gray). (C) A vermal slice of cerebellum analyzed as in (B) with synapses labeled in cyan, synaptophysin-tdTomato in gray, and the mGluR1 labeled UBCs dendritic brush in magenta. (D) Same analysis on a coronal slice of a floccular lobe. (E–I) Zoomed in view of selective lobules showing variable degrees of colocalization between PC synapses and UBCs. (J) Expanded view of lobule X. (K) Two-sample UBCs showing clear examples of collateral synapses onto the brush and the soma. mGluR1, metabotropic glutamate receptor type 1; PC, Purkinje cell; UBC, unipolar brush cell; VGAT, vesicular GABA transporter.
Figure 1—figure supplement 1
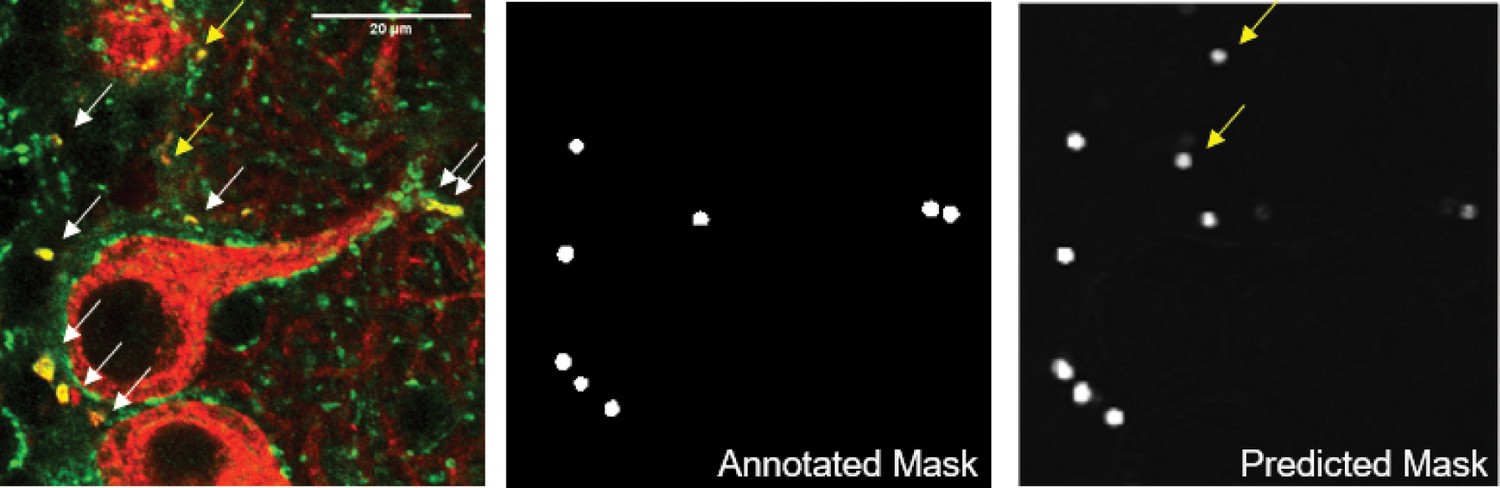
Automatic synapse detection using a convolutional neural network.
(A) Raw image of PC collateral synapses co-labeled by synaptophysin-tdTomato (red) and VGAT (green). mGluR1 labeling (not shown) was also used as input to the network as it provided additional contextual information about the location of synapses, which aided automated annotation. Arrowed marked the synapses that the annotator picked up (white) and missed (yellow), scale bar=20 µm. (B) Annotated mask used for training the neural network. (C) Network output after training. The network picked up several synapses that the annotator missed (yellow arrows). mGluR1, metabotropic glutamate receptor type I; PC, Purkinje cell; VGAT, vesicular GABA transporter.
Figure 2 with 1 supplement
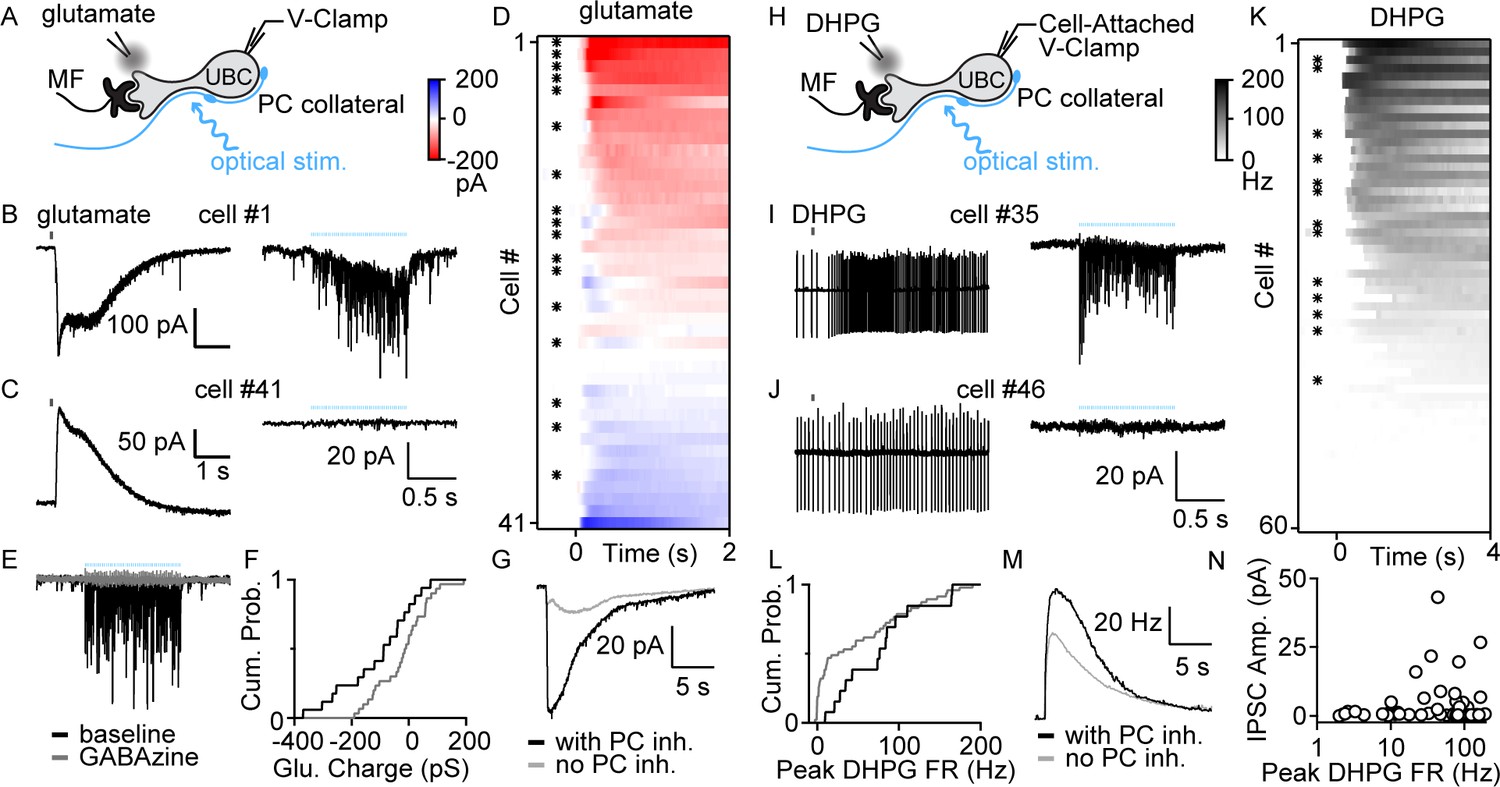
PC collaterals preferentially inhibit mGluR1+ UBCs via fast GABAAR-mediated feedback.
(A) Schematic showing a mossy fiber (MF) and a PC collateral innervating a UBC. A whole-cell electrode was used to voltage clamp the UBC, and responses were measure for either a glutamate puff applied with a nearby electrode or to optical stimulation of PC collaterals. (B) Whole-cell recordings of glutamate-evoked currents (left) and to optically evoked PC inhibition (right) are shown for cell #1 of (D). (C) As in (B), but for cell #41 of (D). (D) Summary of cells in which responses to glutamate puffs were measured, with red corresponding to an excitatory inward current and blue corresponding to an inhibitory outward current. Cells with light-evoked inhibitory synaptic current are indicated with a black dot (n=41). (E) Light-evoked synaptic currents were recorded in baseline (black) and after the addition of the GABAA receptor antagonist gabazine (gray). (F) Normalized cumulative distributions of charge evoked by a glutamate puff for cells that either had light-evoked responses (black) or that did not (gray). (G) Average currents evoked by a glutamate puff for cells that had PC feedback (black) and that did not have PC feedback (gray). (H) Schematic as in (A), but for application of the mGluR1 agonist DHPG. DHPG-evoked increases in firing were measured with a cell-attached electrode, and then optically evoked synaptic currents were measured with a whole-cell voltage-clamp recording. (I) DHPG-evoked increases in firing (left) and light-evoked synaptic currents (right) are shown for cell #35 in (K). (J) Same as (I) but for cell #45 in (K). (K) Summary of cells in which firing evoked by DHPG puffs was quantified. Cells with light-evoked inhibitory synaptic current are indicated with a black dot (n=60). (L) Normalized cumulative distributions of charge evoked by a DHPG puff for cells that either had light-evoked responses (black) or that did not (gray). (M) Average currents evoked by a DHPG puff for cells that had PC feedback (black) and that did not have PC feedback (gray). (N) Scatter plot of IPSC amplitudes as a function of the peak firing rates for the cells in (K). DHPG, (S)-3,5-Dihydroxyphenylglycine; IPSC, inhibitory post-synaptic current; mGluR1, metabotropic glutamate receptor type 1; PC, Purkinje cell; VGAT, vesicular GABA transporter.
Figure 2—figure supplement 1
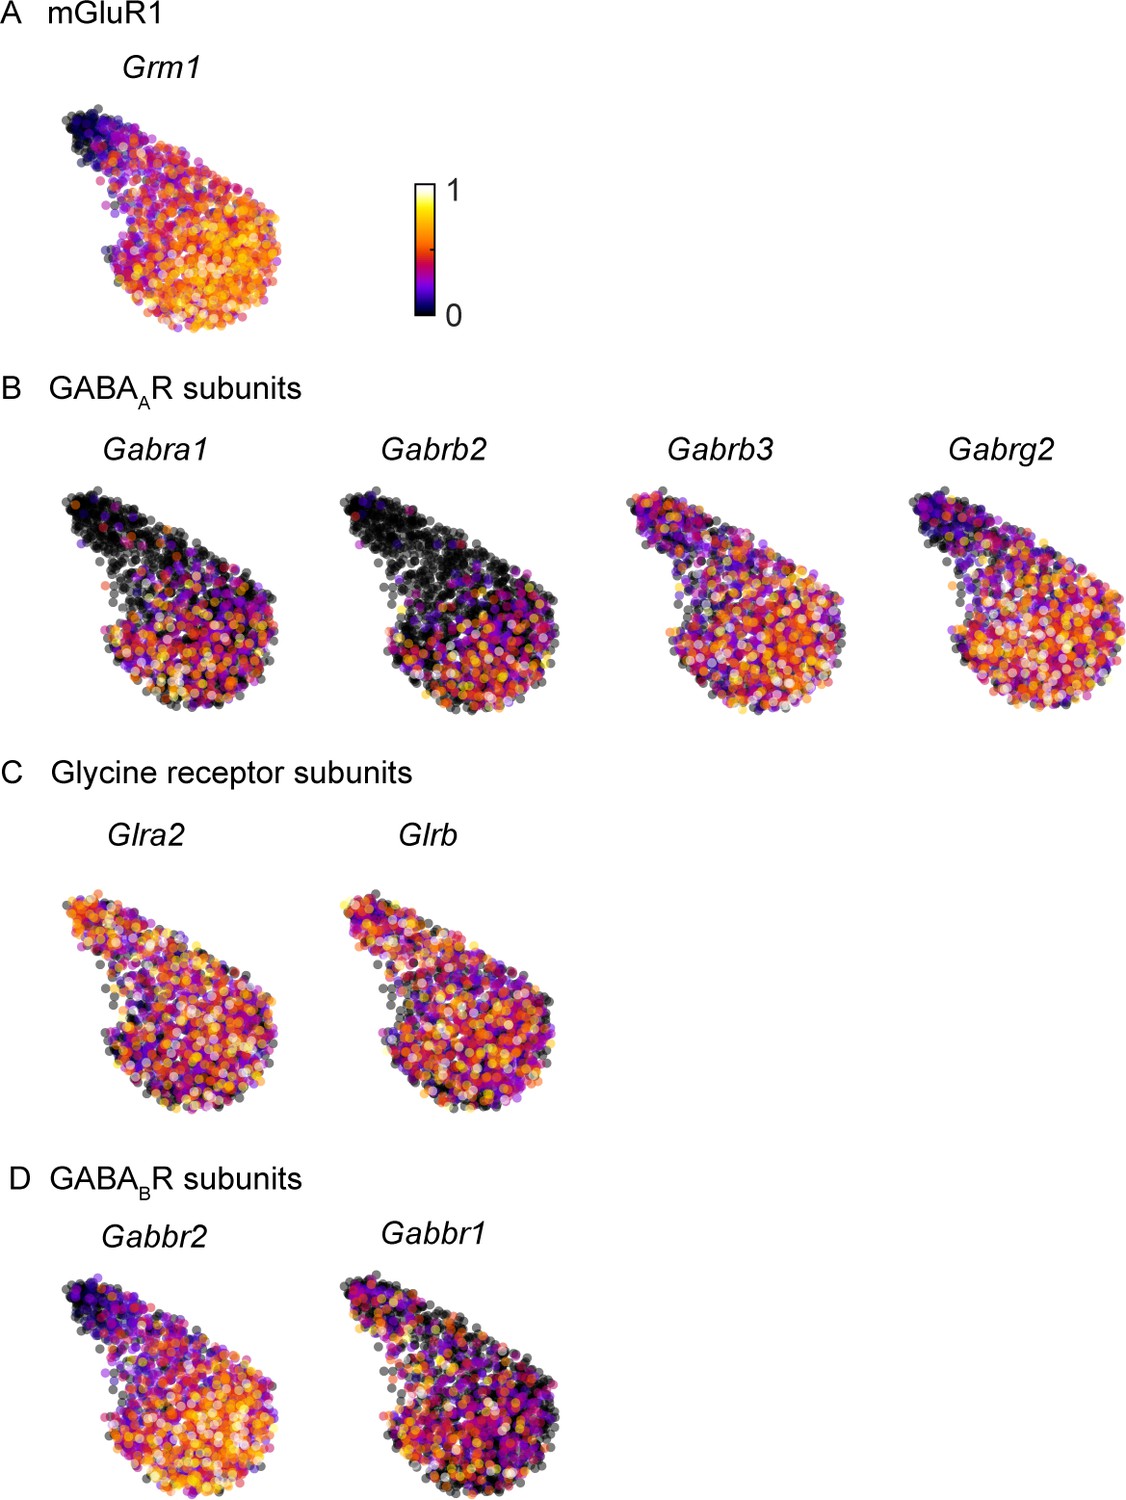
GABAA and GABAB receptor subunits are preferentially expressed in mGluR1-positive UBCs.
Molecular data is from https://singlecell.broadinstitute.org/single_cell/study/SCP795/. We analyzed scRNAseq data of UBCs for GABAA, glycine, and GABAB receptor subunits expression levels in relation to the molecular identity of UBCs based on mGluR1 expression. Each dot represents a single UBC nucleus and the cluster is composed of UBCs across the cerebellar cortex of six p60 mice. For ease of visualization, a two-dimensional UMAP embedding is used to illustrate population trends such that cells with similar molecular profiles are located near each other. (A) Normalized expression of mGluR1 (Grm1) in UBCs with UMAP embedding. This panel is reproduced from Guo et al., 2020 (n=1613 nuclei). (B) Same plot for GABAA receptor subunits α1, β2/3, and γ2 (Gabra1, Gabrb2/3, and Gabrg2) with significant expression in UBCs. (C) Same plot for glycine receptor subunits α2 and β (Glra2 and Glrb). (D) Same plot for GABAB receptor subunits 1 and 2 (Gabbr1 and Gabbr2). UBC, unipolar brushcell; UMAP, Uniform Manifold Approximation and Projection.
Figure 3
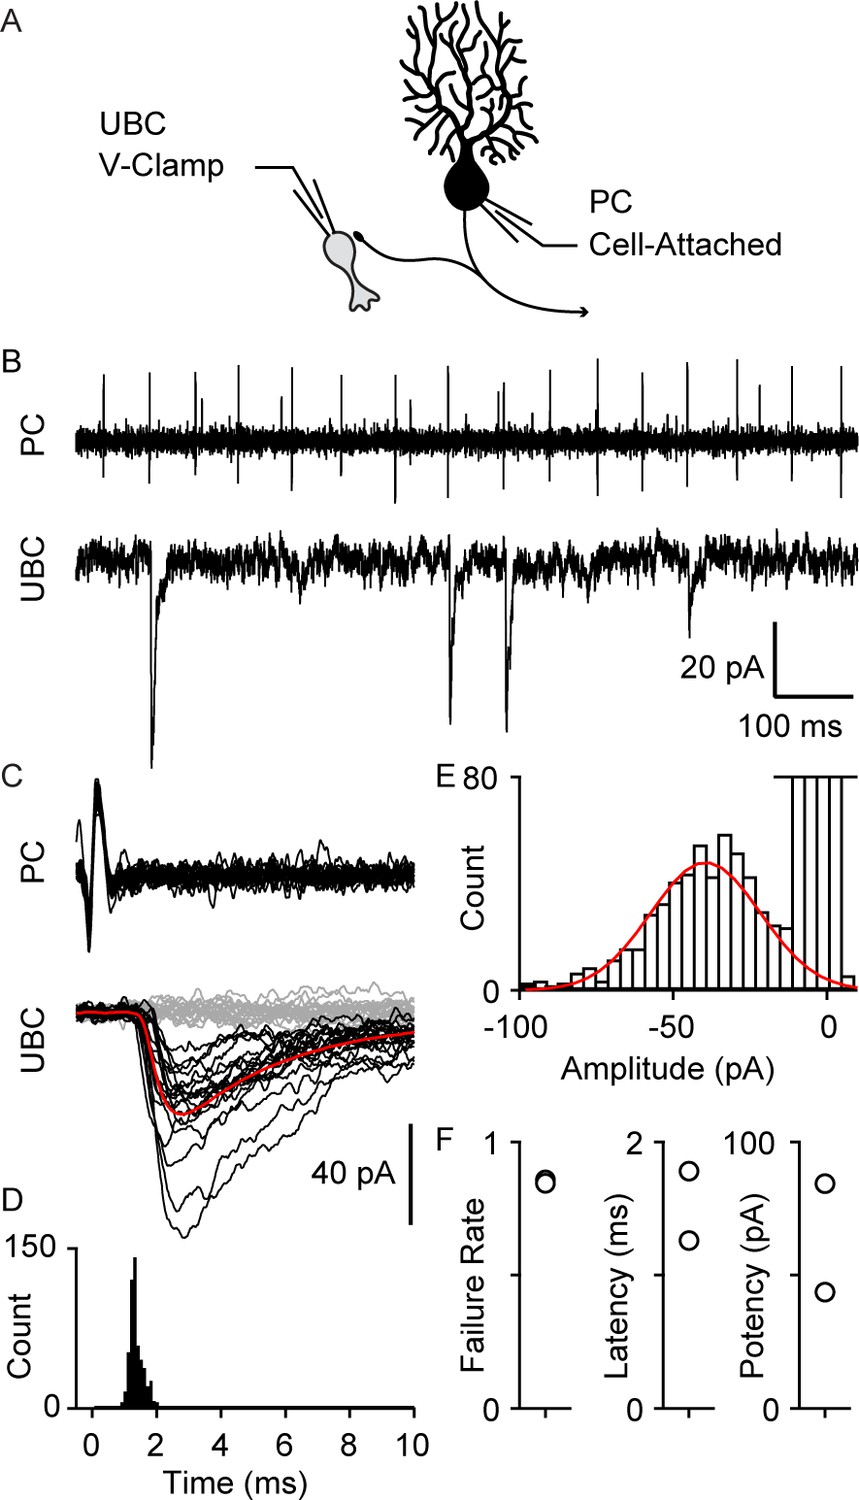
Paired recordings of PC to UBC synaptic connections.
(A) Schematic of the paired recording configuration. (B) A representative pair showing a cell-attached PC recording (top) and whole-cell voltage-clamp recording of a synaptically connected UBC (bottom). (C) Same two cells showing time-aligned PC spikes (top) and associated IPSCs in UBCs (bottom), with successes in black, failures in gray, and average response from success trials in red. (D) Histogram of IPSC latency (bin size=0.1 ms). (E) Histogram of IPSC amplitude (bin size=4 pA) and Gaussian fit over success trials (red). (F) Failure rate (left), latency (middle), and potency (left) PC to UBC synapse (n=2 cells). IPSC, inhibitory post-synaptic current; PC, Purkinje cell; UBC, unipolar brush cell.
Figure 4 with 1 supplement
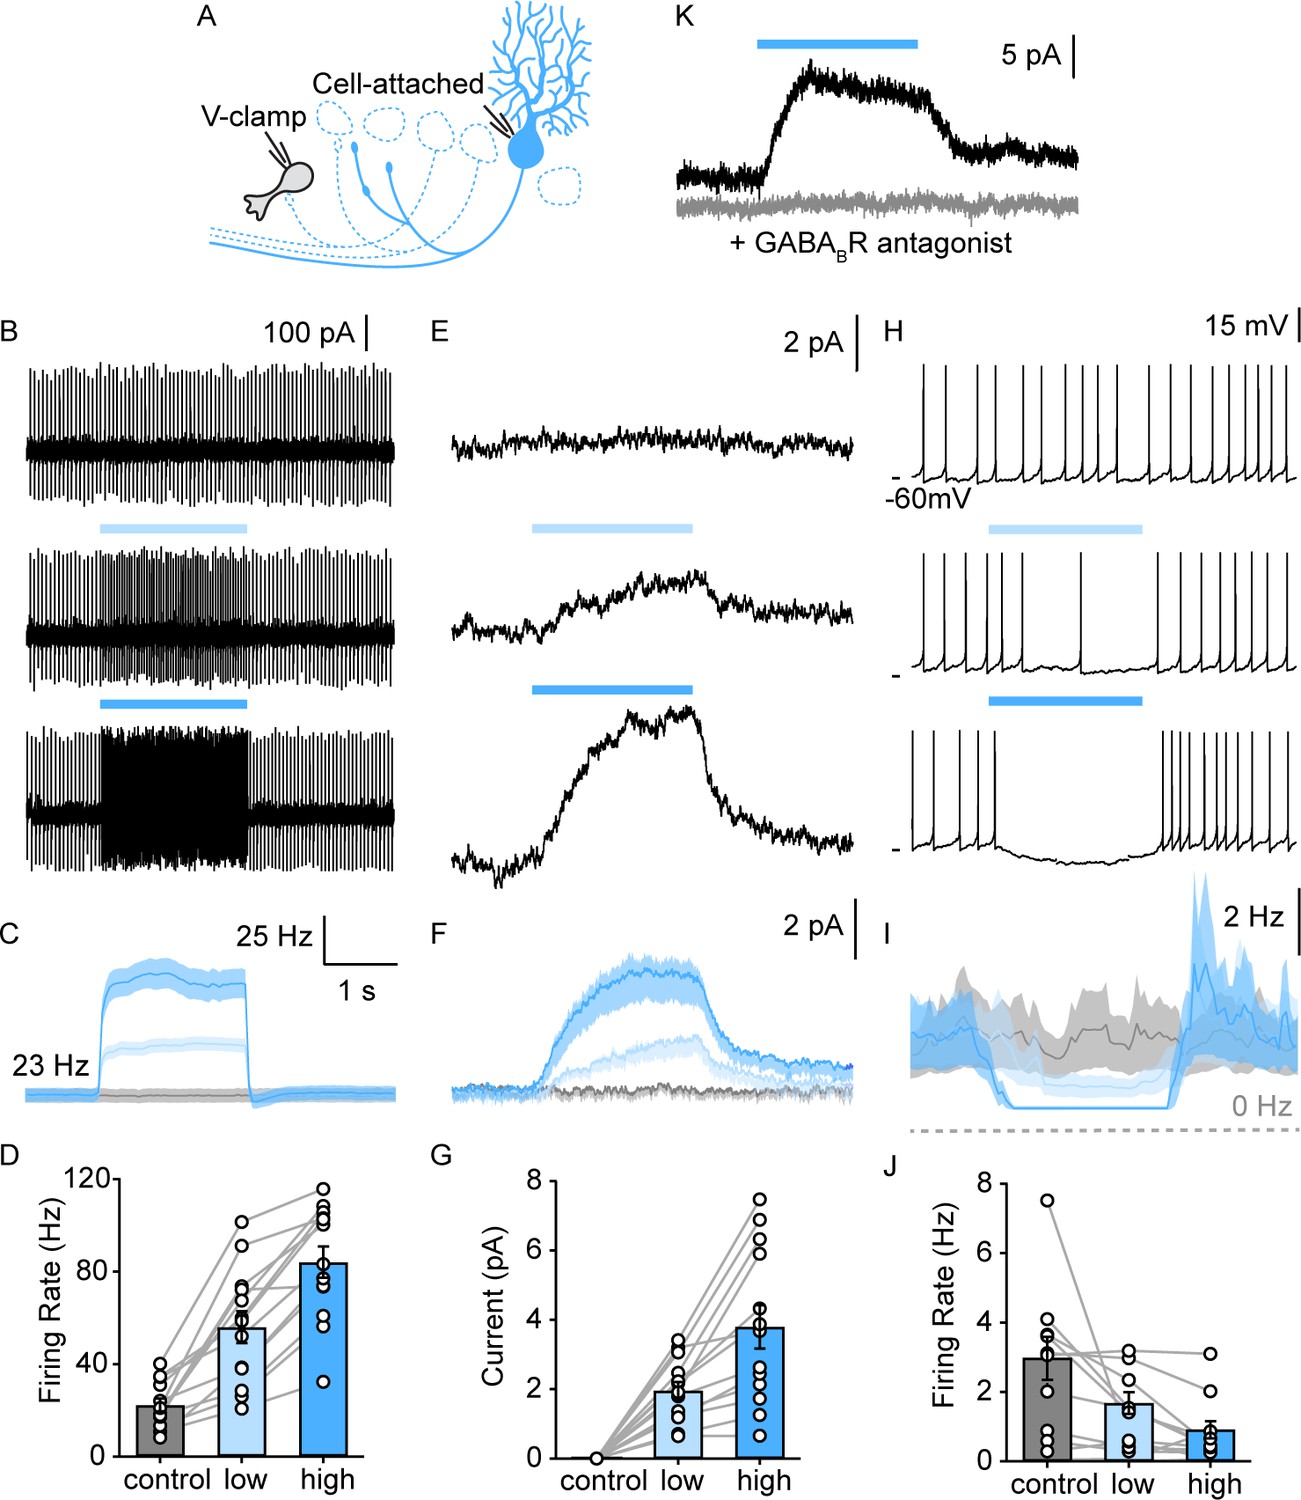
PC collaterals provide slow GABAB receptor-mediated inhibition onto lobule X UBCs.
(A) Schematic of full-field optical stimulation for modulating PC firing rate in lobule X. (B) Cell-attached recording of spontaneous PC spikes for no (top), low intensity (middle), and high intensity (bottom) full-field optical stimulations. (C) Average instantaneous firing rate of PCs with no (gray), low (light blue), and high (blue) intensity stimulations (n=13). (D) Summary of PC firing rate with no (gray), low (light blue), and high (blue) intensity light-stimulations of PCs (n=13). (E) Voltage-clamp recordings in UBC revealed a slow inhibitory response that is modulated by PC firing rate, same optical stimulation conditions as in (B). (F) Average evoked current of UBCs during stimulations as in (E) (n=13). (G) Summary of inhibitory current amplitude in UBCs with no (gray), low (light blue), and high (blue) intensity light-stimulations of PCs (n=13). (H) Full-field activation of PCs suppressed the frequency of UBC firing. (I) Average instantaneous firing rate of UBCs with no (gray), low (light blue), and high (blue) intensity stimulations (n=13). (J) Summary of firing rate changes in spontaneous firing UBCs with no (gray), low (light blue), and high (blue) intensity light-stimulations of PCs (n=10). (K) PC evoked slow outward currents in UBC in the presence of GABAAR blockers under voltage-clamp before (black) and after blocking GABABR (gray) (n=1). PC, Purkinje cell; UBC, unipolar brush cell.
Figure 4—figure supplement 1
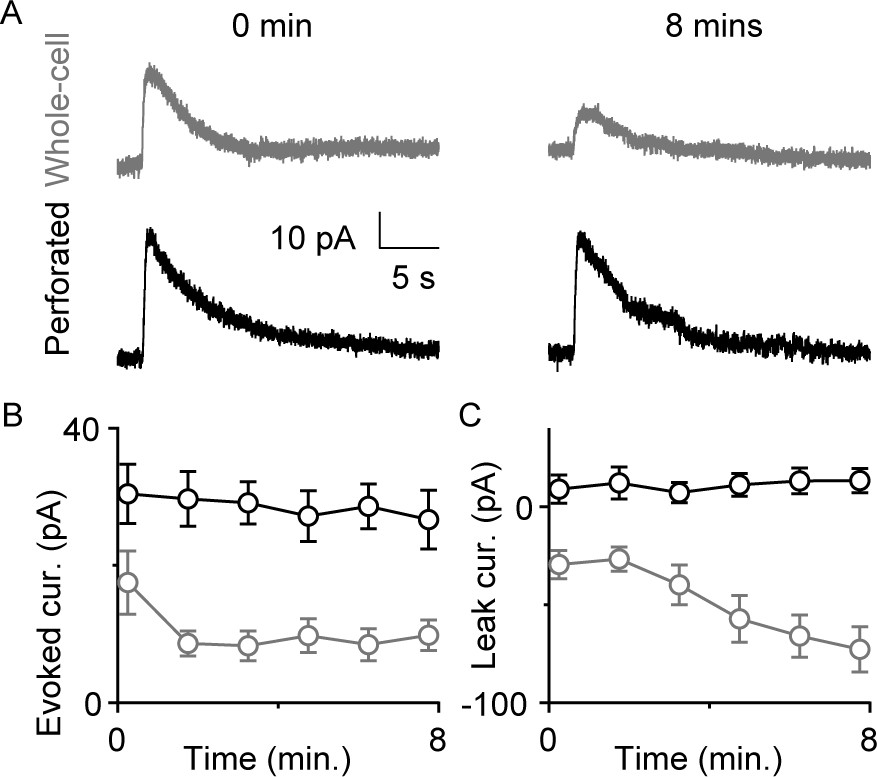
Perforated patch recordings provide stable responses to a GABAB-receptor agonist.
(A) Sample whole-cell (top, gray) and perforated (bottom, black) responses to baclofen puffs immediately after break-in (left) and 8 min later (right column). (B) Baclofen response amplitudes measured with perforated patch (black, mean ± SEM, n=3) and whole-cell (gray, mean ± SEM, n=4) recordings. (C) Magnitude of leak currents measured with perforated patch (black, mean ± SEM, n=3) and whole-cell (gray, mean ± SEM, n=4) recordings.
Figure 5
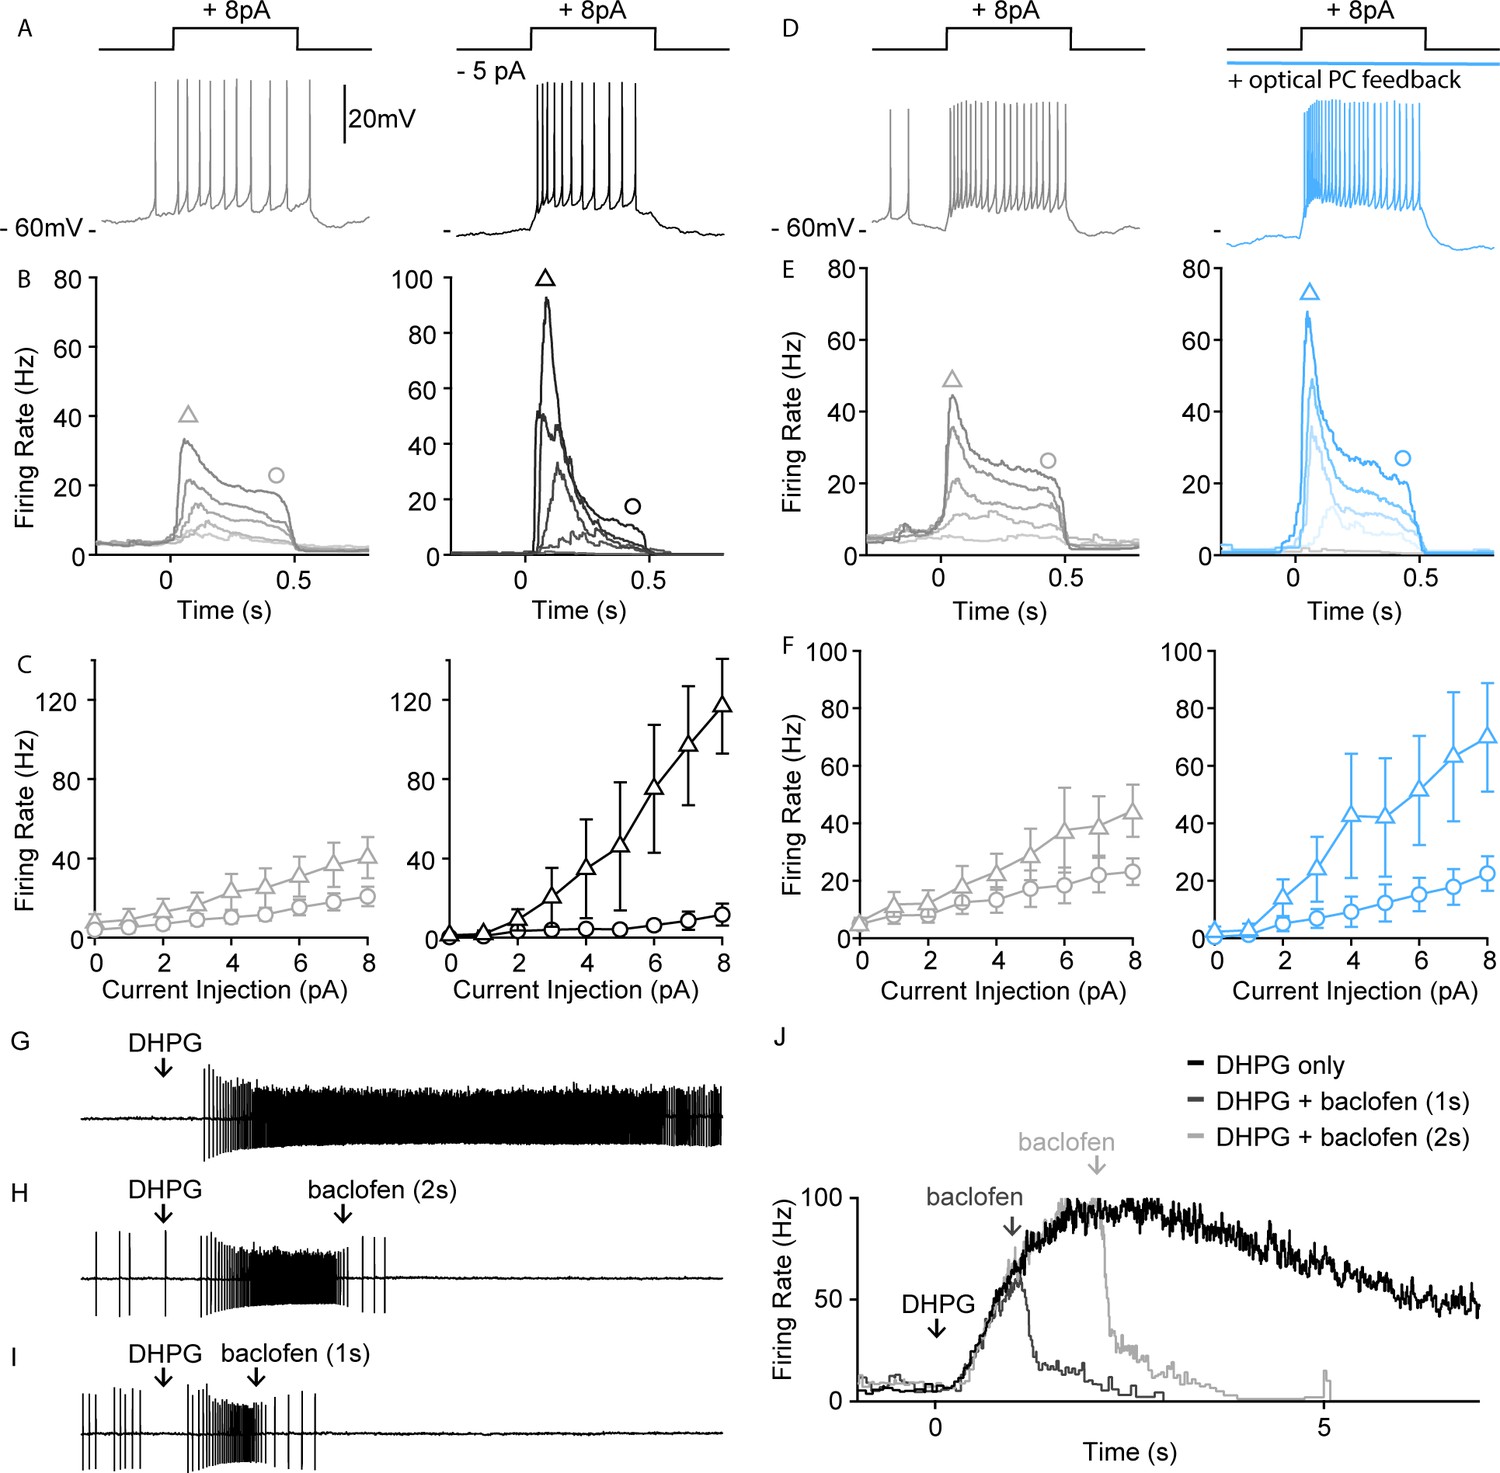
PC-UBC feedback via GABABR sharpens temporal response to current injections.
(A) Sample perforated current-clamp recording of UBC spiking response to an 8 pA current step (500 ms), without (gray, left) and with a hyperpolarizing tonic current (black, right). (B) Average instantaneous firing rate to current steps of (0, 2, 4, 6, and 8 pA, from light to dark shade) without (gray, left) and with a hyperpolarizing tonic current (black, right) (n=4). (C) Summary of peak firing rate (triangle marker, mean ± SEM) and steady-state firing rate (circle marker, mean ± SEM) for the two conditions as in (B) (n=4). (D) Same summary plot as in (A) for control (gray, left) versus optical PC feedback (blue, right). (E) Same summary plot as in (B) for control (gray, left) versus optical PC feedback (blue, right) (n=5). (F) Same summary plot as in (C) for control (gray, left) versus optical PC feedback (blue, right) (n=5). (G) In a sample UBC pressure-application of a mGluR1 agonist (DHPG 100 µM, 10 ms) evoked persistent spiking for a few seconds. (H) Pressure-applied GABABR agonist (baclofen 250 μM, 100 ms) 2 s following mGluR1 agonist application readily reduced the firing rate of persistent spiking response. (I) Same as in (B) but only 1 s following mGluR1 agonist application. (J) Average instantaneous firing rate of the sample UBC under mGluR1 agonist application only (black), mGluR1+ GABABR agonist applied 1 s apart (dark gray) or 2 s apart (light gray). PC, Purkinje cell; UBC, unipolar brush cell.
Tables
Key resources table
| Reagent type (species) or resource | Designation | Source or reference | Identifiers | Additional information |
|---|---|---|---|---|
| Strain, strain background (Mus musculus) | C57BL/6 | Charles River | ||
| Strain, strain background (M. musculus) | B6.Cg-Tg(Pcp2-cre)3555Jdhu/J | Jackson Laboratory | Strain#010536 | |
| Strain, strain background (M. musculus) | ChR2-EYFP (Ai32) | Jackson Laboratory | Strain#024109 | |
| Strain, strain background (M. musculus) | Synaptophysin-tdTomato (Ai34D) | Jackon Laboratory | Strain#021570 | |
| Chemical compound, drug | NBQX disodium salt | Abcam | Ab120046 | |
| Chemical compound, drug | (R)-CPP | Abcam | Ab120159 | |
| Chemical compound, drug | Strychnine hydrochloride | Abcam | Ab120416 | |
| Chemical compound, drug | SR95531 (Gabazine) | Abcam | Ab120042 | |
| Chemical compound, drug | L-Glutamate | Abcam | Ab120049 | |
| Chemical compound, drug | (RS)-3,5-DHPG | Tocris | Cat. no. 0342/1 | |
| Chemical compound, drug | (R,S)-Baclofen | Abcam | Ab120149 | |
| Chemical compound, drug | CGP 55845 hydrochloride | Tocris | Cat. no. 1248 | |
| Antibodies | Guinea pig anti-VGAT (Guinea pig polyclonal) | Synaptic Systems | 131004 | 1 μg/mL stock, 1:200 |
| Antibodies | Mouse anti-rat mGluR1 (Mouse monoclonal) | BD Pharmingen | Cat. no. 556331 | 0.5 mg/mL stock, 1:800 |
| Antibodies | Goat anti-Guinea pig Alexa Fluor 488 (Goat polyclonal) | Abcam | Ab150185 | 1:500 |
| Antibodies | Goat anti-mouse Alexa Fluor 647 (Goat poly clonal) | Invitrogen | A32728 | 1:500 |
| Software, algorithm | Igor Pro 6 | Wavemetrics | https://www.wavemetrics.com/ | |
| Software, algorithm | MafPC | Courtesy of M.A. Xu-Friedman | https://www.xufriedman.org/mafpc | |
| Software, algorithm | MATLAB (R2017a) | MathWorks | https://www.mathworks.com/products/matlab.html | |
| Software, algorithm | ImageJ | NIH | https://imagej.nih.gov/ij/ | |
| Software, algorithm | Python | Python Software Foundation | https://www.python.org/ | |
| Software, algorithm | Pytorch | Opensource | https://www.pytorch.org/ |
Additional files
Download links
A two-part list of links to download the article, or parts of the article, in various formats.
Downloads (link to download the article as PDF)
Open citations (links to open the citations from this article in various online reference manager services)
Cite this article (links to download the citations from this article in formats compatible with various reference manager tools)
Purkinje cell outputs selectively inhibit a subset of unipolar brush cells in the input layer of the cerebellar cortex
eLife 10:e68802.
https://doi.org/10.7554/eLife.68802


