Effect of malaria parasite shape on its alignment at erythrocyte membrane
- Theoretical Physics of Living Matter, Institute of Biological Information Processing and Institute for Advanced Simulation, Forschungszentrum Jülich, Germany
Figures
Figure 1
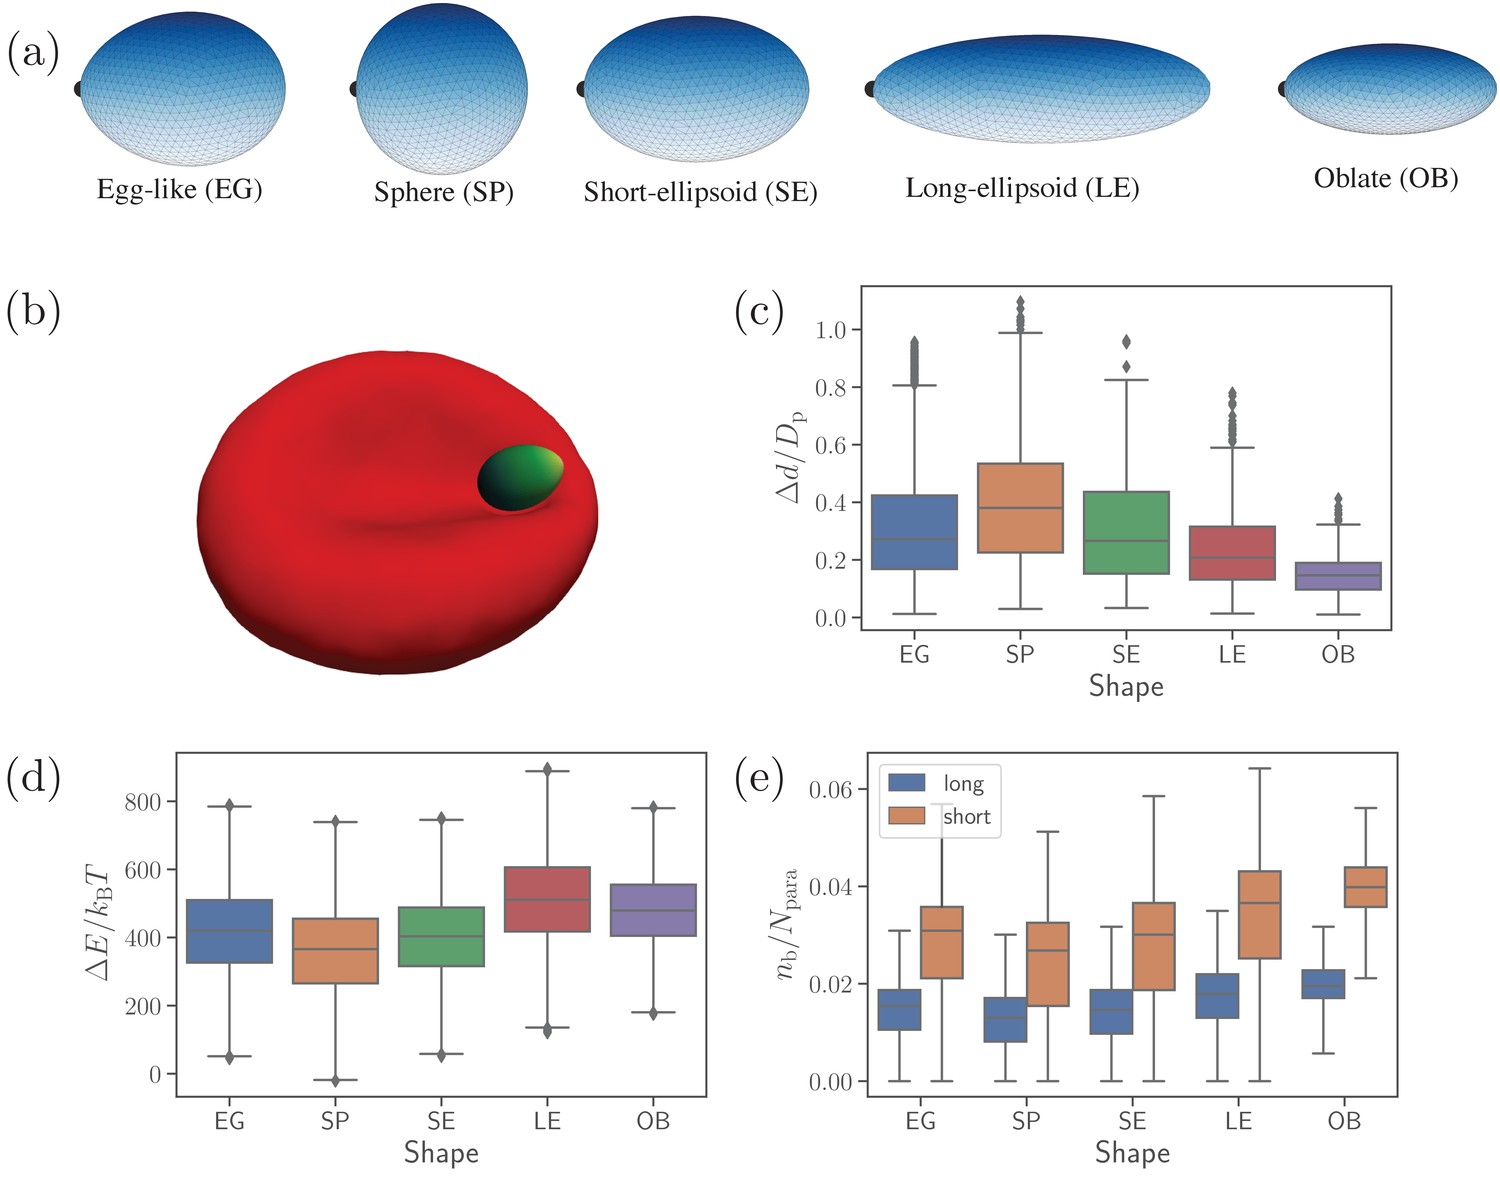
Different parasite shapes and their dynamic properties.
(a) Triangulated surfaces of different parasite shapes including an egg-like (EG) shape, a sphere (SP), a short ellipsoid (SE), a long ellipsoid (LE), and an oblate ellipsoid (OB). The apex position is indicated by a black point for all parasite shapes. (b) A snapshot from simulations showing an egg-like parasite interacting with the RBC membrane, see also Video 1. A bright yellow color indicates the apical complex and a dark green color represents the parasite’s back. The egg-like (EG) shape is a typical shape of merozoites. (c–e) Different dynamical characteristics for various parasite shapes. (c) Fixed-time displacement of the parasite normalized by an effective parasite diameter where is the parasite membrane area. (d) Change in total membrane energy due to deformation induced by the parasite. (e) Number of short and long bonds . In (c)-(d), all data are for the reference parameter set, see Table 1.
-
Figure 1—source data 1
Source data for graphs shown in Figure 1(c–e).
- https://cdn.elifesciences.org/articles/68818/elife-68818-fig1-data1-v2.zip
Figure 2
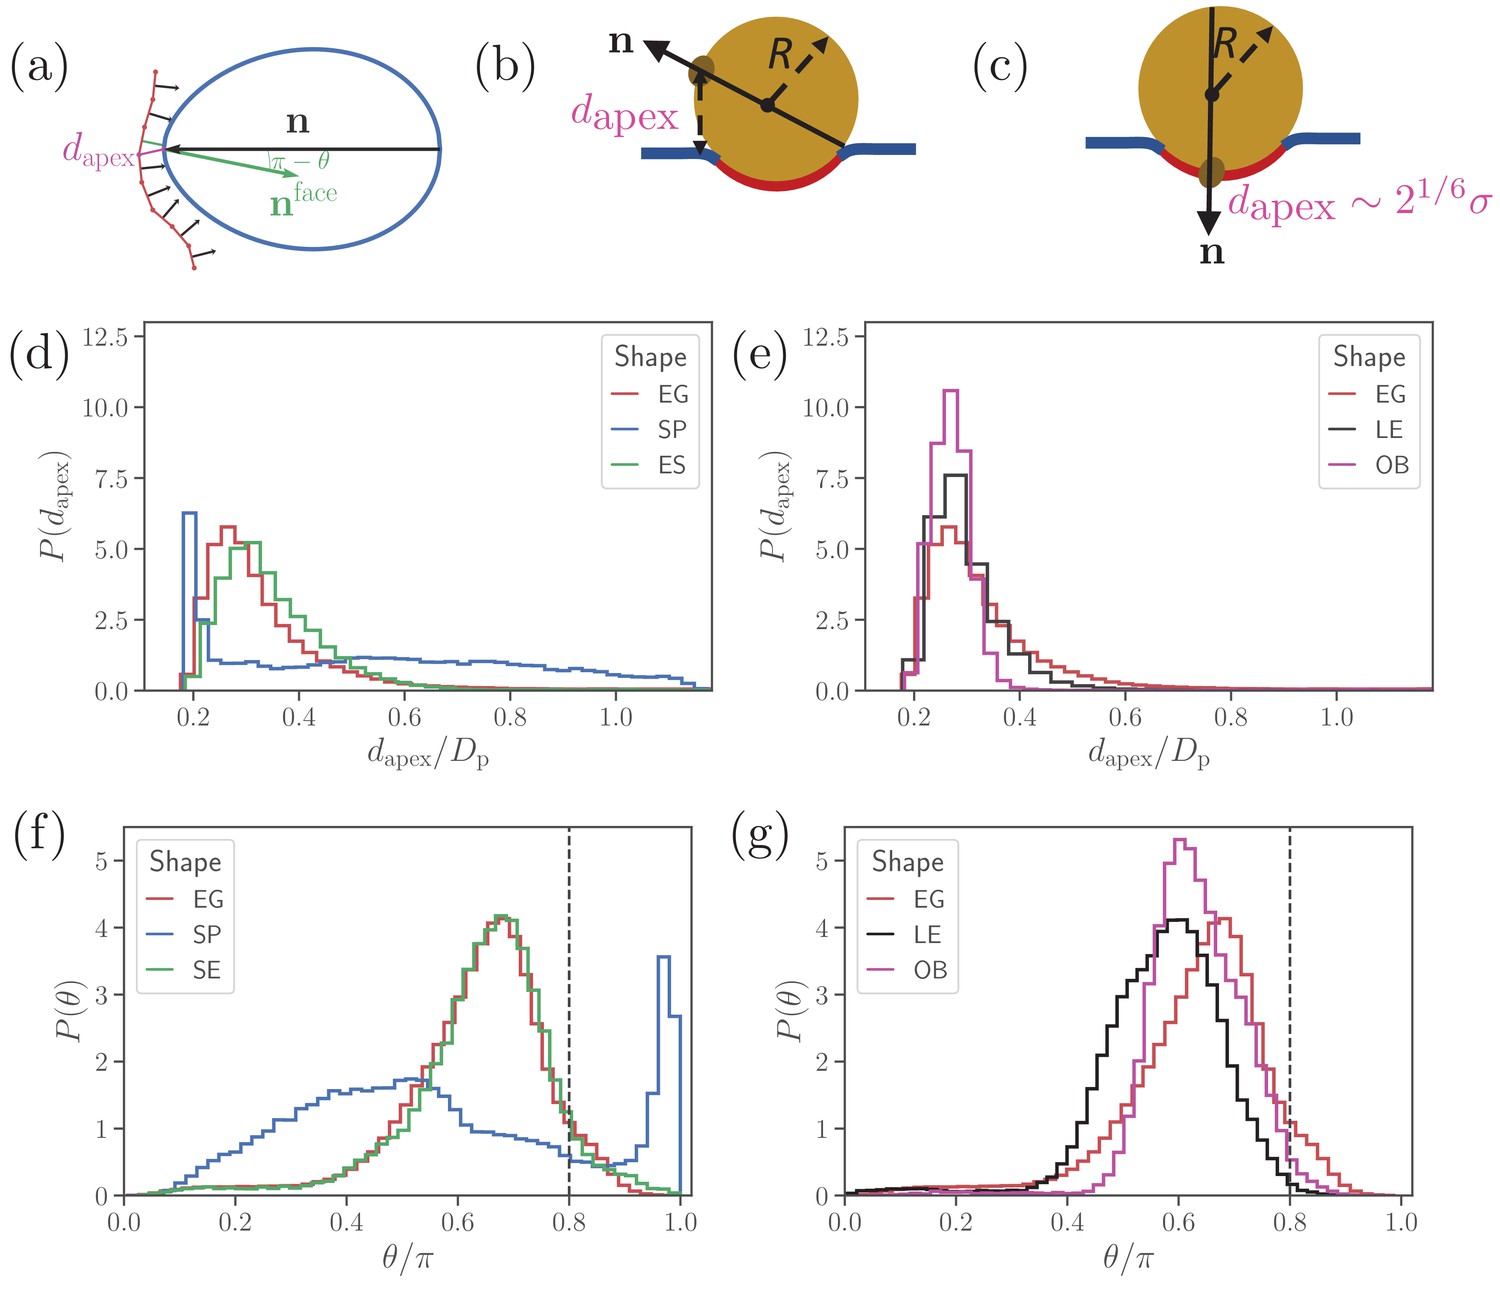
Parasite alignment characteristics.
(a) Sketch of parasite at the RBC membrane. Alignment angle, θ, is defined as the angle between the parasite’s directional vector (black arrow) and membrane surface normal (green arrow). The apex distance, , is the distance between the parasite’s apex and the RBC membrane surface. (b) and (c) Sketch of a spherical parasite of radius , partially wrapped by a membrane area , with its apex (b) away from the adhesion area and (c) within the wrapped area. (d) and (e) Apex distance dapex distributions and (f) and (g) alignment angle θ distributions for all shapes. In all plots, the alignment criteria from Equation (2) are shown by the dashed lines. For a better readability, the distributions for SP and SE shapes in (d) and (e) are plotted separately from the distributions for LE and OB shapes in (f) and (g) along with distributions of the egg-like shape (EG) in all plots.
-
Figure 2—source data 1
Source data for graphs shown in Figure 2(d–g).
- https://cdn.elifesciences.org/articles/68818/elife-68818-fig2-data1-v2.zip
Figure 3
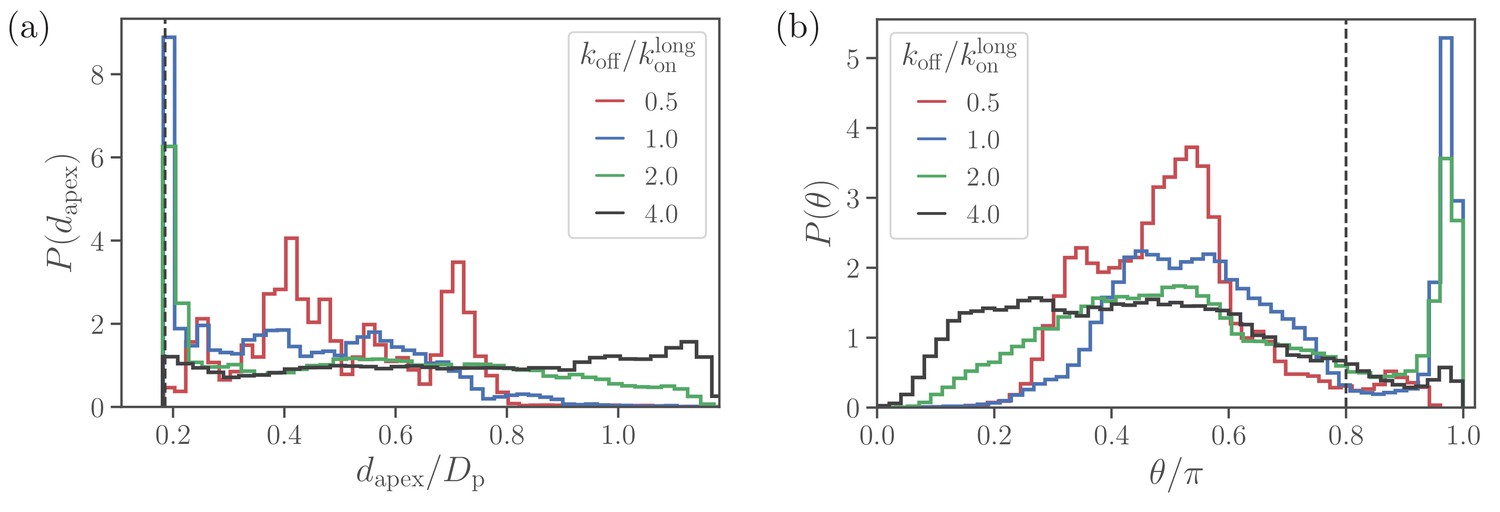
Alignment of a spherical parasite.
(a) Apex-distance and (b) alignment-angle distributions of the SP shape for different bond off-rates. The alignment criteria from Equation 2 are shown by the dashed lines. Several peaks in for are due to limited statistics, since for the strongest adhesion, the parasite mobility is very low and the simulations are too short to capture the stationary distribution.
-
Figure 3—source data 1
Source data for graphs shown in Figure 3.
- https://cdn.elifesciences.org/articles/68818/elife-68818-fig3-data1-v2.zip
Figure 4
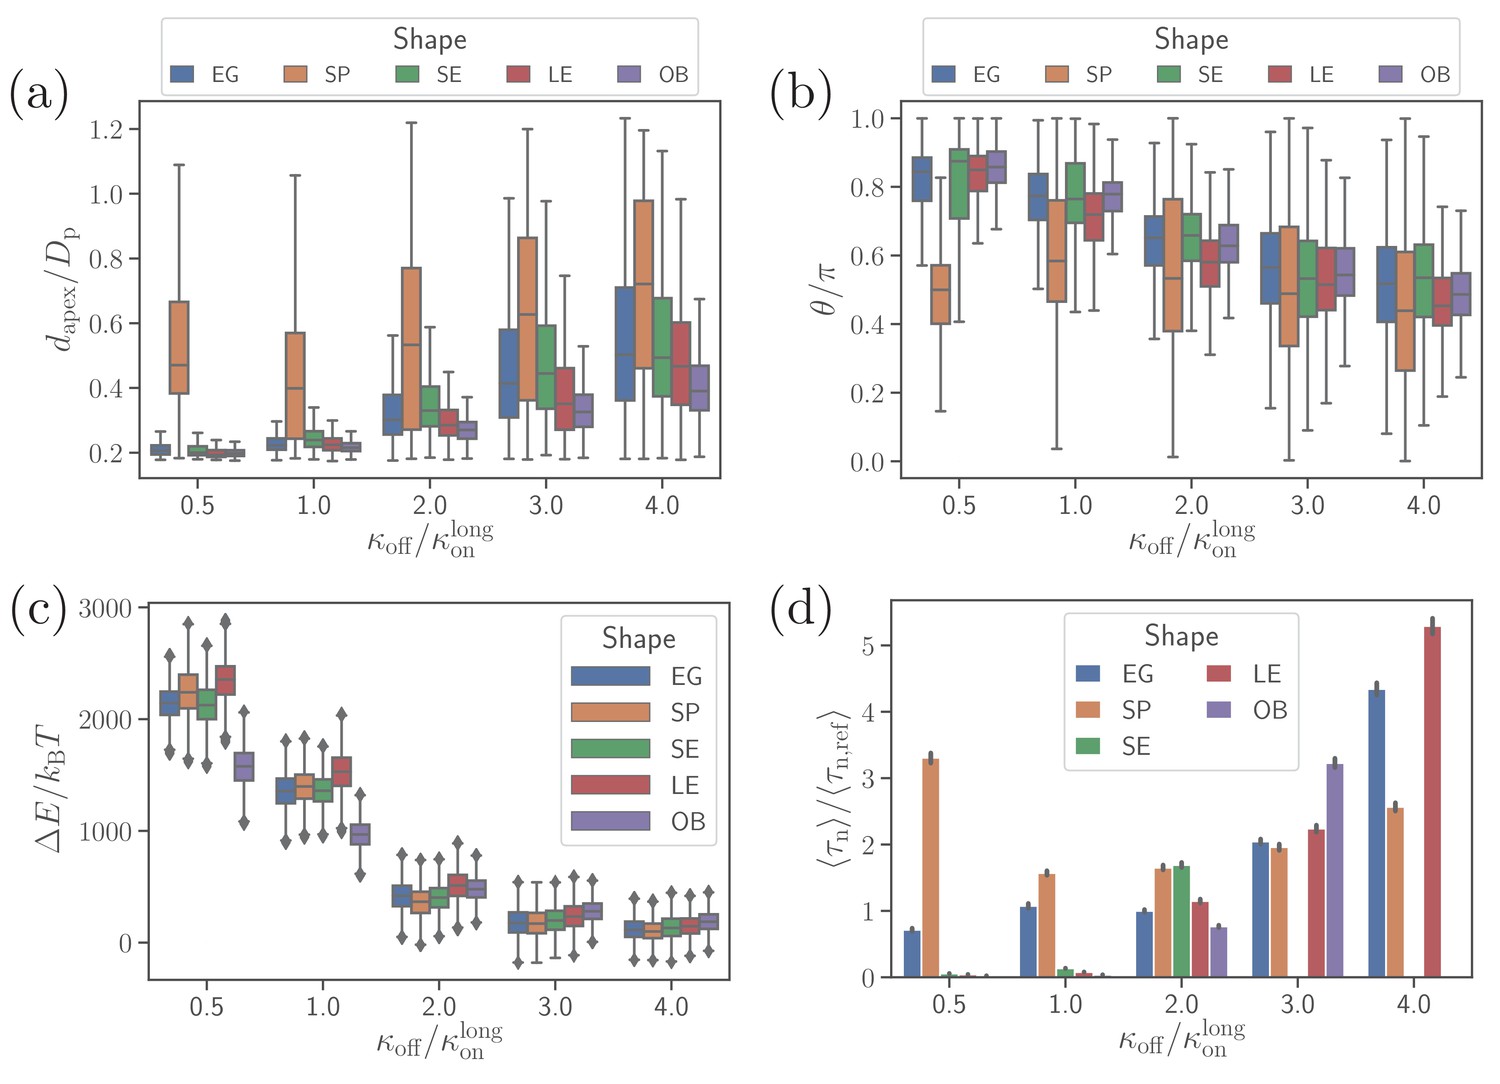
Effect of parasite adhesion strength of the alignment time.
(a) Apex distance dapex, (b) alignment angle θ, (c) total deformation energy , and (d) alignment time for different parasite shapes and bond off-rates that determine the adhesion strength. Several missing bars in the plot of alignment times for indicate that is much larger than 26 s which is the maximum time of all simulation trajectories.
-
Figure 4—source data 1
Source data for graphs shown in Figure 4.
- https://cdn.elifesciences.org/articles/68818/elife-68818-fig4-data1-v2.zip
Figure 5

Alignment at a rigid membrane.
(a) Fixed-time displacement and (b) alignment time for different parasite shapes and two values of off-rates . Note that the data for long ellipsoids is omitted as they never become aligned during direct simulations indicating that their alignment time is much larger than the total simulation time.
-
Figure 5—source data 1
Source data for graphs shown in Figure 5.
- https://cdn.elifesciences.org/articles/68818/elife-68818-fig5-data1-v2.zip
Videos
Video 1
Motion of an egg-shaped parasite at the membrane of a deformable RBC for the reference RBC-parasite interactions.
.
Video 2
Mobility of the LE- and SP-shaped parasites at the RBC membrane, which can be compared to the EG shape in Video 1.
Here, .
Video 3
Mobility of the LE- and OB-shaped parasites at the RBC membrane, which can also be compared to the EG shape in Video 1.
Here, .
Tables
Table 1
List of kinetic bond parameters that are used to calibrate the parasite’s translational displacement in simulations against experimental data by Weiss et al., 2015.
is the membrane relaxation timescale.
| Parameter | Simulation value | Physical value |
|---|---|---|
| 100 nm | ||
| 20 nm | ||
| 0.4 | 107 μm-2 | |
| 0.6 | 161 μm-2 | |
| 39.6 s-1 | ||
| 317.0 s-1 | ||
| koff | 79.2 s-1 | |
| 2.57 μN m-1 | ||
| 0.856 μN m-1 |
Additional files
Download links
A two-part list of links to download the article, or parts of the article, in various formats.
Downloads (link to download the article as PDF)
Open citations (links to open the citations from this article in various online reference manager services)
Cite this article (links to download the citations from this article in formats compatible with various reference manager tools)
Effect of malaria parasite shape on its alignment at erythrocyte membrane
eLife 10:e68818.
https://doi.org/10.7554/eLife.68818


