Circadian regulation of vertebrate cone photoreceptor function
- University of Zurich, Department of Molecular Life Sciences, Switzerland
- Lab for Retinal Cell Biology, Department of Ophthalmology, University Hospital Zurich, University of Zurich, Switzerland
Figures
Figure 1 with 4 supplements
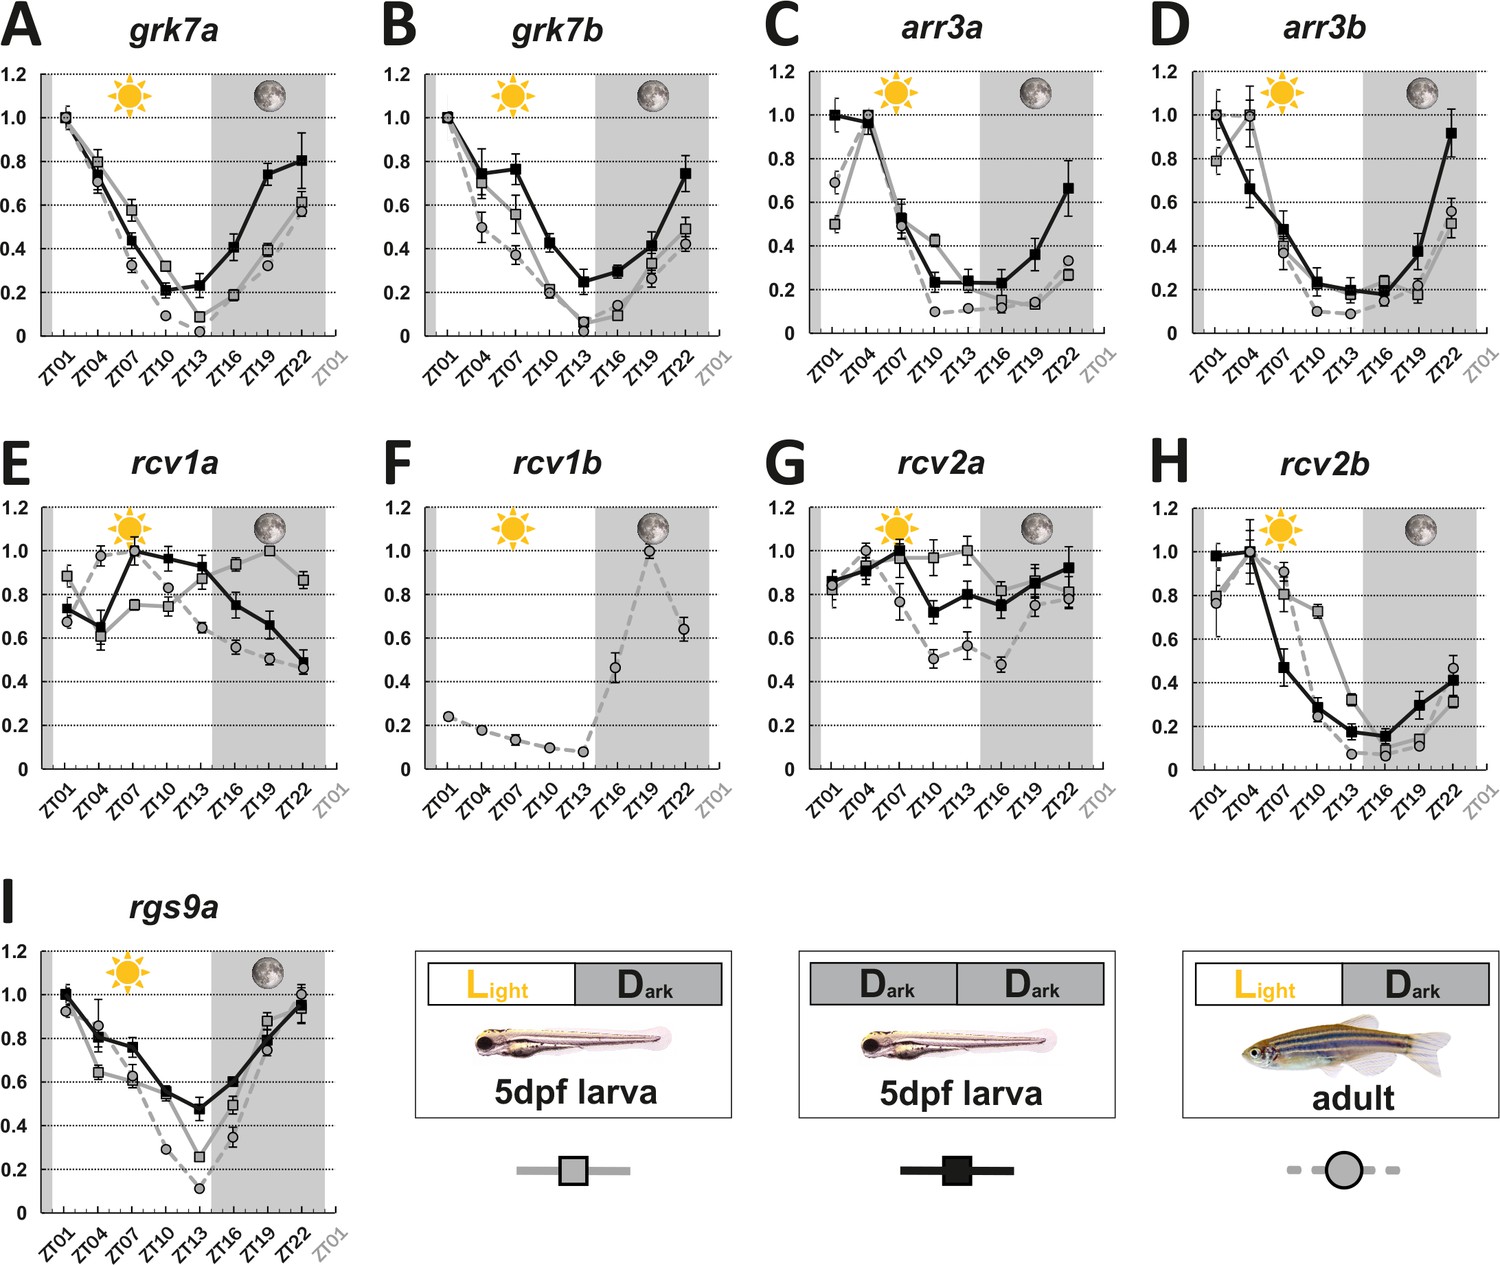
Key visual transduction decay gene transcripts that are under circadian control.
mRNA levels of visual transduction decay genes in the eye of adult and larval zebrafish were measured by qRT-PCR over a 24-hour-period. (A-I). Eye tissues from larval fish either raised under a normal light/dark cycle (LD / gray squares) or in continuous darkness (DD / black squares) and from adult LD zebrafish (gray circles) were collected at eight different time points throughout the day. The name of the analyzed gene transcripts is given on top of each graph. The time point of collection is indicated along the x-axis with ZT01 being the time point one hour after the light was turned on. Dark periods are indicated by the moon symbol and highlighted in gray, whereas the periods under regular light conditions are indicated by the sun symbol and shown in white. For better orientation the different conditions are summarized at the bottom of the figure. Data represents the mean ± standard error of the mean (s.e.m). Statistical analysis was performed by “RAIN” as previously described (Thaben and Westermark, 2014). Statistics information and the numbers of independent repeats are provided in Supplementary file 1. Metadata can be downloaded from DRYAD.
-
Figure 1—source data 1
mRNA levels of visual transduction decay genes in the eye of adult and larval zebrafish were measured by qRT-PCR over a 24 hr period.
- https://cdn.elifesciences.org/articles/68903/elife-68903-fig1-data1-v2.xlsx
Figure 1—figure supplement 1
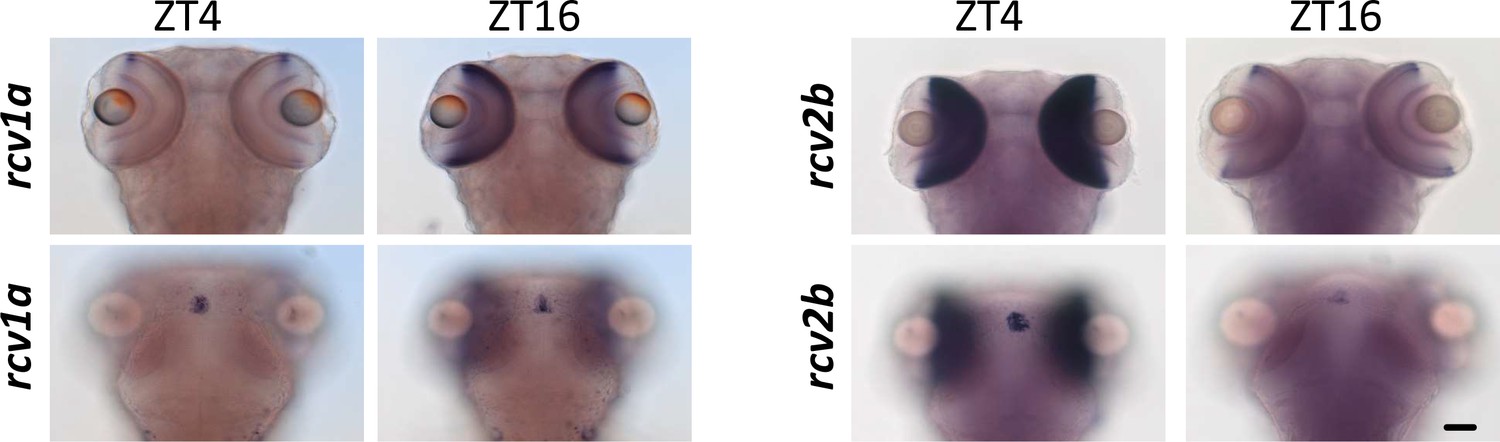
ISH of rcv1a and rcv2b as examples indicating the staining in pineal gland, may not or may be synchronized with the staining in the eye.
Scale bar (=50 µm) applies to all panels.
Figure 1—figure supplement 2
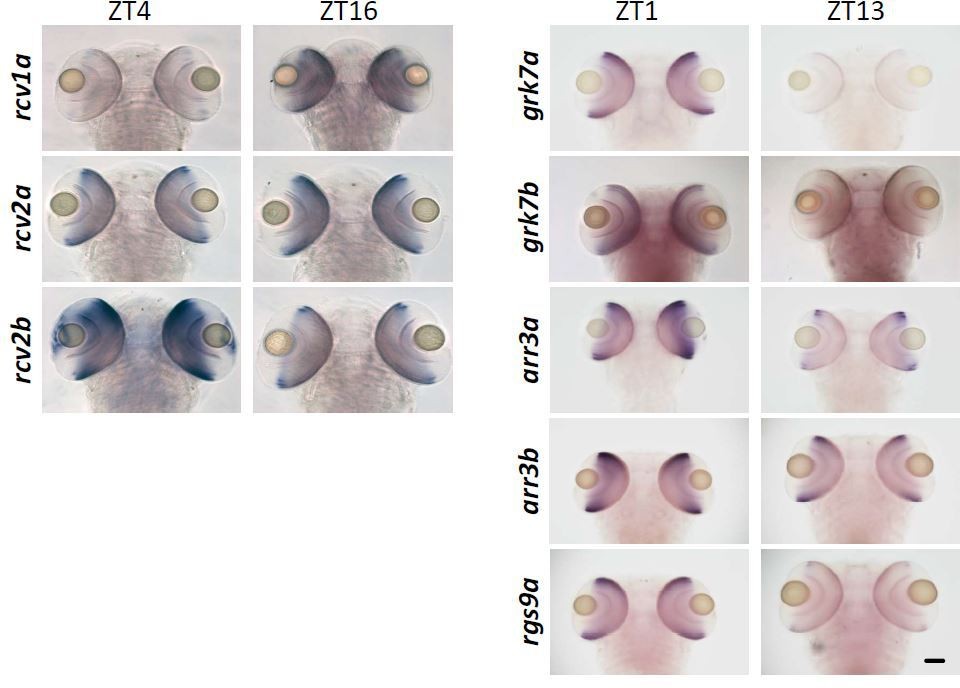
ISH showing different gene expressions at varying time points in 5 dpf zebrafish larvae in dorsal view.
Scale bar (=50 μm) applies to all panels.
Figure 1—figure supplement 3

ISH showing different gene expressions on radial sections of adult zebrafish retina at different time points indicated on top.
Arrow denotes ultraviolet (UV) cones. Scale bar = 20 µm.
Figure 1—figure supplement 4
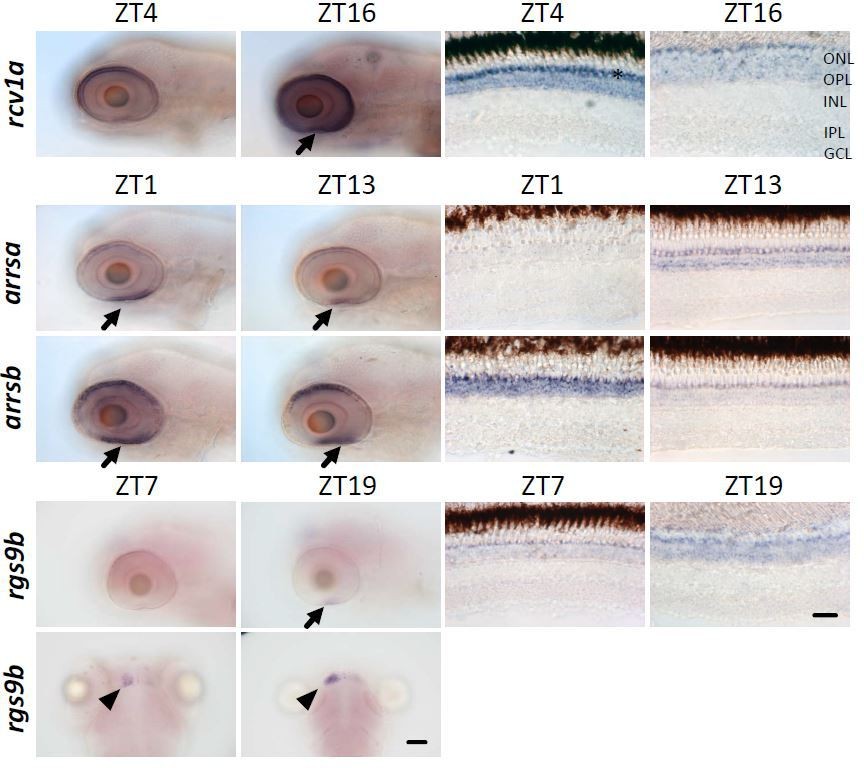
ISH showing different rod gene expressions in zebrafish larval and adult retina at different time points indicated on top.
Arrows denote regions enriched with rods. Arrowheads denote habenulae. Star denotes ultraviolet (UV) cone layer. GCL, ganglion cell layer; INL, inner nuclear layer; IPL, inner plexiform layer; ONL, outer nuclear layer; OPL, outer plexiform layer. Scale bar (=20 µm) applies to corresponding panels.
Figure 2

Circadian regulation of key visual transduction genes in nocturnal mice is reversed.
Transcript levels of indicated mouse genes (A-E) were measured using qRT-PCR on retinal tissue of 12-week-old wildtype mice. were measured using qRT-PCR on retinal tissue of 12-week-old wildtype mice. The time point of collection is indicated along the x-axis with ZT01 being the time point one hour after the light was turned on. Dark periods are indicated by the moon symbol and highlighted in gray, whereas the periods under regular light conditions are indicated by the sun symbol and shown in white. Data represents the mean ± s.e.m. Statistical analysis was performed by “RAIN” as previously described (Thaben and Westermark, 2014). Statistics information and the numbers of independent repeats are provided in Supplementary file 2. Metadata can be downloaded from DRYAD.
-
Figure 2—source data 1
mRNA levels of visual transduction decay genes in mouse eyes were measured by qRT-PCR over a 24 hr period.
- https://cdn.elifesciences.org/articles/68903/elife-68903-fig2-data1-v2.xlsx
Figure 3
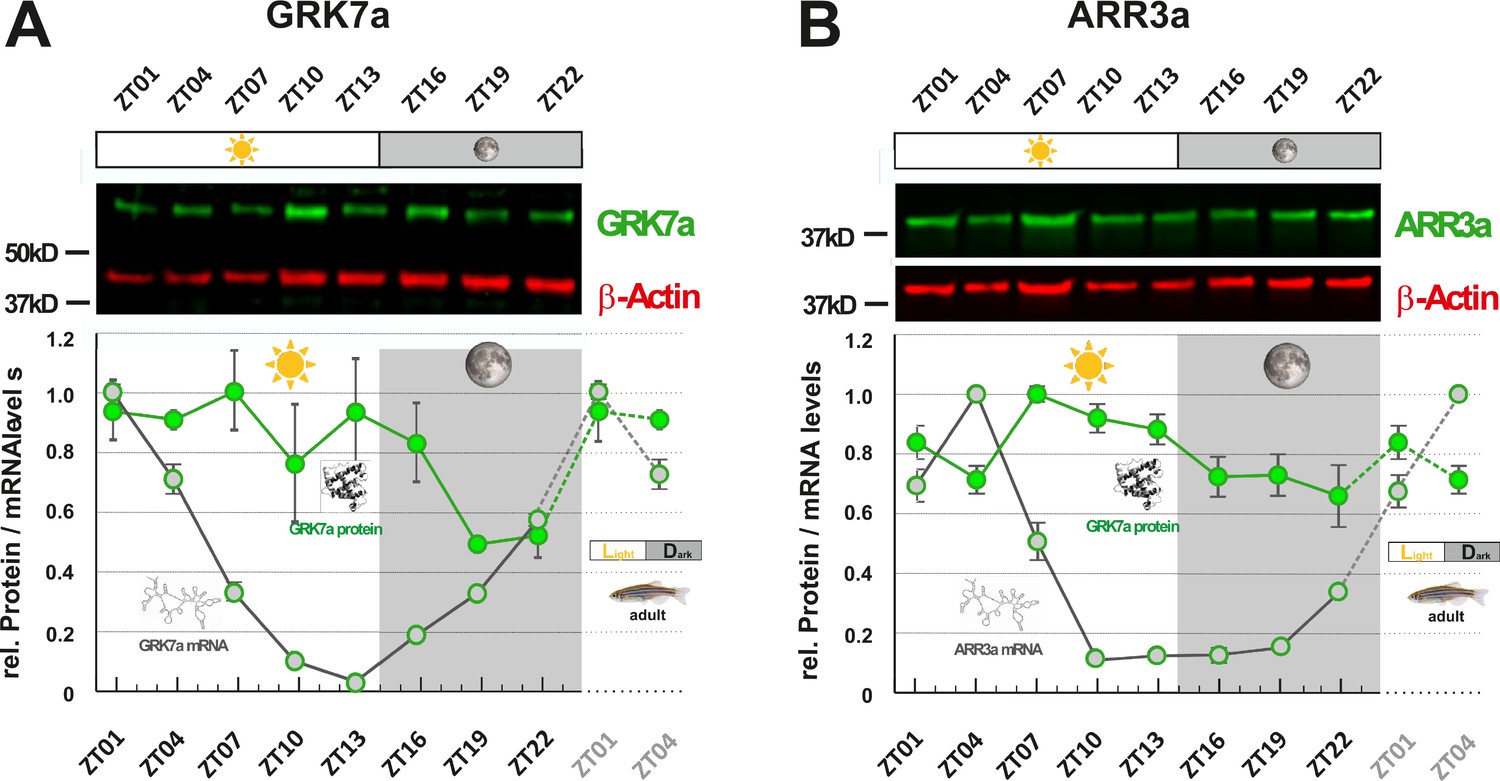
GRK7a and ARR3a protein levels show daily changes in adult zebrafish eyes.
GRK7a (A) and ARR3a (B) protein levels were quantified using Western blot analysis. β-Actin was used as a loading control. While mRNA transcript levels (gray circles / RNA structure) were lowest in the evening (ZT10 and ZT13, respectively), lowest protein expression levels (green circles / protein structure) were tailing RNA expression levels by around 6 to 12 hours, reaching lowest levels in the middle of the night at around ZT19. The time point of collection is indicated along the x-axis with ZT01 being the time point one hour after the light was turned on. Dark periods are indicated by the moon symbol and highlighted in gray, whereas the periods under regular light conditions are indicated by the sun symbol and shown in white. Data represents the mean ± s.e.m. Statistical analysis was performed by “RAIN” as previously described (Thaben and Westermark, 2014). Statistics information and the numbers of independent repeats are provided in Supplementary file 3. Metadata can be downloaded from DRYAD.
-
Figure 3—source data 1
Protein levels of Grk7a and Arr3a in the eye of adult zebrafish were measured by infrared western blotting over a 24 hr period.
- https://cdn.elifesciences.org/articles/68903/elife-68903-fig3-data1-v2.xlsx
Figure 4 with 2 supplements
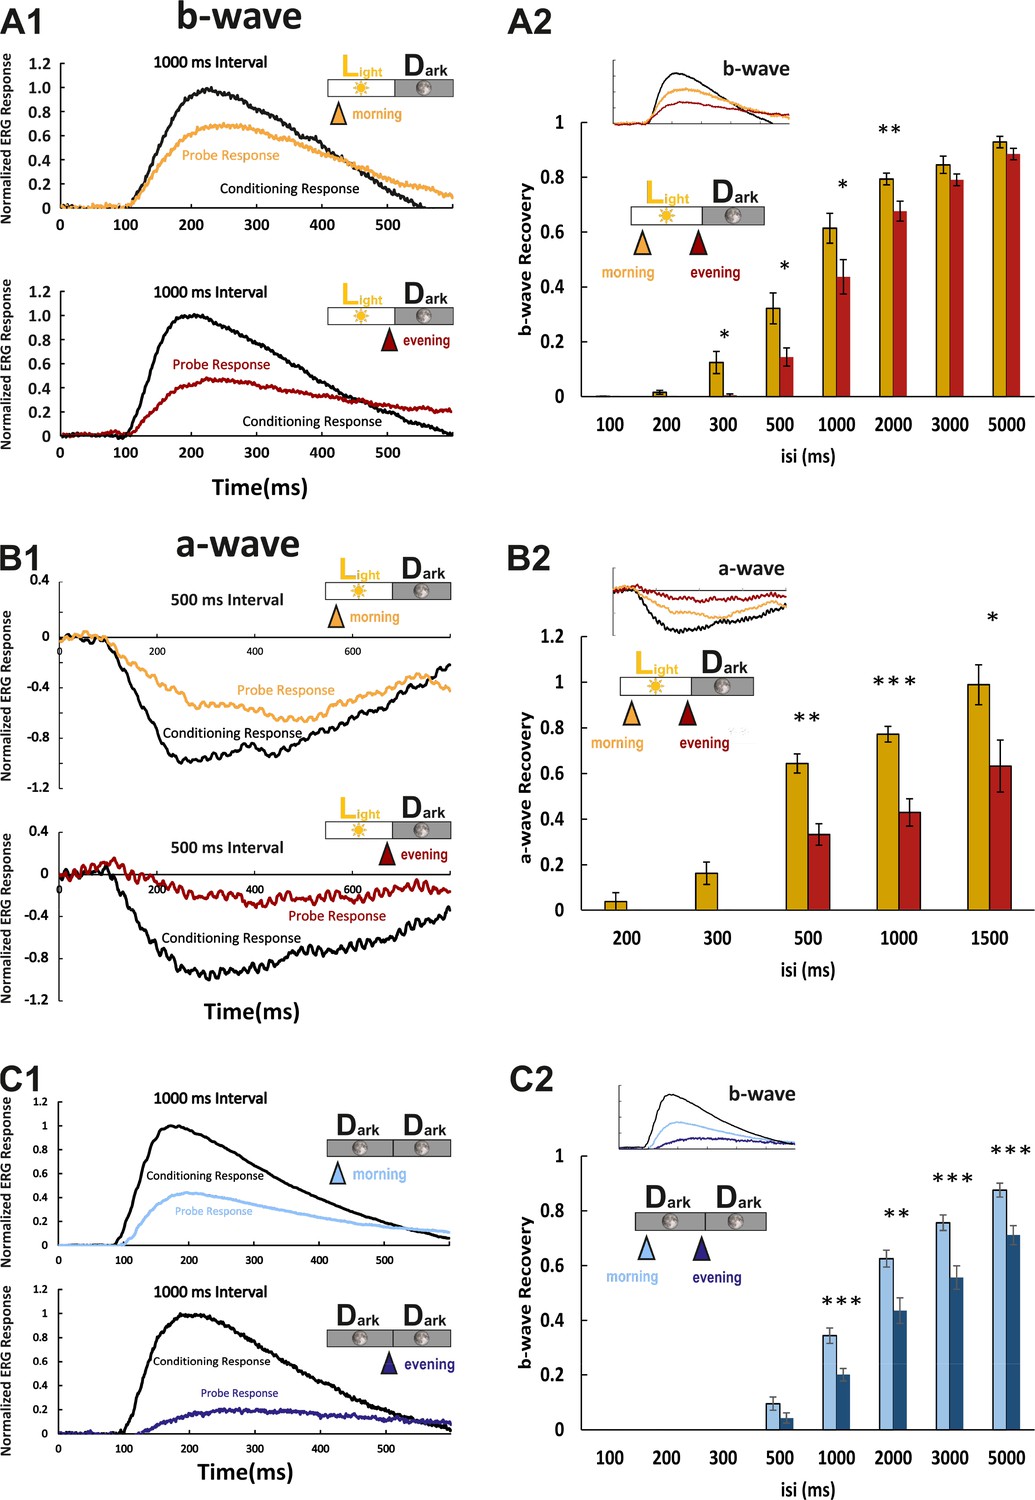
Larval cone photoresponse recovery is accelerated in the morning.
(A1) Examples of normal light/dark (LD) larval electroretinogram (ERG) b-wave recordings. A conditioning flash (black line) was followed by a probing flash (yellow and red lines), which were separated by 1000 ms. While the yellow triangle and curve mark the probe response in the morning, the red triangle and curve represent the probe response recorded in the evening. Note that the probe response in the evening is clearly diminished. (A2) b-wave recovery as a function of the interstimulus interval (isi). At 500 ms up to 3000 ms isi, b-wave recovery in the morning (yellow bars) is significantly enhanced when compared to corresponding recordings in the evening (red bars). Note that below 500 ms isi, no b-wave recovery can be observed and that at an interval of 5 s complete recovery can also be found in the evening. Data are presented as mean ± sem (n = 18 in the morning; n = 14 in the evening) of three independent experiments. t-tests and nonparametric tests were performed by GraphPad Prism version 8. p = 0.0149 at 300 ms isi; p = 0.0151 at 500 ms isi; p = 0.0405 at 1000 ms isi; p = 0.0069 at 2000 ms isi. *p<0.05; **p<0.01. (B1) Examples of LD larval ERG a-wave recordings under DL-threo-beta-benzyloxyaspartate (DL-TBOA) and L-2-amino-4-phosphonobutyric acid (L-AP4) inhibition. Under b-wave blocking conditions, a conditioning flash (black line) was followed by a probing flash (yellow and red lines), which were separated by 500 ms. The yellow triangle and curve mark the probe response in the morning, whereas the red triangle and curve represent the probe response recorded in the evening. Note that also the a-wave response recovery is significantly reduced in the evening. (B2) a-wave recovery as a function of isi. At 300 ms up to 1500 ms isi, a-wave recovery in the morning (yellow bars) is significantly enhanced when compared to corresponding recordings in the evening (red bars). Data are presented as mean ± sem (n = 11 in the morning; n = 5 in the evening) of three independent experiments. t-tests and nonparametric tests were performed by GraphPad Prism version 8. Plots with individual data points were provided in metadata from DRYAD. p = 0.0029 at 500 ms isi; p = 0.0003 at 1000 ms isi; p = 0.0375 at 1500 ms isi. *p<0.05; **p<0.01; ***p≤0.001. (C1) Examples of ERG b-wave recordings from a larva kept under constant darkness (DD). A conditioning flash (black line) was followed by a probing flash (light and dark blue lines), which were separated by 1000 ms. The light blue triangle and curve mark the probe response in the morning, whereas the dark blue triangle and curve represent the probe response recorded in the evening. (C2) b-wave recovery as a function of the isi is shown for larvae raised in continuous darkness (DD). Even under continuous darkness, visual function remains under circadian control as at 500 ms up to 3000 ms isi, and the b-wave recovery in the morning (light blue bars) is significantly enhanced when compared to corresponding recordings in the evening (dark blue bars). Data are presented as mean ± sem (n = 17 in the morning; n = 12 in the evening) of three independent experiments. t-tests and nonparametric tests were performed by GraphPad Prism version 8. p = 0.0007 at 1000 ms isi; p = 0.0016 at 2000 ms isi; p = 0.0004 at 3000 ms isi; p = 0.0006 at 5000 ms isi. *p<0.05; **p<0.01; ***p≤0.001. Metadata can be downloaded from DRYAD.
-
Figure 4—source data 1
Larval cone photoresponse recovery was measured by ERG in different conditions.
- https://cdn.elifesciences.org/articles/68903/elife-68903-fig4-data1-v2.xlsx
Figure 4—figure supplement 1
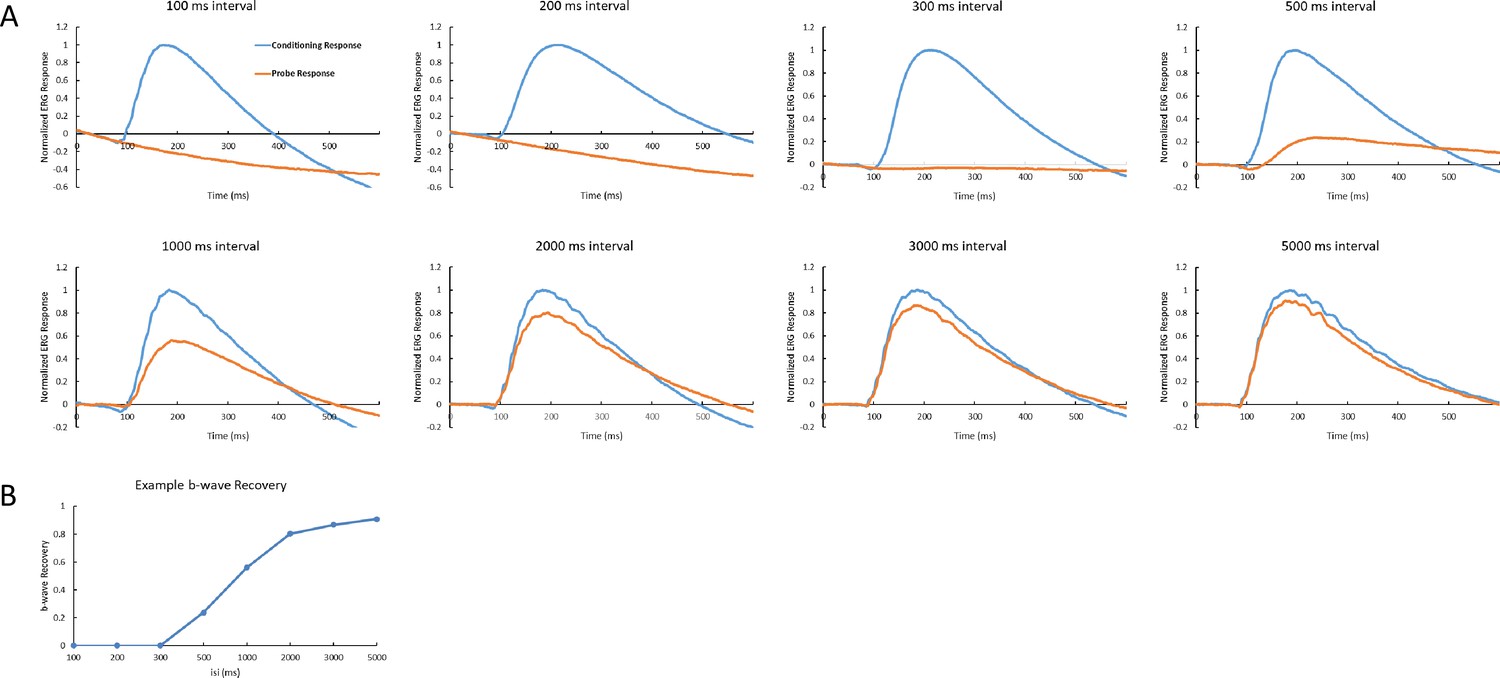
An example of ERG recordings with the protocol used in Figures 4 and 6.
(A) The interval between the conditioning flash and probe flash is indicated in each panel. (B) b-wave recovery is defined as the ratio of probe response amplitude to conditioning response amplitude, which then is plotted against the corresponding interval.
Figure 4—figure supplement 2
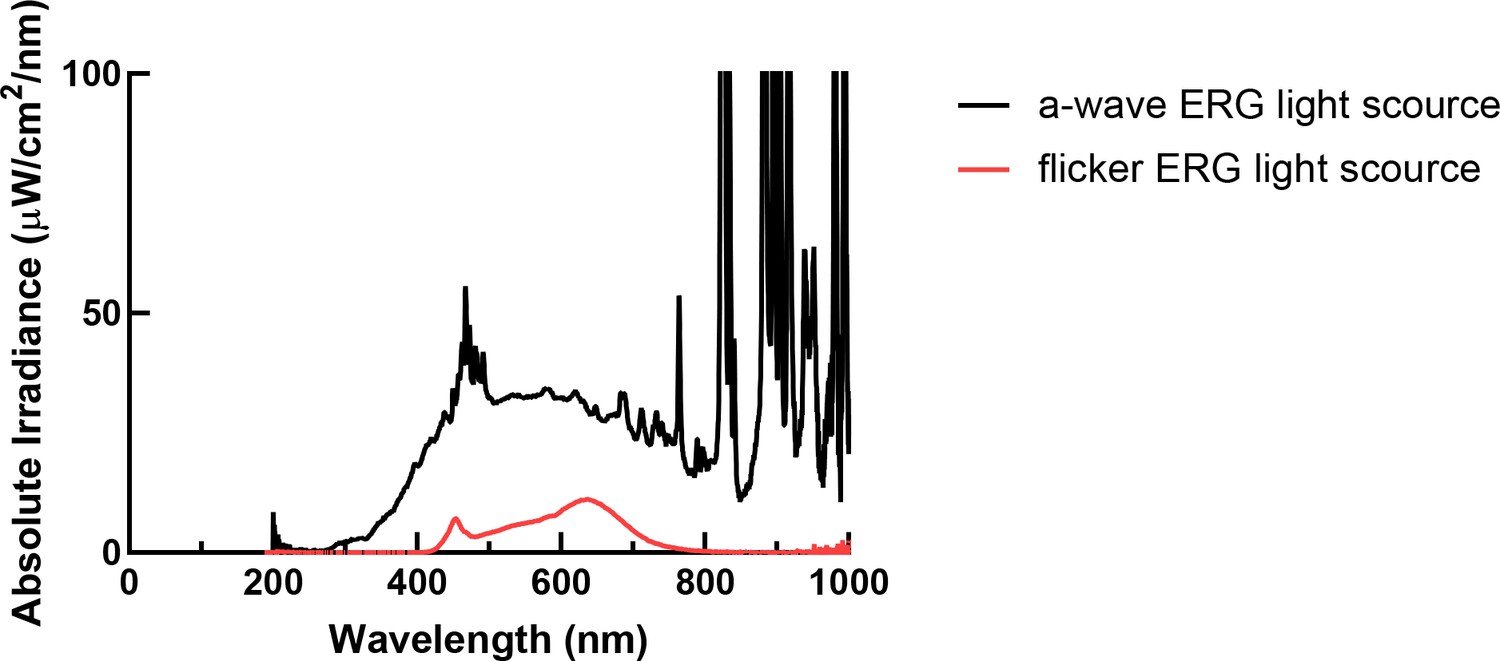
Spectrum of ERG light.
The spectrum of a-wave electroretinogram (ERG) light source is shown in black and flicker ERG light source is shown in red.
Figure 5
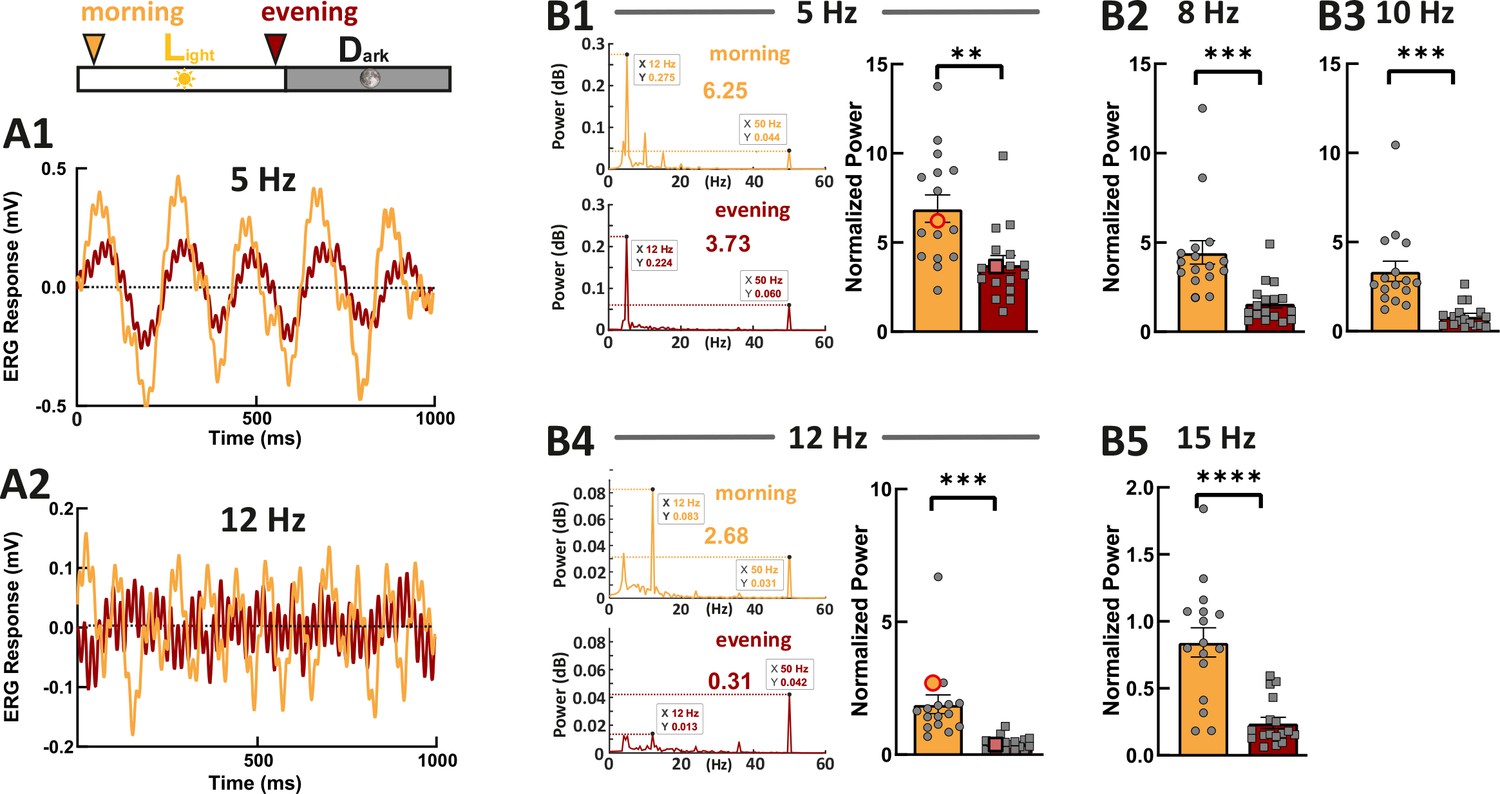
Zebrafish larvae show an increased temporal resolution in the morning.
Examples show the flicker electroretinogram (ERG) responses to 5 Hz stimulus (A1) and to 12 Hz stimulus (A2). Example fast Fourier transform (FFT) power plots generated by MATLAB for responses (A1) and (A2) are shown in (B1) and (B4). These four example power plot results are highlighted in the corresponding summarized normalized power results in (B1) and (B2). The power of given frequency was normalized against the power at 50 Hz (line noise). The rest of the summarized plots of normalized power are shown in B2, B3, and B5. t-tests and nonparametric tests were performed by GraphPad Prism version 8. p = 0.0016 at 5 Hz (B1); p = 0.0005 at 8 Hz (B2); p = 0.0001 at 10 Hz (B3); p = 0.0001 at 12 Hz (B4); p<0.0001 at 15 Hz (B5). **p<0.01; ***p≤0.001; ****p≤0.0001. Metadata can be downloaded from DRYAD.
-
Figure 5—source data 1
Flicker ERG responses were measured.
- https://cdn.elifesciences.org/articles/68903/elife-68903-fig5-data1-v2.zip
Figure 6

Light cycle alterations are reflected in adaptations of cone photoresponse recovery.
(A and C) In situ hybridization images using arr3a, arr3b, and grk7a as probes. Tissues were collected from either reverse light cycle (DL) (A, left panel), normal light cycle (LD) (A, right panel) or light/light cycle (LL) (C) zebrafish larva (5 days post fertilization [dpf]) at the indicated time points. A reversal in the light cycle from LD to DL is reflected in the reversal of the in situ hybridization signal, with low expression levels observed at 9 o’clock (A). The ratio of gene expression levels between evening (ZT13) and morning (ZT1) for fish raised under a normal LD cycle or under LL is shown in (B). In contrast to the observed circadian regulation under LD conditions, under LL conditions, expression levels remain continuously elevated not displaying any circadian fluctuation (B, C). (D) A reversal of the light cycle is reflected in a corresponding reversal of b-wave recovery. The comparison of b-wave recovery of LD and DL larvae recorded at the same time in the morning clearly indicates that immediately before darkness, b-wave recovery rates are reduced. Data are presented as mean ± sem (n = 16 larvae raised in LD; n = 9 larvae raised in DL) of three independent experiments. t-tests and nonparametric tests were performed by GraphPad Prism version 8. Plots with individual data points were provided in metadata from DRYAD. p = 0.001 at 500 ms interstimulus interval (isi); p = 0.0019 at 1000 ms isi; p = 0.0221 at 2000 ms isi; p = 0.0009 at 3000 ms isi; p = 0.0022 at 5000 ms isi. *p<0.05; **p<0.01; ***p≤0.001. (E) No changes in b-wave recovery between morning and evening can be observed under constant light conditions (LL). Data are presented as mean ± sem (n = 15 in the morning; n = 12 in the evening) of three independent experiments. t-tests and nonparametric tests were performed by GraphPad Prism version 8. p = 0.0107 at 500 ms isi; *p<0.05. Metadata can be downloaded from DRYAD.
-
Figure 6—source data 1
Larval cone photoresponse recovery was measured by ERG in different conditions.
- https://cdn.elifesciences.org/articles/68903/elife-68903-fig6-data1-v2.xlsx
Figure 7 with 2 supplements
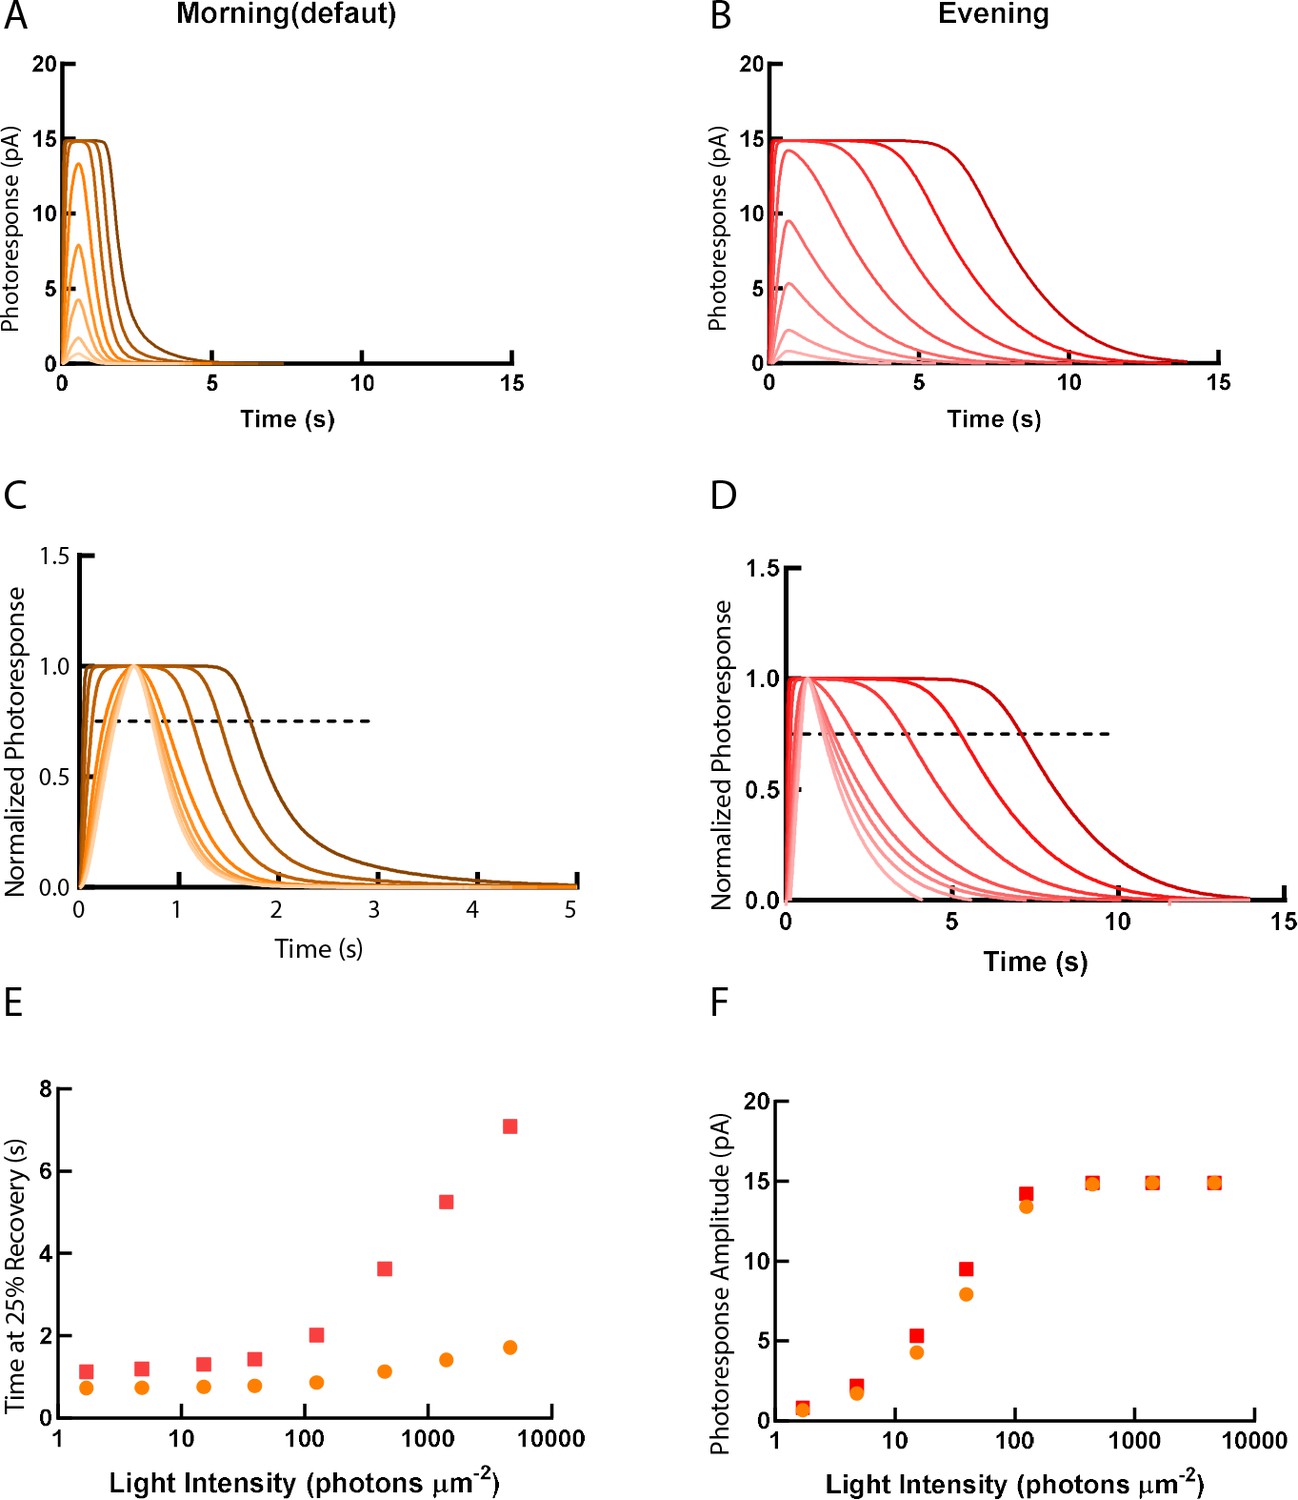
Simulations of single-cone photoresponse in the morning (default) and in the evening.
Simulations of single cone photoresponse in the morning (default) (A) and in the evening (B). 500 ms flash stimuli were delivered at time = 0 s. The flash intensities are 1.7, 4.8, 15.2, 39.4, 125, 444, 1406 and 4630 photons µm-2 (Invergo et al., 2014). (C) & (D) depict response curves normalized to the amplitudes at each light intensity. The dotted line represents 25% recovery of the photoresponse. Response duration for 25% recovery (E) and photoresponse amplitude (F) are plotted as a function of logarithmically increasing stimulus intensities.
-
Figure 7—source data 1
Single-cone photoresponse was predicted by a computational model.
- https://cdn.elifesciences.org/articles/68903/elife-68903-fig7-data1-v2.zip
Figure 7—figure supplement 1
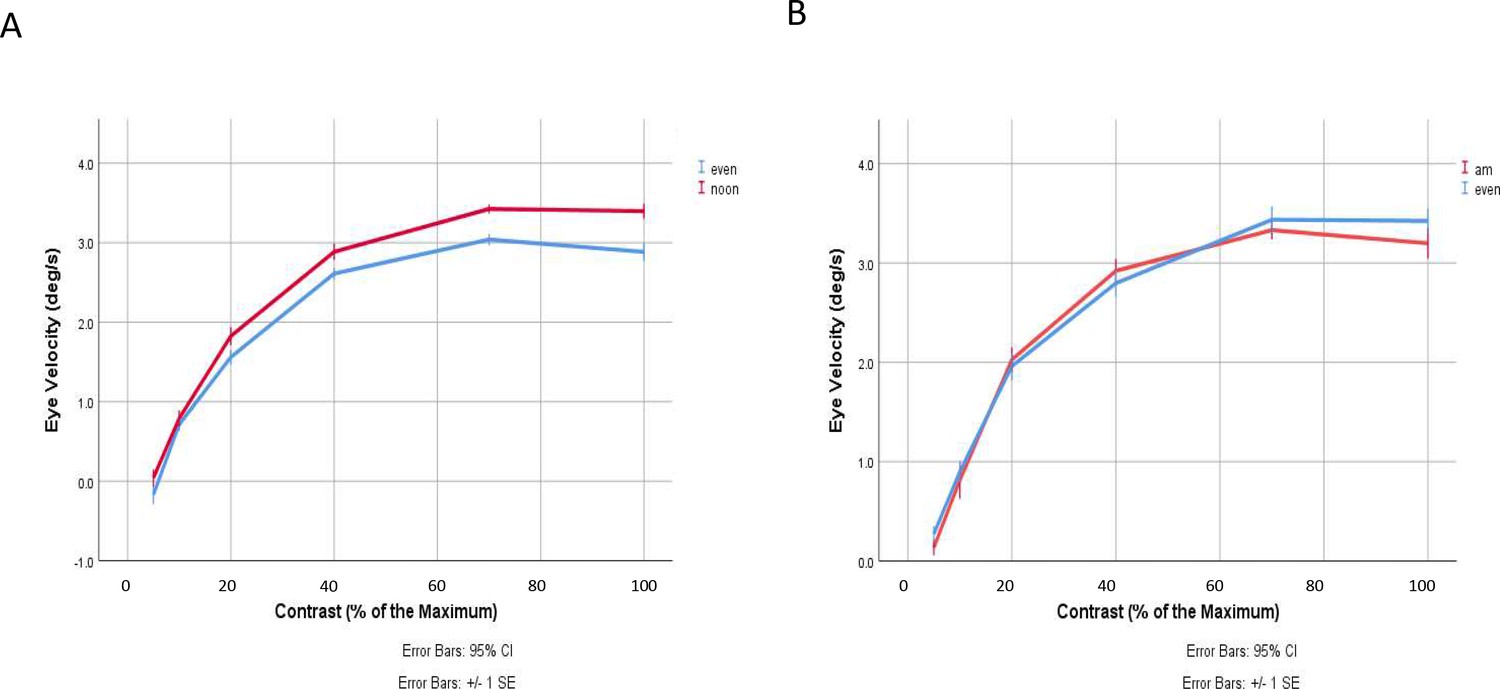
OKR measurements indicate increased contrast sensitivity at noon compared to evening but similar contrast sensitivity between morning and evening.
(A) Eye velocity as a function of stimuli contrast recorded at noon and in the evening (repeated measures analysis of variance [ANOVA] by SPSS [IBM, version 26.0]; p = 0.001). ‘Noon’ denotes recording time around ZT5, n = 14. ‘Evening’ denotes recording time around ZT13, n = 21. Data are presented as mean ± standard deviation (SD) of three independent experiments. (B) Eye velocity as a function of stimuli contrast recorded in the morning and in the evening (repeated measures ANOVA by SPSS [IBM, version 26.0]; p = 0.671). ‘am’ denotes recording time around ZT1, n = 12. ‘Evening’ denotes recording time around ZT13, n = 10. Data are presented as mean ± SD of three independent experiments.
Figure 7—figure supplement 2

Visual behavior shows differences between morning and evening.
Background movement and movement induced to sudden changes in illumination were recorded in the morning (yellow curve) and evening (red curve). Data are shown as an average of traces for fish recorded in the morning (n = 190; yellow curve) and recorded in the evening (n = 187; red curve) during a 15 min period. Visual motor response (VMR) around the time of illumination changes (black dotted boxes) is enlarged. Baseline activity was quantified as the average movement in 60 s before the induced light change (light yellow and light red bars). Student’s t-test was used to compare the response in the morning and in the evening. Before the light on and light off, both the baseline activities were significantly higher in the morning than in the evening; p<0.001. The amplitude of the VMR to light on and light off is given by the dark yellow and dark red bars. While the light-on response from fish recorded in the morning and evening had a comparable amplitude, p = 0.02, the amplitude of the light-off response in fish recorded in the evening was significantly reduced, p<0.001. ‘Morning’ denotes recording time around ZT1. ‘Evening’ denotes recording time around ZT13.
Tables
Table 1
Sequences of primers used for qRT-PCR.
| rcv1a S TGAGAACACGCCAGAAAAGC as CATTCAGGGTGTCATGGAGAAC |
|---|
| rcv1b s GCCTTCGCACTCTATGATGTG as CTCGTCGTCAGGAAGGTTTTTC |
| rcv2a s CTTGGTCCTCTTTGGGAATCAG as AGTGGGCCTTCTCACTCTTC |
| rcv2b s TGATGTGGACAAGAACGGTTAC as GGGAAGACTTGTCTGCTTGTC |
| arr3a s GCCATCCCTTCACTTTCAATA as GCTTTTCCTTTGTCGTCTGG |
| arr3b s ACTCCCCCTTGTTCTGATGTC as TTGCTCCTCACTGGCTGTAG |
| grk7a s TGAACGTCTTGGCTGCAA as CCCAGGGTGGATCGATTAG |
| grk7b s ACATTGAGGACCGCCTTG as CCCATGGAGGTGGAATGA |
| rgs9a s CAACATTATAGGCCACGGATGAC as GATCCCTTCACACCAGTTGATG |
| ef1 s CTGGAGGCCAGCTCAAACAT as ATCAAGAAGAGTAGTACCGCTAGCATTAC (Lin et al., 2009) |
| actb2 s CCAGCTGTCTTCCCATCCA as TCACCACGTAGCTGTCTTTCTG (Lin et al., 2009) |
| rpl13 s TCTGGAGGACTGTAAGAGGTATGC as AGACGCACAATCTTGAGAGCAG (Lin et al., 2009) |
Table 2
Mouse primer sequences.
| Arrb1 S GCTCTGTGCGGTTACTGATCC as TGTCGGTGTTGTTGGTCACG |
|---|
| Arrb3 s GCTAACCTGCCCTGTTCAGT as GCTAACCTGCCCTGTTCAGT |
| Grk1 s TGAAGGCGACTGGCAAGATG as AGGTCCGTCTTGGTCTCGAA |
| Rgs9 s TTCGCTCCCATTCGTGTTGT as ATGTCCTTCACCAGGGCTTC |
| Recvrn1 s AGTGGGCCTTCTCGCTCTA as ATCATCTGGGAGGAGTTTCACA |
| Actb s CAACGGCTCCGGCATGTGC as CTCTTGCTCTGGGCCTCG |
Table 3
Primer sequences for in situ probe preparation.
| rcv1a s GGACCAGAGTACAATTTAAG as GAAGCTCTAATCAGTCATAG (Zang et al., 2015) |
|---|
| rcv1b s CAGACCAGCACCACATAC as TCTTGCACTTTCTGTGGTT (Zang et al., 2015) |
| rcv2a s CAACATCTTTCTGAGCCC as ATAGCGTCTTCATTCTCC (Zang et al., 2015) |
| rcv2b s CACTCAGACAGAAGTCAT as GTAGACCATCATCGCTTG (Zang et al., 2015) |
| grk7a s GCATCTTCTAGTCTGATAGCAC as ACAGCTTCAATCATGTTAGTGA (Rinner et al., 2005) |
| grk7b s CCCAGAGCGTCATATAGTG as AGTCACAGGAATAAGCTATGAA (Rinner et al., 2005) |
| rgs9a s TTCCGGAATACAAAATGACAA as GCCTCGTGGGTCATTGAG |
| rgs9b s GAAGCGAATATGACCATAAGG as ATCAGCCCTTCCTCGTTG |
| arr3a s ATGGCTGACAAAGTTTACAAG as GCCCTGTGGAATCTGATATG (Renninger et al., 2011) |
| arr3b s CATGACAAAGGTTTACAAGAAG as TGCTCCTCACTGGCTGTAG (Renninger et al., 2011) |
| arrSa s CAATGAGTCCAAAAAATGTCG as TAACCGAGAAGTGCTCTTTC (Renninger et al., 2011) |
| arrSb s ATGAGTCCCAAGCACATCATC as CAGCCAGCTCAAAACACG (Renninger et al., 2011) |
Appendix 1—key resources table
| Reagent type (species) or resource | Designation | Source or reference | Identifiers | Additional information |
|---|---|---|---|---|
| gene (Danio rerio) | arr3a | GenBank | BC076177 | |
| gene (Danio rerio) | arr3b | GenBank | BC059650 | |
| gene (Danio rerio) | grk7a | GenBank | BC163587 | |
| gene (Danio rerio) | grk7b | GenBank | AY900005 | |
| gene (Danio rerio) | rcv1a | GenBank | KT325590 | |
| gene (Danio rerio) | rcv1b | GenBank | KT325591 | |
| gene (Danio rerio) | rcv2a | GenBank | KT325592 | |
| gene (Danio rerio) | rcv2b | GenBank | KT325593 | |
| gene (Danio rerio) | rgs9a | GenBank | CABZ01019467 | |
| gene (Danio rerio) | actb2 | GenBank | AL929031 | |
| gene (Danio rerio) | ef1 | GenBank | L47669 | |
| gene (Danio rerio) | rpl13 | GenBank | AF385081 | |
| gene (Mus musculus) | Arrb1 | GenBank | AC102630 | |
| gene (Mus musculus) | Arrb3 | GenBank | AL671299 | |
| gene (Mus musculus) | Grk1 | GenBank | AC130818 | |
| gene (Mus musculus) | Rgs9 | GenBank | AK138159 | |
| gene (Mus musculus) | Recvrn | GenBank | CK617354 | |
| gene (Mus musculus) | Actb | GenBank | AC144818 | |
| sequence-based reagent | rcv1a s | This paper | qRT-PCR primers | TGAGAACACGCCAGAAAAGC |
| sequence-based reagent | rcv1a as | This paper | qRT-PCR primers | CATTCAGGGTGTCATGGAGAAC |
| sequence-based reagent | rcv1b s | This paper | qRT-PCR primers | GCCTTCGCACTCTATGATGTG |
| sequence-based reagent | rcv1b as | This paper | qRT-PCR primers | CTCGTCGTCAGGAAGGTTTTTC |
| sequence-based reagent | rcv2a s | This paper | qRT-PCR primers | CTTGGTCCTCTTTGGGAATCAG |
| sequence-based reagent | rcv2a as | This paper | qRT-PCR primers | AGTGGGCCTTCTCACTCTTC |
| sequence-based reagent | rcv2b s | This paper | qRT-PCR primers | TGATGTGGACAAGAACGGTTAC |
| sequence-based reagent | rcv2b as | This paper | qRT-PCR primers | GGGAAGACTTGTCTGCTTGTC |
| sequence-based reagent | arr3a s | This paper | qRT-PCR primers | GCCATCCCTTCACTTTCAATA |
| sequence-based reagent | arr3a as | This paper | qRT-PCR primers | GCTTTTCCTTTGTCGTCTGG |
| sequence-based reagent | arr3b s | This paper | qRT-PCR primers | ACTCCCCCTTGTTCTGATGTC |
| sequence-based reagent | arr3b as | This paper | qRT-PCR primers | TTGCTCCTCACTGGCTGTAG |
| sequence-based reagent | grk7a s | This paper | qRT-PCR primers | TGAACGTCTTGGCTGCAA |
| sequence-based reagent | grk7a as | This paper | qRT-PCR primers | CCCAGGGTGGATCGATTAG |
| sequence-based reagent | grk7b s | This paper | qRT-PCR primers | ACATTGAGGACCGCCTTG |
| sequence-based reagent | rg9a as | This paper | qRT-PCR primers | CAACATTATAGGCCACGGATGAC |
| sequence-based reagent | rgs9a as | This paper | qRT-PCR primers | GATCCCTTCACACCAGTTGATG |
| sequence-based reagent | ef1 s | Lin et al., 2009 | qRT-PCR primers | CTGGAGGCCAGCTCAAACAT |
| sequence-based reagent | ef1 as | Lin et al., 2009 | qRT-PCR primers | ATCAAGAAGAGTAGTACCGCTAGCATTAC |
| sequence-based reagent | actb2 s | Lin et al., 2009 | qRT-PCR primers | CCAGCTGTCTTCCCATCCA |
| sequence-based reagent | actb2 as | Lin et al., 2009 | qRT-PCR primers | TCACCACGTAGCTGTCTTTCTG |
| sequence-based reagent | rpl13 s | Lin et al., 2009 | qRT-PCR primers | TCTGGAGGACTGTAAGAGGTATGC |
| sequence-based reagent | rpl13 as | Lin et al., 2009 | qRT-PCR primers | AGACGCACAATCTTGAGAGCAG |
| sequence-based reagent | Arr1 s | This paper | qRT-PCR primers | GCTCTGTGCGGTTACTGATCC |
| sequence-based reagent | Arr1 as | This paper | qRT-PCR primers | TGTCGGTGTTGTTGGTCACG |
| sequence-based reagent | Arr3 s | This paper | qRT-PCR primers | GCTAACCTGCCCTGTTCAGT |
| sequence-based reagent | Arr3 as | This paper | qRT-PCR primers | GCTAACCTGCCCTGTTCAGT |
| sequence-based reagent | Grk1 s | This paper | qRT-PCR primers | TGAAGGCGACTGGCAAGATG |
| sequence-based reagent | Grk1 as | This paper | qRT-PCR primers | AGGTCCGTCTTGGTCTCGAA |
| sequence-based reagent | Rgs9 s | This paper | qRT-PCR primers | TTCGCTCCCATTCGTGTTGT |
| sequence-based reagent | Rgs9 as | This paper | qRT-PCR primers | ATGTCCTTCACCAGGGCTTC |
| sequence-based reagent | Rcv1 s | This paper | qRT-PCR primers | AGTGGGCCTTCTCGCTCTA |
| sequence-based reagent | Rcv1 as | This paper | qRT-PCR primers | ATCATCTGGGAGGAGTTTCACA |
| sequence-based reagent | Actb s | This paper | qRT-PCR primers | CAACGGCTCCGGCATGTGC |
| sequence-based reagent | Actb as | This paper | qRT-PCR primers | CTCTTGCTCTGGGCCTCG |
| chemical compound, drug | DIG RNA Labeling Mix | Roche | SKU11277073910 | |
| chemical compound, drug | 1-Phenyl-2-thiourea (PTU) | Sigma-Aldrich | CAS 103-85-5 | |
| chemical compound, drug | Paraformaldehyde (PFA) | Sigma-Aldrich | CAS 30525-89-4 | |
| chemical compound, drug | cOmplete, Mini, EDTA-free Protease Inhibitor Cocktail | Roche | SKU11836170001 | |
| chemical compound, drug | L-AP4 | Sigma-Aldrich | SKU A7929-.5MG | |
| chemical compound, drug | TBOA | Sigma-Aldrich | ||
| antibody | IRDye 680RD Goat (polyclonal) anti-Mouse IgG | LI-COR | P/N: 926–68070 | (1:1000) |
| antibody | IRDye 800CW Goat (polyclonal) anti-Rabbit IgG | LI-COR | P/N: 926–32211 | (1:1000) |
| antibody | Anti-arr3a (Rabbit polyclonal) | Renninger et al., 2011 | WB (1:250) | |
| antibody | Anti-grk7a (Rabbit polyclonal) | Rinner et al., 2005 | WB (1:500) | |
| antibody | Anti-β-Actin (Mouse monoclonal) | Sigma-Aldrich | A1978 | WB (1:1000) |
| software, algorithm | MATLAB | MATLAB(https://ch.mathworks.com/) | RRID:SCR_001622 | Version R2020b |
| software, algorithm | R | R (https://www.r-project.org/) | RRID:SCR_001905 | Version 4.1.0 |
| software, algorithm | COPASI | COPASI (http://copasi.org/) | RRID:SCR_014260 | |
| software, algorithm | Prism - GraphPad | GraphPad Prism (https://graphpad.com) | RRID:SCR_015807 | Version 8.0.0 |
| software, algorithm | Labview | National Instruments (https://www.ni.com/) | RRID:SCR_014325 | |
| software, algorithm | ImageJ | ImageJ (http://imagej.nih.gov/ij/) | RRID:SCR_003070 |
Additional files
-
Supplementary file 1
Statistical information for Figure 1.
- https://cdn.elifesciences.org/articles/68903/elife-68903-supp1-v2.txt
-
Supplementary file 2
Statistical information for Figure 2.
- https://cdn.elifesciences.org/articles/68903/elife-68903-supp2-v2.txt
-
Supplementary file 3
Statistical information for Figure 3.
- https://cdn.elifesciences.org/articles/68903/elife-68903-supp3-v2.txt
-
Supplementary file 4
Parameters used in phototransduction model.
- https://cdn.elifesciences.org/articles/68903/elife-68903-supp4-v2.txt
-
Transparent reporting form
- https://cdn.elifesciences.org/articles/68903/elife-68903-transrepform1-v2.docx
Download links
A two-part list of links to download the article, or parts of the article, in various formats.
Downloads (link to download the article as PDF)
Open citations (links to open the citations from this article in various online reference manager services)
Cite this article (links to download the citations from this article in formats compatible with various reference manager tools)
Circadian regulation of vertebrate cone photoreceptor function
eLife 10:e68903.
https://doi.org/10.7554/eLife.68903


