Linker histone H1.8 inhibits chromatin binding of condensins and DNA topoisomerase II to tune chromosome length and individualization
- Laboratory of Chromosome and Cell Biology, The Rockefeller University, United States
- Program in Systems Biology, Department of Biochemistry and Molecular Pharmacology, University of Massachusetts Medical School, United States
- Division of Structural Biology, The Institute of Cancer Research, United Kingdom
- Fondazione Human Technopole, Structural Biology Research Centre, 20157, Italy
- Howard Hughes Medical Institute, United States
Figures
Figure 1 with 1 supplement
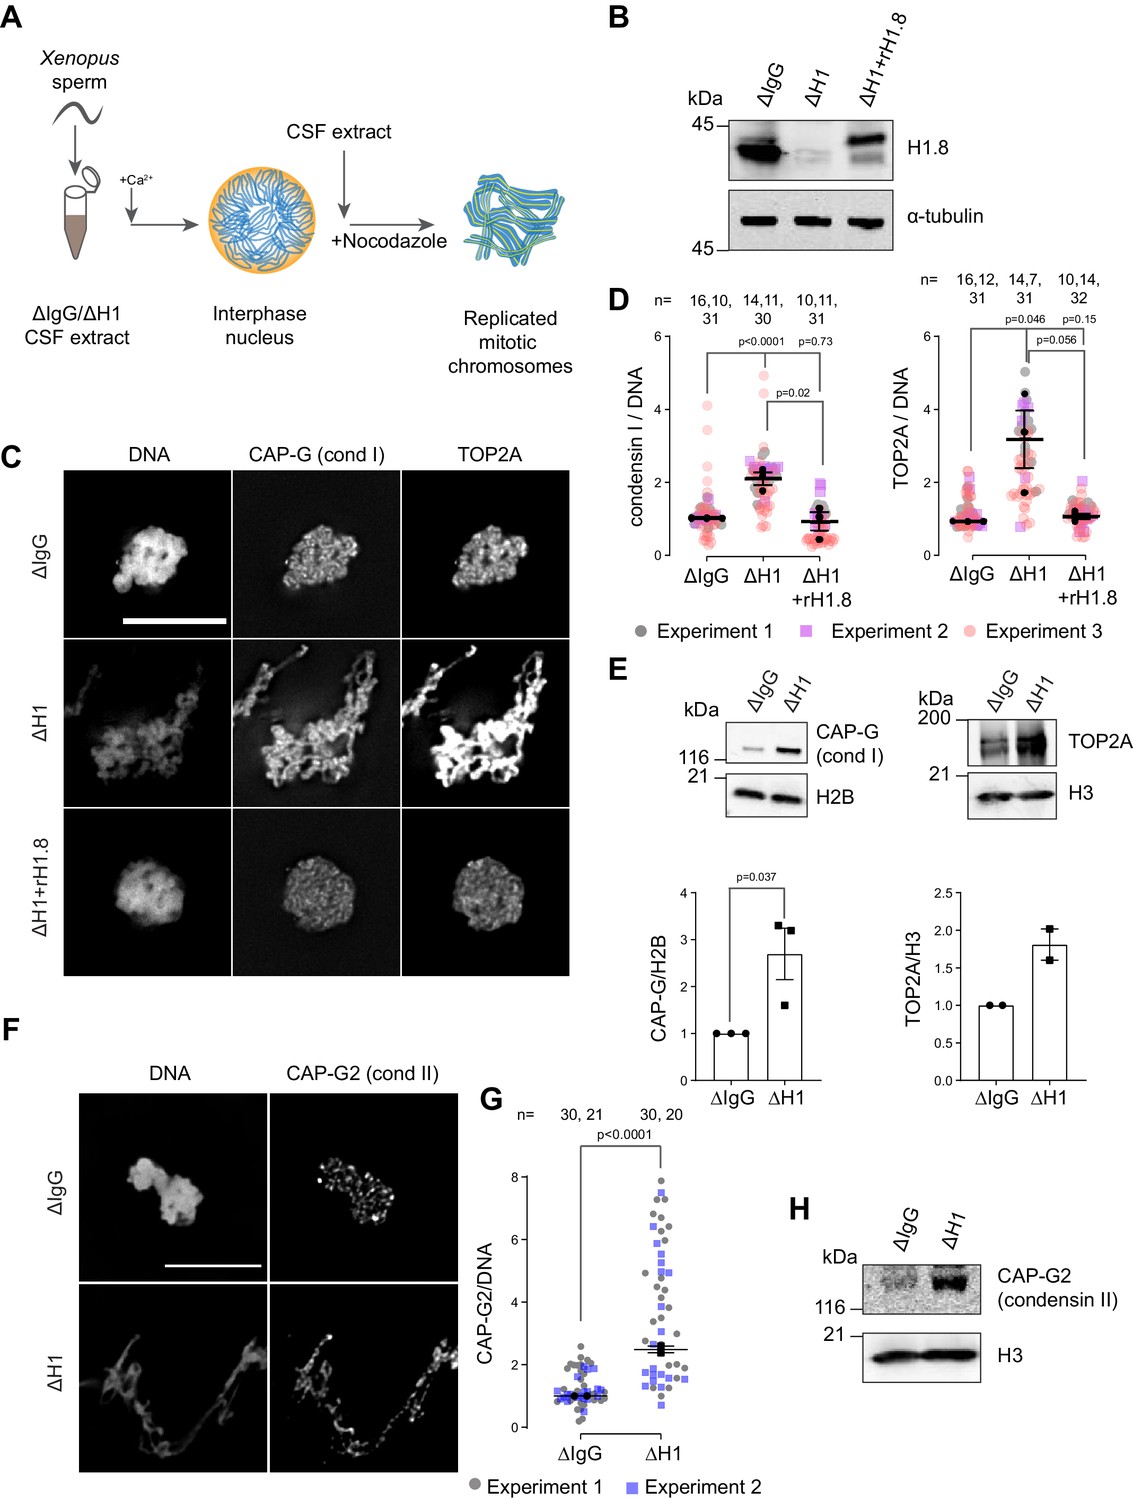
Linker histone H1.8 suppresses enrichment of condensins and TOP2A on mitotic chromatin.
(A) Experimental scheme to generate replicated chromosomes in Xenopus egg extracts. (B) Western blots of total extracts showing depletion of H1.8 from Xenopus egg extracts and rescue with recombinant H1.8 (rH1.8). (C) Representative images of DNA (Hoechst 33342), CAP-G (condensin I), and TOP2A immunofluorescence on chromosomes in metaphase extracts treated with nocodazole in the indicated conditions. Chromosomes in each nucleus remain clustered in the presence of nocodazole. Bar, 10 µm. (D) Quantification of CAP-G (condensin I) and TOP2A immunofluorescence signals normalized to the DNA (Hoechst) signal for the indicated conditions. Each gray or magenta dot represents the average signal intensity of a single chromosome cluster (from one nucleus). Each black dot represents the median signal intensity from a single experiment. Bars represent mean and SEM of the medians of three independent experiments. (E) Western blots of mitotic chromatin purified from mock (∆IgG) and H1.8-depleted (∆H1) extracts (top) and quantification of band intensities normalized to H3 and H2B (below). Mean and SEM/range from three/two experiments respectively. (F) Representative images of CAP-G2 (condensin II) immunofluorescence on chromosomes in metaphase extracts with nocodazole in the indicated conditions. Bar, 10 µm. (G) Quantification of the CAP-G2 (condensin II) normalized to the DNA (Hoechst) signal for the indicated conditions. Each gray or purple dot represents the average signal intensity of a single chromosome cluster (from one nucleus). Each black dot represents the median signal intensity from a single experiment. Bars represent mean and range of the median of two independent experiments. (H) Western blots of mitotic chromatin purified from mock (∆IgG) and H1.8-depleted (∆H1) extracts. The p-values shown in (D) and (E) were calculated by an unpaired Student’s t-test of the aggregate medians of three independent experiments, after confirming the statistical significance for each experimental dataset by a two-tailed Mann–Whitney U-test. The p-values shown in (G) were calculated on total data from two independent experiments using a two-tailed Mann–Whitney U-test. The number of nuclei imaged in (D) and (G) in each condition for each experiment is indicated in the figure.
-
Figure 1—source data 1
Source data for all the figures in Figure 1 and its figure supplement.
- https://cdn.elifesciences.org/articles/68918/elife-68918-fig1-data1-v4.zip
-
Figure 1—source data 2
Mass spectrometry data for chromatin purified from ΔIgG and ΔH1 metaphase sperm chromosomes.
- https://cdn.elifesciences.org/articles/68918/elife-68918-fig1-data2-v4.xlsx
Figure 1—figure supplement 1

H1.8 depletion does not lead to global accumulation of DNA-binding proteins.
(A) Experimental scheme to incorporate Cy3-labeled nucleotides to use normalization of immunofluorescence signals on chromosomes. (B) Quantification of Cy3-dUTP signals normalized to Hoechst 33342 signals, showing uniform normalization across two coverslips used for quantification of condensin I and TOP2A. The result also indicates no detectable defect in DNA replication in ∆H1 extracts. (C) CAP-G (condensin I) and TOP2A immunofluorescence signal levels on chromosomes normalized with Hoechst and incorporated Cy3-dUTP. Normalization using Hoechst 33342 and Cy3-dUTP/Cy5-dUTP signals was shown to be consistent across many experiments. (D) Quantification of immunofluorescence signal levels of two proteins that prefer nucleosomes (RCC1 and Dasra A) and two that prefer to bind nucleosome-free DNA (Dppa2 and Xkid) (Zierhut et al., 2014). In (B–D), distribution of signal intensity per chromosome cluster (dots), and median and SEM from one experiment are shown. This analysis was performed twice, and the similar results were obtained. (E) Protein abundance on metaphase sperm chromosomes purified from mock and H1.8-depleted extracts. Subunits from the structural maintenance of chromosomes (SMC) family complexes are labeled in pink. Core histones and their variants are in blue and linker histone variants are shown in red. The lines for 0.25×, 0.5×, 1, 2×, and 4× abundance on ΔH1 compared to ΔIgG chromosomes are shown. The mass spectrometry analysis was performed once. The number of nuclei imaged in each condition for each experiment in (B–D) is indicated above the figure.
Figure 2 with 4 supplements
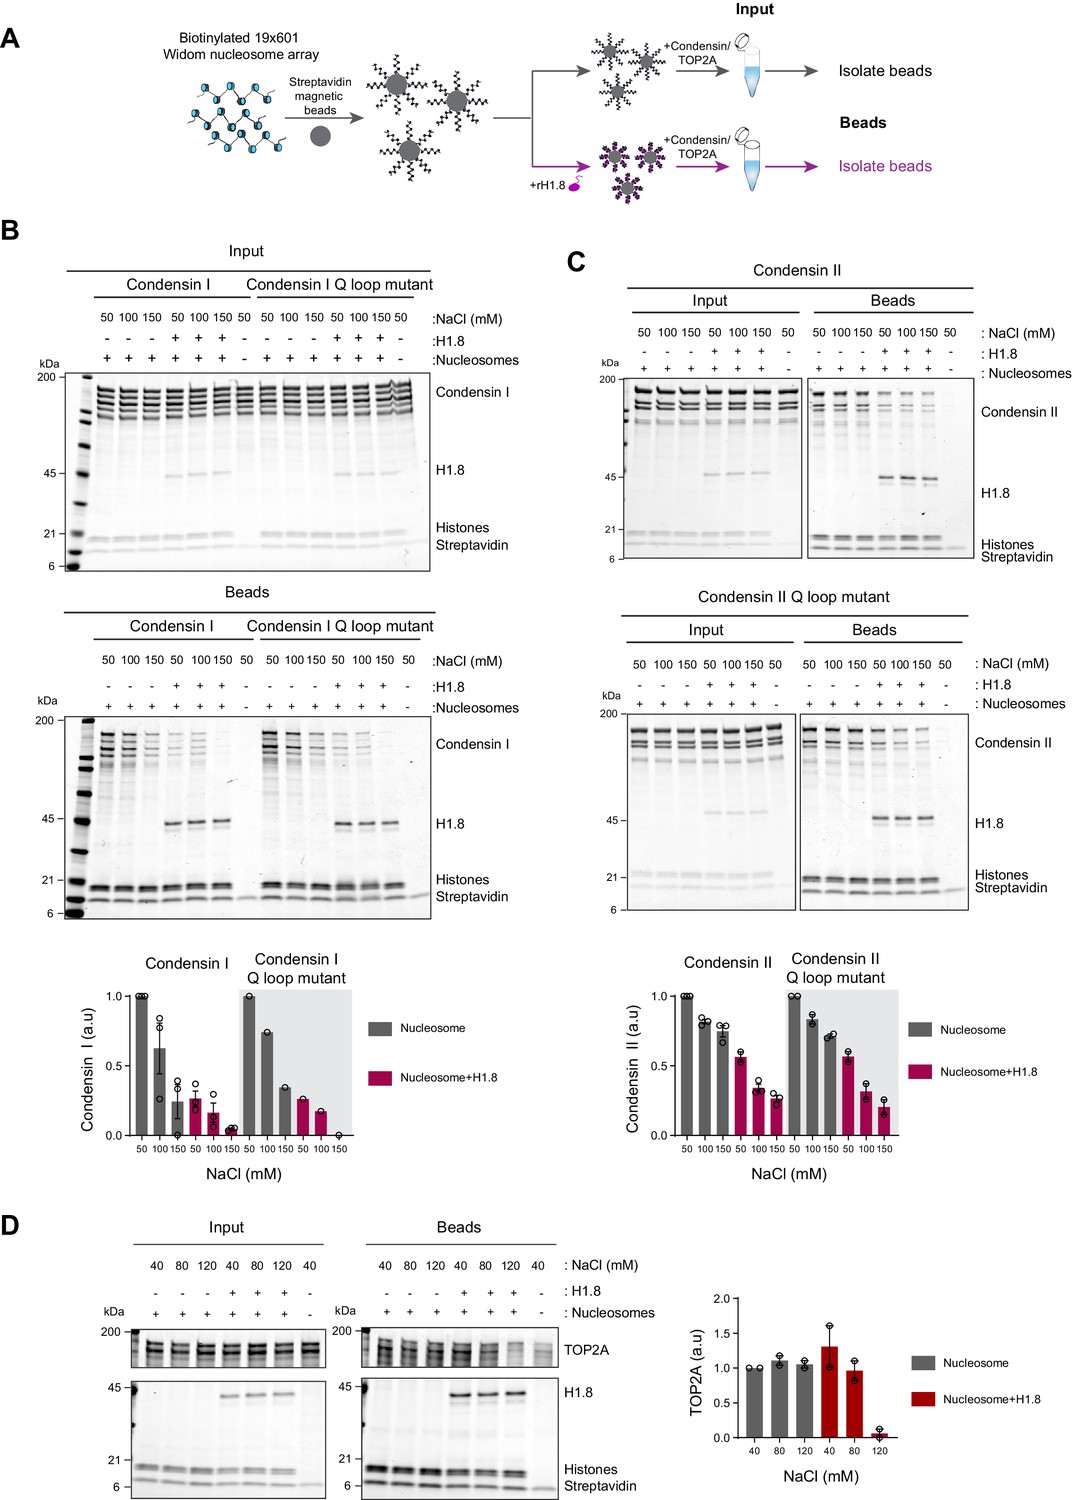
Linker histone inhibits binding of condensins and TOP2A to nucleosome arrays.
(A) Experimental scheme for testing the effect of recombinant H1.8 (rH1.8) on binding of purified condensins and TOP2A to arrays of nucleosomes assembled on the Widom 601 nucleosome positioning sequence. (B) Coomassie staining of SDS-PAGE gels, showing input (top) and nucleosome array-bound fraction (middle) of condensin I, rH1.8, and core histones. The rightmost lanes represent the streptavidin beads-only negative control. Buffer contains 2.5 mM MgCl2, 5 mM ATP, and indicated concentrations of NaCl. The band intensities of condensin I subunits were normalized to the histone bands and the binding at 50 mM NaCl for nucleosome arrays without H1.8. Mean and SEM of three independent experiments are shown (bottom). (C) Same as (B), except that nucleosome array binding of condensin II is shown. Mean and SEM (wildtype)/range (Q-loop mutant) of three (wildtype) or two (Q-loop mutant) independent experiments are shown. (D) Same as (B), except that nucleosome array binding of TOP2A in buffer containing 1 mM MgCl2 is shown. Mean and range of two independent experiments are shown.
-
Figure 2—source data 1
Source data for all the figures in Figure 2 and its figure supplements.
- https://cdn.elifesciences.org/articles/68918/elife-68918-fig2-data1-v4.zip
Figure 2—figure supplement 1
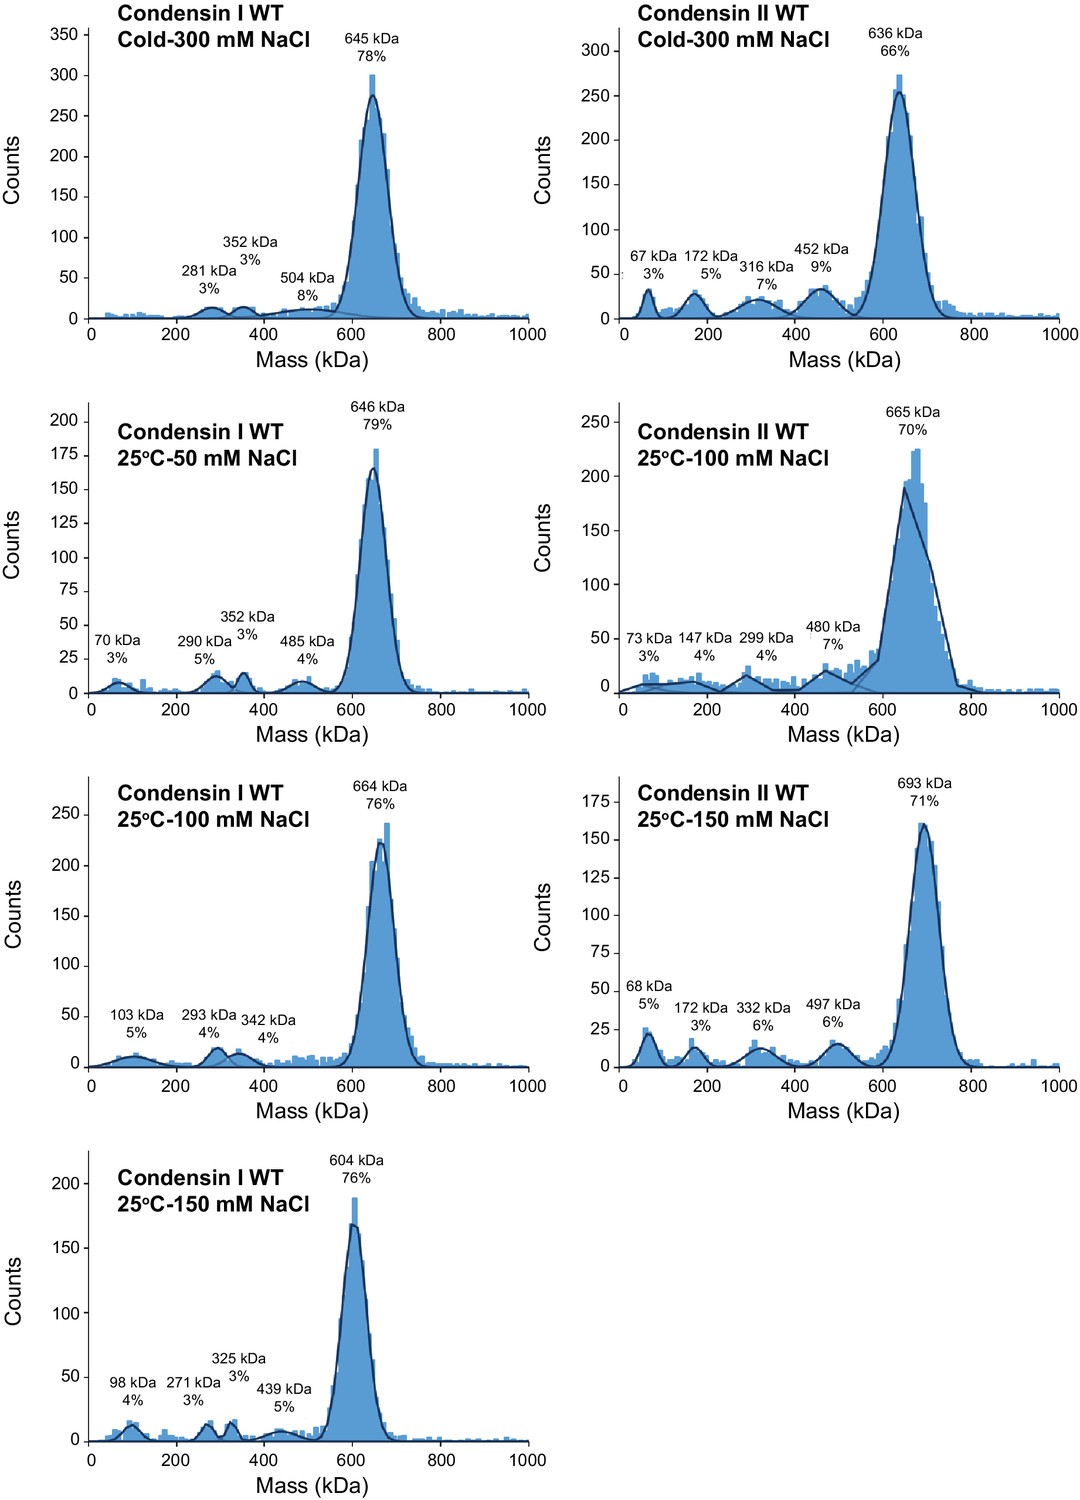
Mass photometry of condensin complexes.
Recombinant condensin complexes were diluted to 50 nM in buffer (10 mM HEPES pH 8, 2.5 mM MgCl2, 1 mM DTT, 5 mM ATP) supplemented with the indicated sodium chloride concentration and the indicated temperatures for 30 min subjected to mass photometry to determine whether the complexes remain intact in the buffer conditions used for the binding assays. Histograms of the particle count at the indicated molecular mass. The molecular mass was calibrated using bovine serum albumin and urease. The black lines are the Gaussian fits to the peaks. The peak of the Gaussian fit and the percentage of particles in the peak are indicated above each peak. Theoretical molecular weights of condensin I and condensin II complexes are 638 kDa and 658 kDa, respectively.
Figure 2—figure supplement 2
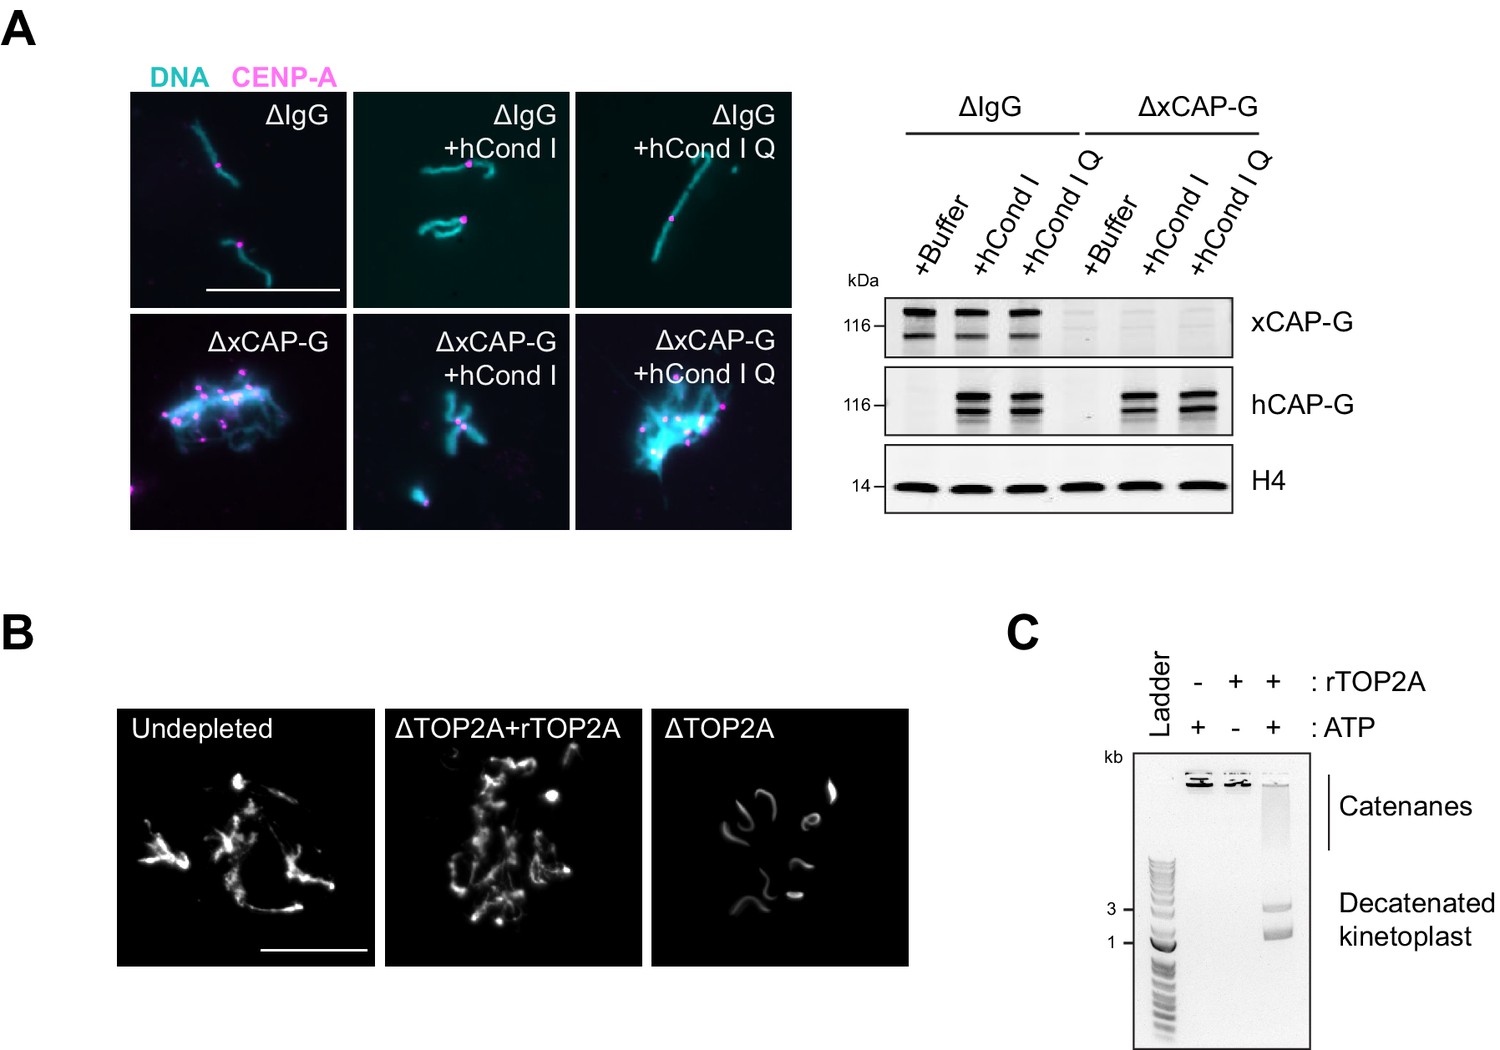
Recombinant human condensin I and X. laevis TOP2A are functional.
(A) Representative Hoechst (DNA) and CENP-A immunofluorescence images of chromosomes in indicated metaphase egg extracts after dilution, which disperses individualized chromosomes (left). Extracts depleted of condensin I (ΔCAP-G) were complemented with recombinant human condensin I and condensin I Q-loop mutant protein complexes. Total egg extract western blots of depletion and the rescue conditions (right). (B) Recombinant X. laevis TOP2A is functional in Xenopus egg extracts. Sperm nuclei were added to undepleted, TOP2A-depelted CSF extracts (∆TOP2A), or ∆TOP2A extracts with purified recombinant TOP2A. Representative Hoechst (DNA) images of sperm are shown. In undepleted or ∆TOP2A extracts with supplemented TOP2A, proper sperm remodeling led to mitotic chromosomes formation. In ∆TOP2A extracts, sperm remodeling failed and sperm nuclei remained compact crescent-like shape. (C) Recombinant X. laevis TOP2A possesses decatenating activity in vitro. Agarose gel of kinetoplast decatenation assay. Recombinant TOP2A promoted ATP-dependent decatenation of kinetoplast DNA. Bar, 20 µm.
Figure 2—figure supplement 3
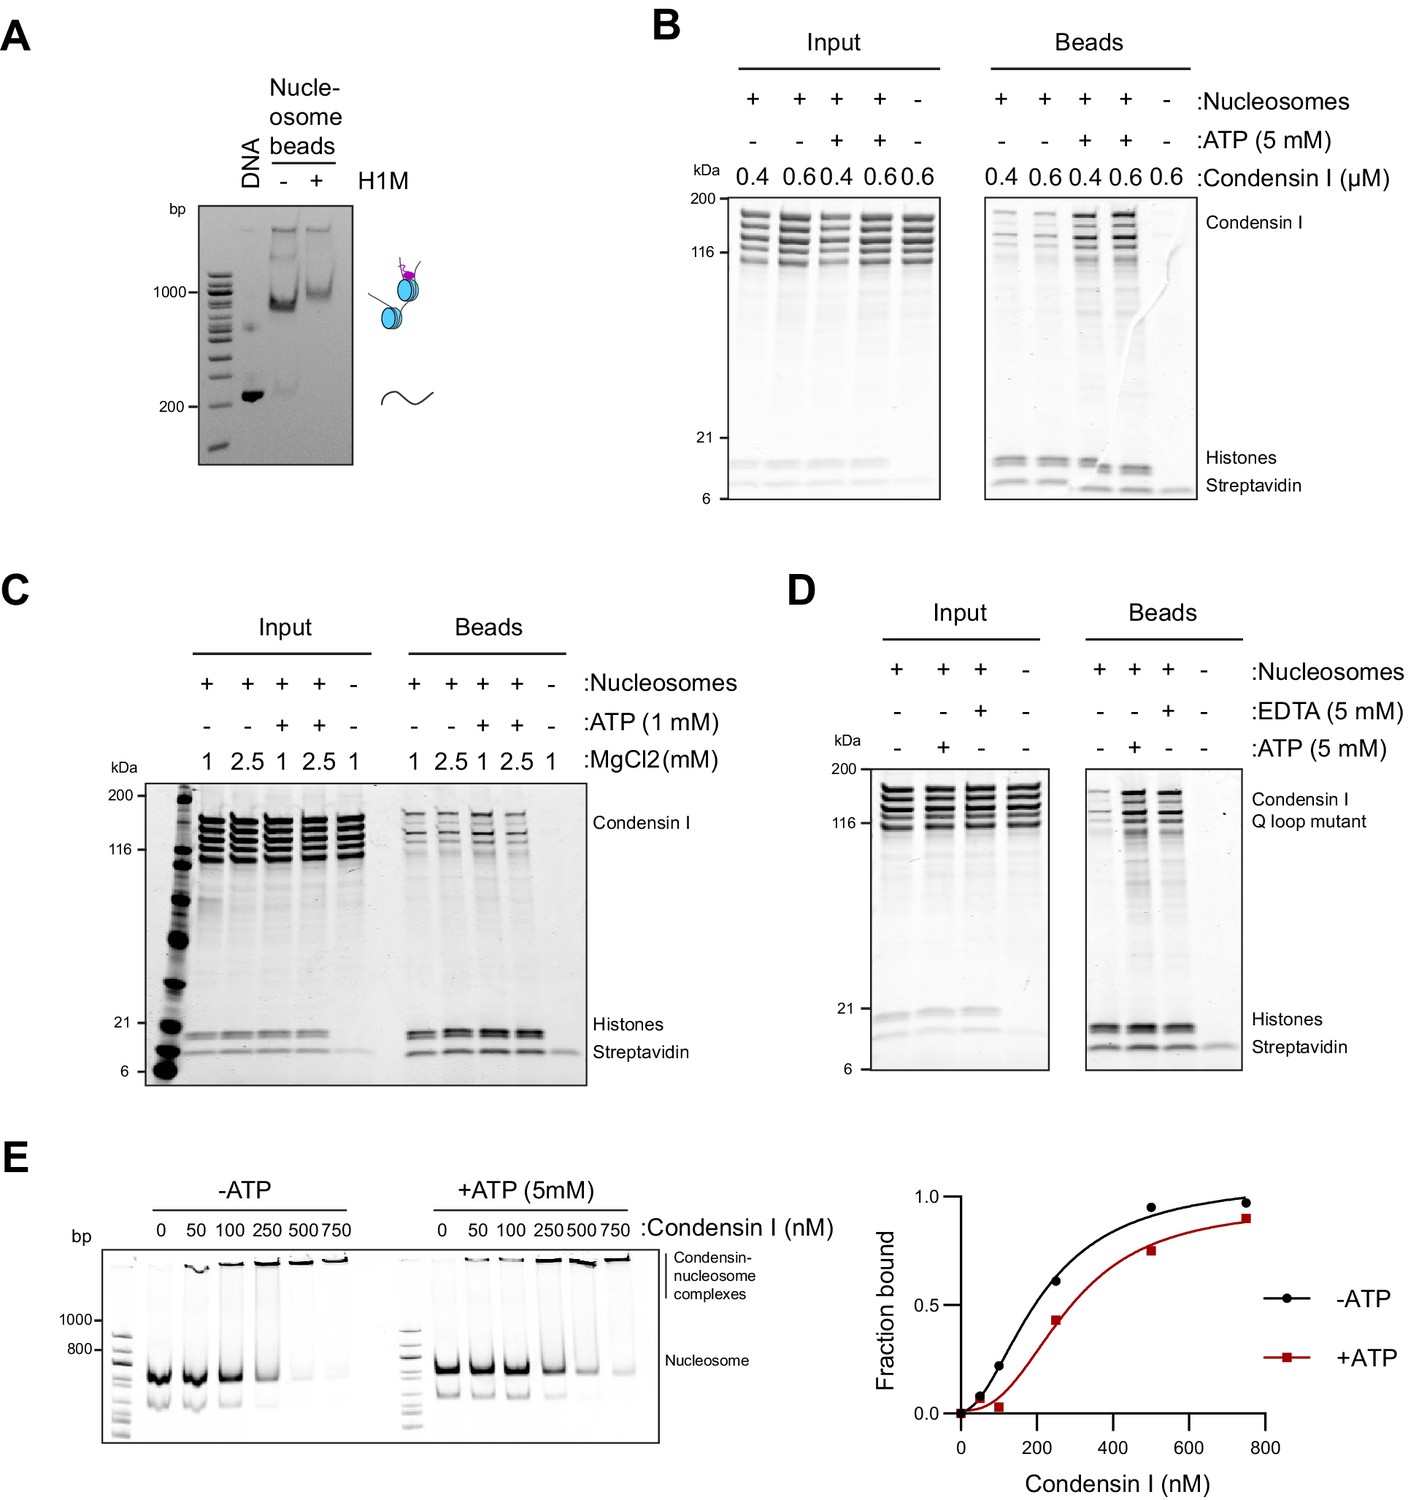
Condensin binding is inhibited by magnesium.
(A) Native PAGE gel analysis of nucleosome array beads loaded with or without H1.8 after digestion of the array with AvaI, which released monomers of nucleosome positioning sequence. A complete shift of monomer bands by H1.8 addition indicates the saturated occupancy of nucleosome and H1.8. (B) Purified recombinant human condensin I was incubated with nucleosome array beads in buffer containing 2.5 mM MgCl2 with and without 5 mM ATP. Coomassie staining of input and bead fractions is shown. (C) Purified human condensin I was incubated with nucleosome array beads in buffer containing 1 or 2.5 mM MgCl2 with and without 1 mM ATP. Coomassie staining of input and bead fractions is shown. (D) Purified human condensin I Q-loop mutant was incubated with nucleosome array beads in buffer containing 2.5 mM MgCl2 with the addition of 5 mM ATP or 5 mM EDTA. Coomassie staining of input and bead fractions is shown. (E) Alexa647-labeled 196 bp mononucleosomes were incubated with indicated concentrations of condensin I in the presence of 2.5 mM MgCl2 and with or without 5 mM ATP and electrophoresed on a 5% native PAGE (above). Bands at the well represent the nucleosome-condensin complex. Absence of signals at the well in the absence of condensin I indicates that mononucleosomes do not form large aggregates in the tested experimental conditions. Quantification of the condensin-bound fraction of the nucleosomes showing no increase in binding affinity due to ATP (Figure 2—source data 1).
Figure 2—figure supplement 4
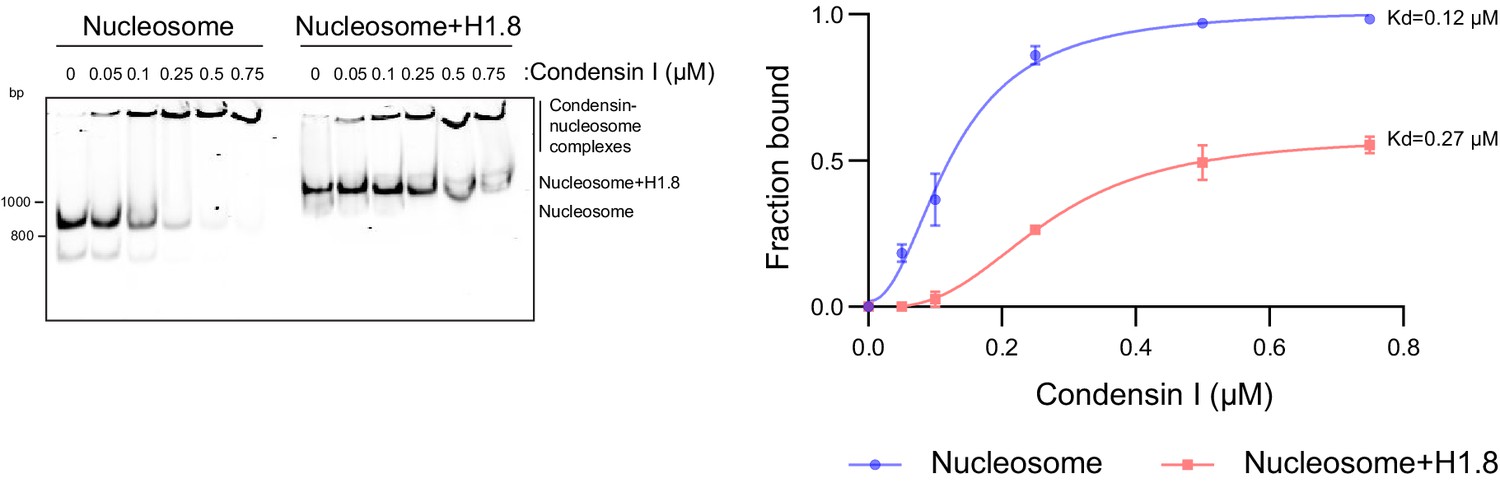
H1.8 inhibits condensin binding to mononucleosomes.
Alexa647-labeled 196 bp mononucleosomes with or without H1.8 were incubated with indicated concentrations of condensin I and electrophoresed on a 5% native PAGE. Alexa647-labeled DNAs are shown. Condensin I binding curves with mononucleosomes with and without H1.8, showing the large increase in binding constant in the presence of H1.8. The data plotted is the mean and SEM of three independent experiments The binding constants derived from fitting the aggregate data to a sigmoidal binding curve are shown (Figure 2—source data 1).
Figure 3 with 2 supplements
Chromosome elongation by H1.8 depletion is due to enhanced condensin I loading on chromatin.
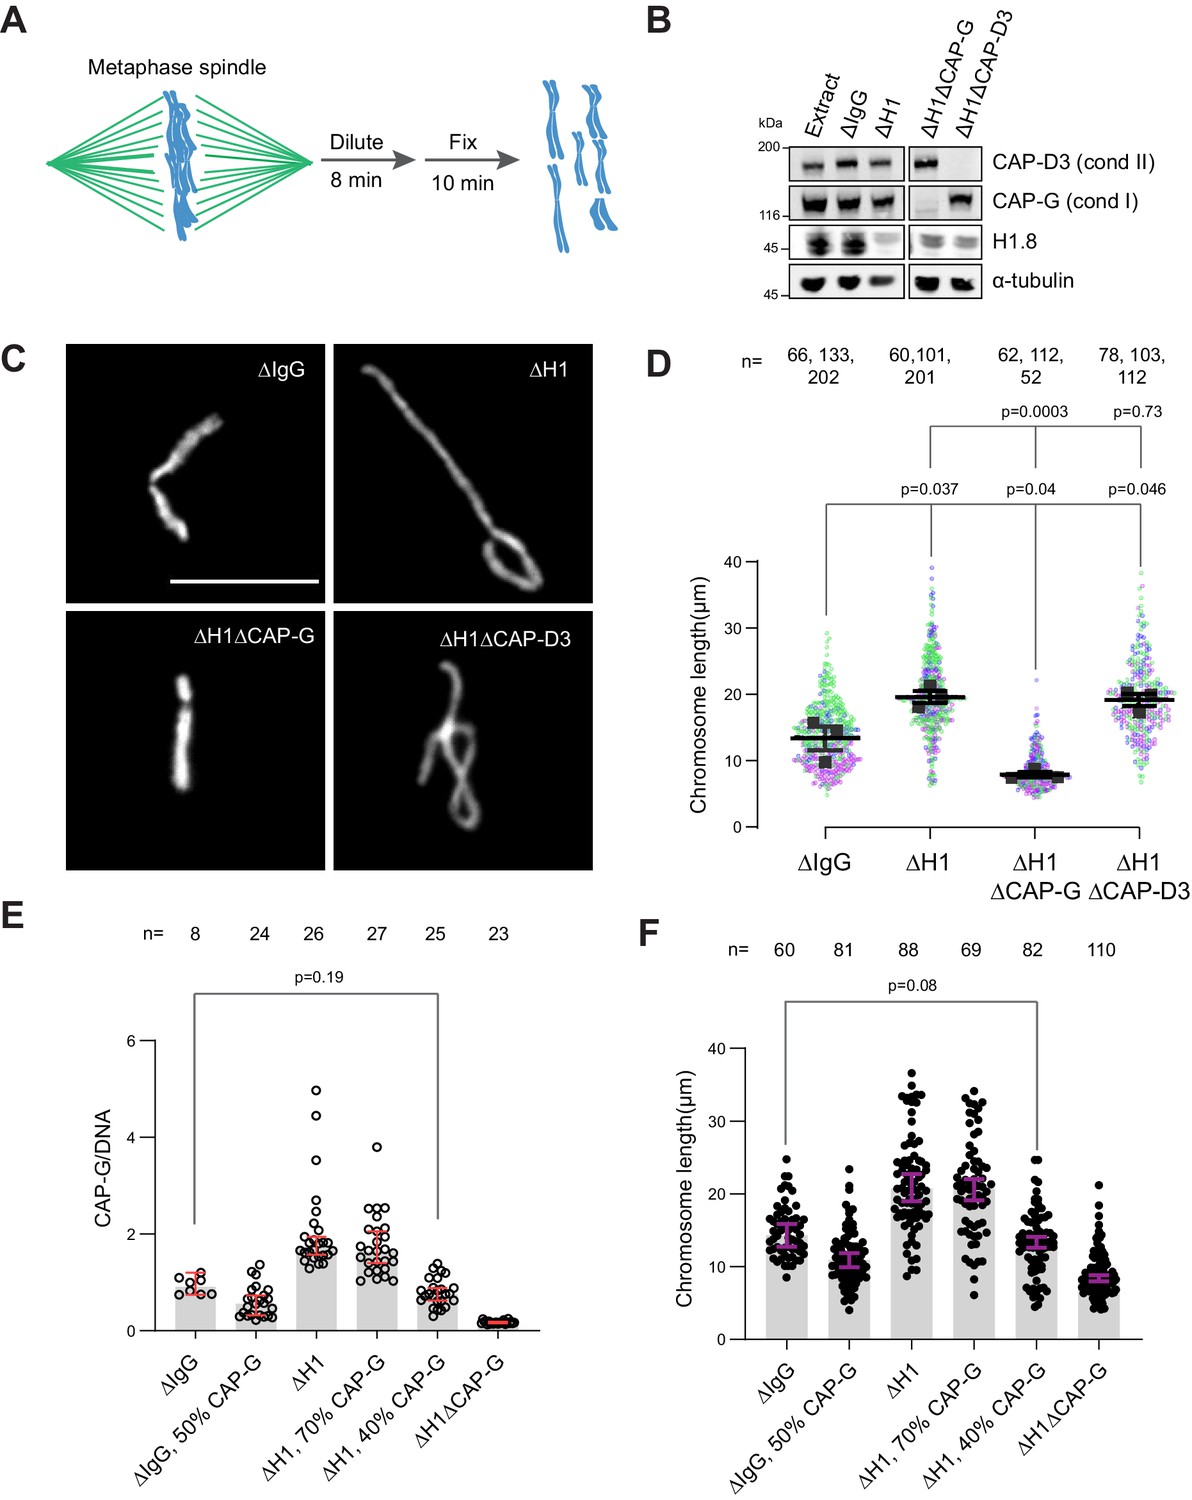
(A) Schematic of extract dilution to disperse individualized chromosomes. (B) Western blots of total egg extracts showing depletions of indicated proteins. (C) Representative images of mitotic chromosomes after dilution of indicated extracts. Bar, 10 μm. (D) Quantification of the chromosome length. Data distribution of the length of individual chromosomes from three independent experiments (green, purple, gray) is shown. Each black dot represents the median length of chromosomes from a single experiment. Bar represents mean and SEM of three independent experiments. (E) Quantification of CAP-G levels normalized to DNA signal (Cy3-dUTP) in the indicated conditions by immunofluorescence. Each dot represents the mean of CAP-G intensity normalized to DNA intensity of a single chromosome cluster (from one nucleus). The data plotted is median ± 95% CI. (F) Chromosome lengths in the indicated condition. Each dot represents length of a single chromosome. Bars represent median ± 95% CI. The p-values in (D) compare the median chromosome lengths in each condition and were calculated using an unpaired Student’s t-test, and those in (E, F) compare the median values in a single experiment and were calculated using a two-tailed Mann–Whitney U-test. The number of nuclei (E) or chromosomes (D, F) imaged in each condition for each experiment is indicated above the figure.
-
Figure 3—source data 1
Source data for all the figures in Figure 3 and its figure supplements.
- https://cdn.elifesciences.org/articles/68918/elife-68918-fig3-data1-v4.zip
Figure 3—figure supplement 1
Condensin I loading determines chromosome length.
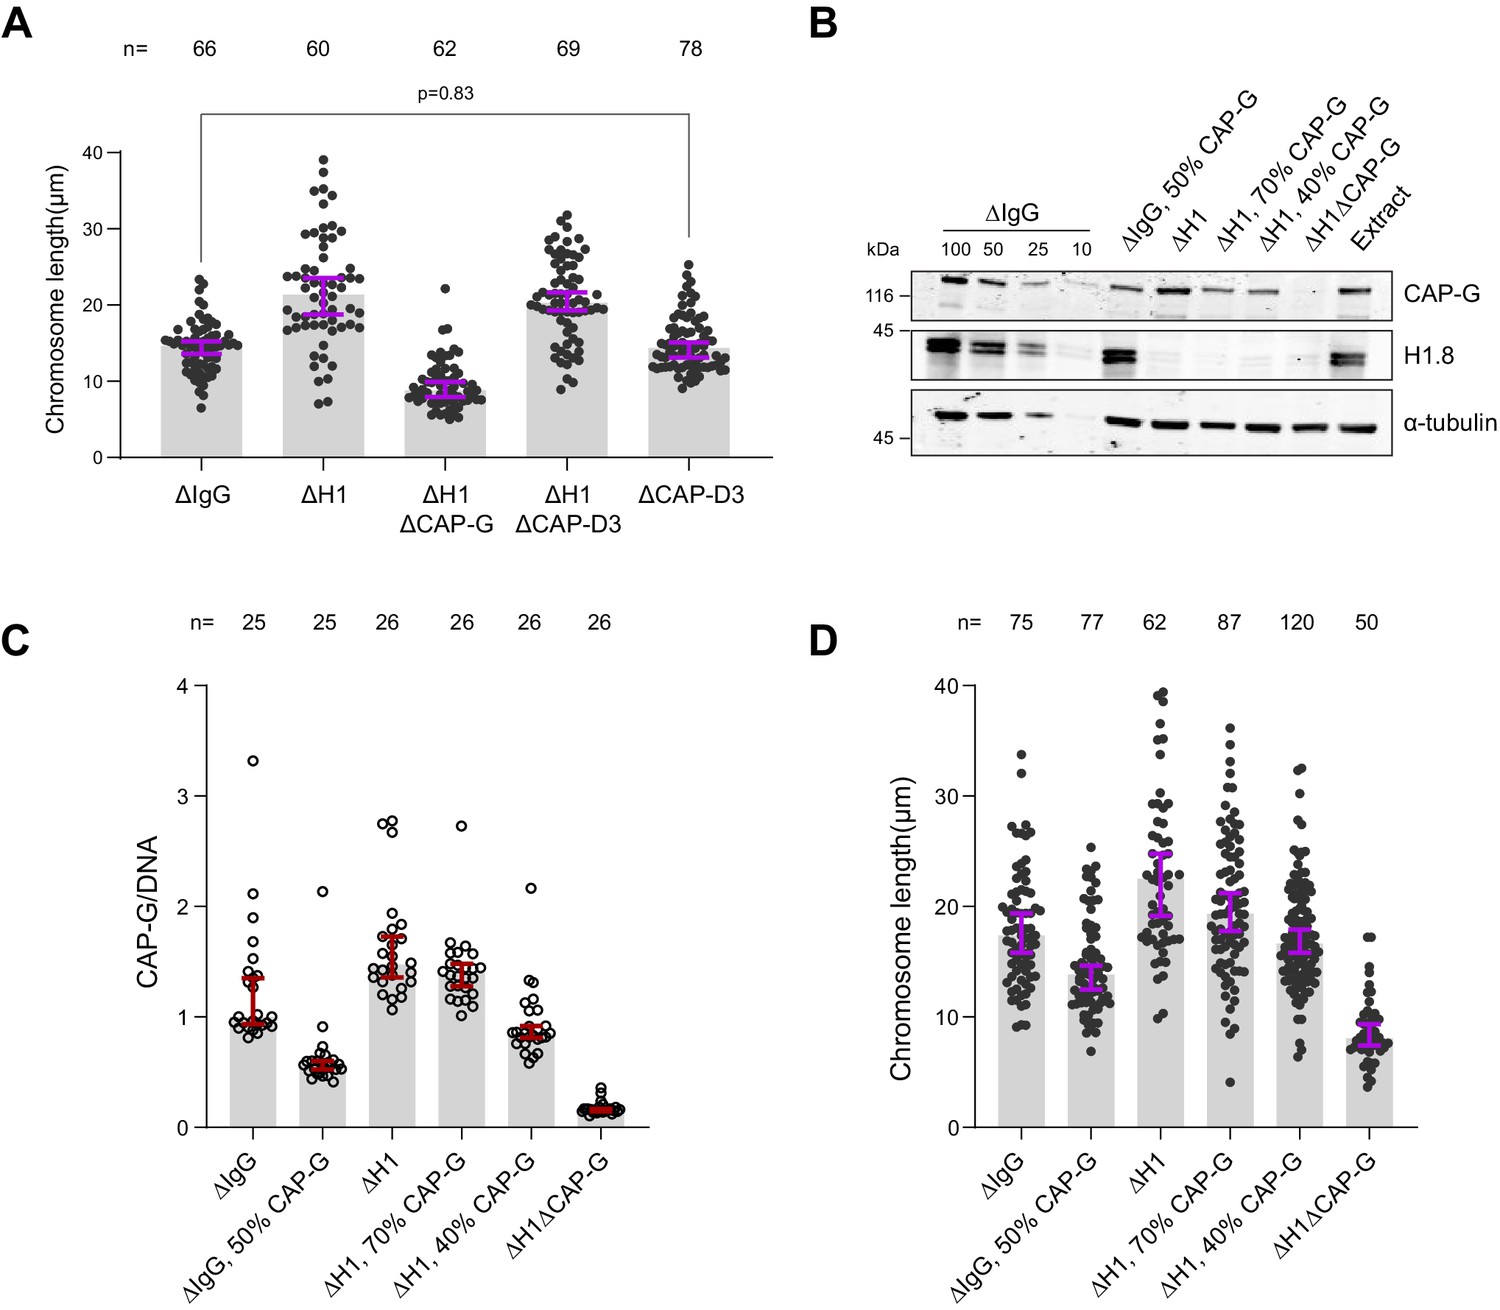
(A) Length of mitotic chromosomes in the indicated conditions after extract dilution showing no effect of CAP-D3 (condensin II) depletion in both mock and H1.8 depletion background. Each dot represents length of a single chromosome. Bars represent median ± 95% CI. The length of >50 chromosomes was measured in each condition for every experiment. (B) Total egg extract blots showing the partial depletions of condensin in the indicated conditions. The p-value in (A) was calculated by a two-tailed Mann–Whitney U-test. The number of chromosomes imaged in each condition for each experiment in (A) is indicated above the figure (Figure 3—source data 1). (C, D) Biological replicate of the partial condensin I depletion experiment in Figure 3E and F.
Figure 3—figure supplement 2
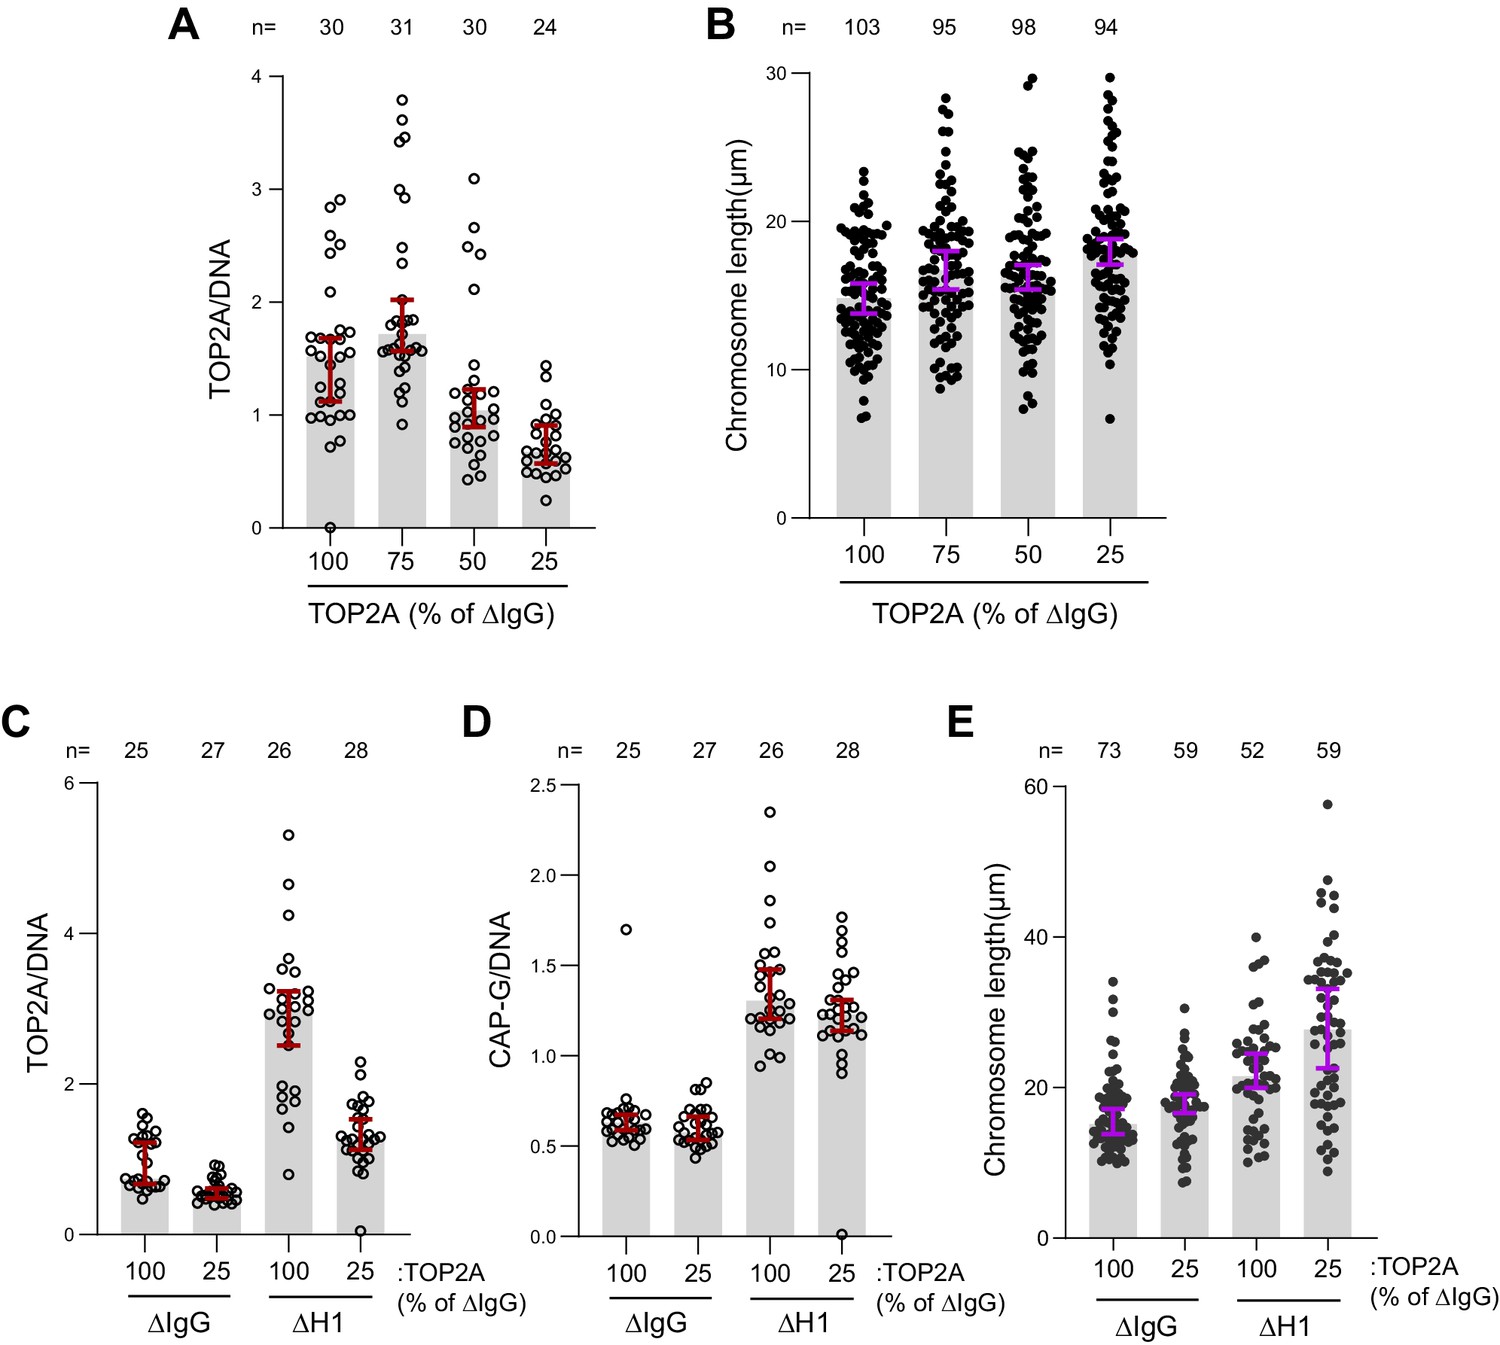
TOP2A overloading is not responsible for chromosome elongation.
(A) Sperm nuclei were replicated in undepleted interphase extracts supplemented with 25 nM Cy3-dUTP. The nuclei were then cycled back by mixing with different ratios of ΔTOP2A extracts. Immunofluorescence data showing chromatin-bound TOP2A normalized to Cy3-dUTP signal in each condition. Each dot represents the normalized mean intensity of a single nucleus. (B) Chromosome lengths in the indicated conditions. Each dot represents the length of a single chromosome. (C) Sperm nuclei were replicated in either mock (ΔIgG) and H1.8-depleted (ΔH1) extracts and cycled back using 3 volumes of the corresponding extracts (ΔIgG/ΔH1) or 3 volumes of ΔIgGΔTOP2A/ΔH1ΔTOP2A extracts correspondingly. Immunofluorescence data showing the chromatin-bound TOP2A in the indicated conditions. Each dot represents the normalized mean intensity of a single nucleus. (D) Immunofluorescence data showing chromatin-bound CAP-G (condensin I) and chromosome lengths in the indicated conditions. Each dot represents one nucleus (D) or one chromosome (E). Data plotted for all plots are medians and corresponding 95% CI. The number of nuclei or chromosomes is indicated above the plots.
Figure 4 with 2 supplements
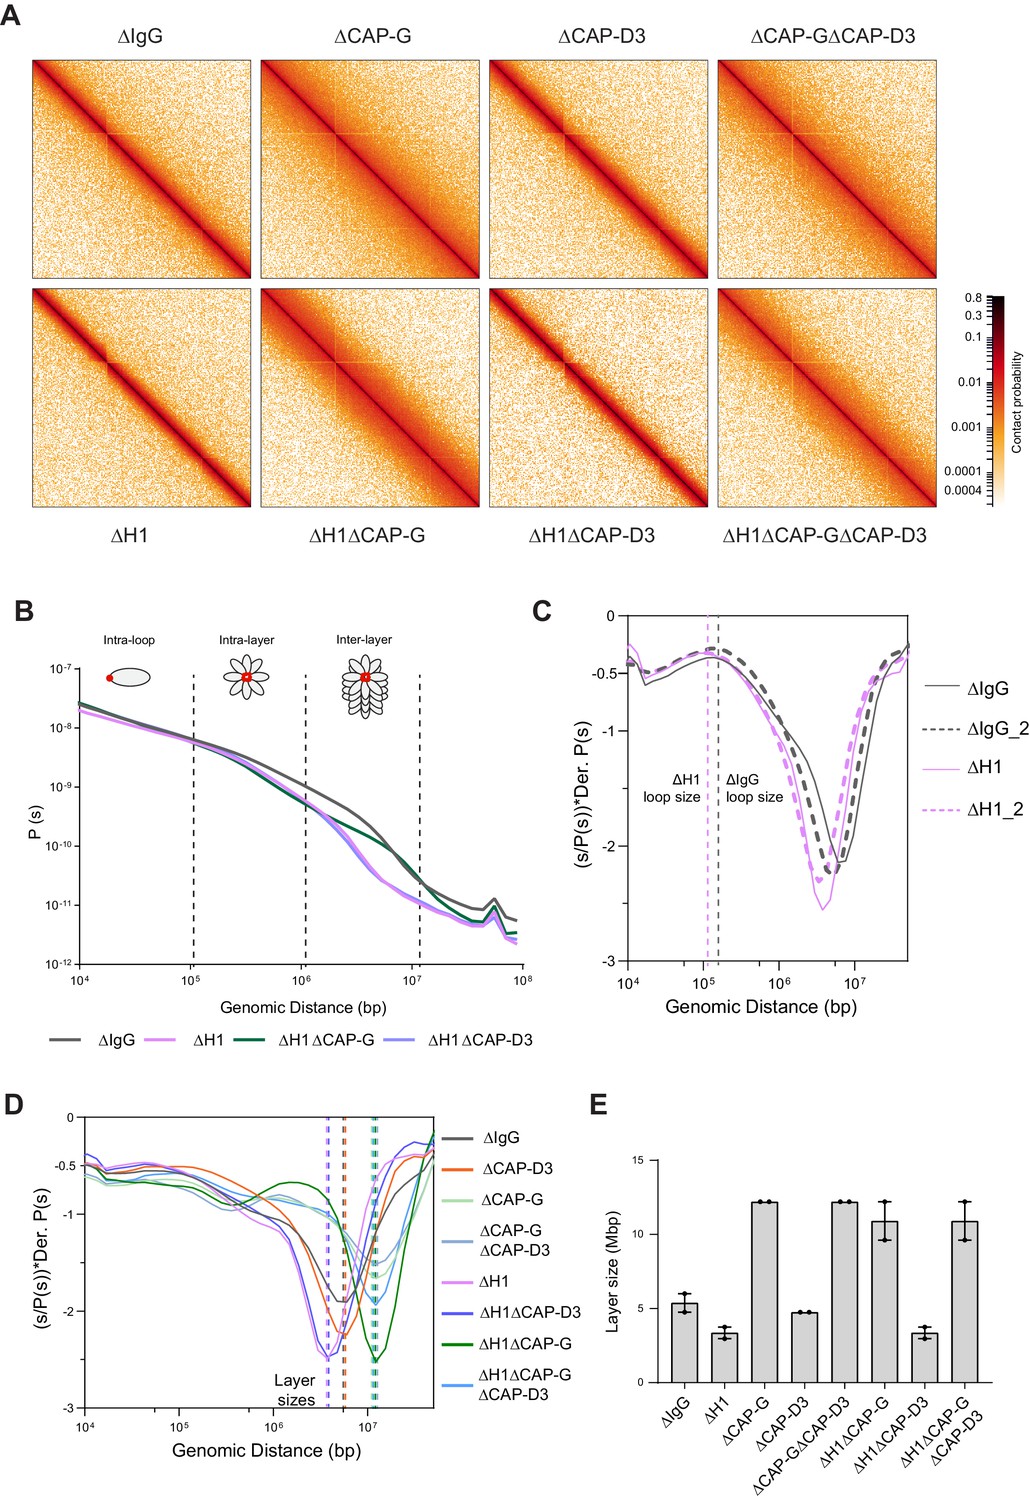
Effects of H1 and/or condensin I and II depletion on mitotic genome folding.
(A) Hi-C maps of metaphase X. laevis chromosome 3S, binned to 250 kb, in the indicated condition. (B) Genome-wide average contact probability decay curves for the indicated conditions showing the changes in longer distance interactions. (C) Derivative plots of the average contact probability decay curves for dispersed chromosomes from mock (ΔIgG) and H1.8-depleted extracts (ΔH1) showing the change in estimated loop size. The solid and dotted lines are from two independent biological replicates. (D) Derivative plots of the genome-wide average contact probability decay curves in the indicated conditions. The dotted lines indicate the layer sizes for each plotted condition. (E) Estimates of layer size from derivatives of genome-wide probability decay curves upon depletion of H1.8 and CAP-G (condensin I) or CAP-D3 (condensin II). The mean and range of two biological replicates are shown.
-
Figure 4—source data 1
Source data for all the figures in Figure 4 and its figure supplements.
- https://cdn.elifesciences.org/articles/68918/elife-68918-fig4-data1-v4.zip
Figure 4—figure supplement 1
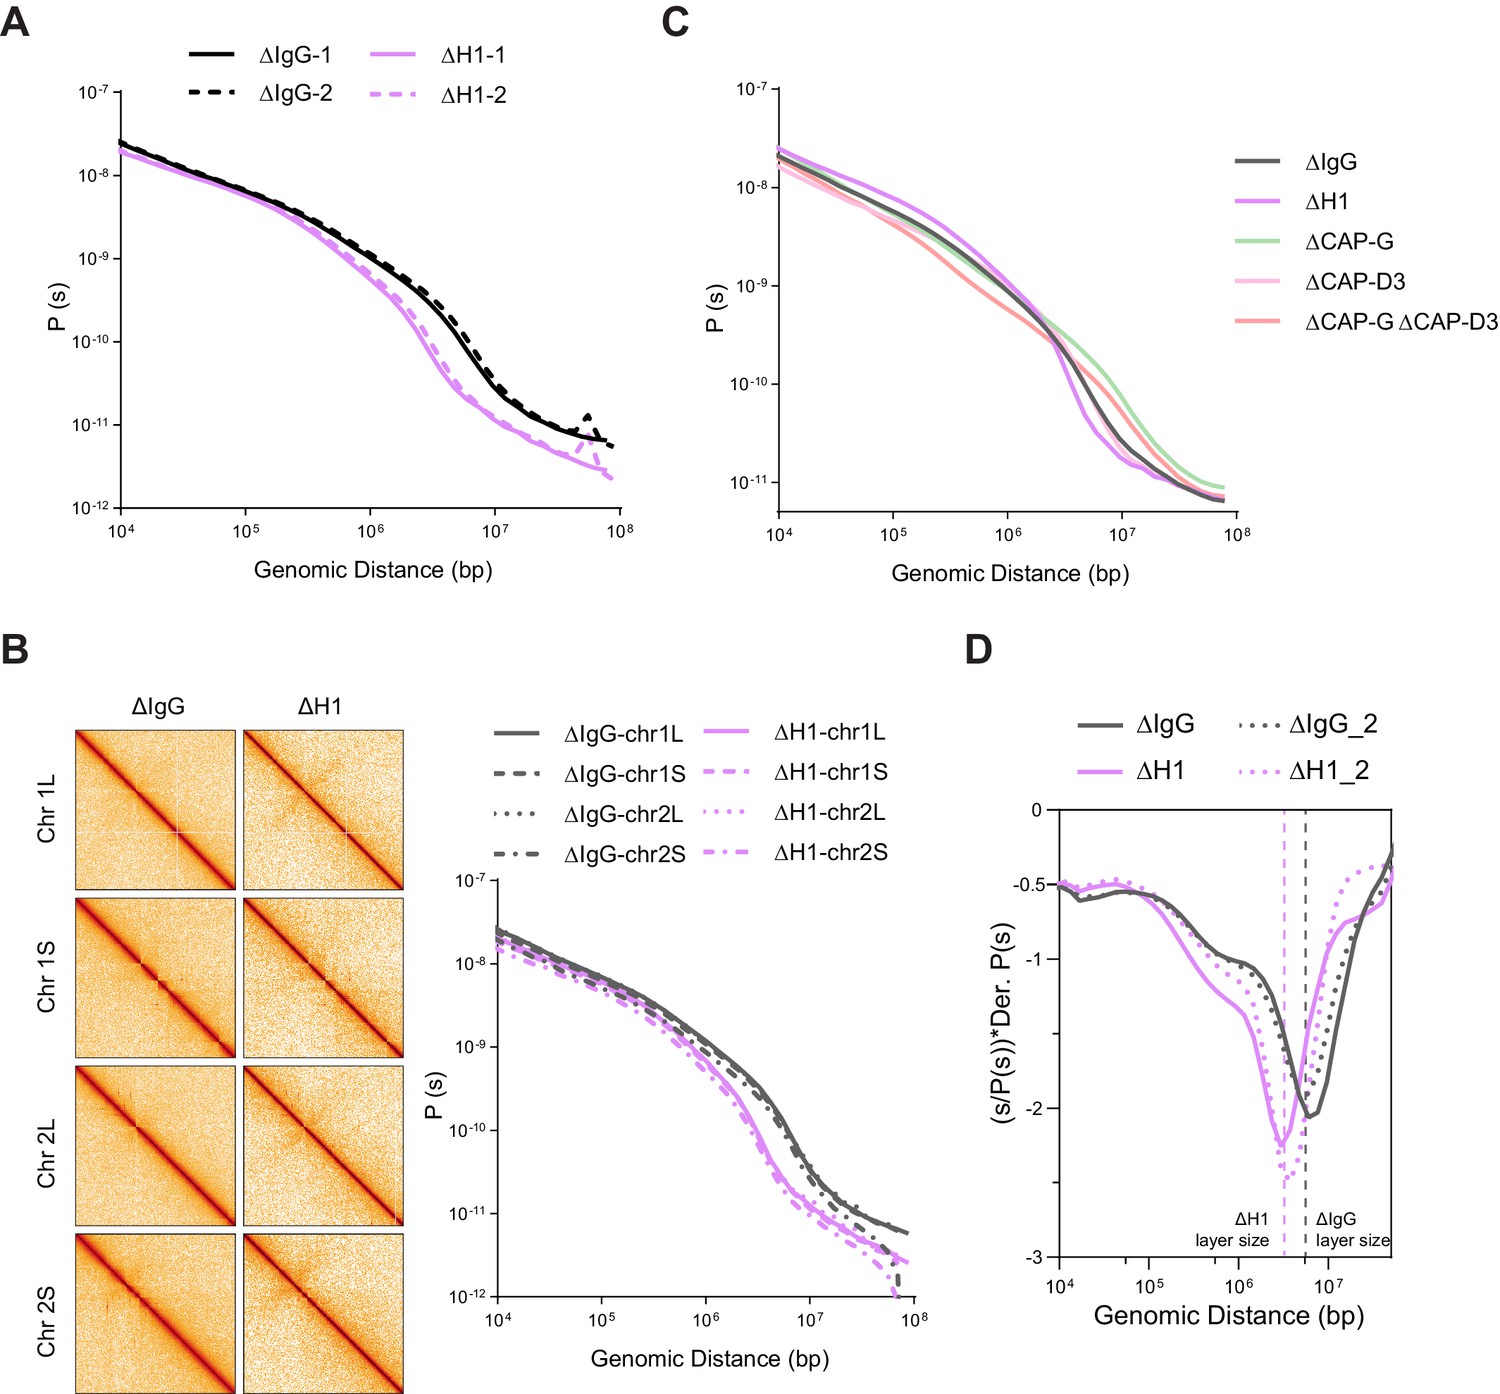
Effects of H1, condensin I, and condensin II depletion on mitotic genome folding.
(A) Contact probability decay curves of mitotic chromosomes in mock (ΔIgG) and H1-depleted (ΔH1) extracts from two different experiments showing the replicability of the Hi-C features. The solid and dashed lines are from biological replicates. (B) Hi-C maps (left) binned to 500 kb and contact probability curves (right) of single chromosomes showing the uniform effects of H1.8 depletion genome wide. (C) Genome average contact probability decay curves upon H1.8, CAP-G, and CAP-D3 depletions. (D) Genome average contact probability derivative curves of metaphase chromosomes in undiluted mock (ΔIgG) and H1.8-depleted (ΔH1) extracts. The layer size estimates from the valley in the derivative plots are indicated. The dotted lines are a biological replicate. The data for this figure is submitted as Figure 4—source data 1.
Figure 4—figure supplement 2
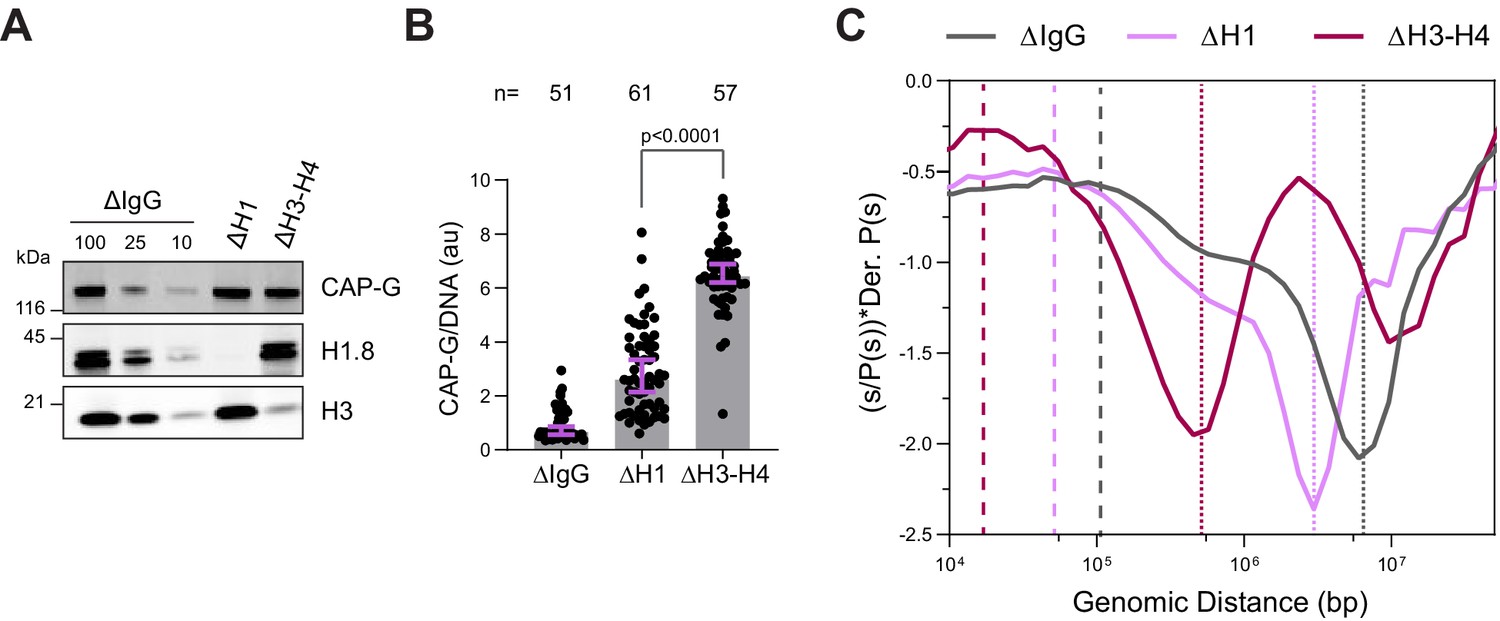
H3-H4 depletion leads to even smaller loop sizes.
(A) Western blotting showing the depletion of H3-H4 in total egg extract using the H4K12ac antibody (Zierhut et al., 2014). (B) Quantification of condensin I (CAP-G) immunofluorescence levels on chromosomes normalized to DNA in ∆H1 and ∆H3-H4 extracts. Each dot represents the average signal intensity of a single chromosome cluster (from one nucleus). Data plotted is median and 95% CI > 40 nuclei were quantified for each condition plotted. The statistical significance between ΔH1 and ΔH3-H4 was analyzed by a two-tailed Mann–Whitney U-test. (C) Hi-C probability decay derivative plots estimating the loop sizes in ∆H1 and ∆H3-H4 extracts. The dashed lines indicate the loop sizes in the corresponding conditions and the dotted lines indicate the layer size. Two biological replicates for Hi-C on chromosomes from ΔH3-H4 extracts were performed and similar results were obtained from both experiments. The data for this figure is submitted as Figure 4—source data 1, and the number of nuclei imaged in (B) is indicated above the figure.
Figure 5 with 1 supplement
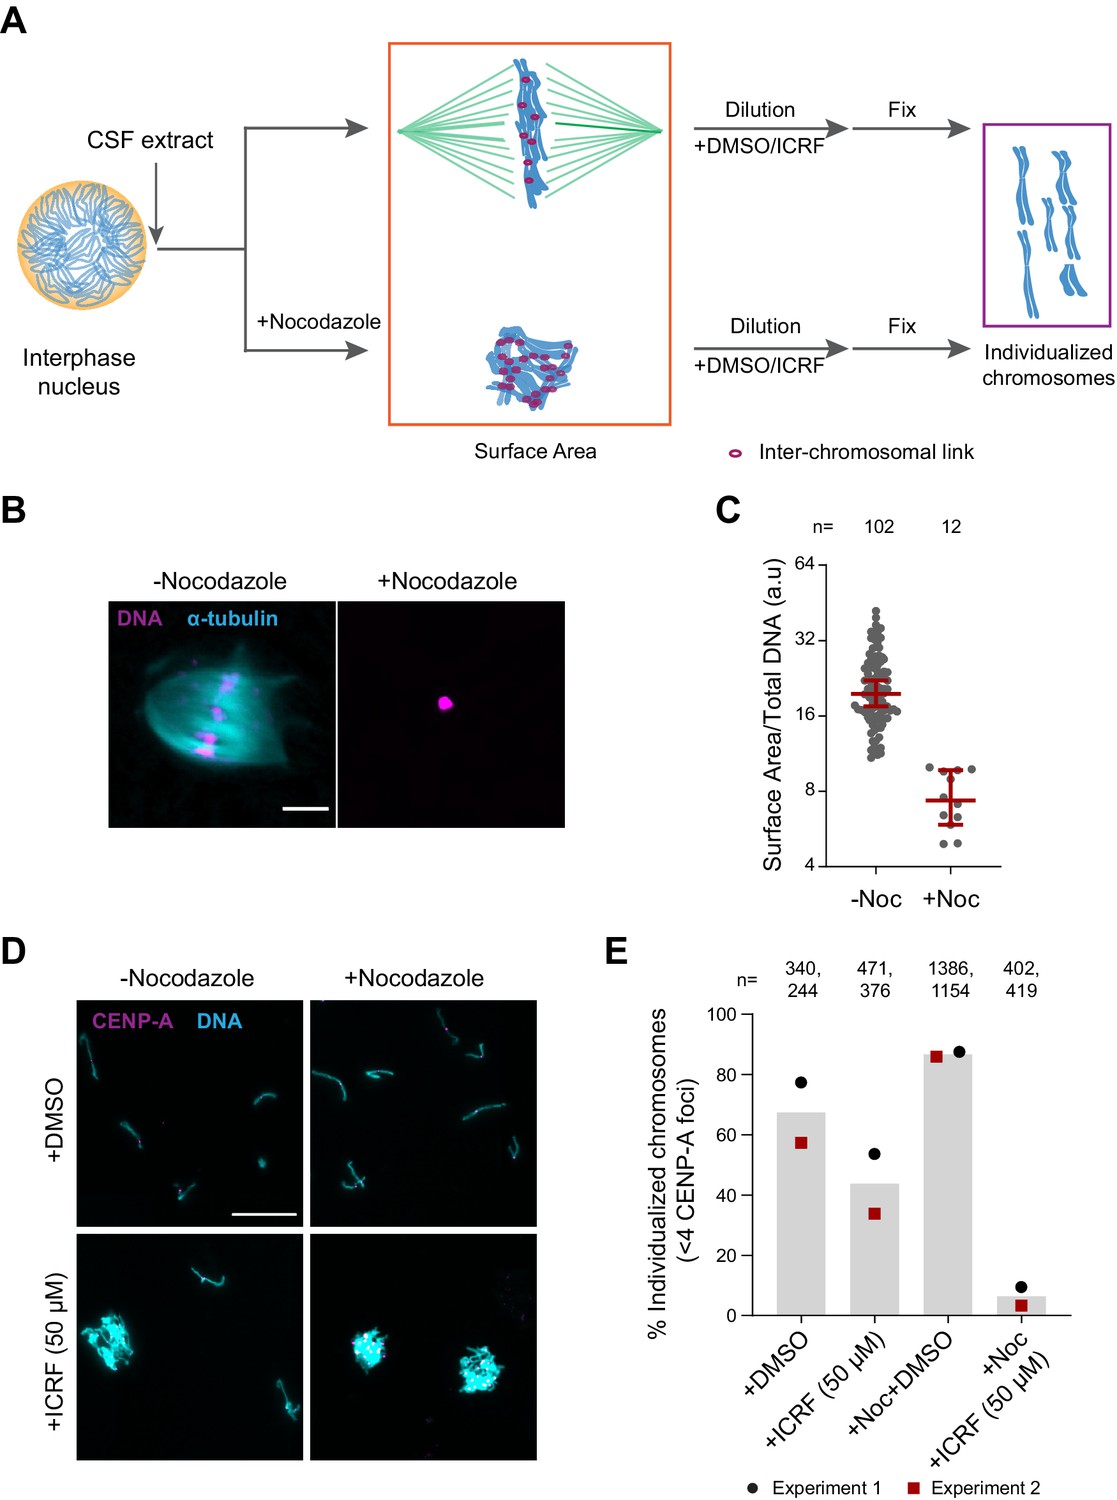
Substantial interchromosomal links remain in metaphase chromosomes.
(A) Schematic showing the dispersal protocol and the different stages for the two chromosome individualization measurements. (B) Representative images of metaphase chromosomes in extracts containing Alexa Fluor 647-labeled tubulin (blue) with and without 10 µg/ml nocodazole. DNA was visualized using Hoechst 33342 (magenta). Scale bar is 20 µm. (C) Quantification of the three-dimensional surface area normalized to the total DNA intensity in (B). Each dot represents a single chromosomal mass. The number of masses quantified in each condition is indicated. (D) Representative images of the dispersed chromosomal masses in the indicated conditions. Scale bar is 20 µm. (E) Percent frequency of individualized chromosomes (chromosomes in DNA masses with <4 CENP-A foci) in the indicated conditions. Data from two biological replicates is shown. The number of masses quantified in each condition is indicated.
-
Figure 5—source data 1
Source data for Figure 5 and its figure supplement.
- https://cdn.elifesciences.org/articles/68918/elife-68918-fig5-data1-v4.xlsx
Figure 5—figure supplement 1
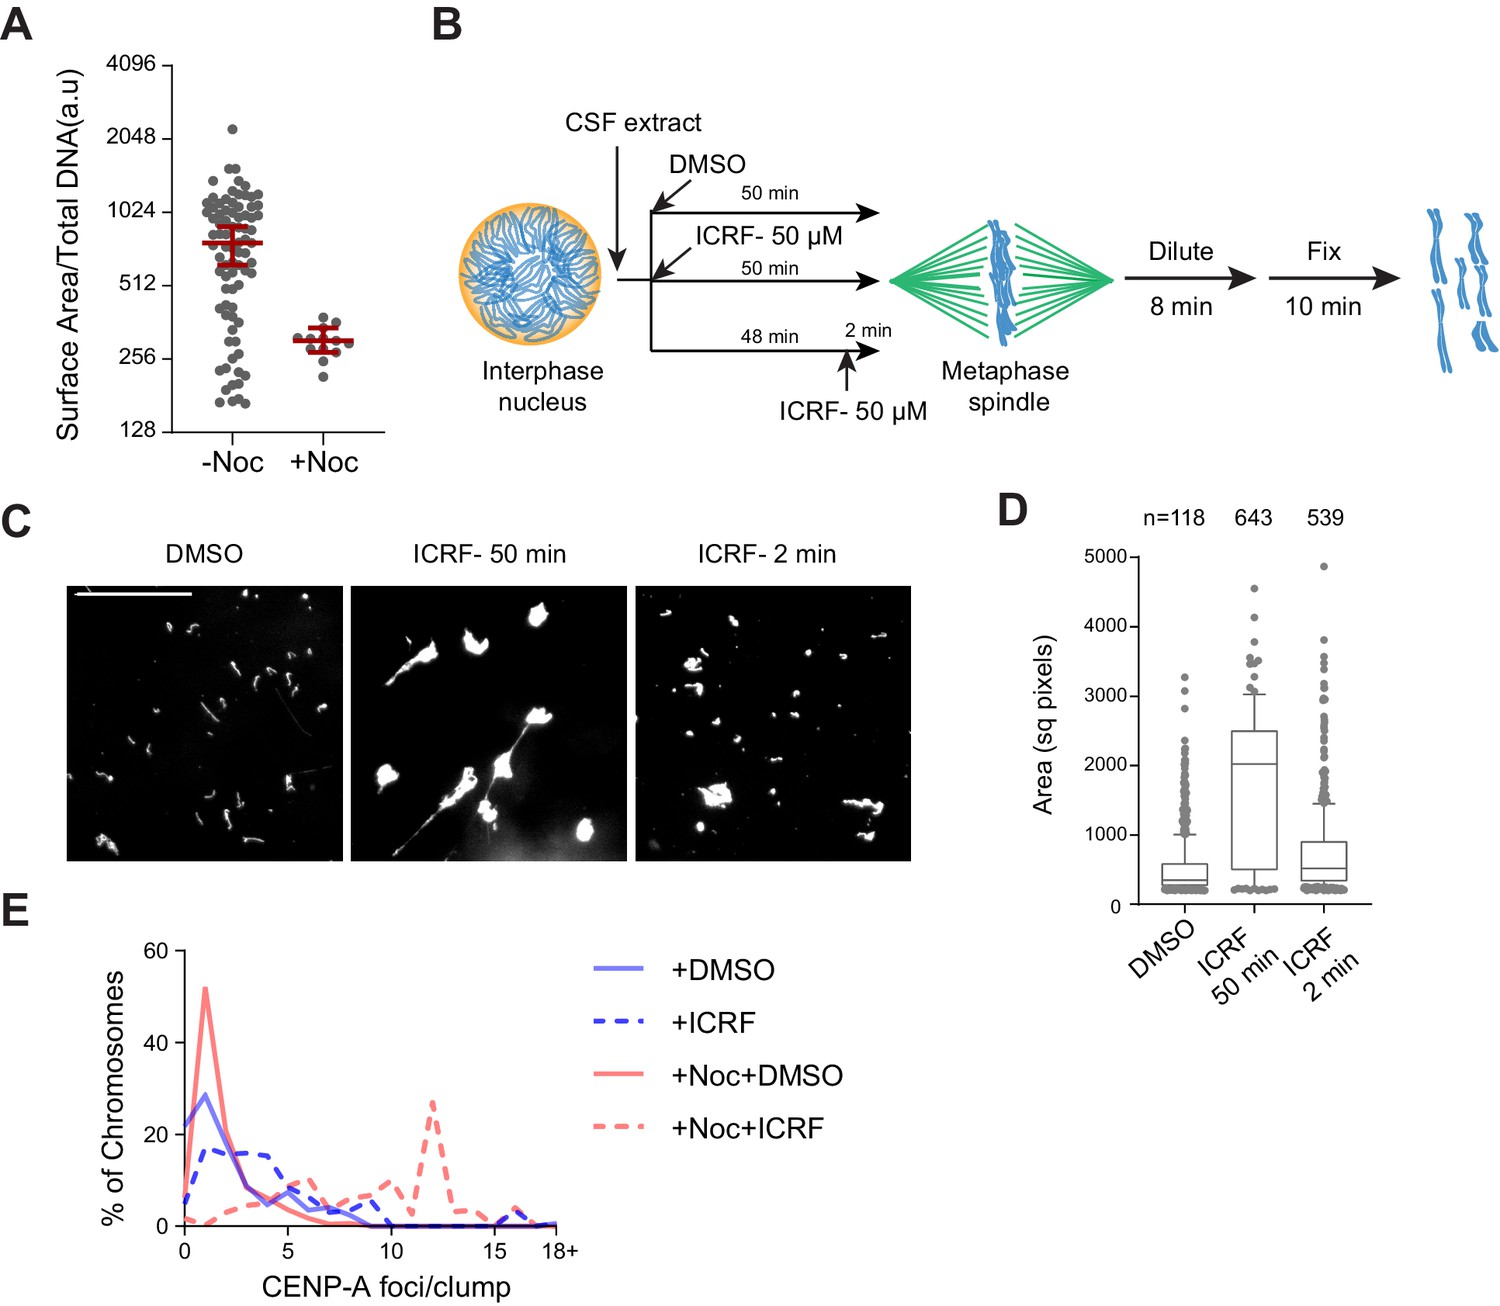
Regulation of chromosome individualization by topo II, condensins, and H1.8 in Xenopus egg extracts.
(A) Biological replicate of Figure 5C. (B) Schematic of ICRF-193 addition to check for requirement of topo II activity in individualizing chromosomes. Interphase nuclei were first formed in ∆IgG or ∆H1 extracts, topo II inhibitor ICRF-193 (50 µM) was added to egg extracts, either together with corresponding depleted egg extracts and incubated for 50 min (ICRF-50 min), or 48 min after adding the depleted extracts, followed by 2 min incubation with ICRF-193 (ICRF-2 min). (C) Metaphase extracts processed as (A) were diluted to disperse individualized chromosomes. Representative Hoechst images of chromosomes are shown. Bar, 20 µm. (D) Quantification of the Hoechst-stained area of chromosomes in (B). Each dot represents the area of a single chromosome or a chromosome cluster. Large values indicate the extent of chromosome clusters. The box shows the 10th–90th percentile limits of the sample values. The number of DNA masses imaged in each condition is indicated above the figure. (E) Histogram of the number of chromosomes in clusters containing the indicated number of CENP-A foci in the indicated conditions. The number of chromosomes imaged is the same as in Figure 5E. The data for this figure is submitted as Figure 5—source data 1.
Figure 6 with 1 supplement
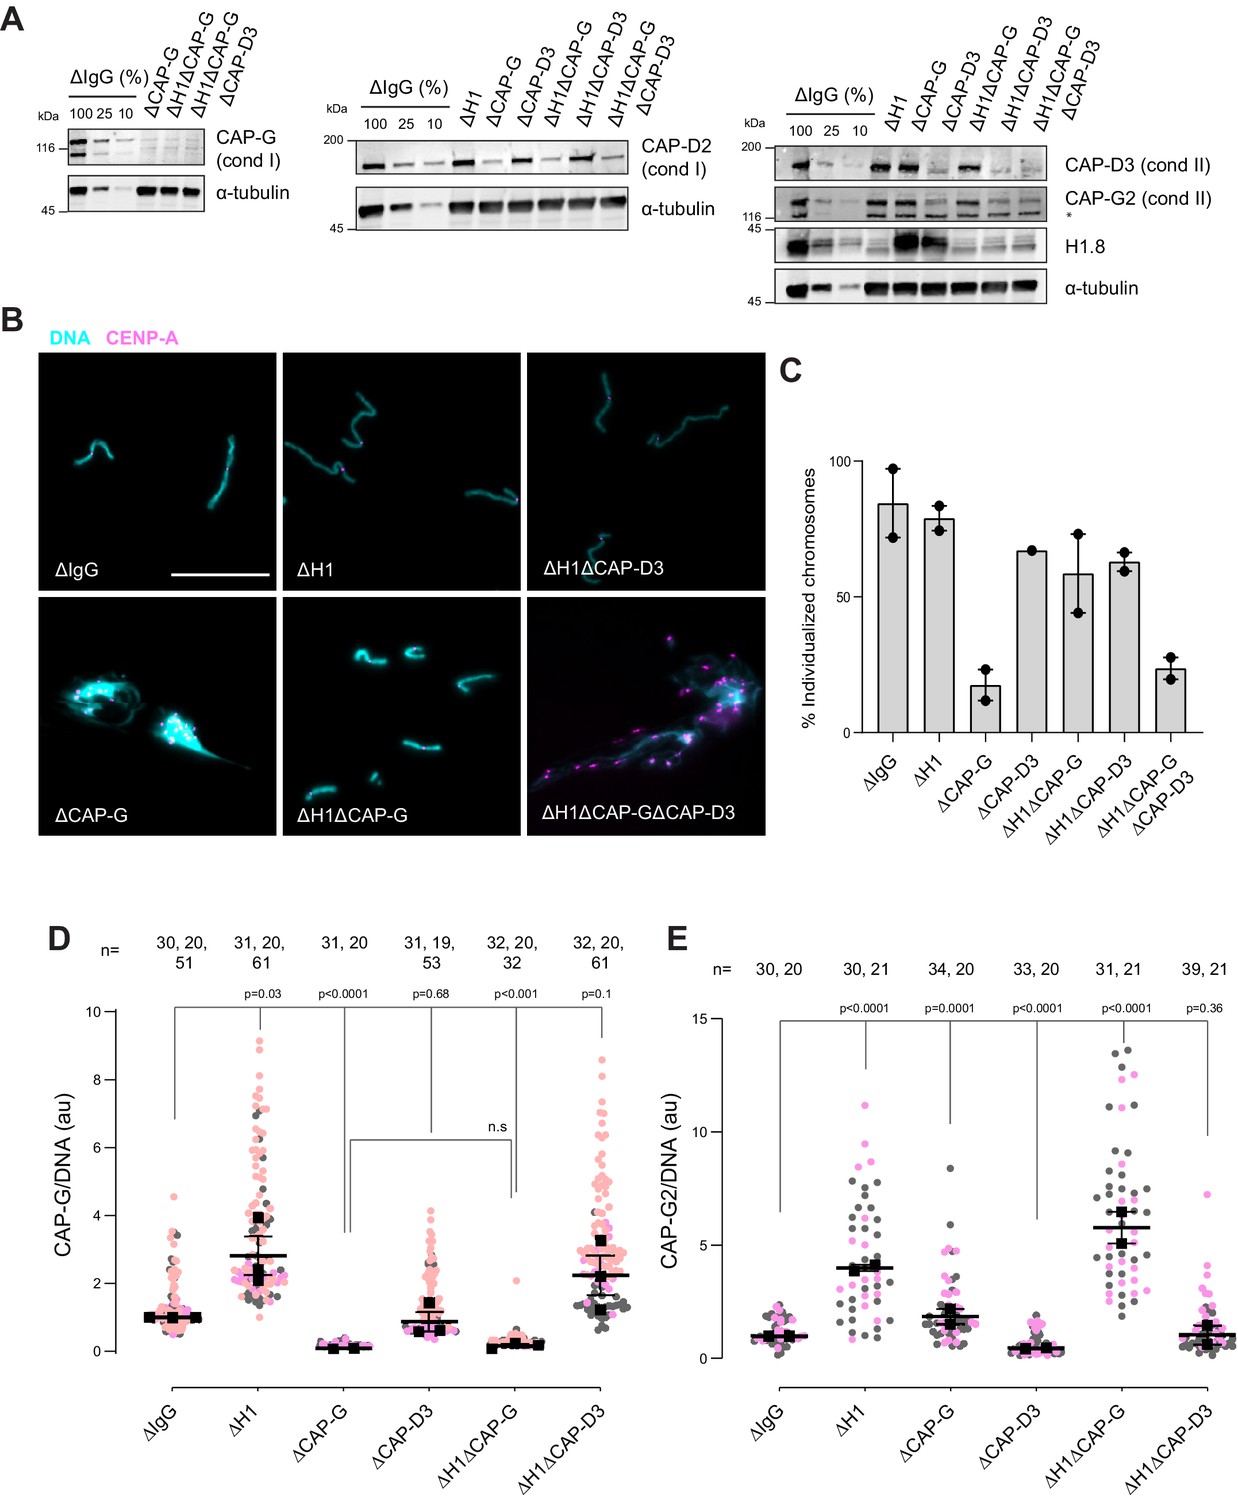
H1.8 suppresses condensin to limit chromosome individualization.
(A) Western blots of total egg extracts showing depletion levels in extract of condensin I and condensin II using the CAP-G and CAP-D3 antibodies, respectively. * represents non-specific band. (B) Representative images of chromosomes after extract dilution, which disperses individualized chromosomes. DNA and centromere-associated CENP-A immunofluorescence are shown. Bar, 20 µm. (C) Percent frequency of individualized chromosomes (chromosomes in DNA masses with <4 CENP-A foci) in the indicated conditions. A large majority of DNA masses with no CENP-A foci are derived from ∆CAP-D3 extracts, where CENP-A loading is compromised (Bernad et al., 2011). DNA masses and CENP-A foci were identified using Otsu’s thresholding algorithm and CENP-A foci in a binarized DNA mask were counted. The numbers of DNA masses counted in each condition were as follows: ΔIgG (502, 643), ΔH1 (1279, 839), ΔCAP-G (447, 170), ΔCAP-D3 (937), ΔH1ΔCAP-G (1565, 301), ΔH1ΔCAP-D3 (1536, 300), ΔH1ΔCAP-GΔCAP-D3 (300, 156). (D) Quantification of CAP-G (condensin I) immunofluorescence normalized to the DNA signal for the indicated conditions. Each gray or orange dot represents the average signal intensity of a single chromosome cluster (from one nucleus). Each black dot represents the median signal intensity from a single experiment. Bars represent mean and range of the medians of two independent experiments. (E) Quantification of CAP-G2 (condensin II) immunofluorescence intensity, normalized to the DNA signal for the indicated conditions. Each gray or magenta dot represents the average signal intensity of a single chromosome cluster (from one nucleus). Each black dot represents the median signal intensity from a single experiment. Bars represent mean and range of the medians of two independent experiments. The p-values in (D) and (E) were calculated by an unpaired Student’s t-test and a two-tailed Mann–Whitney U-test respectively. The number of nuclei imaged in each condition in (D) and (E) in each experiment is indicated above the figures.
-
Figure 6—source data 1
Source data for all the figures in Figure 6 and its figure supplement.
- https://cdn.elifesciences.org/articles/68918/elife-68918-fig6-data1-v4.zip
Figure 6—figure supplement 1
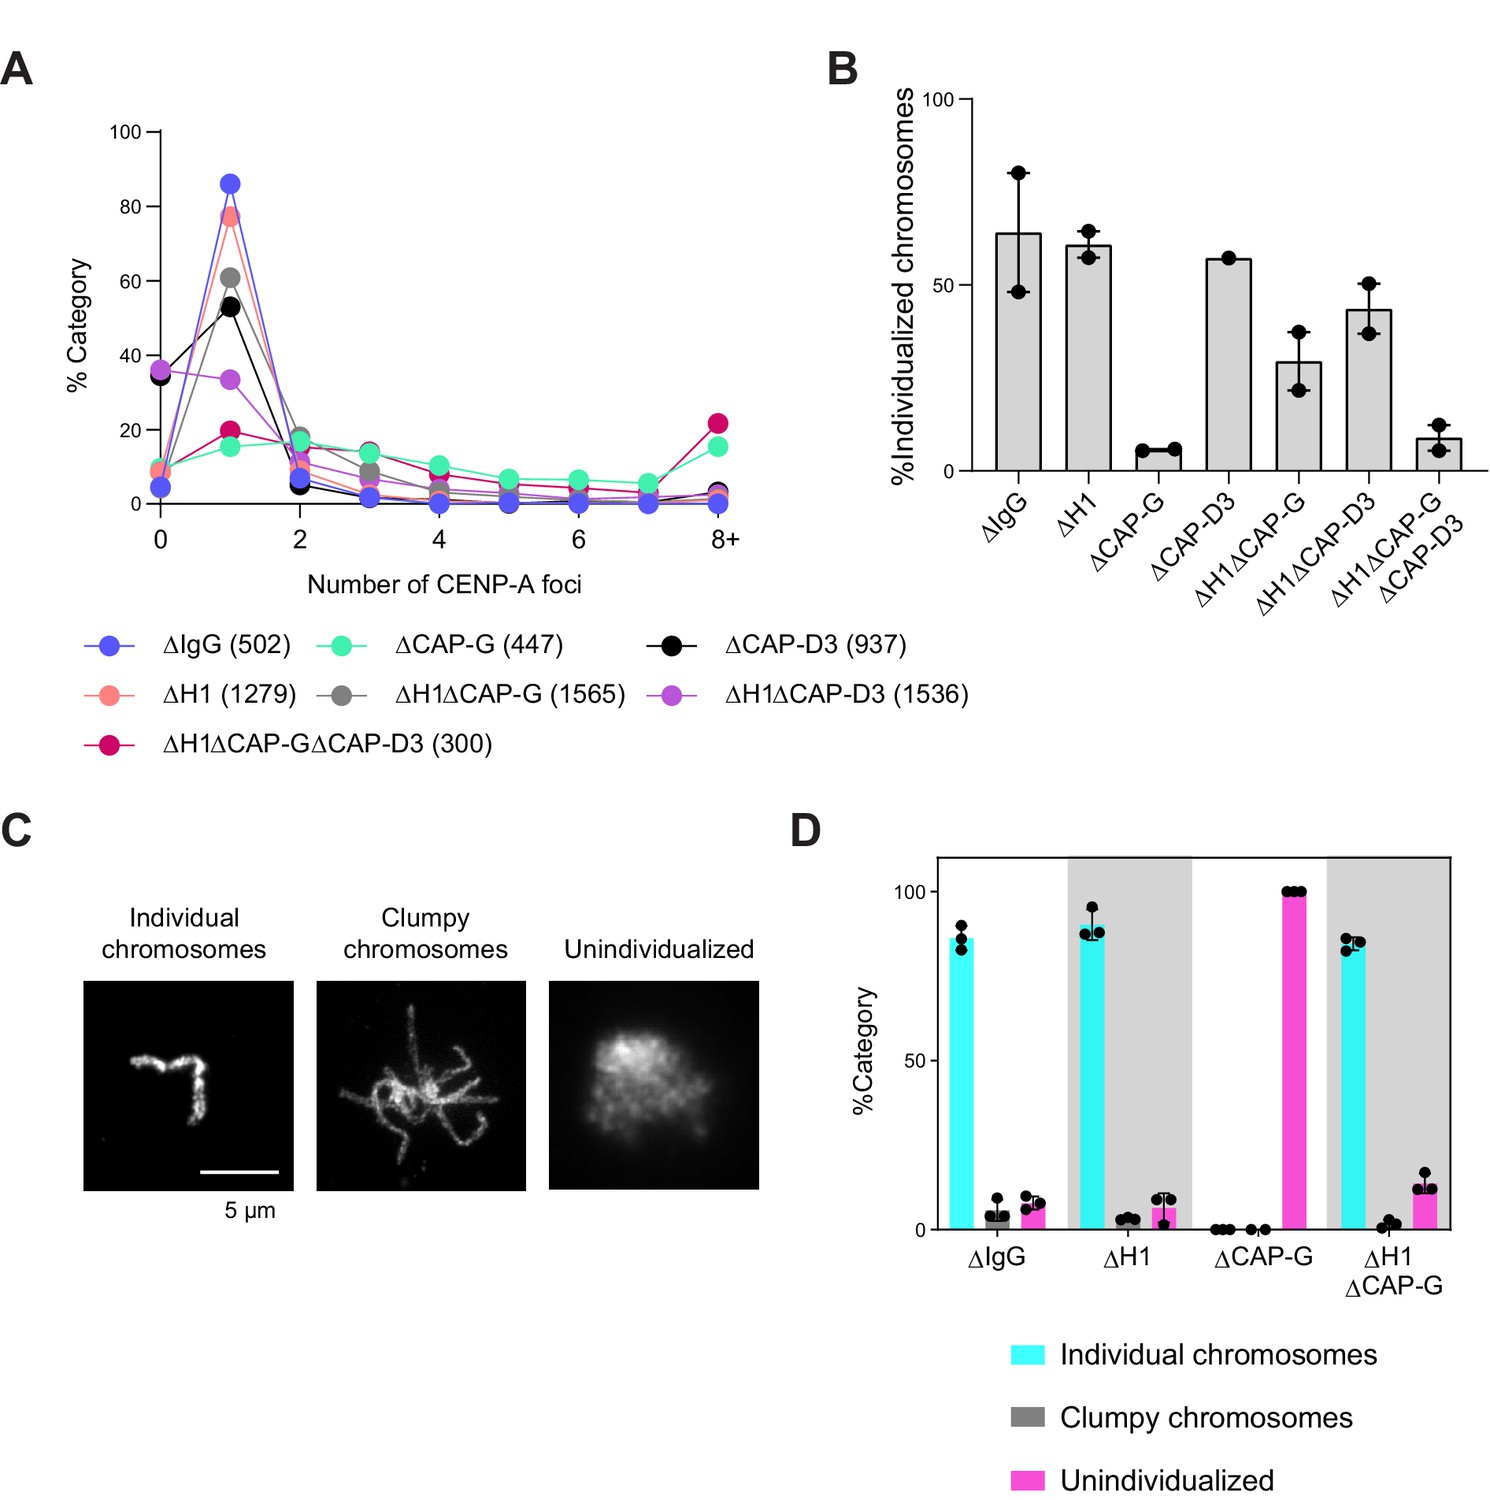
Additional data for chromosome clustering.
(A) Distribution of CENP-A foci per DNA mass in the experiment shown in Figure 6A–C. Clusters of unresolved chromosomes are represented by higher numbers (>3) of CENP-A foci per DNA mass indicates clusters. No detectable CENP-A focus in ∆CAP-D3 (∆condensin II) extracts is due to low CENP-A signal, reflecting the reported role of condensin II in CENP-A loading (Bernad et al., 2011). The number noted in each sample label is the number of chromosomes/clusters counted in each condition. (B) Percent frequency of single chromosomes (chromosomes in DNA masses with <2 CENP-A foci) in the indicated conditions showing that the cutoff for number of CENP-A foci does not change the relative individualization measured. The number of DNA masses imaged in each condition is the same as in Figure 6C. (C) Categories of chromosome clusters observed upon performing chromosome individualization assay. (D) Percent frequency of DNA clusters categorized as unindividualized nuclei as in (C) in the indicated conditions. Each chromosome mass is classified to one of the three categories based on the morphology. ‘Clumpy chromosomes’ represents a mass containing a few clearly recognizable chromosomes, while ‘unindividualized’ represents a mass with unresolved multiple chromosomes. Mean and SEM from three independent experiments. Each dot represents the percentage of unindividualized chromosome clusters in the indicated condition in an independent biological replicate. The number of DNA masses counted in each condition is as follows: ΔIgG (50, 128, 201), ΔH1 (66, 135, 447), ΔCAP-G (13, 30, 50), ΔH1ΔCAP-G (58, 201, 194).
Figure 7 with 1 supplement
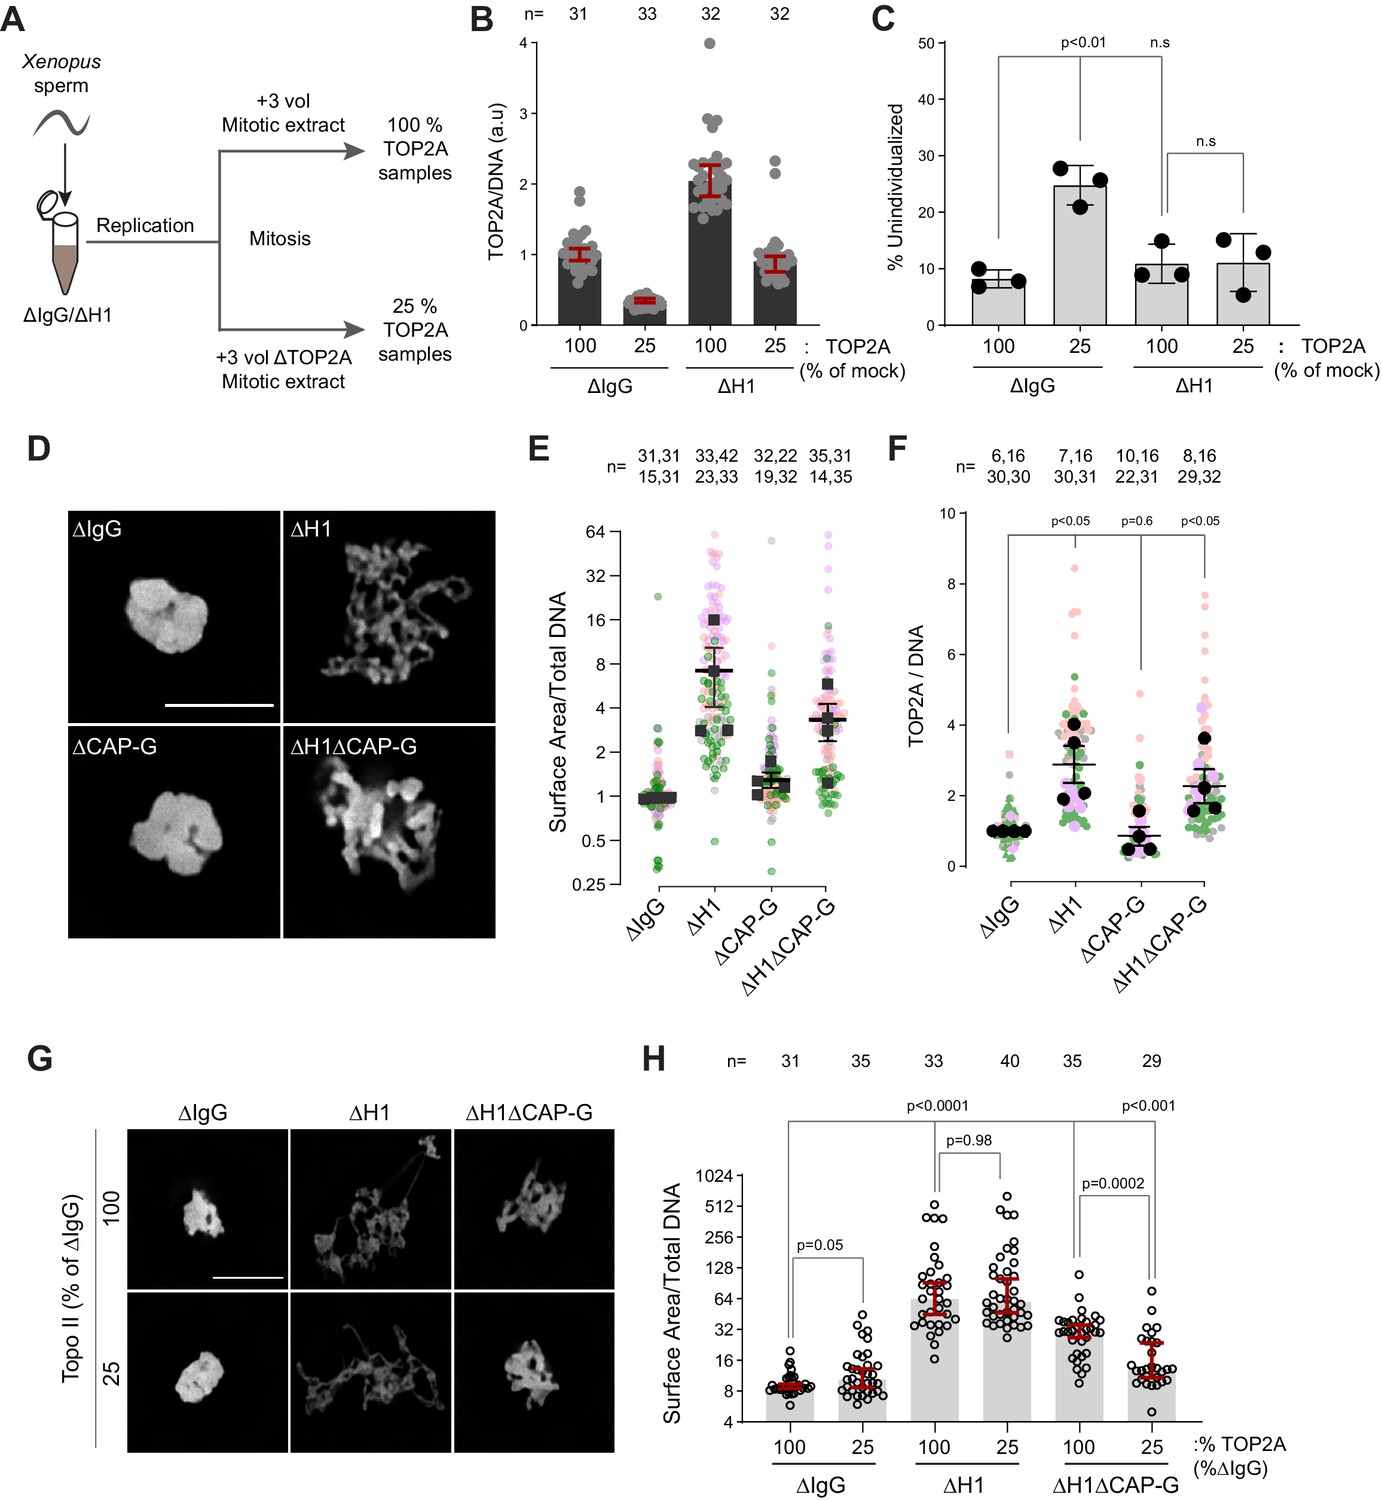
H1.8 suppresses hyper-individualization through condensins and topo II.
(A) Schematic of partial TOP2A depletion to test sensitivity of chromosome individualization to TOP2A levels. (B) Quantification of chromosome-associated TOP2A upon partial TOP2A depletion. Each dot represents the mean of TOP2A intensity normalized to DNA intensity of a single chromosome cluster (from one nucleus). The data plotted is median ± 95% CI. (C) Percent frequency of DNA clusters categorized as unindividualized nuclei (Figure 6—figure supplement 1C) upon partial TOP2A depletion. Mean and SEM from three independent experiments. Each dot represents the percentage of unindividualized chromosome clusters in the indicated condition in an independent biological replicate. (D) Representative images of nuclei using DNA (Cy5-dUTP) showing the clustering phenotype in the indicated conditions. Scale bar, 10 µm. (E) Quantification of the three-dimensional surface area of the chromosome clusters in (D) normalized to DNA (Cy5-dUTP) signal. Each gray, magenta, green, or orange dot represents the normalized surface area of single nucleus or chromosome cluster, and each black square represents the median surface area of a single experiment. Data plotted is mean and SEM of four independent experiments. (F) Quantification of TOP2A immunofluorescence intensity normalized to the DNA signal for the indicated conditions. Each gray or magenta dot represents the average signal intensity of a single chromosome cluster (from one nucleus). Each gray, magenta, orange, or gray dot represents the median signal intensity from a single experiment. Mean and SEM of the median of four independent experiments are also shown. (G) Representative images of nuclei using DNA (Cy3-dUTP) showing the clustering phenotype in the indicated conditions. Scale bar, 10 µm. (H) Quantification of the three-dimensional surface area of the chromosome clusters in (G) normalized to DNA (Cy3-dUTP) signal. Each black open circle represents the normalized surface area of single nucleus or chromosome cluster. Data plotted is median and 95% CI. The p-values in (C) and (F) were calculated by an unpaired Student’s t-test, and the p-values in (H) were calculated by a two-tailed Mann–Whitney U-test. The number of nuclei imaged in each condition for each experiment in (E), (F), and (H) is indicated above the figure.
-
Figure 7—source data 1
Source data for all the figures in Figure 7 and its figure supplement.
- https://cdn.elifesciences.org/articles/68918/elife-68918-fig7-data1-v4.zip
Figure 7—figure supplement 1
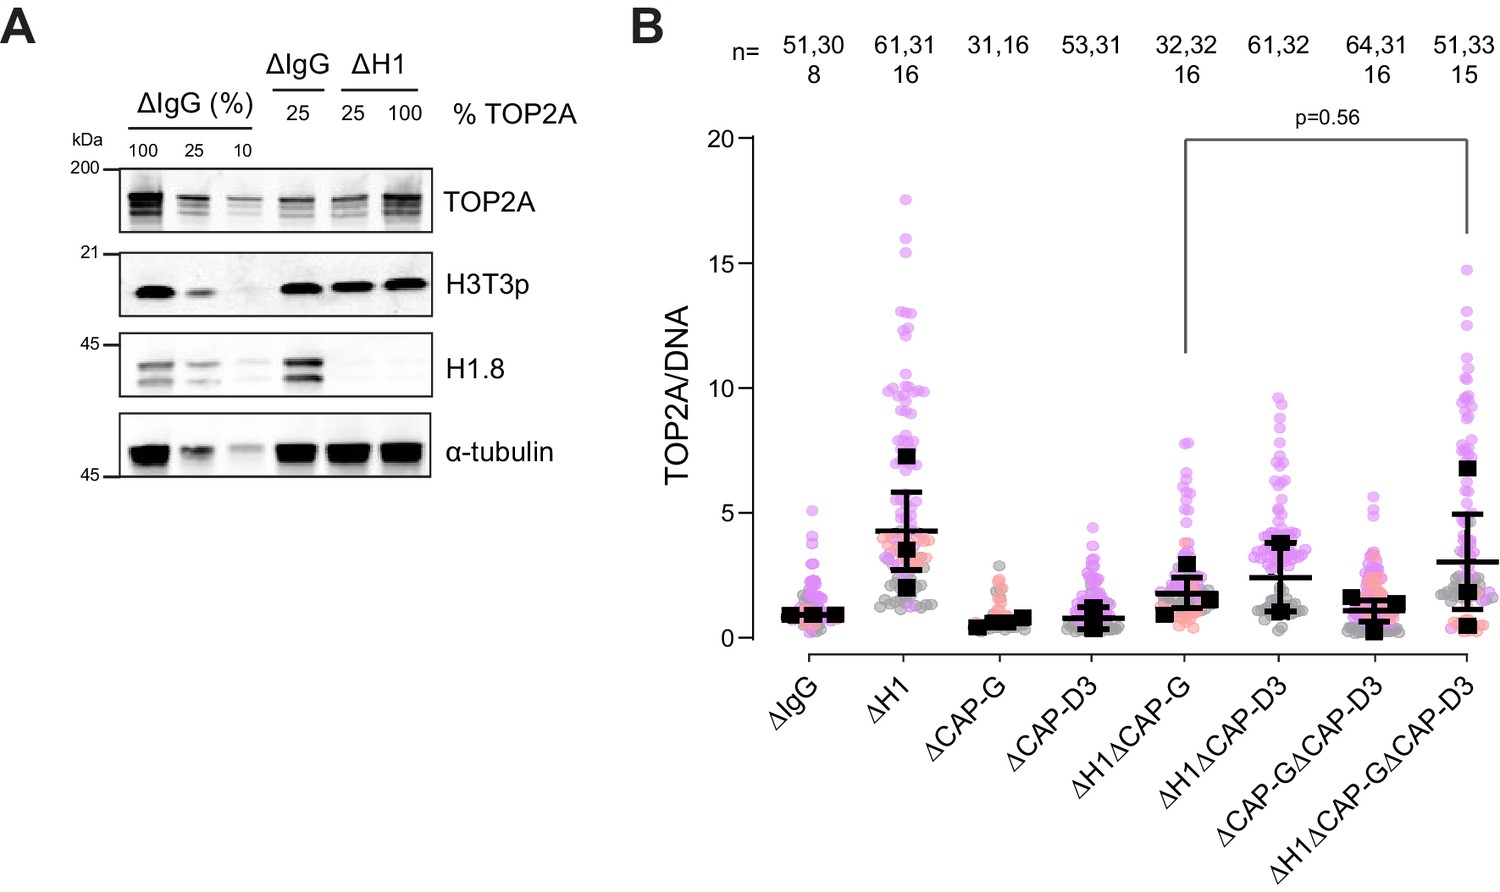
H1.8 suppresses over-individualization through condensins and topo II.
(A) Western blots of total egg extracts showing partial depletion of TOP2A. Left three lanes: dilution series of total mock-depleted extracts (∆IgG) for signal quantitation. Middle ∆IgG lane: extracts with 25% level of TOP2A. right two ∆H1 lanes; extracts depleted of H1.8 with either 25 or 100% levels of TOP2A. (B) Quantification of TOP2A signal normalized to the DNA signal in the indicated conditions. Each gray, orange, or violet dot represents the mean normalized TOP2A level in a single nucleus. The black squares represent the median of the TOP2A values of all the nuclei in a single experiment. Data plotted is mean and SEM. The p-value in (C) was calculated using an unpaired Student’s t-test. The number of nuclei imaged in (C) in each condition is indicated above the figure, and the data for this figure is submitted as Figure 7—source data 1.
Figure 8
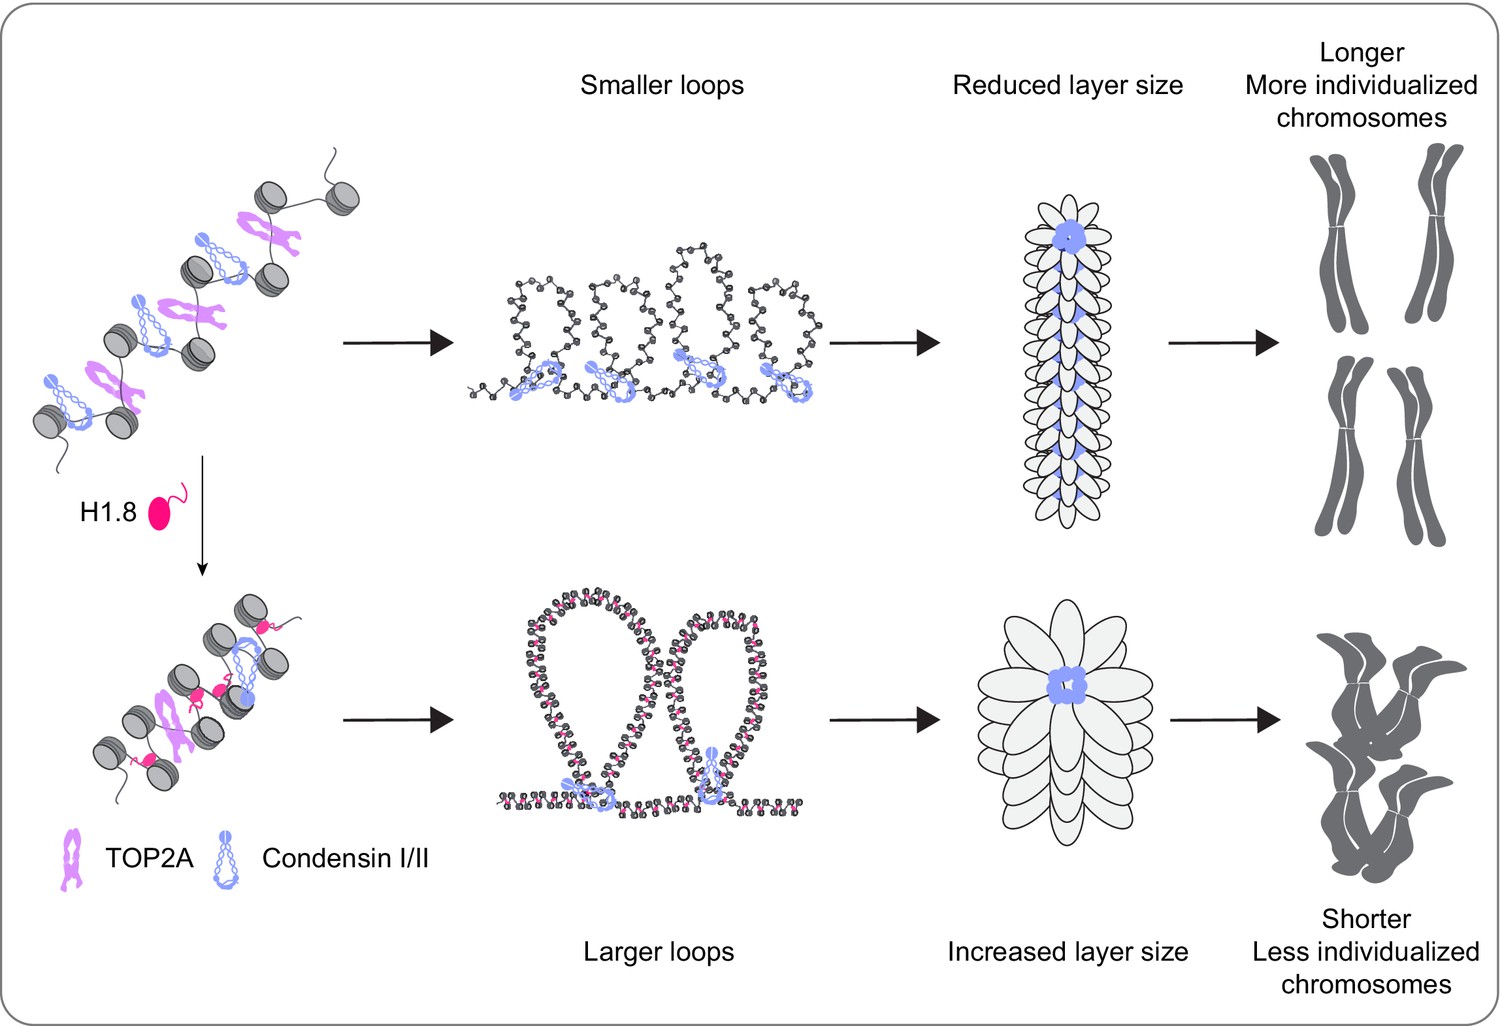
A graphical model of how H1.8 controls mitotic chromosome length.
In the absence of H1.8, more condensins and topo II bind to more DNA loops of shorter length, resulting in longer and more individualized chromosomes (top). H1.8 limits chromatin levels of condensins and topo II to generate longer and thus fewer DNA loops, resulting in shorter and less individualized chromosomes (bottom).
Tables
Table 1
Summary table of chromatin levels of condensins, topo II, and chromosome phenotypes.
| Condensin I | Condensin II | TOP2A | Chromosome length | Chromosome individualization | |
|---|---|---|---|---|---|
| ∆H1 | 2.5× | 2× | 3.5× | 1.5× | ++ |
| ∆CAP-G | 0.1× | 1× | 1× | NA | Defective |
| ∆CAP-D3 | 1× | 0.4× | 1× | 1× | Unchanged |
| ∆H1∆CAP-G | 0.2× | 2× | 3.5× | 0.5× | + |
| ∆H1∆CAP-D3 | 2.5× | 0.9× | 3.5× | 1.5× | ++ |
| ∆H1∆CAP-G ∆CAP-D3 | 0.2× | 0.9× | 3.5× | NA | Defective |
Key resources table
| Reagent type (species) or resource | Designation | Source or reference | Identifiers | Additional information |
|---|---|---|---|---|
| Cell line (Spodoptera frugiperda) | SF9 insect cells | Gibco | 11496015 | |
| Cell line (Trichoplusia ni) | High Five insect cells | Gibco | B85502 | |
| Cell line(Pichia pastoris) | Yeast cells | Invitrogen/Thermo Fisher Scientific Ryu et al., 2010 | C18100 | GS115 |
| Biological sample (Xenopus laevis) | Xenopus | NASCO | LM00531RRID:XEP_Xla100 | Female, adult frogs |
| Biological sample (Xenopus laevis) | Xenopus | NASCO | LM00715RRID:XEP_Xla100 | Male, adult frogs |
| Antibody | Anti-H3 (rabbit polyclonal) | Abcam | RRID:AB_302613 | WB (1 µg/ml) |
| Antibody | Anti-H2B (rabbit polyclonal) | Abcam | RRID:AB_302612 | WB (1 µg/ml) |
| Antibody | Anti α-tubulin (mouse monoclonal) | Sigma-Aldrich | RRID:AB_477593 | WB (1:10000) |
| Antibody | Anti-H1.8 (rabbit polyclonal) | Jenness et al., 2018 | RU1974 | WB (1 µg/ml) |
| Antibody | Anti-TOP2A (rabbit polyclonal) | Ryu et al., 2010 | NA | WB (2 µg/ml)IF (1 µg/ml) |
| Antibody | Anti-CAP-G (rabbit polyclonal) | Zierhut et al., 2014 | RU1008 | WB (2 µg/ml)IF (2 µg/ml) |
| Antibody | Alexa 488-anti-CAP-G (rabbit polyclonal) | This study | NA | IF (4 µg/ml),refer to ‘Antibodies’ section in Methods |
| Antibody | Anti-CAP-D2 (rabbit polyclonal) | Hirano et al., 1997 | NA | WB (2 µg/ml) |
| Antibody | Anti-CAP-G2 (rabbit polyclonal) | Gift from S. Rankin | OMRF195 | WB (4 µg/ml)IF (4 µg/ml) |
| Antibody | Anti-CAP-D3 (rabbit polyclonal) | This study | RU2042 | WB (2 µg/ml),refer to ‘Antibody production’ section in Methods |
| Antibody | Anti- CENP-A (rabbit polyclonal) | Wynne and Funabiki, 2015 | NA | IF (4 µg/ml) |
| Antibody | IRDye 680 LT anti-mouse IgG(H + L) (goat polyclonal) | LI-COR Biosciences | RRID:AB_2687826 | WB (1:10,000) |
| Antibody | IRDye 680 LT anti-rabbit IgG(H + L) (goat polyclonal) | LI-COR Biosciences | RRID:AB_621841 | WB (1:10,000) |
| Antibody | IRDye 800 CW anti-mouse IgG(H + L) (goat polyclonal) | LI-COR Biosciences | RRID:AB_621842 | WB (1:10,000) |
| Antibody | IRDye 800 CW anti-rabbit IgG(H + L) (goat polyclonal) | LI-COR Biosciences | RRID:AB_2687826 | WB (1:10,000) |
| Antibody | IRDye 800 CW anti-mouse IgG(H + L) (goat polyclonal) | LI-COR Biosciences | RRID:AB_621843 | WB (1:10,000) |
| Antibody | Anti-rabbit Alexa 555 (goat polyclonal) | Thermo Fisher Scientific | RRID:AB_141784 | IF (1:1000) |
| Antibody | Anti-rabbit Alexa 555 (goat polyclonal) | Jackson Immunoresearch | RRID:AB_2338079 | IF (1:250) |
| Antibody | Anti-rabbit Alexa 488 F(ab’)2 fragment (goat polyclonal) | LifeScience Technologies | RRID:AB_142134 | IF (1:1000) |
| Chemical compound, drug | Nocodazole | Sigma-Aldrich | M1404 | 10 µg/ml |
| Chemical compound, drug | ICRF-193 | Santa Cruz Biotechnology | sc-200889 | 50/500 µM |
| Other | Dynabeads-Protein A | Thermo Fisher Scientific | 100-08D | 250 ng antibody/1 µl beads |
| Other | Dynabeads-M280 Streptavidin | Thermo Fisher Scientific | 11206D | NA |
| Software, algorithm | MATLAB | MathWorks | R2019A | NA |
| Peptide, recombinant protein | DpnII | NEB | R0543 | |
| Peptide, recombinant protein | DNA polymerase I, large (Klenow) fragment | NEB | M0210S | |
| Peptide, recombinant protein | T4 DNA ligase 1 U/µl | Invitrogen | 15224090 | |
| Peptide, recombinant protein | T4 DNA polymerase | NEB | M0203L | |
| Peptide, recombinant protein | T4 polynucleotide kinase | NEB | M0201 | |
| Peptide, recombinant protein | Biotin-14-dATP | Invitrogen | 19524016 | |
| Commercial assay or kit | TruSeq Nano DNA Sample Prep Kit | Illumina | 20015964 | |
| Peptide, recombinant protein | Klenow fragment (3′ → 5′ exo-) | NEB | M0212L |
Additional files
Download links
A two-part list of links to download the article, or parts of the article, in various formats.
Downloads (link to download the article as PDF)
Open citations (links to open the citations from this article in various online reference manager services)
Cite this article (links to download the citations from this article in formats compatible with various reference manager tools)
Linker histone H1.8 inhibits chromatin binding of condensins and DNA topoisomerase II to tune chromosome length and individualization
eLife 10:e68918.
https://doi.org/10.7554/eLife.68918


