REST/NRSF drives homeostatic plasticity of inhibitory synapses in a target-dependent fashion
- Department of Experimental Medicine, University of Genova, Italy
- Center for Synaptic Neuroscience and Technology, Istituto Italiano di Tecnologia, Italy
- Department of Clinical and Experimental Epilepsy, UCL Queen Square Institute of Neurology, Queen Square House, United Kingdom
- IRCCS, Ospedale Policlinico San Martino, Italy
Figures
Figure 1 with 2 supplements
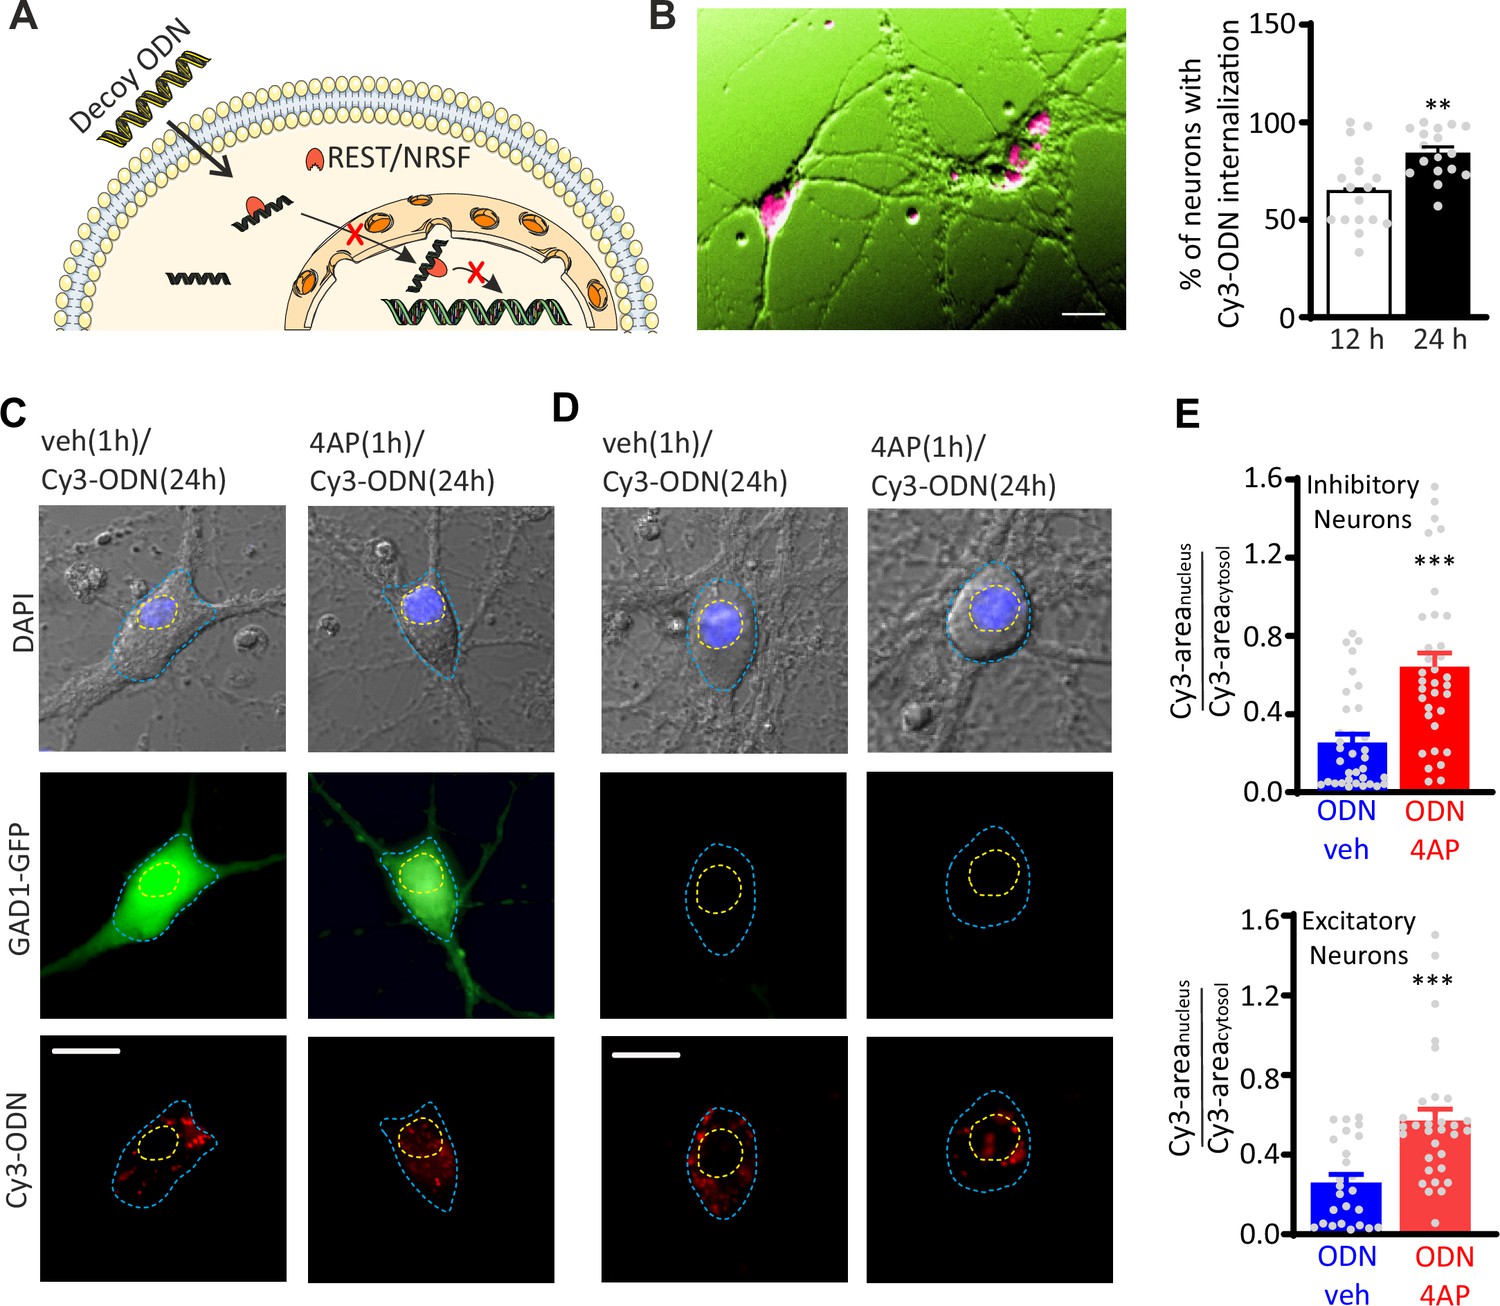
Hyperactivity induces REST translocation to the nucleus in both inhibitory and excitatory neurons.
(A) Schematic representation of the ODN action. Having a complementary sequence to RE1, ODN binds REST, thus abrogating its capability to modulate its transcriptional activity. (B) Left: Primary hippocampal neurons (16–18 div) were incubated for 12 and 24 hr with Cy3-tagged ODN (Cy3-ODN, 200 nM). Right: Cy3-ODN efficiently permeated into primary hippocampal neurons. The bar plot shows the mean (± SEM) percentage of neurons that internalized Cy3-ODN after 12 and 24 hr of incubation (n=17 fields from two independent preparations; **p<0.01; unpaired Student’s t-test). (C–E) Tracking of Cy3-ODN reveals both cytoplasmic and nuclear localizations of REST and its nuclear translocation upon hyperactivity in both excitatory and inhibitory neurons. (C, D) Representative fluorescence images of hippocampal GFP-positive inhibitory (left) and GFP-negative excitatory (right) neurons (17 div) treated with either vehicle or 4AP for 1 hr and subsequently labeled with Cy3-ODN for 24 hr. (E) Bar plots represent the mean± SEM of the REST partition ratio between cytosol and nucleus (Cy3-areanucleus/Cy3-areacytosol) in inhibitory (upper panel; ODN/veh n=33; ODN/4AP n=34) and excitatory (lower panel; ODN/veh n=25; ODN/4AP=32) neurons. ***p<0.001; Mann–Whitney U-test. Scale bars: 20 µm (B), 10 µm (C, D). Data for (B) and (E) can be found in Figure 1—source data 1.
-
Figure 1—source data 1
Source data for Figure 1.
- https://cdn.elifesciences.org/articles/69058/elife-69058-fig1-data1-v1.pdf
Figure 1—figure supplement 1
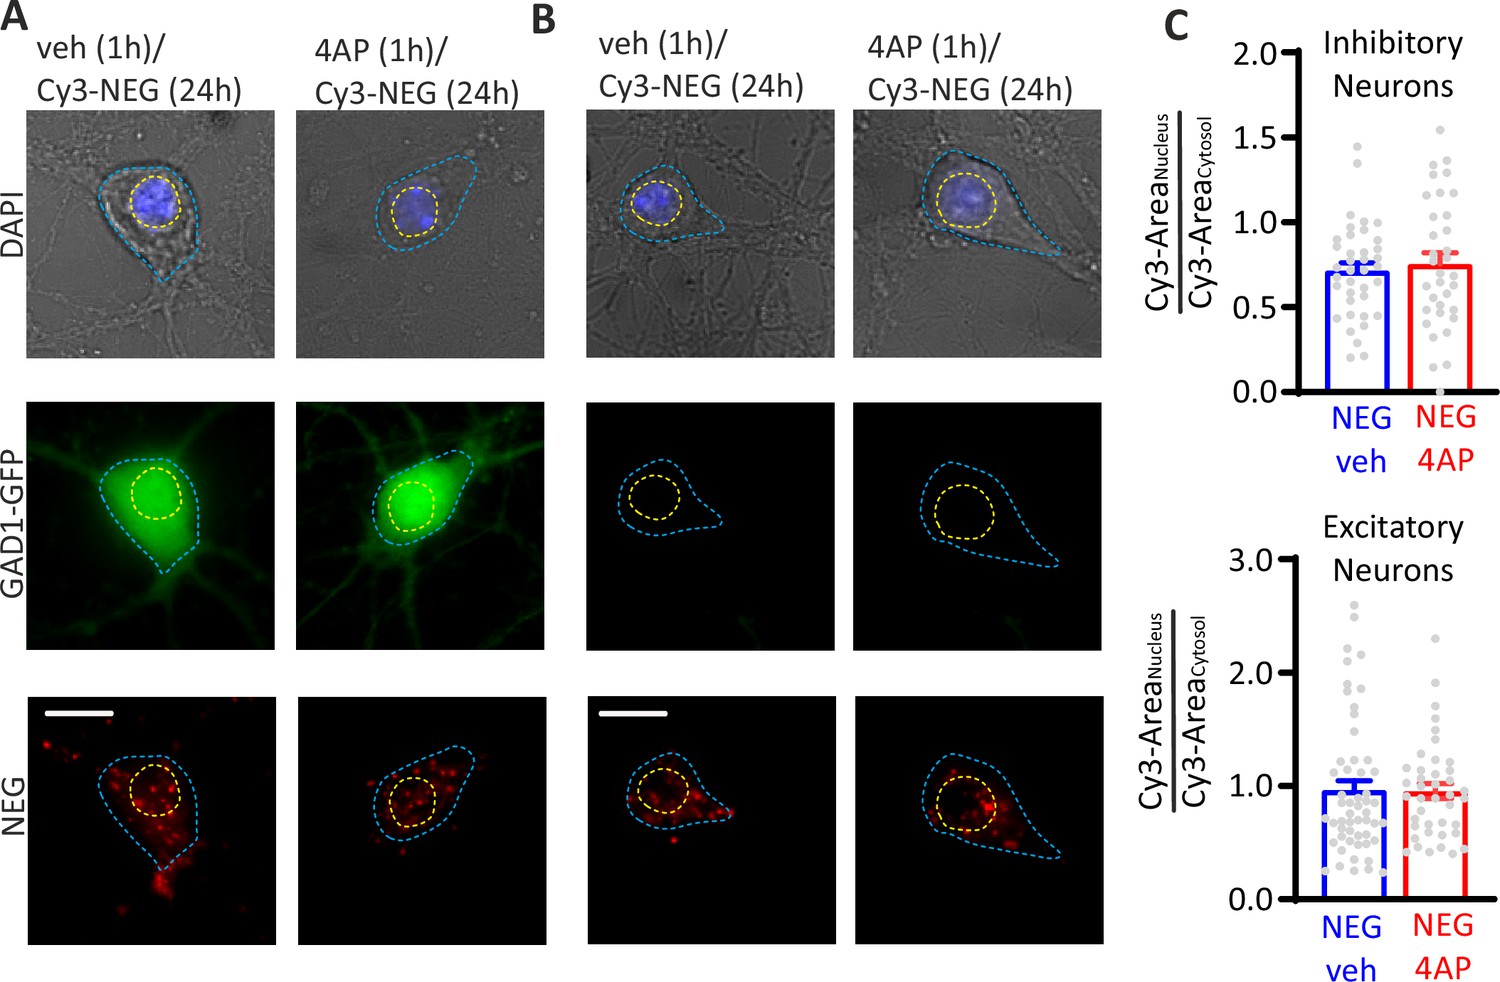
A scrambled version of ODN (Cy3-NEG) does not translocate to the nucleus on hyperactivity.
Staining for Cy3-NEG revealed similar cytoplasmic and nuclear localization independently of the 4AP treatment. (A, B) Representative fluorescence images of hippocampal GFP-positive inhibitory (A) and GFP-negative excitatory (B) neurons treated at 17 div with either vehicle or 4AP for 1 hr and subsequently labeled with Cy3-NEG for 24 hr. Scale bar, 20 µm. (C) Bar plots (means± SEM) represent Cy3-NEG partition between cytosol and nucleus (Cy3-areanucleus/Cy3-areacyto) in inhibitory (upper panel; NEG/veh n=38; NEG/4AP n=34) and excitatory (lower panel; NEG/veh n=54; NEG/4AP n=41) neurons. p=0.82 and p=0.47, respectively; Mann–Whitney U-test. Data for (C) can be found in .
Figure 1—figure supplement 2
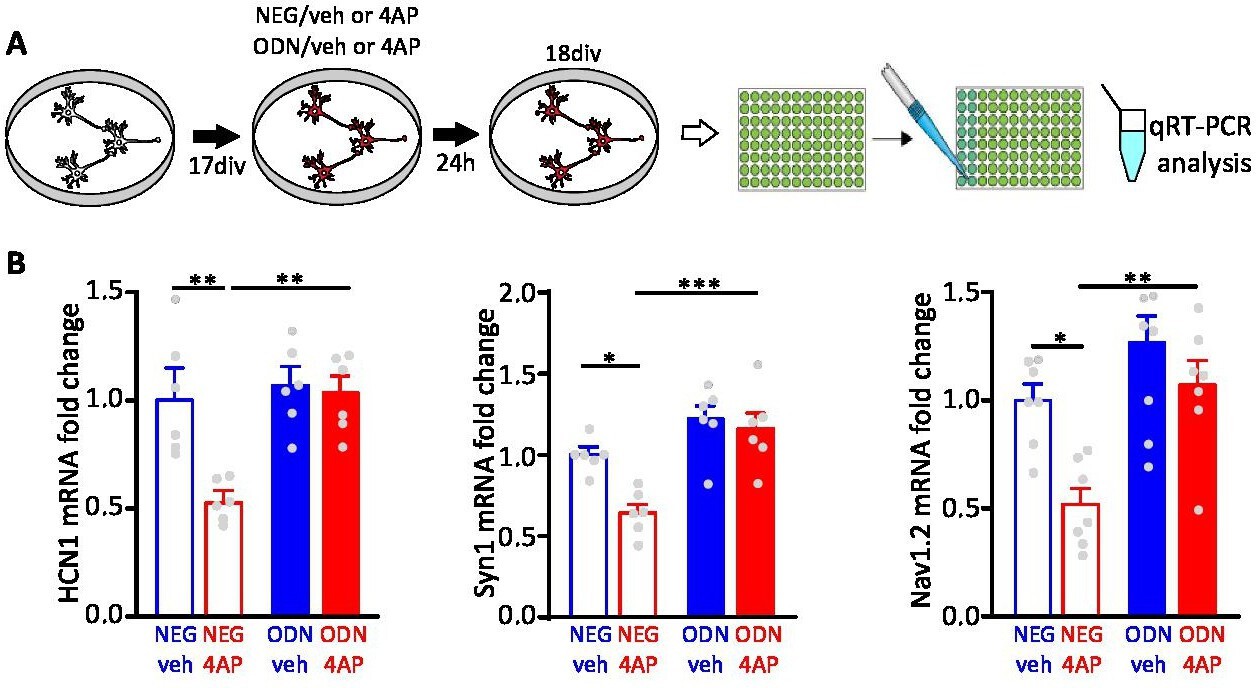
Treatment with ODN blocks the repression of REST target genes upon hyperactivity.
(A) Schematics of the experimental protocol. Primary hippocampal neurons (16–18 div) were treated with ODN (200 nM) in the presence or absence of 4AP (100 µM) for 24 hr before qRT-PCR analysis. (B) 4AP treatment downregulates the mRNA levels of the REST target genes: Hcn1, Scn2a, and Syn1. The effect was suppressed by ODN, demonstrating its ability to inhibit REST transcriptional silencing triggered by neuronal hyperactivity. Bar plots show the fold changes (means± SEM) in Hcn1, Syn1, and Scn2a mRNAs in cortical neurons treated with NEG/vehicle, NEG/4AP, ODN/vehicle, or ODN/4AP for 24 hr (6<n<7 from three independent neuronal preparations). *p<0.05, **p<0.01, ***p<0.001; two-way ANOVA/Tukey’s tests. Data for (B) can be found in Figure 1—figure supplement 2—source data 1.
-
Figure 1—figure supplement 2—source data 1
Source data for Figure 1—figure supplement 2.
- https://cdn.elifesciences.org/articles/69058/elife-69058-fig1-figsupp2-data1-v1.pdf
Figure 2
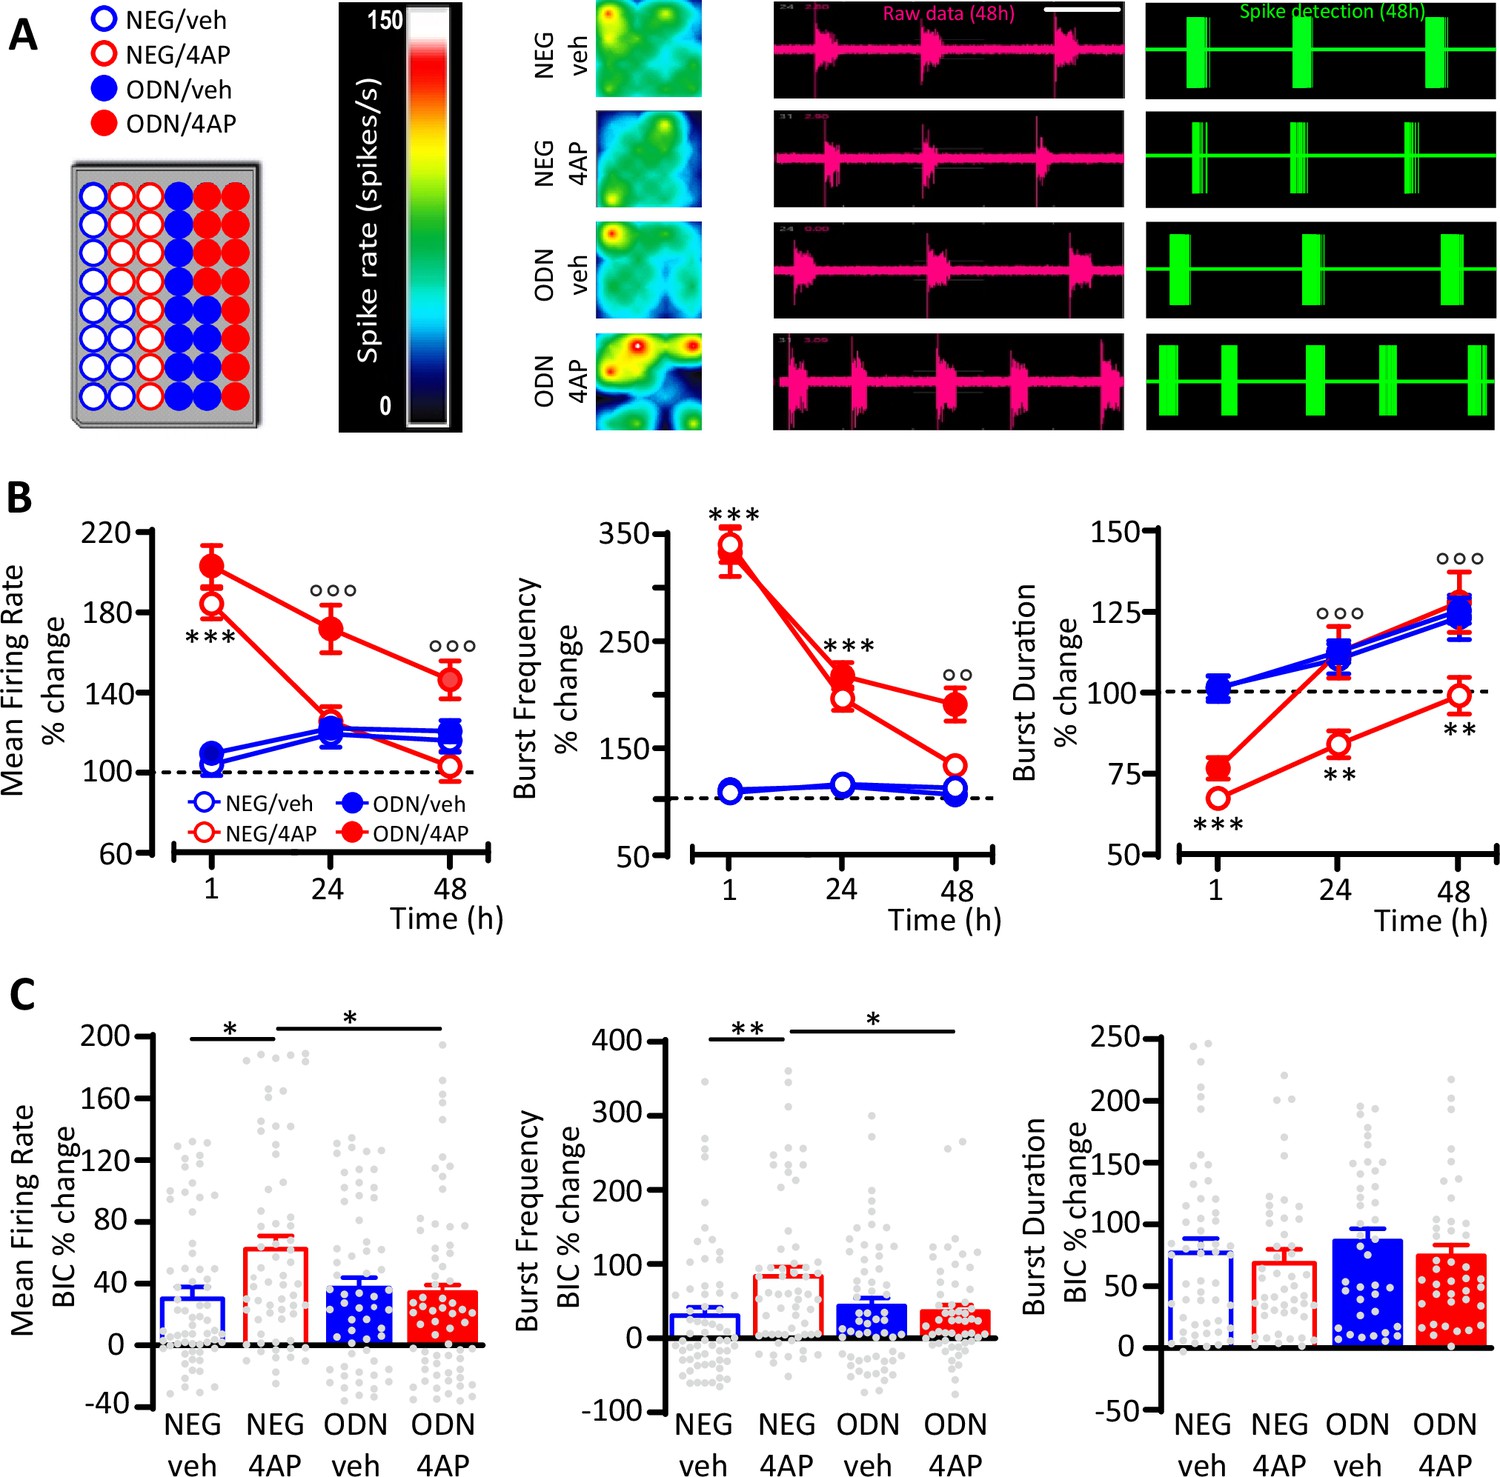
GABAergic transmission contributes to the REST-dependent homeostatic response to hyperactivity.
(A) Left panel: Representative MEA plate-map showing treatment group assignment (NEG/vehicle; NEG/4AP; ODN/vehicle; ODN/4AP). Right panels: Firing rate heat maps (left), raw voltage recordings from individual electrodes (middle) and corresponding spike detection results (right), for representative wells of the four experimental groups maintained for 48 hr in 4AP. (B) Mean firing rate (MFR) (left), bursting rate (middle) and burst duration (BD) (right) are expressed in percent of the NEG/veh baseline as a function of time after the onset of the treatments (1, 24, and 48 hr). **p<0.01, ***p<0.001 NEG/veh versus NEG/4AP; °°p<0.01, °°°p<0.001 NEG/4AP versus ODN/4AP; two-way ANOVA/Tukey’s tests. (C) Percent increases in MFR (left), burst frequency (middle), and BD (right) induced by BIC (30 μM) after 48 hr of the indicated treatments. *p<0.05, **p<0.01; two-way ANOVA/Tukey’s tests. Data are means± SEM (panel (B), 78<n<59; panel (C), 65<n<45 MEA wells for NEG/veh, NEG/4AP; ODN/veh and ODN/4AP, from n=7 independent neuronal preparations). Data for (B) and (C) can be found in Figure 2—source data 1.
-
Figure 2—source data 1
Source data for Figure 2.
- https://cdn.elifesciences.org/articles/69058/elife-69058-fig2-data1-v1.pdf
Figure 3
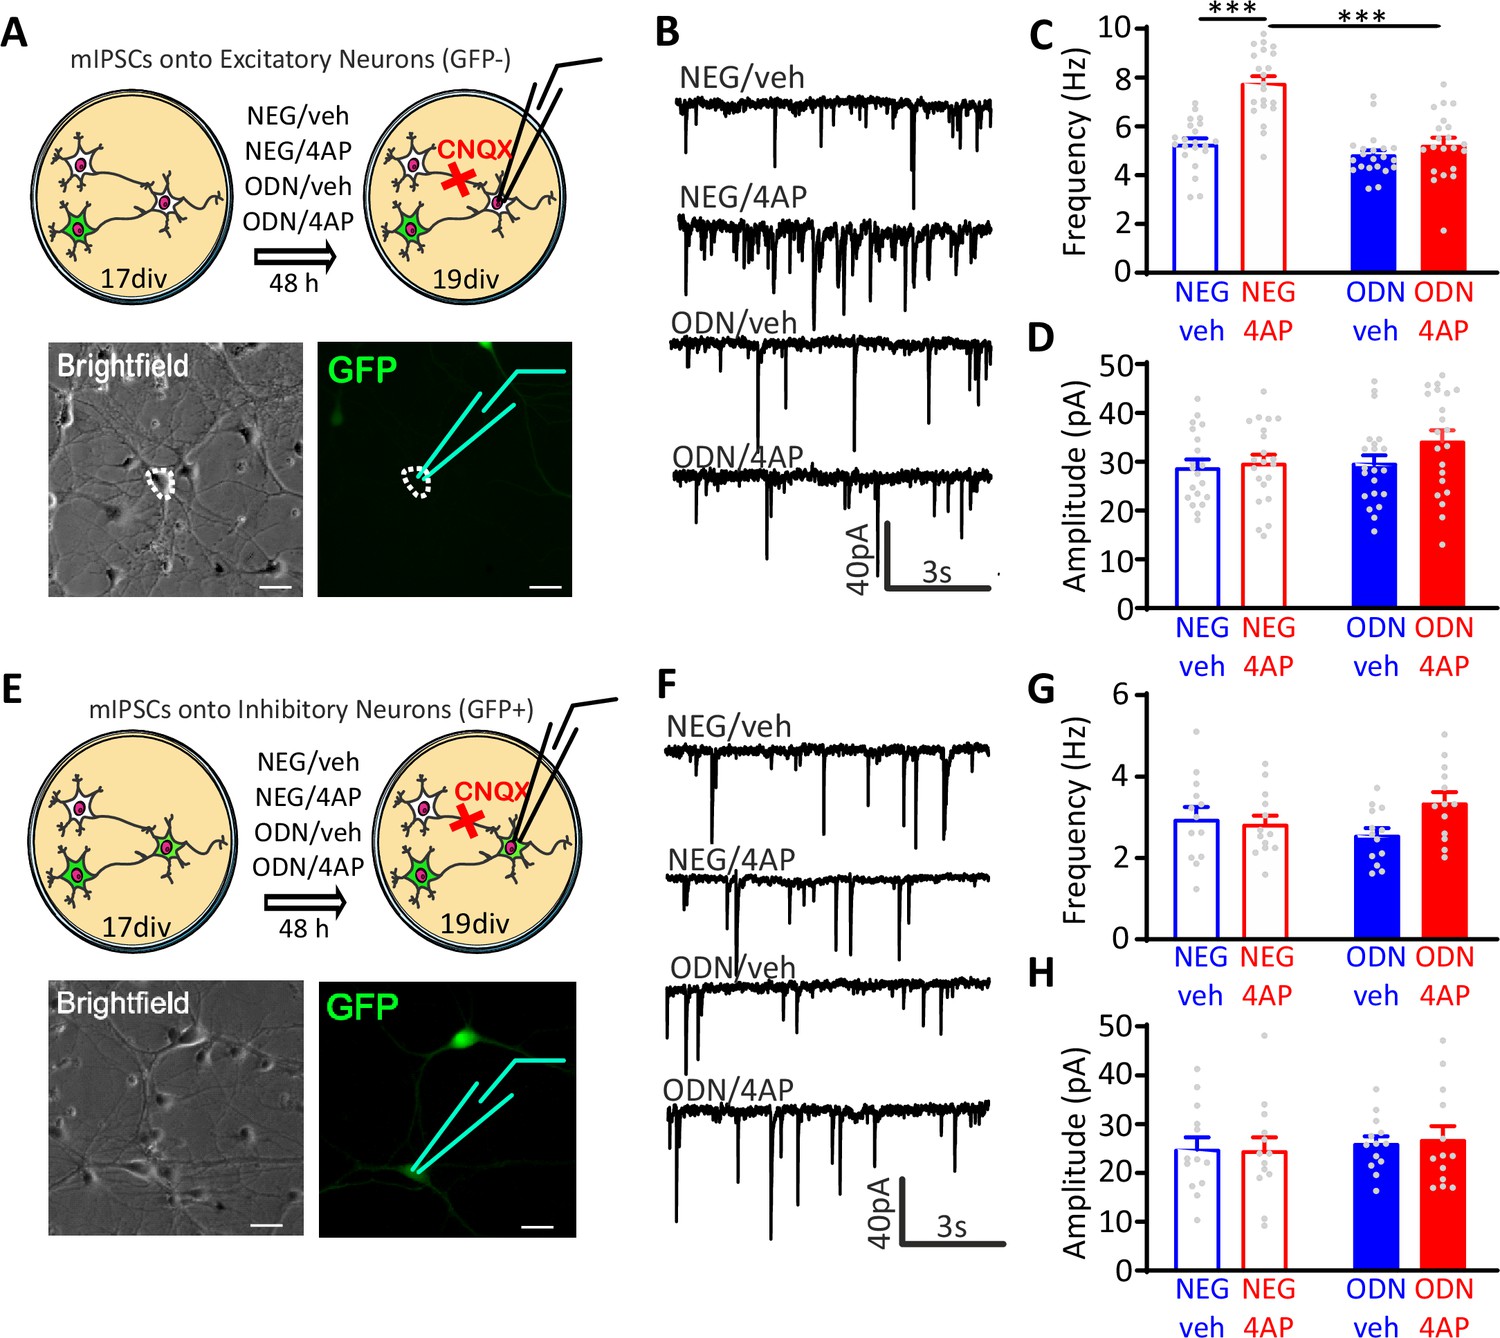
Neuronal hyperactivity selectively increases the frequency of mIPSCs in excitatory neurons in a REST-dependent fashion.
(A) Schematic representation and representative microphotographs of a patched GFP-negative excitatory neuron. (B–D) Representative mIPSC traces (B) recorded at 19 div in the four experimental groups after 48 hr of treatment. Means± SEM of mIPSC frequency (C) and amplitude (D) of NEG/vehicle (n=21), NEG/4AP (n=21), ODN/vehicle (n=21), and ODN/4AP (n=21) treated neurons. (E) Schematic representation and representative microphotograph of a patched GFP-positive inhibitory neuron. (F–H) Representative mIPSC traces (F) recorded at 19 div in the four experimental groups after 48 hr of treatment. Mean (± SEM) IPSC frequency (G) and amplitude (H) of NEG/vehicle (n=13), NEG/4AP (n=13), ODN/vehicle (n=13), and ODN/4AP (n=13) treated neurons. ***p<0.001, two-way ANOVA/Tukey’s tests. Scale bars, 30 µm. Data for (C), (D), (G), and (H) can be found in Figure 3—source data 1. mIPSC, miniature inhibitory postsynaptic current.
-
Figure 3—source data 1
Source data for Figure 3.
- https://cdn.elifesciences.org/articles/69058/elife-69058-fig3-data1-v1.pdf
Figure 4 with 1 supplement
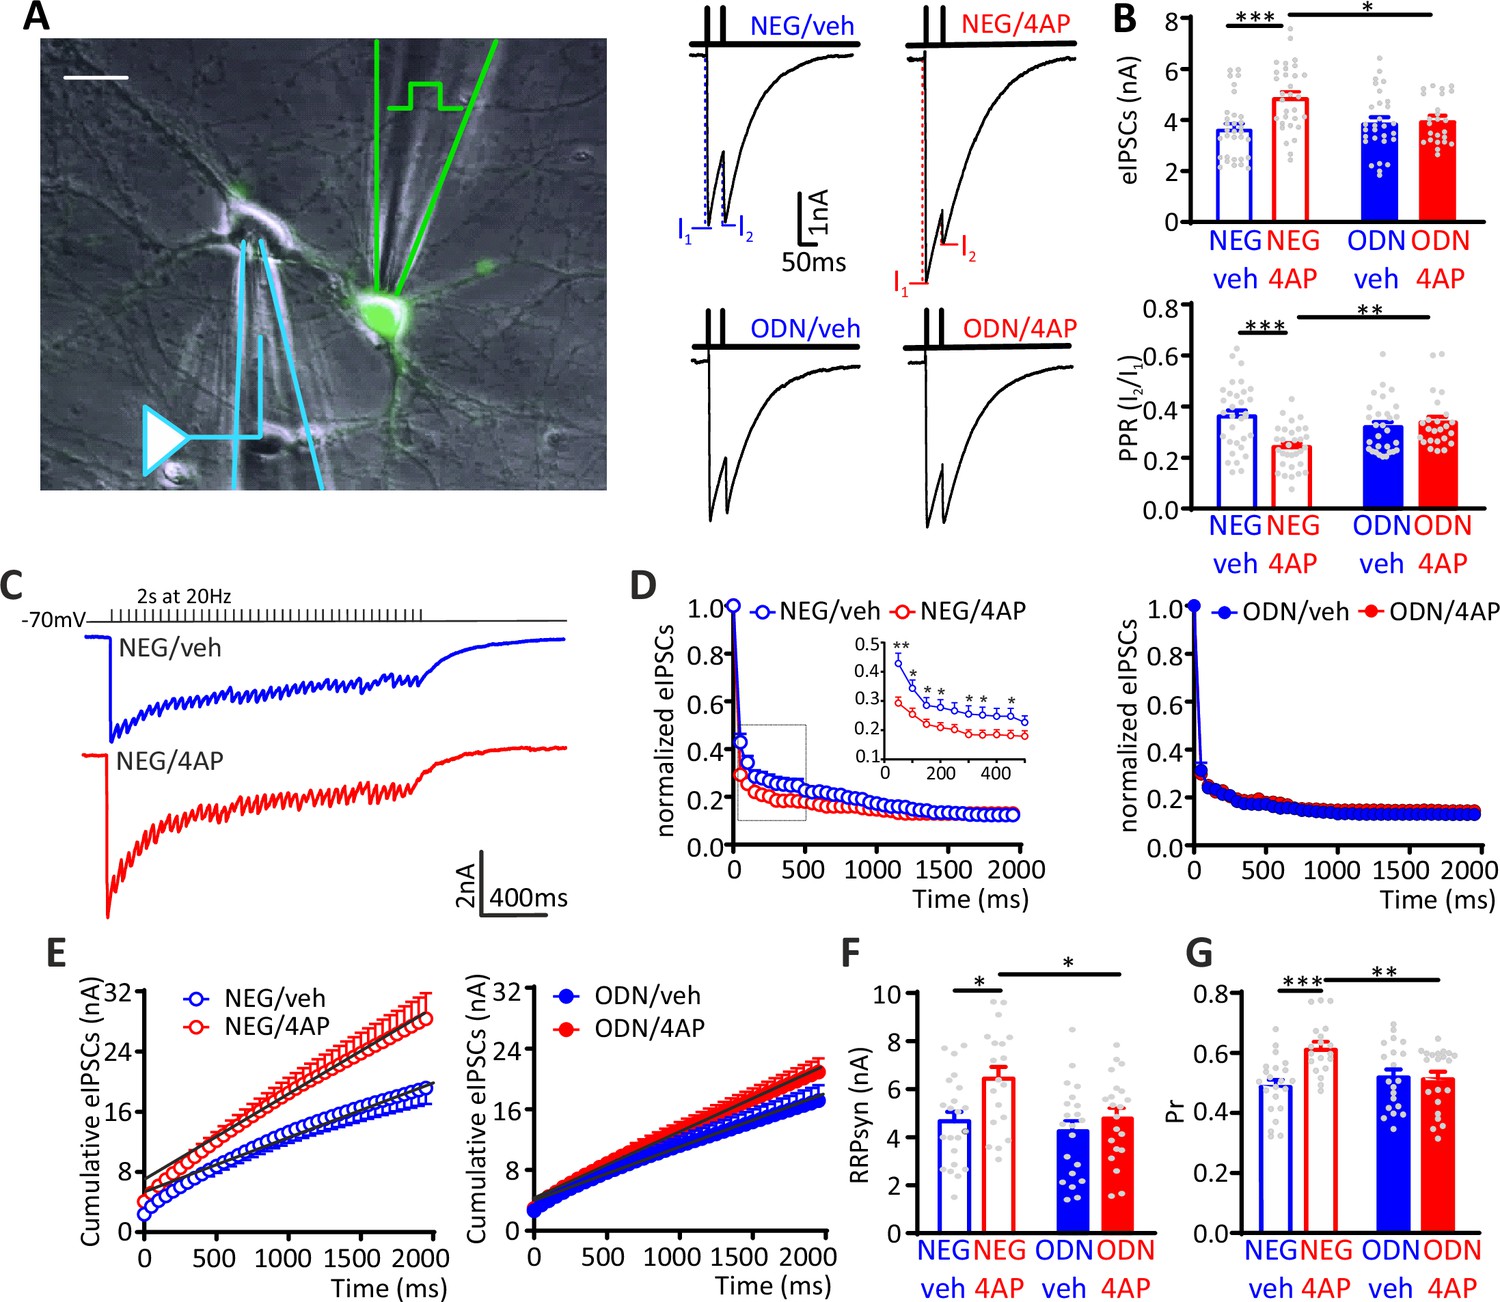
The hyperactivity-induced upscaling of eIPSCs is specific for excitatory neurons and mediated by a REST-dependent increase in RRPsyn and Pr.
(A) Left: Experimental setup showing the stimulation electrode located on a GFP-positive GABAergic neuron and the recording electrode patching a GFP-negative excitatory neuron. Scale bar, 20 µm. Right: Representative eIPSCs evoked by a paired-pulse stimulation protocol (interpulse interval, 50 ms). (B) The amplitude of the first eIPSC in the pair (top) and the paired-pulse ratio (PPR=I2/I1; bottom) of NEG/vehicle (n=32), NEG/4AP (n=31), ODN/vehicle (n=29), or ODN/4AP (n=24) treated neurons are shown as means± SEM. (C–G) Quantal analysis of RRPsyn and Pr in GABAergic synapses onto excitatory neurons. (C) Representative eIPSC traces evoked by a 2-s tetanic stimulation at 20 Hz in NEG-treated neurons in the absence (blue) or presence (red) of 4AP. (D) Averaged plot of normalized eIPSC amplitude versus time during the tetanic stimulation. The inset shows the boxed area in an expanded time scale. (E) Averaged cumulative profiles of eIPSCs. To calculate RRPsyn, data points in the 1–2 s range were fitted by linear regression and back extrapolated to time 0. (F, G) Means (± SEM) of the individual values of RRPsyn (F) and Pr (G) of NEG/vehicle (n=22), NEG/4AP (n=19), ODN/vehicle (n=21), or ODN/4AP (n=21) treated neurons. *p<0.05, **p<0.01, ***p<0.001; two-way ANOVA/Tukey’s tests. Data for (B), (D), (E), (F), and (G) can be found in Figure 4—source data 1. eIPSC, evoked postsynaptic inhibitory current.
-
Figure 4—source data 1
Source data for Figure 4.
- https://cdn.elifesciences.org/articles/69058/elife-69058-fig4-data1-v1.pdf
Figure 4—figure supplement 1
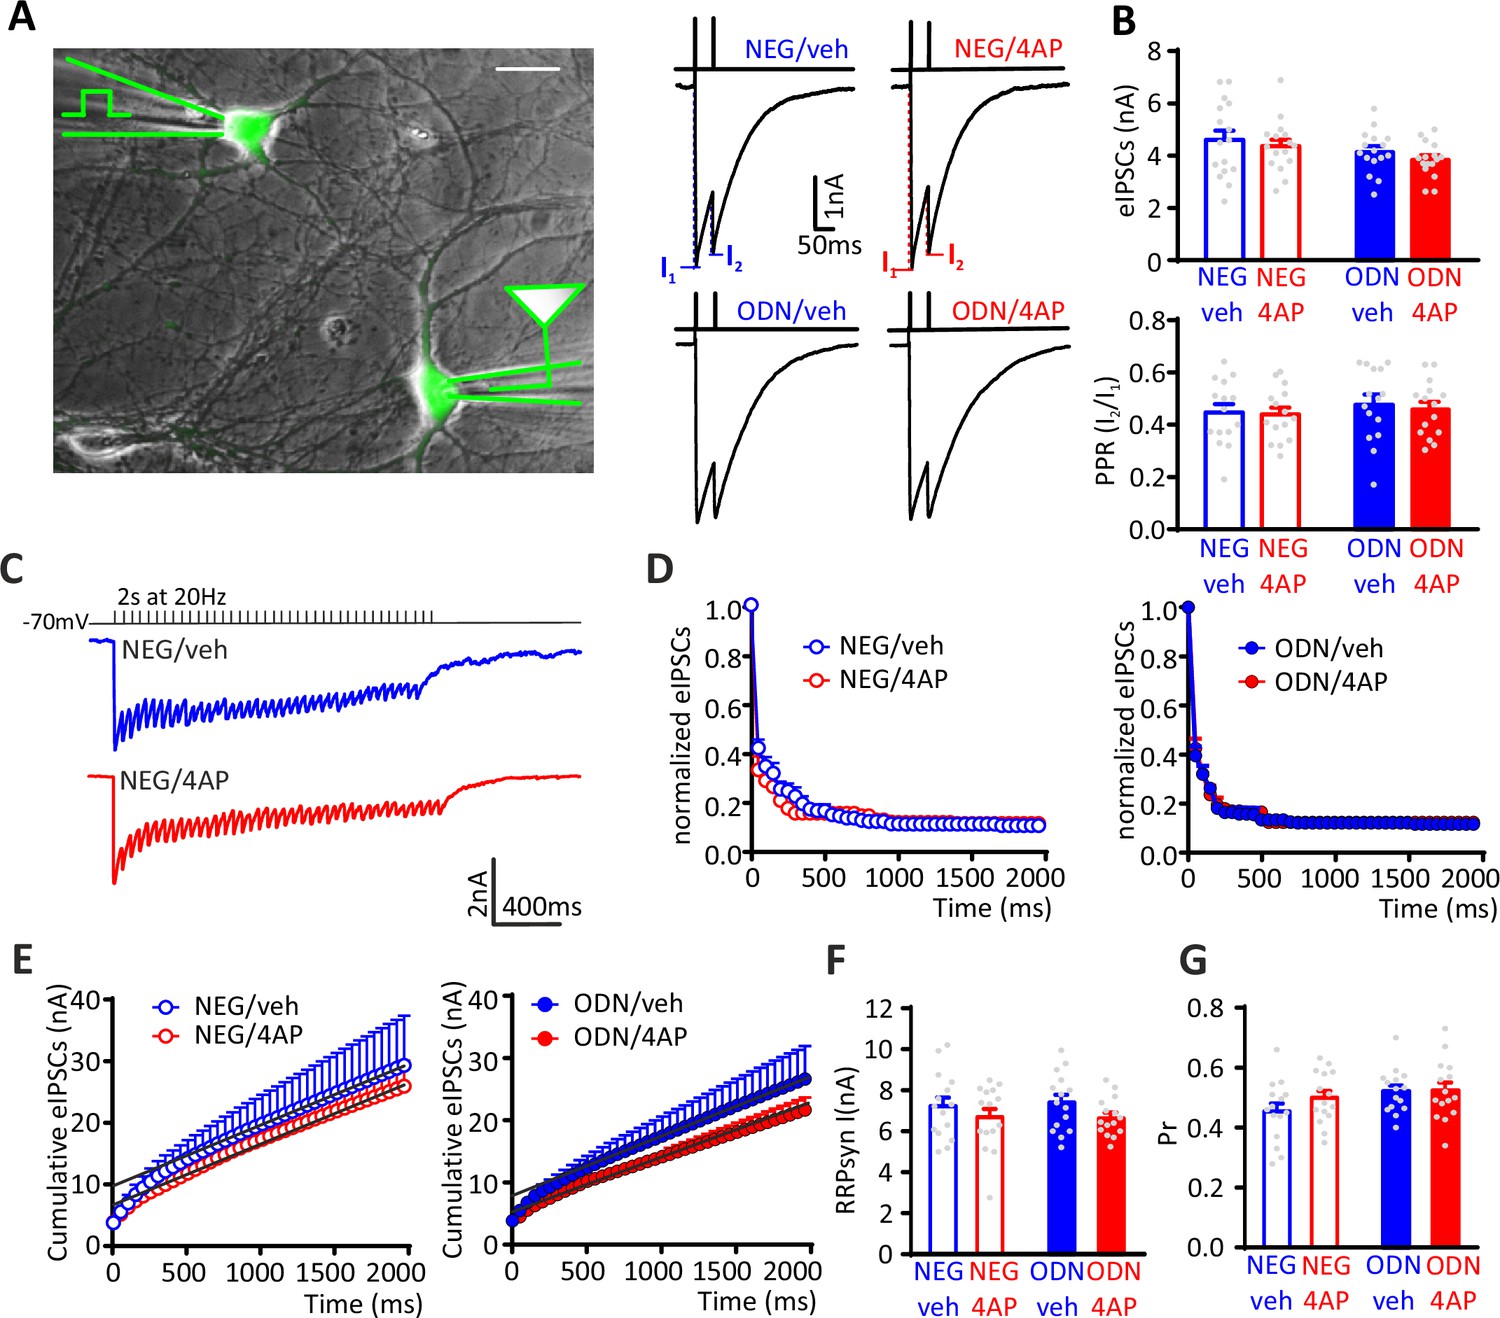
eIPSCs recorded in inhibitory interneurons are not homeostatically modulated by neuronal hyperactivity.
(A) Left: Experimental setup showing the stimulation electrode located on a GFP-positive GABAergic neuron and the recording electrode patching a mono-synaptically connected GFP-positive inhibitory neuron. Scale bar, 20 µm. Right: Representative eIPSCs evoked by a paired-pulse stimulation protocol (interpulse interval=50 ms). (B) Lack of effect of 4AP on the amplitude of the first eIPSC in the pair (top) and the PPR (bottom) of NEG/vehicle (n=15), NEG/4AP (n=15), ODN/vehicle (n=15), and ODN/4AP (n=15) treated inhibitory neurons. Data are means± SEM. (C–G) Quantal analysis of RRPsyn and Pr in GABAergic synapses onto inhibitory neurons. (C) Representative eIPSC traces evoked by a 2-s tetanic stimulation at 20 Hz in NEG/veh- (blue) and NEG/4AP-treated neurons (red). (D) Averaged plot of normalized eIPSC amplitude versus time during the tetanic stimulation. (E) Averaged cumulative profiles of the eIPSCs. To calculate the RRPsyn, data points in the 1–2 s range were fitted by linear regression and back extrapolated to time 0. (F, G) Means (± SEM) of the individual values of RRPsyn (F) and Pr (G) of NEG/vehicle (n=15), NEG/4AP (n=15), ODN/vehicle (n=15), and ODN/4AP (n=15) treated inhibitory neurons. No significant differences were found by two-way ANOVA/Tukey’s tests. Data for (B), (F), and (G) can be found in Figure 4—figure supplement 1—source data 1. eIPSC, evoked postsynaptic inhibitory current.
-
Figure 4—figure supplement 1—source data 1
Source data for Figure 4—figure supplement 1.
- https://cdn.elifesciences.org/articles/69058/elife-69058-fig4-figsupp1-data1-v1.pdf
Figure 5 with 2 supplements
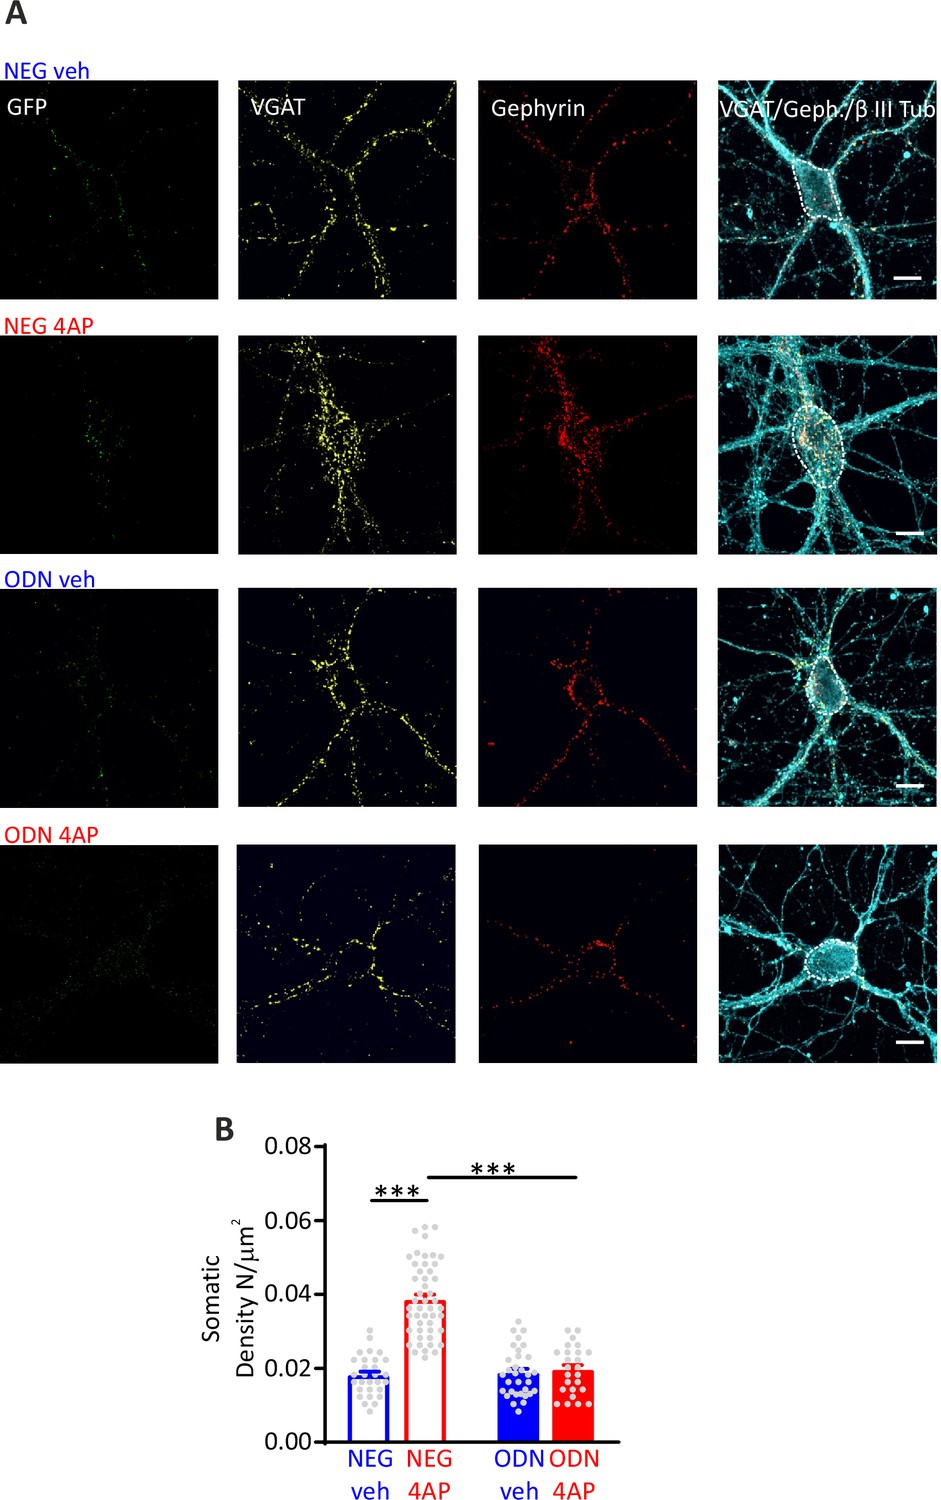
Hyperactivity induces a REST-dependent specific increase of perisomatic inhibitory synapses onto excitatory neurons.
(A) Representative microphotographs showing GFP-negative excitatory neurons (20 div), treated with NEG/ctrl, NEG/4AP, ODN/veh, and ODN/4AP, labeled with β3-tubulin (light blue) and decorated with gephyrin (red) and VGAT (yellow) antibodies to identify GABAergic synapses. White lines highlight somatic areas. Scale bars, 10 µm. (B) Quantification of the density of somatic inhibitory synapses onto excitatory neurons. Data are means± SEM of 48<n<25, respectively, from three independent neuronal preparations. ***p<0.001; two-way ANOVA/Tukey’s tests. Data for (B) can be found in Figure 5—source data 1.
-
Figure 5—source data 1
Source data for Figure 5.
- https://cdn.elifesciences.org/articles/69058/elife-69058-fig5-data1-v1.pdf
Figure 5—figure supplement 1
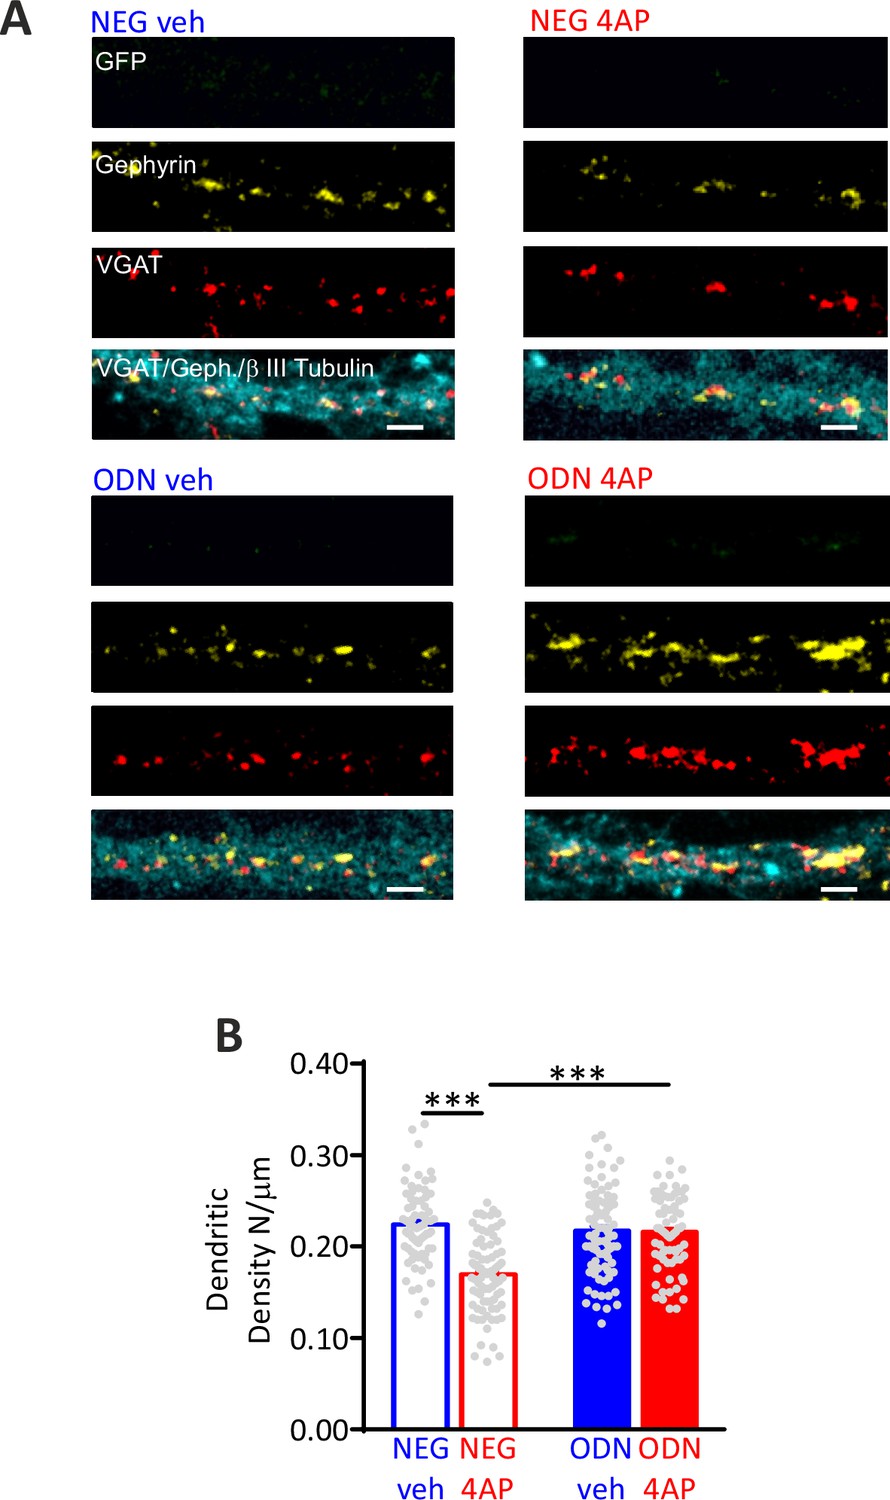
Hyperactivity induces a REST-dependent decrease of dendritic inhibitory synapses onto excitatory neurons.
(A) Representative microphotographs showing GFP-negative excitatory dendritic processes (20 div), treated with NEG/ctrl, NEG/4AP, ODN/veh, and ODN/4 A, labeled with β3-tubulin (light blue) and decorated with gephyrin (red) and VGAT (yellow) antibodies to identify GABAergic synapses. Scale bars, 2 µm. (B) Quantification of the density inhibitory synapses onto excitatory dendrites. Data are means± SEM of 87<n<71, from three independent neuronal preparations. ***p<0.001; two-way ANOVA/Tukey’s tests. Data for (B) can be found in Figure 5—figure supplement 1—source data 1.
-
Figure 5—figure supplement 1—source data 1
Source data for Figure 5—figure supplement 1.
- https://cdn.elifesciences.org/articles/69058/elife-69058-fig5-figsupp1-data1-v1.pdf
Figure 5—figure supplement 2
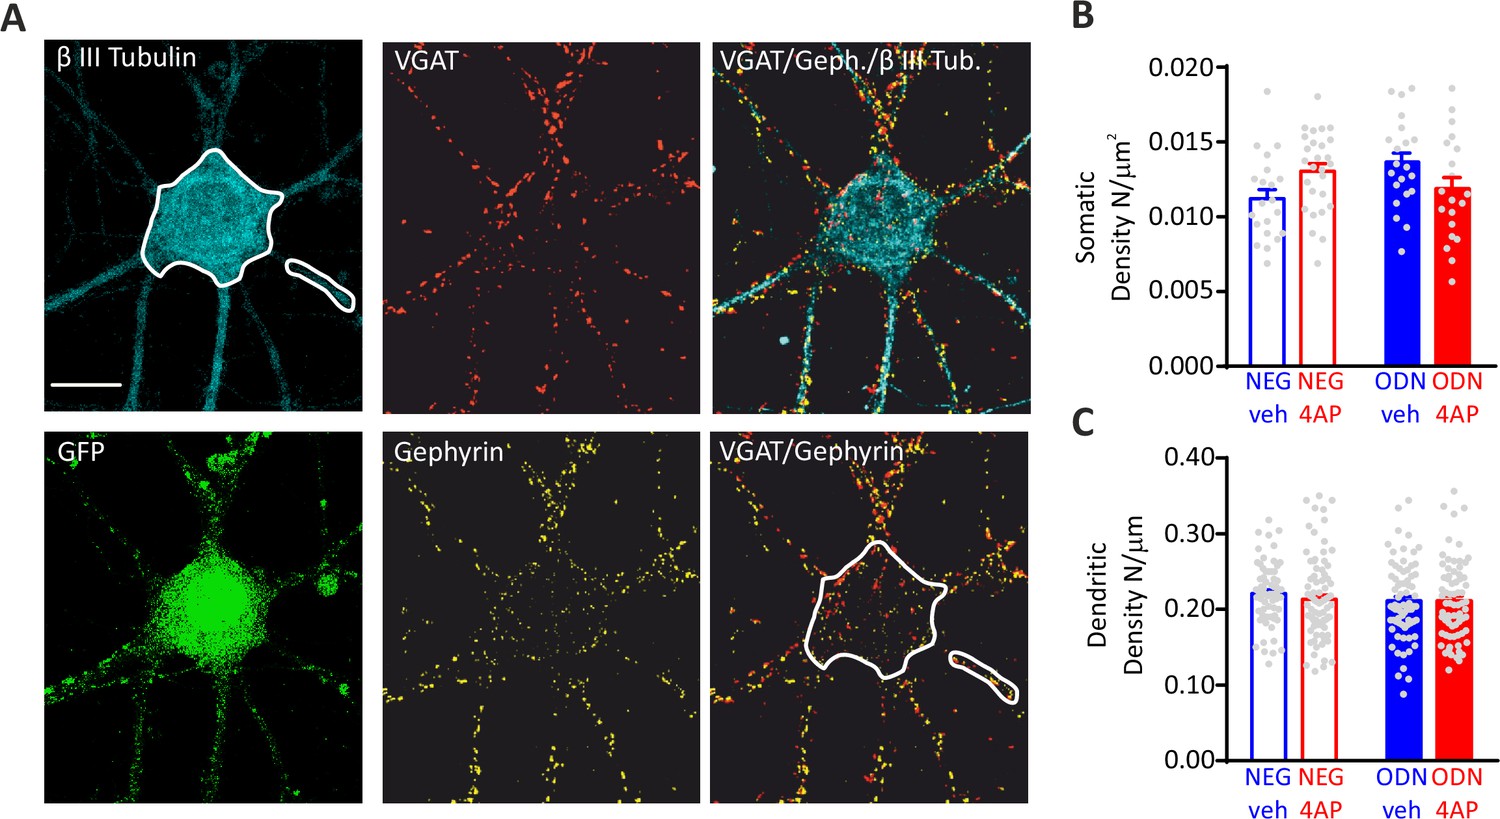
Hyperactivity does not affect the density of inhibitory synapses onto inhibitory neurons.
(A) Representative microphotographs showing a 20 div GFP-positive inhibitory neuron, treated with NEG/ctrl, labeled with β3-tubulin (light blue) and decorated with gephyrin (red) and VGAT (yellow) antibodies to identify GABAergic synapses. White lines highlight somatic and dendritic areas. Scale bar, 10 µm. (B, C) Quantification of the density of perisomatic (B) and dendritic (C) inhibitory synapses onto inhibitory neurons. Data are means± SEM of 27<n<20 and 87<n<67 for perisomatic and axodendritic synapses, respectively, from three independent neuronal preparations. No significant differences were found by two-way ANOVA/Tukey’s tests. Data for (B) and (C) can be found in Figure 5—figure supplement 2—source data 1.
-
Figure 5—figure supplement 2—source data 1
Source data for Figure 5—figure supplement 2.
- https://cdn.elifesciences.org/articles/69058/elife-69058-fig5-figsupp2-data1-v1.pdf
Figure 6

BDNF specifically potentiates GABAergic synapses onto excitatory neurons in response to hyperactivity.
(A) Time-course of Rest, cds-Bdnf, and Syt4 mRNA fold changes in control (blue symbols) and 4AP-treated (red symbols) cortical neurons treated for various times with 4AP. All 4AP-treated samples were collected at 20 div after 6, 24,48, and 96 hr of 4AP treatment, respectively. The control sample was also collected at 20 div without any prior treatment. For each time point, data are means± SEM of 9<n<10 from three independent neuronal preparations. *p<0.05, **p<0.01, ***p<0.001 versus control; one-way ANOVA/Dunnett’s tests. (B) RT-qPCR analysis of changes (means± SEM) of Rest and cds-Bdnf mRNA transcript levels in control (blue symbols) and 4AP-treated (red symbols; 24 and 48 hr) neurons that had been infected with either scrRNA (open symbols) or shRNA (closed symbols) viruses. Treatments were performed as described in (A), with neurons collected at 20 div. For each time point, data are means± SEM of 9<n<10 from three independent neuronal preparations. *p<0.05, ***p<0.001 shRNA versus scrRNA; op<0.05, ooop<0.001 4AP-treated versus control; two-way ANOVA/Tukey’s tests. (C) Representative eIPSCs onto GFP-negative excitatory neurons in response to paired-pulse stimulation recorded in ctrl/veh, ctrl/4AP, TrkB-fc/veh and TrkB-fc/4AP treated neurons. (D) Mean (± SEM) amplitude of the first eIPSC (I1; left) and paired-pulse ratio (PPR=I2/I1; right) of ctrl/veh (n=43), ctrl/4AP (n=39), TrkB-fc/veh (n=44), and TrkB-fc/4AP (n=43) treated neurons. *p<0.05, ***p<0.001, two-way ANOVA/Tukey’s tests. Data for (A) and (B) can be found in Figure 6—source data 1.
-
Figure 6—source data 1
Source data for Figure 6.
- https://cdn.elifesciences.org/articles/69058/elife-69058-fig6-data1-v1.pdf
Figure 7 with 3 supplements
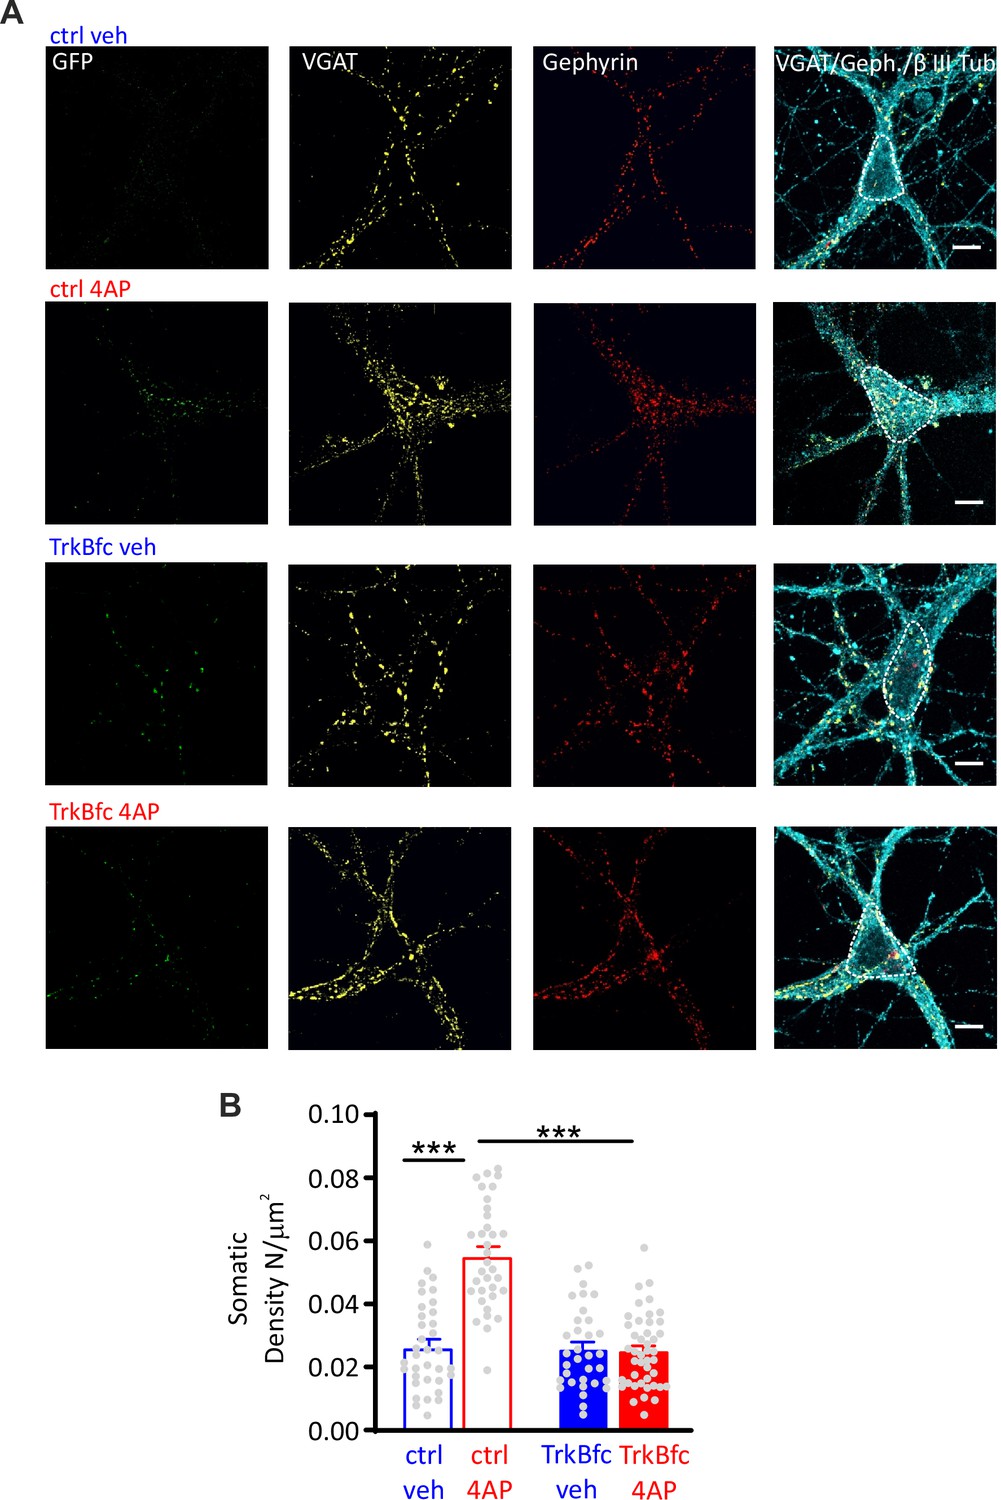
BDNF scavenging suppresses the 4AP-induced enhancement of perisomatic inhibitory synapses to excitatory neurons.
(A) Representative microphotographs showing GFP-negative excitatory neurons (20 div), treated with ctrl/veh, ctrl/4AP, TrkB-fc/veh, and TrkB-fc/4AP, labeled with β3-tubulin (light blue) and decorated with gephyrin (red) and VGAT (yellow) antibodies to identify GABAergic synapses. White lines highlight somatic areas. Scale bars, 10 µm. (B) Quantification (means± SEM) of the densities of somatic inhibitory synapses onto excitatory neurons (33<n<44), from two independent neuronal preparations. ***p<0.001; two-way ANOVA/Tukey’s tests. Data for (B) can be found in Figure 7—source data 1.
-
Figure 7—source data 1
Source data for Figure 7.
- https://cdn.elifesciences.org/articles/69058/elife-69058-fig7-data1-v1.pdf
Figure 7—figure supplement 1
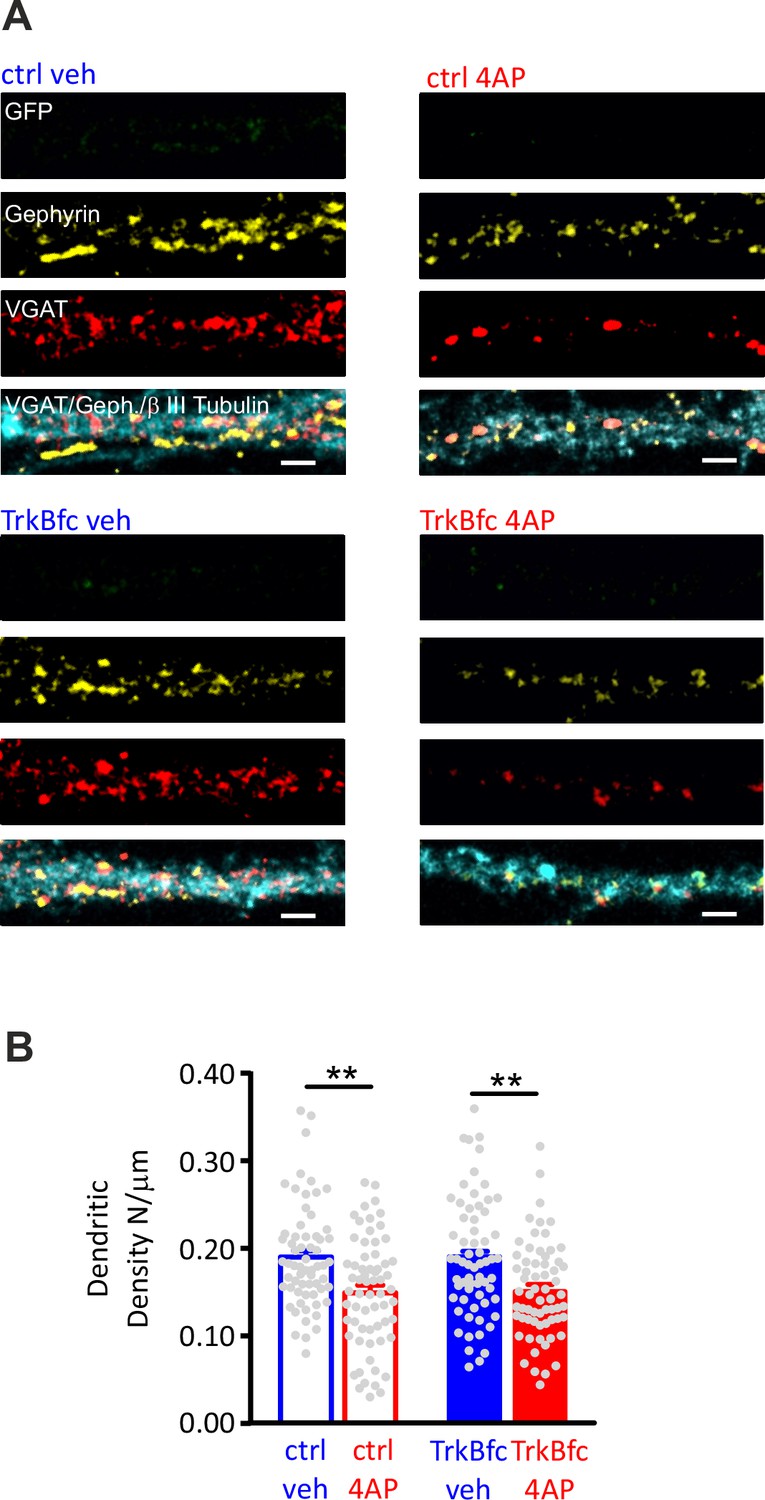
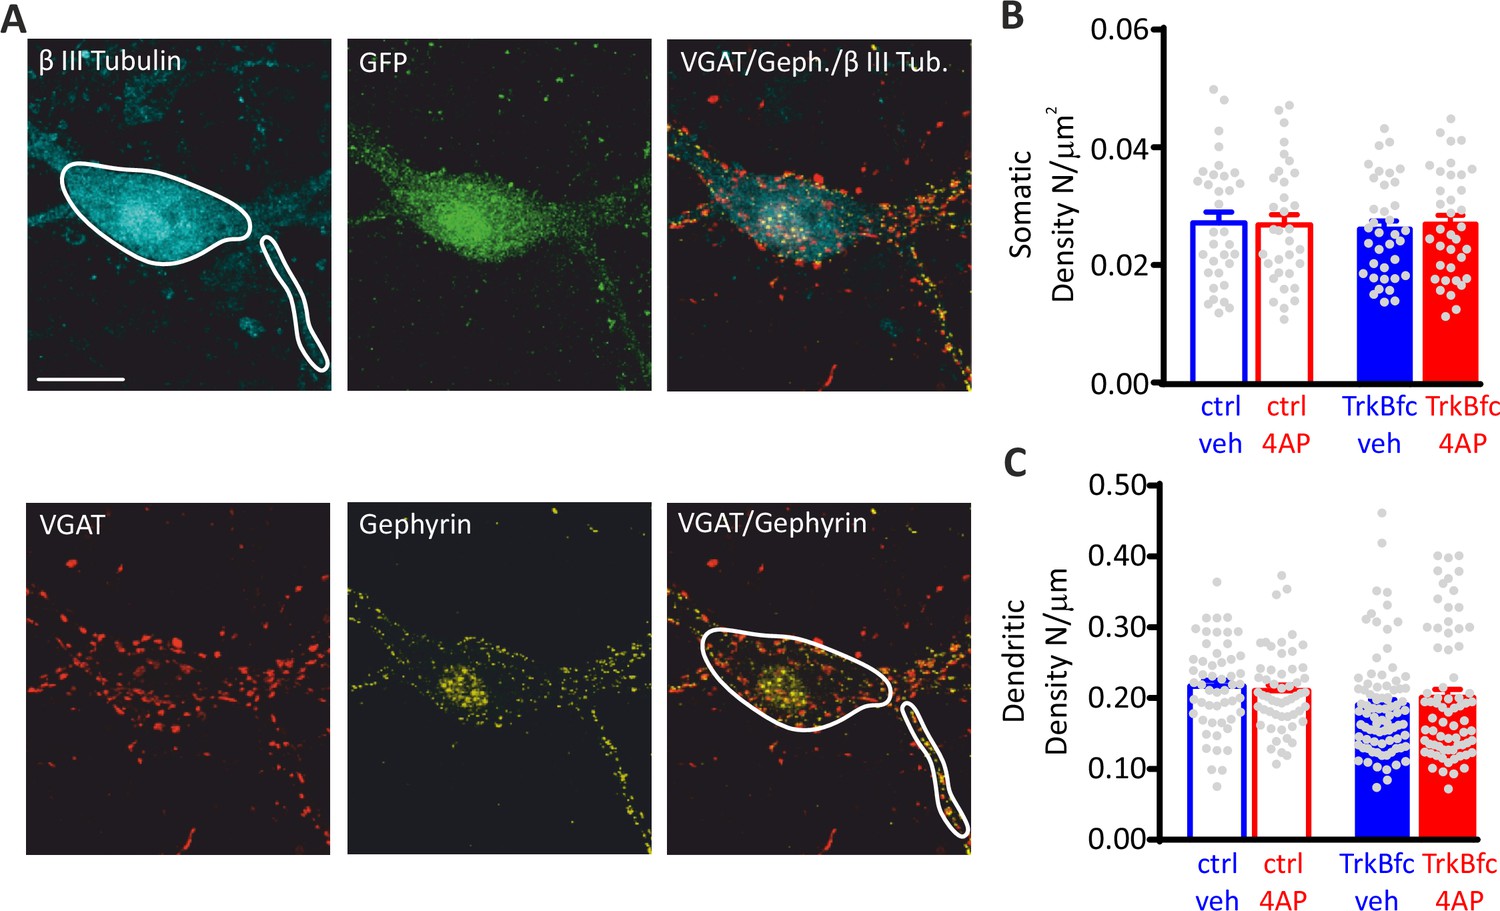
BDNF scavenging does not affect the 4AP-induced reduction of dendritic inhibitory synapses to excitatory neurons.
(A) Representative microphotographs showing a GFP-negative excitatory dendritic processes (20 div), treated with ctrl/veh, ctrl/4AP, TrkB-fc/veh, and TrkB-fc/4AP, labeled with β3-tubulin (light blue) and decorated with gephyrin (red) and VGAT (yellow) antibodies to identify GABAergic synapses. Scale bars, 2 µm. (B) Quantification (means± SEM) of the densities of somatic inhibitory synapses onto excitatory neurons (63<n<64), from two independent neuronal preparations. ***p<0.001; two-way ANOVA/Tukey’s tests. Data for (B) can be found in Figure 7—figure supplement 1—source data 1.
-
Figure 7—figure supplement 1—source data 1
Source data for Figure 7—figure supplement 1.
- https://cdn.elifesciences.org/articles/69058/elife-69058-fig7-figsupp1-data1-v1.pdf
Figure 7—figure supplement 2
The lack of effect of 4AP on the density of inhibitory synapses onto inhibitory neurons is not affected by BDNF.
(A) Representative microphotographs showing a 20 div GFP-positive inhibitory neuron, treated with ctr/veh, labeled with β3-tubulin (light blue), and decorated with gephyrin (red) and VGAT (yellow) antibodies to identify GABAergic synapses. White lines highlight somatic and dendritic areas. Scale bar, 15 µm. Quantification of the density of perisomatic (B) and dendritic (C) inhibitory synapses onto inhibitory neurons, in ctrl/veh, ctrl/4AP, TrkB-fc/veh, and TrkB-fc/4AP treated neurons. Data are means± SEM of 33<n<36 and 53<n<85 for perisomatic and axodendritic synapses, respectively, from two independent neuronal preparations. No significant differences were found by two-way ANOVA/Tukey’s tests. Data for (B) and (C) can be found in Figure 7—figure supplement 2—source data 1.
-
Figure 7—figure supplement 2—source data 1
Source data for Figure 7—figure supplement 2.
- https://cdn.elifesciences.org/articles/69058/elife-69058-fig7-figsupp2-data1-v1.pdf
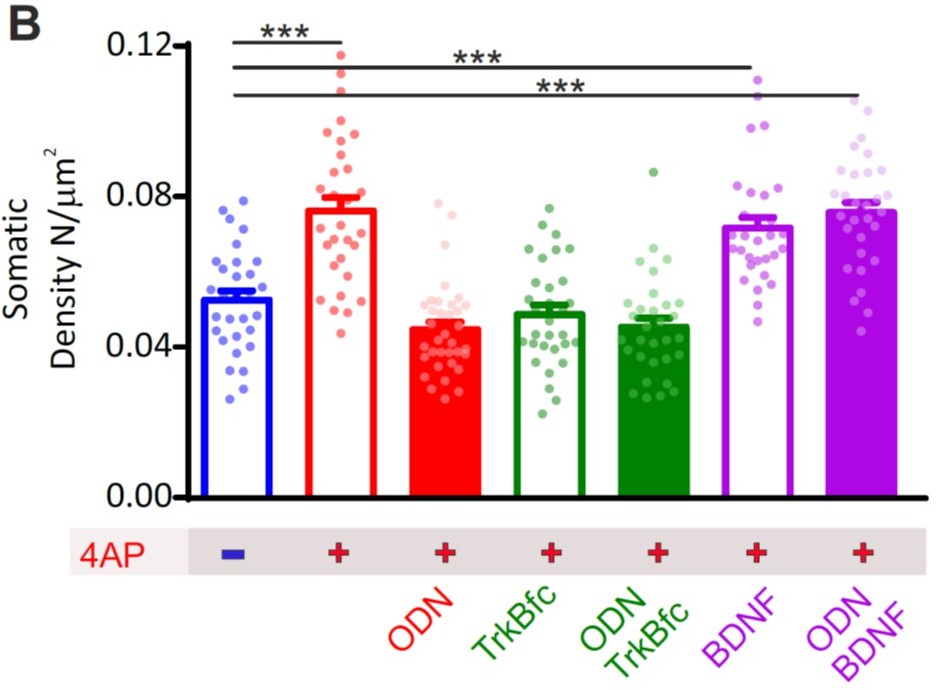
Figure 7—figure supplement 3
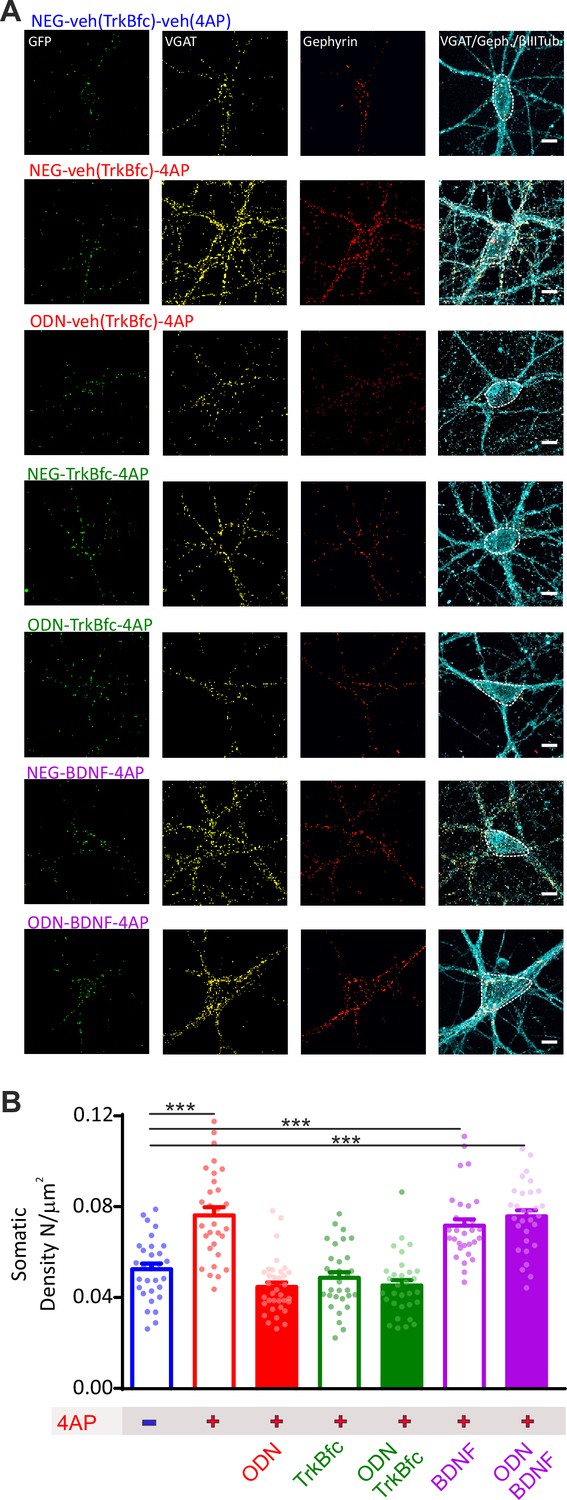
BDNF is a downstream effector of REST for the increase in perisomatic inhibitory synapses onto excitatory neurons induced by chronic hyperactivity.
(A) Representative microphotographs showing 20 div GFP-negative excitatory neurons in the absence of 4AP or treated with chronic 4AP in the presence or absence of various combinations of ODN, TrkBfc, exogenous BDNF, or their respective vehicles. Neurons labeled with β3-tubulin (light blue) and decorated with gephyrin (red) and VGAT (yellow) antibodies to identify GABAergic synapses. White lines highlight somatic and dendritic areas. Scale bars, 10 µm. (B) Quantification of the density of perisomatic inhibitory synapses onto excitatory neurons in the various experimental conditions. Inhibition of REST and inhibition of BDNF actions occlude each other when treatments are combined indicating the existence of an interaction between the two pathways (interaction F1,123=27.66; p<0.0001; two-way ANOVA). Exogenous BDNF fully recapitulates the homeostatic response to hyperactivity, irrespective of whether REST is functional or blocked, demonstrating that BDNF lies downstream the REST initiated cascade. Data are means± SEM of 30<n<35 from three independent neuronal preparations. ***p<0.001; two-way ANOVA/Tukey’s tests. Data for (B) can be found in Figure 7—figure supplement 3—source data 1.
-
Figure 7—figure supplement 3—source data 1
Source data for Figure 7—figure supplement 3.
- https://cdn.elifesciences.org/articles/69058/elife-69058-fig7-figsupp3-data1-v1.pdf
Figure 8
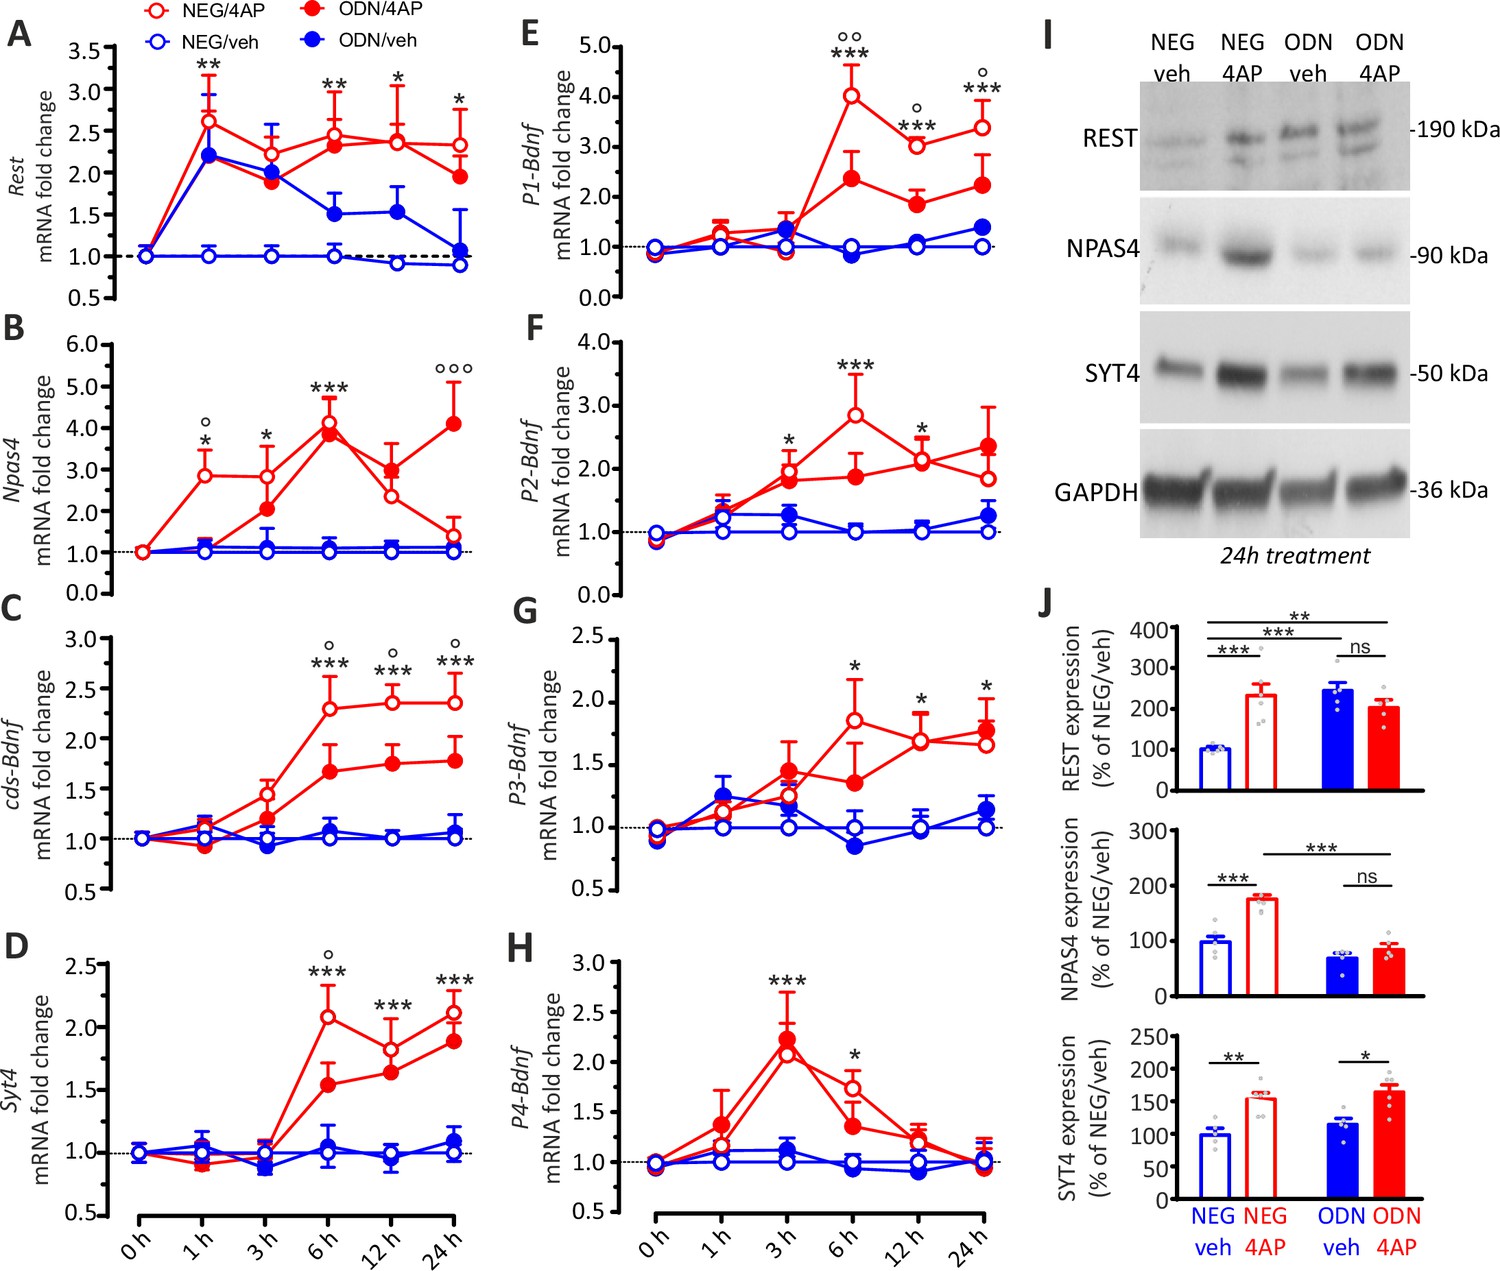
The REST-dependent potentiation of GABAergic synapses involves Npas4 and P1-Bdnf activation.
(A–H) Time course of the REST-dependent transcriptomic profile induced by hyperactivity. Mean (± SEM) fold changes of Rest (A), Npas4 (B), cds-Bdnf (C), Syt4 (D), P1-Bdnf (E), P2-Bdnf (F), P3-Bdnf (G), and P4-Bdnf (H) mRNAs in cortical neurons treated with NEG/vehicle, NEG/4AP, ODN/vehicle, or ODN/4AP before and at various times after the respective treatments. All values are normalized to the NEG/vehicle mRNA levels. For each time point, 11<n<5 from three independent neuronal preparations. *p<0.05, **p<0.01, ***p<0.001, NEG/veh versus NEG/4AP; op<0.05, oop<0.01, ooop<0.001, NEG/4AP versus ODN/4AP; two-way ANOVA/Tukey’s tests. (I, J) Representative immunoblots (I) and quantitative analysis (J) of REST, NPAS4 and SYT4 protein expression in cortical neurons treated for 24 hr with NEG/vehicle, NEG/4AP, ODN/vehicle or ODN/4AP. All values (means ± sem) are normalized to the NEG/vehicle level. GAPDH was included as control of equal loading. For each protein, 6<n<5 from three independent neuronal preparations. *p<0.05, **p<0.01; ***p<0.001, two-way ANOVA/Tukey’s test. Data for (A–J) can be found in Figure 8—source data 1.
-
Figure 8—source data 1
Source data for Figure 8.
- https://cdn.elifesciences.org/articles/69058/elife-69058-fig8-data1-v1.pdf
Figure 9 with 1 supplement
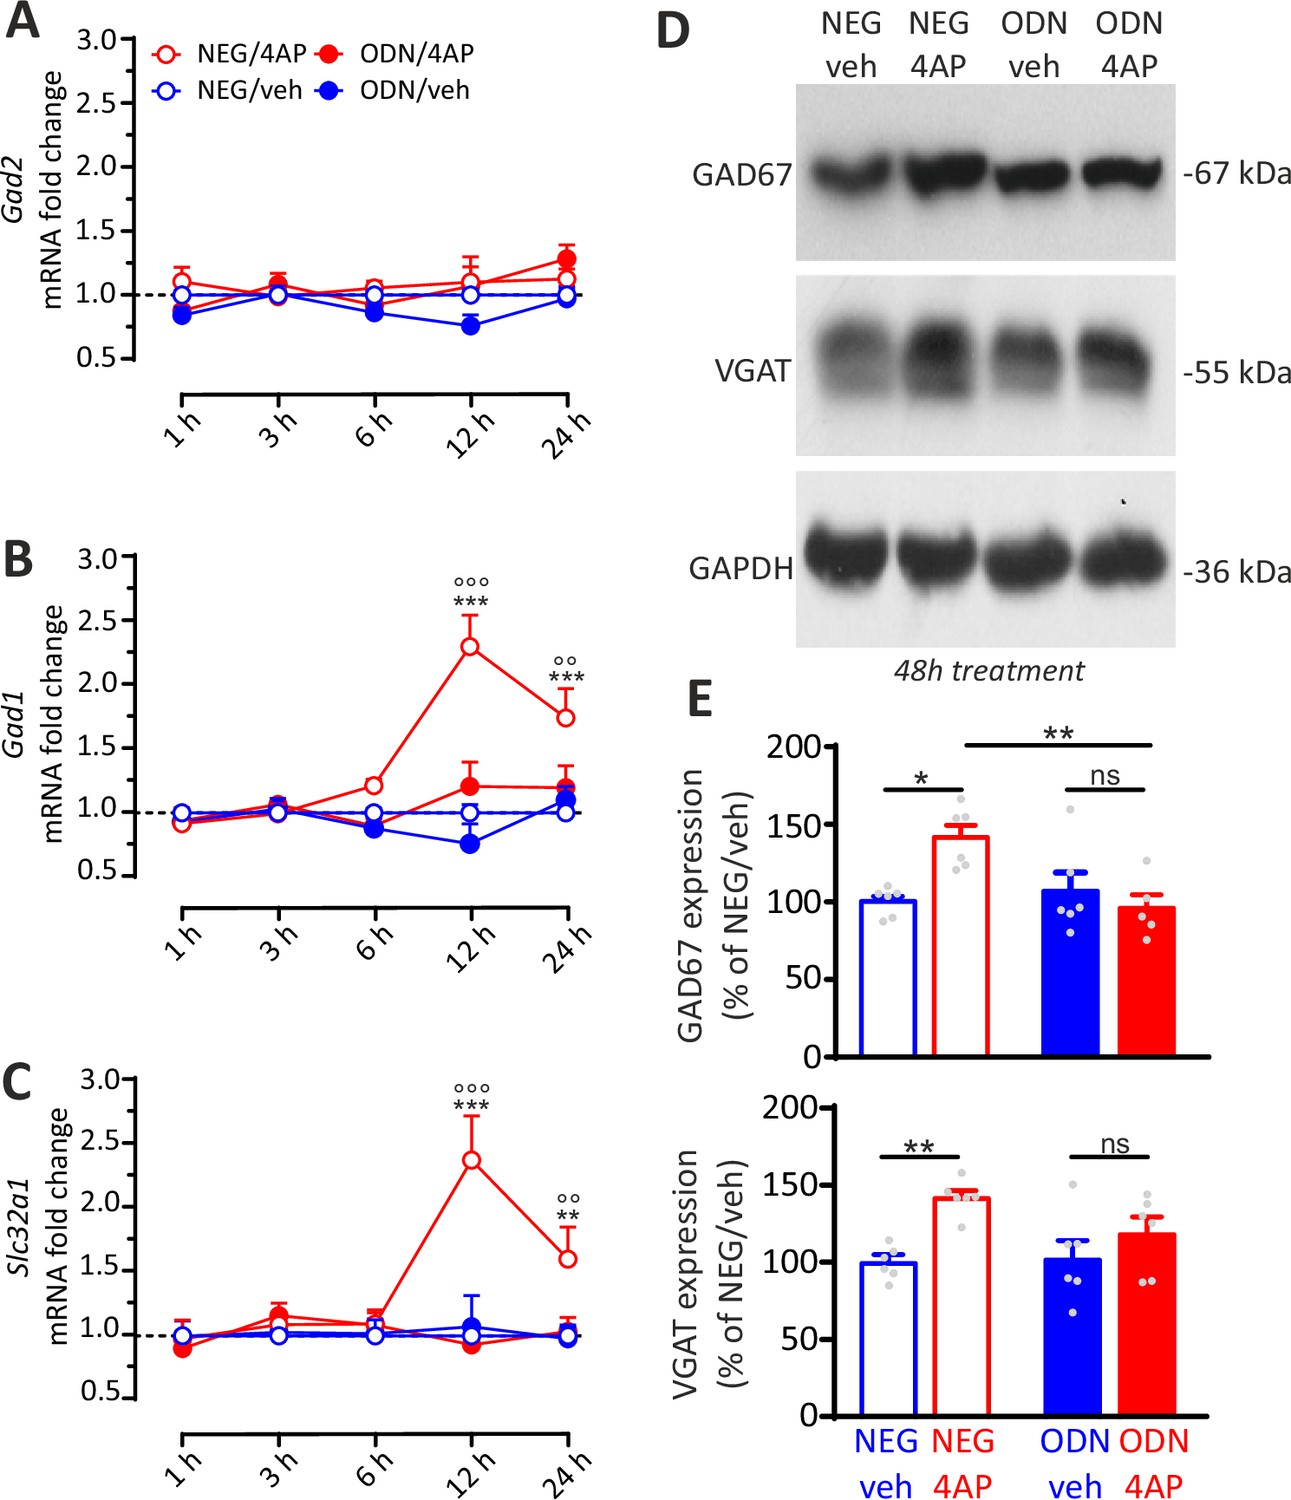
REST-dependent activation of GABAergic synaptic genes.
(A–C) Time course of the fold changes in mRNA levels of Gad2 (A), Gad1 (B), and Slc32a1 (C) in cortical neurons treated with NEG/vehicle, NEG/4AP, ODN/vehicle, or ODN/4AP before and various times after the respective treatments. All values (means± SEM) are normalized to the NEG/veh levels. For each time point, 9<n<6 from three independent neuronal preparations. **p<0.01, ***p<0.001 NEG/veh versus NEG/4AP; °°p<0.01, °°°p<0.001 NEG/4AP versus ODN/4AP; two-way ANOVA/ Tukey’s tests. (D, E) Representative immunoblots (D) and quantitative analysis (E) of GAD67 and VGAT protein expression in cortical neurons treated for 48 hr with NEG/vehicle, NEG/4AP, ODN/vehicle, or ODN/4AP. All values (means± SEM) are normalized to the NEG/vehicle level. GAPDH was included as control of equal loading. For each protein, 6<n<5 from three independent neuronal preparations. *p<0.05, **p<0.01; two-way ANOVA/Tukey’s tests. Data for (A–E) can be found in Figure 9—source data 1.
-
Figure 9—source data 1
Source data for Figure 9.
- https://cdn.elifesciences.org/articles/69058/elife-69058-fig9-data1-v1.pdf
Figure 9—figure supplement 1
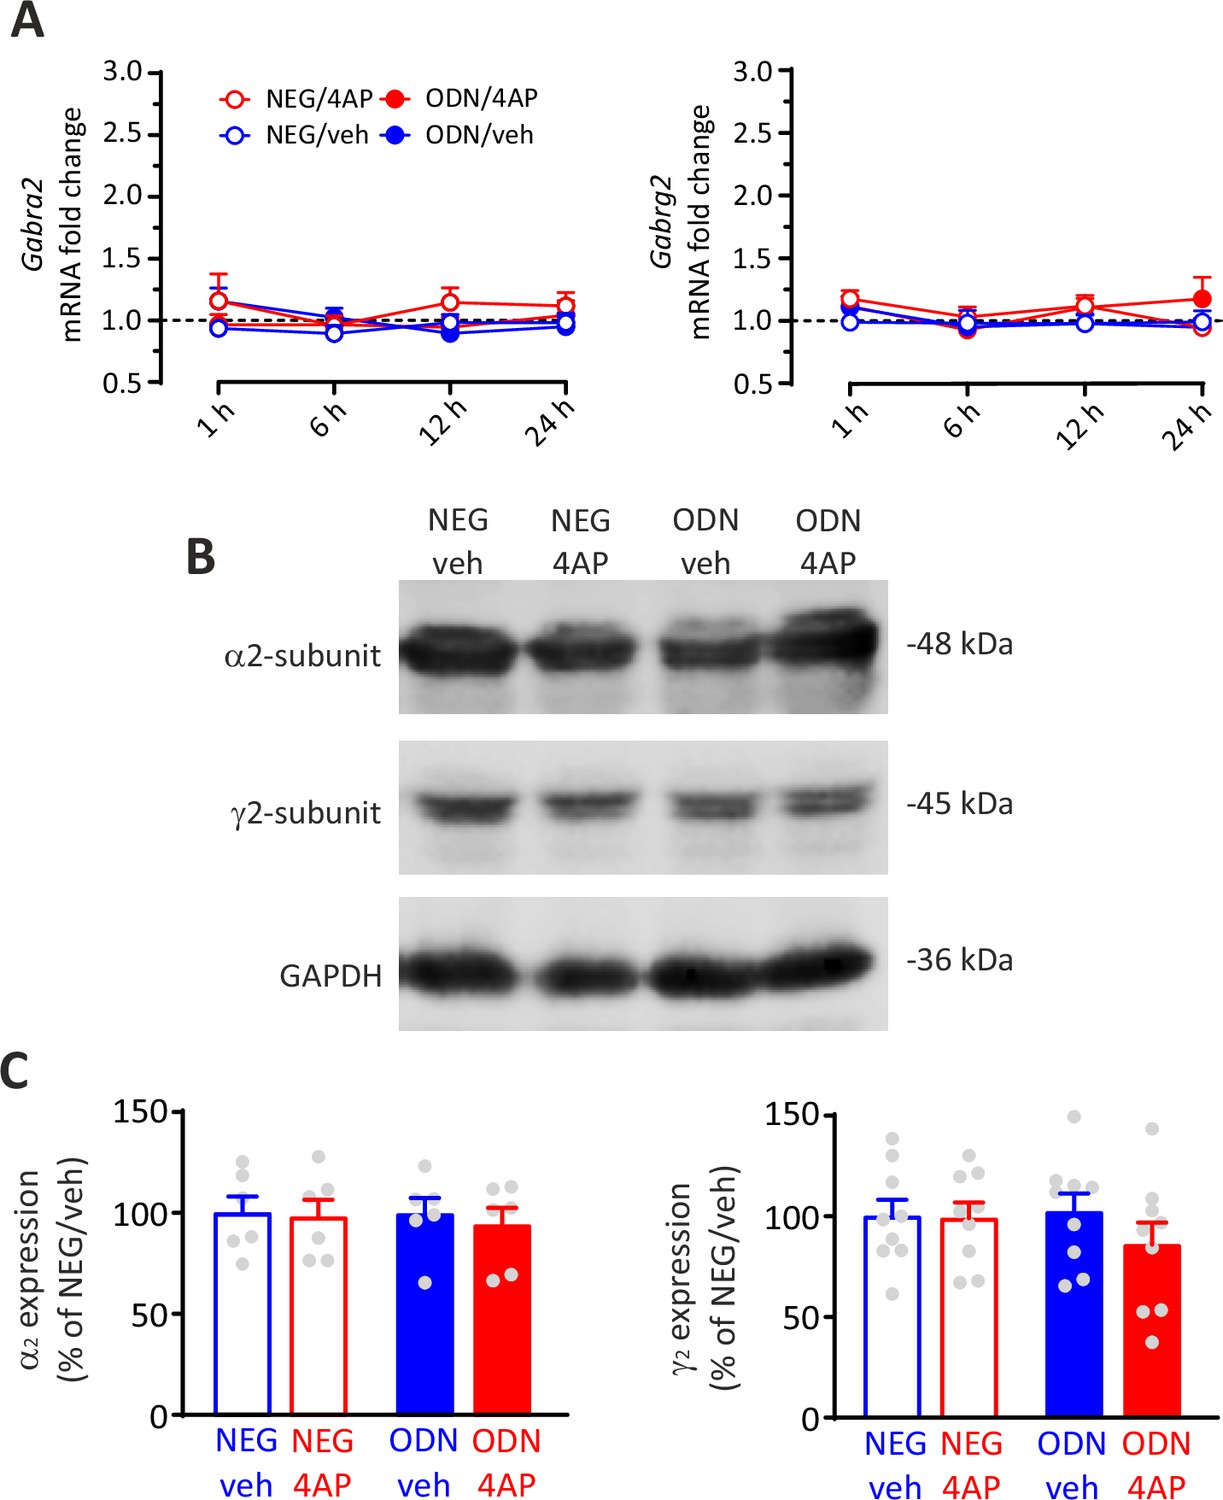
The levels of α2/γ2, GABAA receptor subunits were not affected by hyperactivity.
(A) Time course of the fold changes in mRNA levels of Gabra2 and Gabrg2 (α2 (left) and γ2 (right) GABAA receptor subunits, respectively) in cortical neurons treated with NEG/vehicle, NEG/4AP, ODN/vehicle, or ODN/4AP before and various times after the respective treatments. All values (means± SEM) are normalized to the NEG/veh levels. For each time point, n=6 from three independent neuronal preparations. p>0.05; two-way ANOVA/Tukey’s tests. (B, C) Representative immunoblots (B) and quantitative analysis (C) of the protein expression of α2 (left) and γ2 (right) GABAA receptor subunits in cortical neurons treated for 48 hr with NEG/vehicle, NEG/4AP, ODN/vehicle, or ODN/4AP. All values (means± SEM) are normalized to the NEG/vehicle level. GAPDH was included as control of equal loading. For each protein, 9<n<6 from three independent neuronal preparations. p>0.05; two-way ANOVA/Tukey’s tests. Data for (A–C) can be found in Figure 9—figure supplement 1—source data 1.
-
Figure 9—figure supplement 1—source data 1
Source data for Figure 9—figure supplement 1.
- https://cdn.elifesciences.org/articles/69058/elife-69058-fig9-figsupp1-data1-v1.pdf
Figure 10
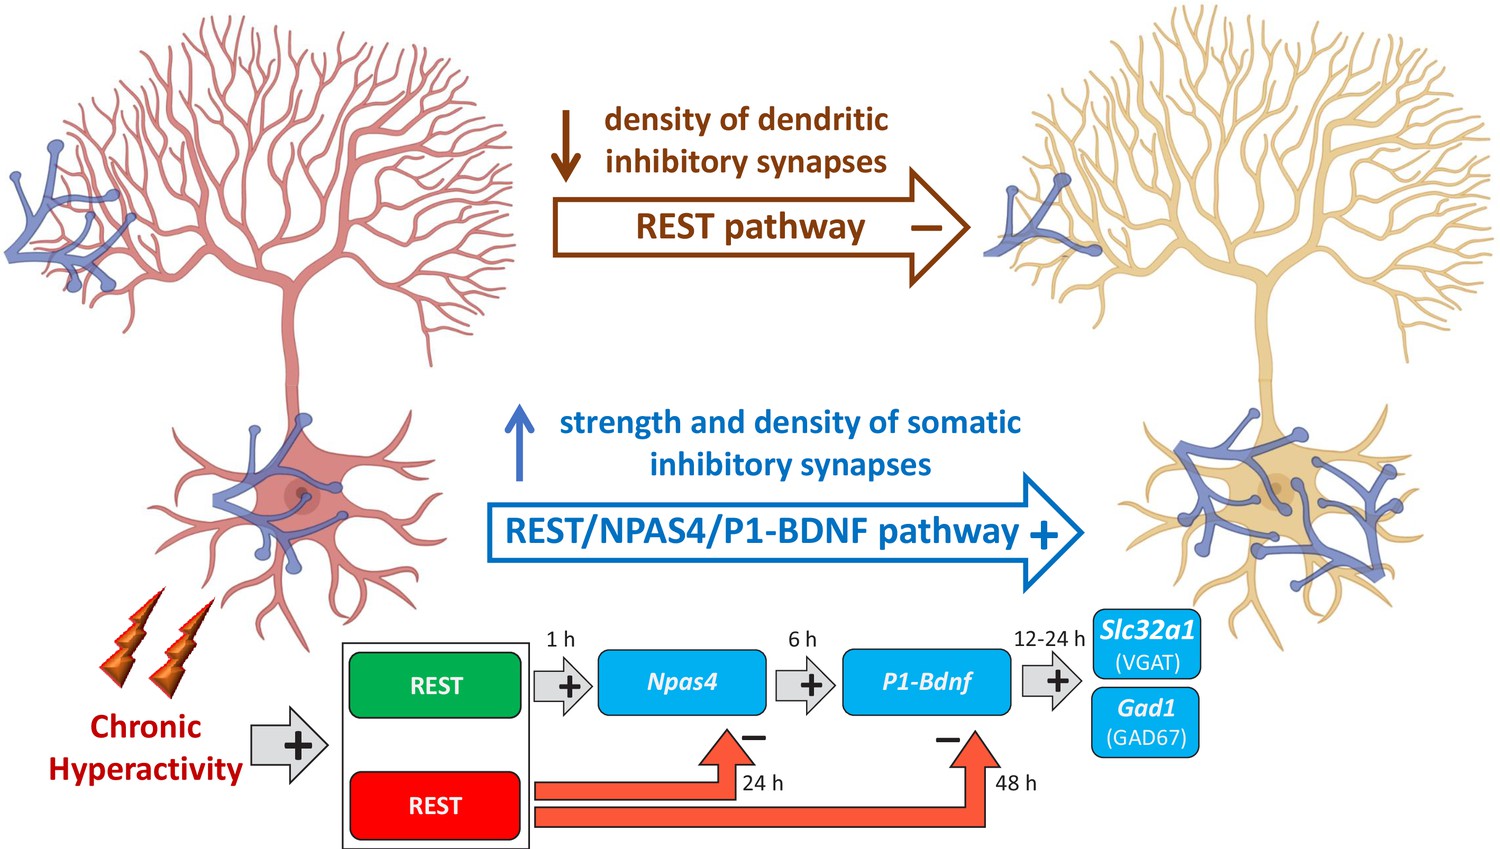
Mechanistic model of REST-dependent homeostatic rearrangement of inhibitory inputs in response to hyperactivity.
The homeostatic response to hyperactivity at inhibitory synapses onto excitatory principal neurons (in red at the onset of hyperactivity; in yellow after the homeostatic response) consists of the upscaling of perisomatic synapses and a parallel downscaling of dendritic inhibitory synapses. The decrease in dendritic inhibitory synapses is exclusively dependent on REST and independent on BDNF and consists in the canonical effect of transcriptional repression of REST rapidly activated by hyperactivity. The upscaling of perisomatic inhibitory synapses is based on the activation of three sequential transcriptional waves. The first one consists the initial nuclear translocation of REST that exerts an early facilitating role on the fast onset of Npas4 transcription. The second wave involves the expression of the P1-Bdnf transcript by Npas4 that potentially restricts the functional changes to the soma of excitatory neurons. Finally, in the third wave, BDNF secreted by the excitatory neurons retrogradely reaches the inhibitory terminals and activates, via the TrkB signaling pathway, the transcription of effectors genes (Slc32a1 and Gad1) whose products (VGAT and GAD67) eventually increase the strength of perisomatic inhibitory inputs to excitatory target neurons through a presynaptic mechanism. Notably, REST is also involved in the late transcriptional inhibition of Npas4 and Bdnf, crucial to ensuring a temporal constrain to their expressional increase (created in BioRender.com).
Author response image 1
Tables
Key resources table
| Reagent type(species) or resource | Designation | Source or reference | Identifiers | Additional information |
|---|---|---|---|---|
| Genetic reagent (Mus musculus) | C57BL6/J | Charles River | ||
| Genetic reagent(Mus musculus) | Gad1-GFP | Tamamaki et al., 2003 | ||
| Antibody | beta3-Tubulin (Chicken Polyclonal) | Synaptic Systems | Cat. #302306; RRID:AB_2620048 | IF (1:500) |
| Antibody | VGAT cytoplasmic domain (Mouse Monoclonal) | Synaptic Systems | Cat. #131011; RRID:AB_887872 | IF (1:500) |
| Antibody | Gephyrin (Mouse Monoclonal) | Synaptic Systems | Cat. #147011; RRID:AB_887717 | IF (1:200) |
| Antibody | Alexa405 goat anti-chicken | Abcam | Cat. #ab175674; RRID:AB_2890171 | IF (1:500) |
| Antibody | Alexa546 goat anti-rabbit | Thermo Fisher Scientific | Cat. #A11010; RRID:AB_2534077 | IF (1:500) |
| Antibody | Alexa647 goat anti-mouse | Thermo Fisher Scientific | Cat. #A32728; RRID:AB_2633277 | IF (1:500) |
| Antibody | Anti-REST (Rabbit Polyclonal) | Millipore | Cat. #07-579; RRID:AB_11211936 | WB (1:500) |
| Antibody | NPAS4 (Mouse Monoclonal) | Thermo Fisher Scientific | Cat. #S408-79; RRID: AB_2735296 | WB (1:500) |
| Antibody | Synaptotagmin 4 (Rabbit Polyclonal) | Synaptic Systems | Cat. #105043; RRID:AB_887837 | WB (1:2000) |
| Antibody | Anti-GAD67 (Mouse Monoclonal) | Sigma-Aldrich | Cat. #MAB5406; RRID:AB_2278725 | WB (1:2000) |
| Antibody | Anti-GAPDH (Rabbit Polyclonal) | Santa Cruz | Cat. #Sc-25778; RRID:AB_10167668 | WB (1:2000) |
| Antibody | Anti-mouse Peroxidase conjugated | Bio-Rad | Cat. #1706516; RRID:AB_11125547 | WB (1:3000) |
| Antibody | Anti-rabbit Peroxidase conjugated | Bio-Rad | Cat. #1706515; RRID:AB_11125142 | WB (1:3000) |
| Antibody | GABA-A receptor alpha2 (Rabbit Polyclonal) | Synaptic Systems | Cat. #224 103; RRID:AB_2108839 | WB (1:1000) |
| Antibody | GABA-A receptor gamma2 (Rabbit Polyclonal) | Synaptic Systems | Cat. #224 003; RRID:AB_2263066 | WB (1:1000) |
| Recombinant DNA reagent vectors | pcDNA6.2- GW/EmGFP-miR | Invitrogen | Cat. #K493600 | BLOCK-iT Pol II miR RNAi Expression Vector Kit |
| Recombinant DNA reagent | pCCL.sin.cPPT. PGK.GFP.WPRE | TIGET, SanRaffaeleSci.Institute | Gift from M. Amendola and L. Naldini | |
| Sequence-based reagent | ODN (Positive decoy, top) | Sigma Genosys (Soldati et al., 2011) | 5′-GpPpCpPTPTT CAGCACCACGG ACAGCGCCAGC-3′ | |
| Sequence-based reagent | ODN (Positive decoy, bot) | Sigma Genosys (Soldati et al., 2011) | 3′-GpPpCpPTPGGC GCTGTCCGTGG TGCTGAAAGC-5′ | |
| Sequence-based reagent | NEG (Negative decoy, top) | Sigma Genosys (Soldati et al., 2011) | 5′-GpPpCpPTPTCC AGCACAGTGG TCAGACCC-3′ | |
| Sequence-based reagent | NEG (Negative decoy, bot) | Sigma Genosys (Soldati et al., 2011) | 3′-GpPpCpPTPTC TGACCACTGTG CTGGAAGC-5′ | |
| Sequence-based reagent | Gapdh_F | This paper | PCR primers | GAACATCATC CCTGCATCCA |
| Sequence-based reagent | Gapdh_R | This paper | PCR primers | CCAGTGAGC TTCCCGTTCA |
| Sequence-based reagent | Ppia_F | This paper | PCR primers | CACTGTCGC TTTTCGC CGCTTG |
| Sequence-based reagent | Ppia_R | This paper | PCR primers | TTTCTGCTGTC TTTGGAACT TTGTCTGC |
| Sequence-based reagent | Rest_F | This paper | PCR primers | GAACCACCT CCCAGTATG |
| Sequence-based reagent | Rest_R | This paper | PCR primers | CTTCTGACA ATCCTCCATAG |
| Sequence-based reagent | Bdnf cds_F | This paper | PCR primers | GATGCCGCAA ACATGTCTATGA |
| Sequence-based reagent | Bdnf cds_R | This paper | PCR primers | TAATACTGTCAC ACACGCT CAGCTC |
| Sequence-based reagent | Bdnf (P1)_F | This paper | PCR primers | TGGTAACCT CGCTCATT CATTAGA |
| Sequence-based reagent | Bdnf (P1)_R | This paper | PCR primers | CCCTTCGCAAT ATCCGCAAAG |
| Sequence-based reagent | Bdnf (P4)_F | This paper | PCR primers | CAAATGGAGC TTCTCGC TGAAGGC |
| Sequence-based reagent | Bdnf (P4)_R | This paper | PCR primers | GTGGAAATTG CATGGCG GAGGTAA |
| Sequence-based reagent | Npas4_F | This paper | PCR primers | AGGGTTTGCT GATGAGTTGC |
| Sequence-based reagent | Npas4_R | This paper | PCR primers | CCCCTCCAC TTCCATCTTC |
| Sequence-based reagent | Gabrg2_F | This paper | PCR primers | CCATGCCCA ATCCGTGGTTAT |
| Sequence-based reagent | Gabrg2_R | This paper | PCR primers | GCTCAAAGG TATCTTGC TCAGTGT |
| Sequence-based reagent | Gabra2_F | This paper | PCR primers | GCTGCTCTC CATTGTGAAT |
| Sequence-based reagent | Gabra2_R | This paper | PCR primers | GGTGCTGGG AACTTGAAAT |
| Sequence-based reagent | Gad1_F | This paper | PCR primers | CTAGGGACC CAGGGAAAG |
| Sequence-based reagent | Gad1_R | This paper | PCR primers | GTACATCTGTC ATCCATCATCC |
| Sequence-based reagent | Gad2_F | This paper | PCR primers | ACCAATTATGG AGCGTCACAGG |
| Sequence-based reagent | Gad2_R | This paper | PCR primers | CTGAGGAGCA GCACCTTCTC |
| Sequence-based reagent | Slc32a1_F | This paper | PCR primers | TTCAGTGCTT GGAATCTAC |
| Sequence-based reagent | Slc32a1_R | This paper | PCR primers | TTCTCCAGAG TGAAGTCG |
| Sequence-based reagent | Syt4_F | This paper | PCR primers | CCTCACTCAT CGCCATCCA |
| Sequence-based reagent | Syt4_R | This paper | PCR primers | GACCGCAGC TCACTCCAT |
| Chemical compound, drug | Trypsin | Gibco | Cat. #1505014 | (0.25%) |
| Chemical compound, drug | HBSS | Gibco | Cat. #14170-088 | |
| Chemical compound, drug | HEPES | AppliChem | Cat. #A37240500 | (10 mM) |
| Chemical compound, drug | D-Glucose | Sigma-Aldrich | Cat. #G7021 | (30 mM) |
| Chemical compound, drug | Gentamicin solution | Sigma-Aldrich | Cat. #G1272 | (5 µg/ml) |
| Chemical compound, drug | KOH | AppliChem | Cat. #131515 | (1 M) |
| Chemical compound, drug | Bovine Serum Albumin (BSA) | Sigma-Aldrich | Cat. #A4503 | (10%) |
| Chemical compound, drug | MgSO4 + H2O | Sigma-Aldrich | Cat. #63138 | (6 mM) |
| Chemical compound, drug | Poly-L-lysine hydrobromide | Sigma-Aldrich | Cat. #P2636 | (0.1 mg/ml) |
| Chemical compound, drug | Boric Acid | Sigma-Aldrich | Cat. #B-7901 | (0.1 M) |
| Chemical compound, drug | di-Sodium tetraborate decahydrate | Sigma-Aldrich | Cat. #A267508 | (0.1 M) |
| Chemical compound, drug | Neurobasal-A Medium | Gibco | Cat. #10888-022 | |
| Chemical compound, drug | Neurobasal Medium | Gibco | Cat. #21103049 | |
| Chemical compound, drug | B-27 Supplement | Gibco | Cat. #17504044 | (2%) |
| Chemical compound, drug | GlutaMAX -I (100×) | Gibco | Cat. #35050-061 | (1 mM) |
| Chemical compound, drug | Penicillin- Streptomycin | Sigma-Aldrich | Cat. #P4333 | (1%) |
| Chemical compound, drug | 4-Aminopyridine | Sigma-Aldrich | Cat. #A78403 | (100 μM) |
| Chemical compound, drug | CaCl2 | Sigma-Aldrich | Cat. #C8106 | (2 mM) |
| Chemical compound, drug | MgCl2 | Sigma-Aldrich | Cat. #A4425 | (1 mM) |
| Chemical compound, drug | KCl | Merk | Cat. #TA638736 | (4 mM) |
| Chemical compound, drug | ATP | Sigma-Aldrich | Cat. #A6419 | (3 mM) |
| Chemical compound, drug | GTP | Sigma-Aldrich | Cat. #G8877 | (0.1 mM) |
| Chemical compound, drug | EGTA | Sigma-Aldrich | Cat. #E4378 | (0.1 mM) |
| Chemical compound, drug | TrkB-Fc | Sigma-Aldrich | Cat. #T8694 | (1 µg/ml) |
| Chemical compound, drug | Triton X-100 | Sigma-Aldrich | Cat. #T9284 | (0,2%) |
| Chemical compound, drug | Sucrose | AppliChem | Cat. #A2211 | (4%) |
| Chemical compound, drug | Phosphate -buffered saline | Sigma-Aldrich | Cat. #P4417 | (1 ×) |
| Chemical compound, drug | Paraformaldehyde | Sigma-Aldrich | Cat. #P6148 | (4%) |
| Chemical compound, drug | Fetal Bovine Serum, qualified, heat | Gibco | Cat. #10500064 | (5%) |
| Chemical compound, drug | Tetrodotoxin (TTX) | Tocris | Cat. #1078 | (1 µM) |
| Chemical compound, drug | D-AP5 | Tocris | Cat. #0106 | (50 µM) |
| Chemical compound, drug | CNQX | Tocris | Cat. #0190 | (10 µM) |
| Chemical compound, drug | QX314 | Tocris | Cat. #1014 | (10 mM) |
| Chemical compound, drug | EDTA | AppliChem | Cat. #A5097 | (10 mM) |
| Chemical compound, drug | NaCl | Sigma-Aldrich | Cat. #793566 | (1 M) |
| Chemical compound, drug | Tris-HCl | Merk | Cat. #10812846001 | (100 mM) |
| Chemical compound, drug | Tris(2-carboxyethyl) phosphine (TCEP) | Sigma-Aldrich | Cat. #C4706 | (50 mM) |
| Chemical compound, drug | Protease inhibitor cocktail | Cell Signaling | Cat. #5871 | |
| Chemical compound, drug | BCA Assay | Thermo Fisher Scientific | Cat. #23225 | |
| Chemical compound, drug | Hoechst 33342 | Thermo Fisher Scientific | Cat. #H1399 | (3.33 µl/ml) |
| Chemical compound, drug | TRIzol Reagent | Invitrogen | Cat. #15596018 | |
| Chemical compound, drug | Brain-derived neurotrophic factor (BDNF) | Sigma-Aldrich | Cat. #B3795 | (100 ng/ml) |
| Software, algorithm | GraphPad Prism | GraphPad Software, Inc | RRID:SCR_002798 | |
| Software, algorithm | PatchMaster | HEKA Inst | RRID:SCR_000034 | |
| Software, algorithm | Fitmaster | HEKA Inst | RRID:SCR_016233 | |
| Software, algorithm | ImageJ, Fiji | (ImageJ; http://rsb.info.nih.gov/ij) | RRID:SCR_002285 | |
| Software, algorithm | LASX | Leica Microsystems | RRID:SCR_013673 | |
| Software, algorithm | AxIS 2.4 | Axion BioSystems | RRID:SCR_016308 |
Additional files
Download links
A two-part list of links to download the article, or parts of the article, in various formats.
Downloads (link to download the article as PDF)
Open citations (links to open the citations from this article in various online reference manager services)
Cite this article (links to download the citations from this article in formats compatible with various reference manager tools)
REST/NRSF drives homeostatic plasticity of inhibitory synapses in a target-dependent fashion
eLife 10:e69058.
https://doi.org/10.7554/eLife.69058


