Fine-tuning of β-catenin in mouse thymic epithelial cells is required for postnatal T-cell development
- Division of Experimental Immunology, Institute of Advanced Medical Sciences, Tokushima University, Japan
- National Institute for Basic Biology, National Institutes of Natural Sciences, Japan
- Student Laboratory, School of Medicine, Tokushima University, Japan
- Division of Genome Medicine, Institute of Advanced Medical Sciences, Tokushima University, Japan
- Institute for Advancement of Clinical and Translational Science, Kyoto University Hospital, Japan
- Experimental Immunology Branch, National Cancer Institute, National Institutes of Health, United States
- Exploratory Research Center on Life and Living Systems, National Institutes of Natural Sciences, Japan
- Department of Basic Biology in the School of Life Science, The Graduate University for Advanced Studies (SOKENDAI), Japan
Figures
Figure 1 with 1 supplement
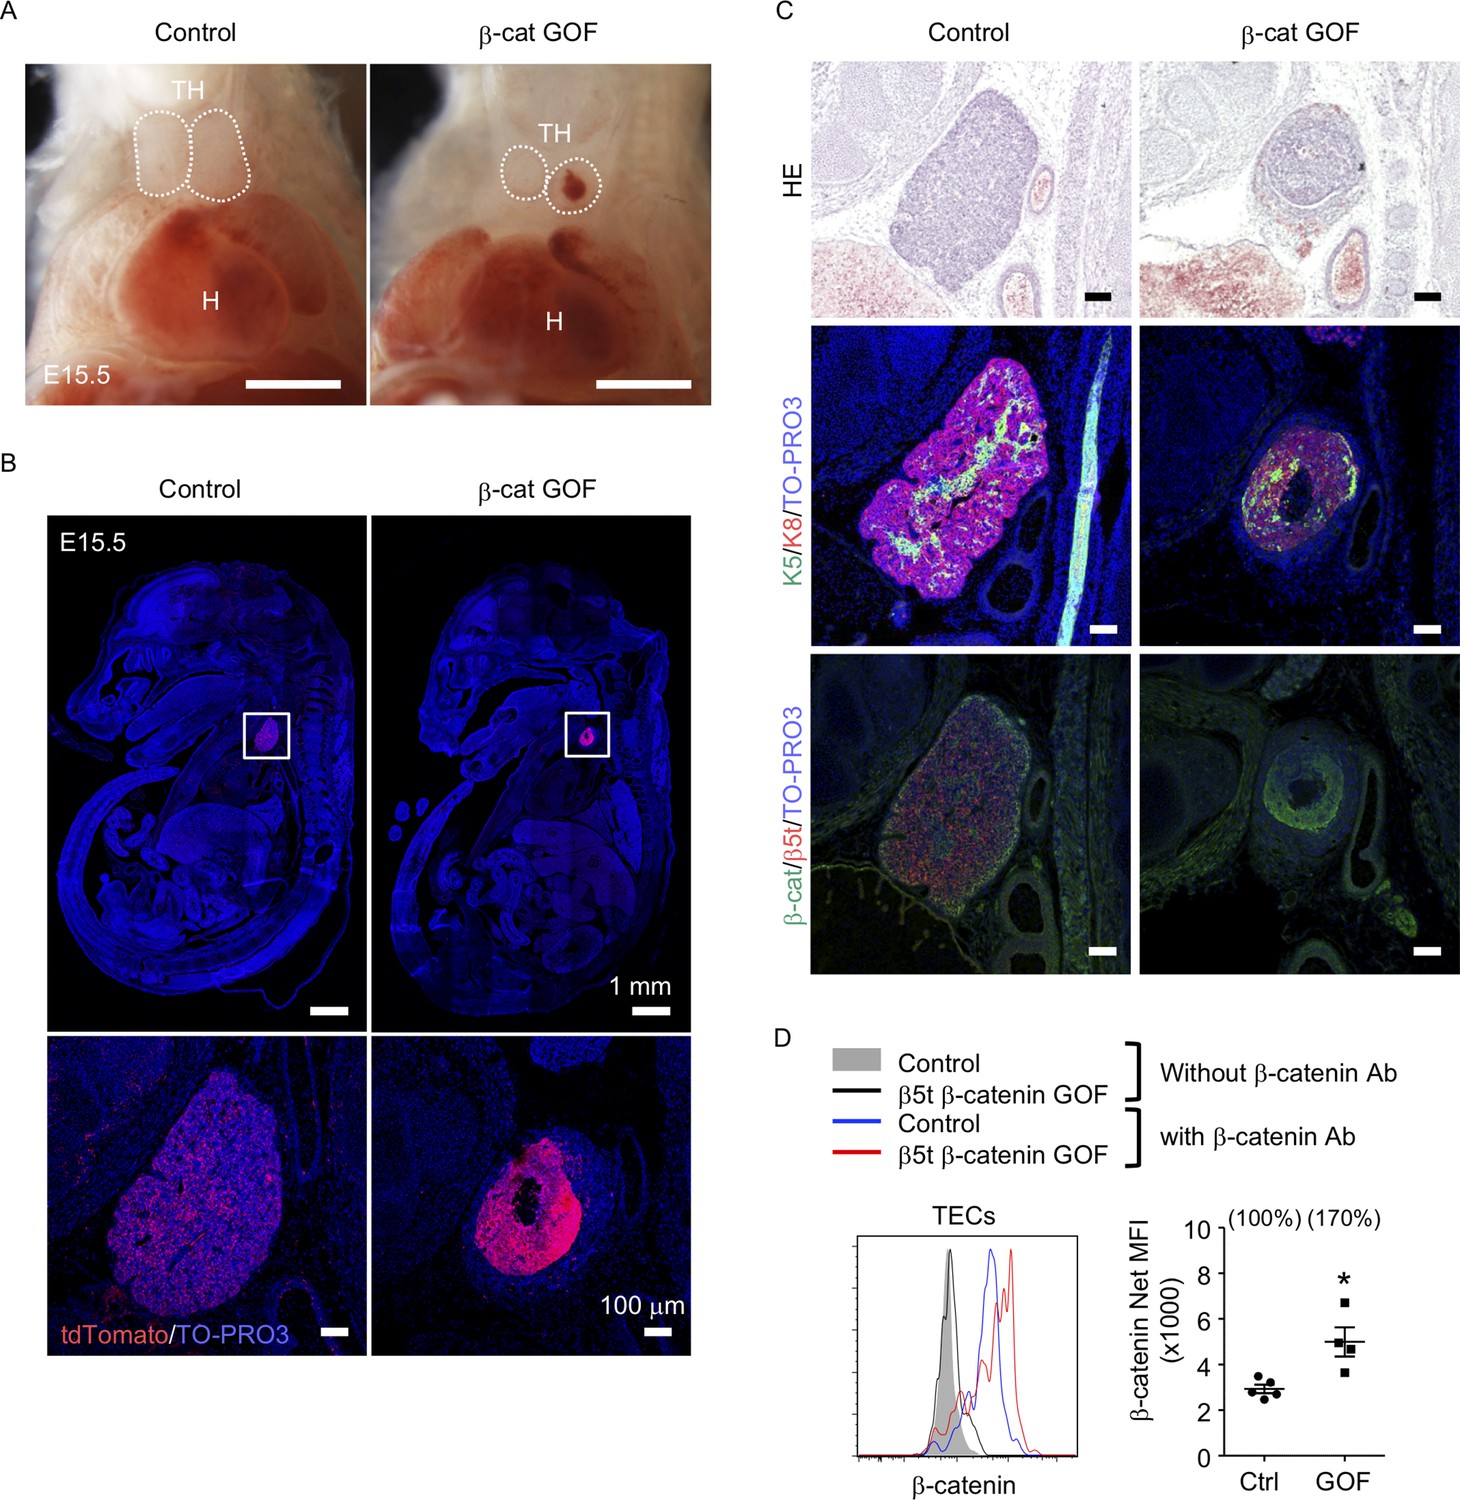
Thymic dysplasia caused by the overexpression of β-catenin in thymic epithelial cells (TECs).
(A) Thoracic cavity of control mice and β-cat gain-of-function (GOF) mice at E15.5. Dotted lines show the outline of the thymic primordium. In many cases, blood clots were observed in the central core of the thymic primordium in β-cat GOF mice. Representative data from three independent experiments are shown. TH: thymus, H: heart. Bar: 1 mm. (B) Labeling of β5t-iCre-activated cell progenies with tdTomato fluorescence in the thymus of control mice and β-cat GOF mice at E15.5. Mouse sections were nuclear counterstained with TO-PRO3. Bottom panels are magnifications of white-boxed areas in the top panels. Representative data from three independent experiments are shown. Bars: indicated in figures. (C) Hematoxylin and eosin staining (top) and immunofluorescence staining for K5 and K8 (middle) and β-catenin and β5t (bottom) on sagittal sections of thymic primordium in control mice and β-cat GOF mice at E15.5. Representative results from three independent experiments are shown. Bar: 100 μm. (D) Intracellular staining of β-catenin in CD45−EpCAM+ TECs isolated from control mice and β-cat GOF mice at E15.5. Histograms show β-catenin expression in control TECs (blue line) and β-cat GOF TECs (red line). Shaded area and black line represent the fluorescence in the absence of anti-β-catenin antibody in control TECs and β-cat GOF TECs, respectively. Plots on the right show net median fluorescence intensity (MFI) values (means and standard error of the means [SEMs], n = 4–5). The numbers in parentheses indicate percentage of control value. *p < 0.05.
Figure 1—figure supplement 1

Immunofluorescence analysis of embryonic thymus.
Immunofluorescence staining for K5 and K8 (left) or β-catenin and β5t (right) on sagittal sections of the thymus from control mice and β-cat gain-of-function (GOF) mice at E15.5. Shown are merged images with nuclear counterstaining (TO-PRO3) (top) and images obtained in each channel (middle, bottom). Representative data from three independent experiments are shown. Bars: 100 μm.
Figure 2 with 1 supplement
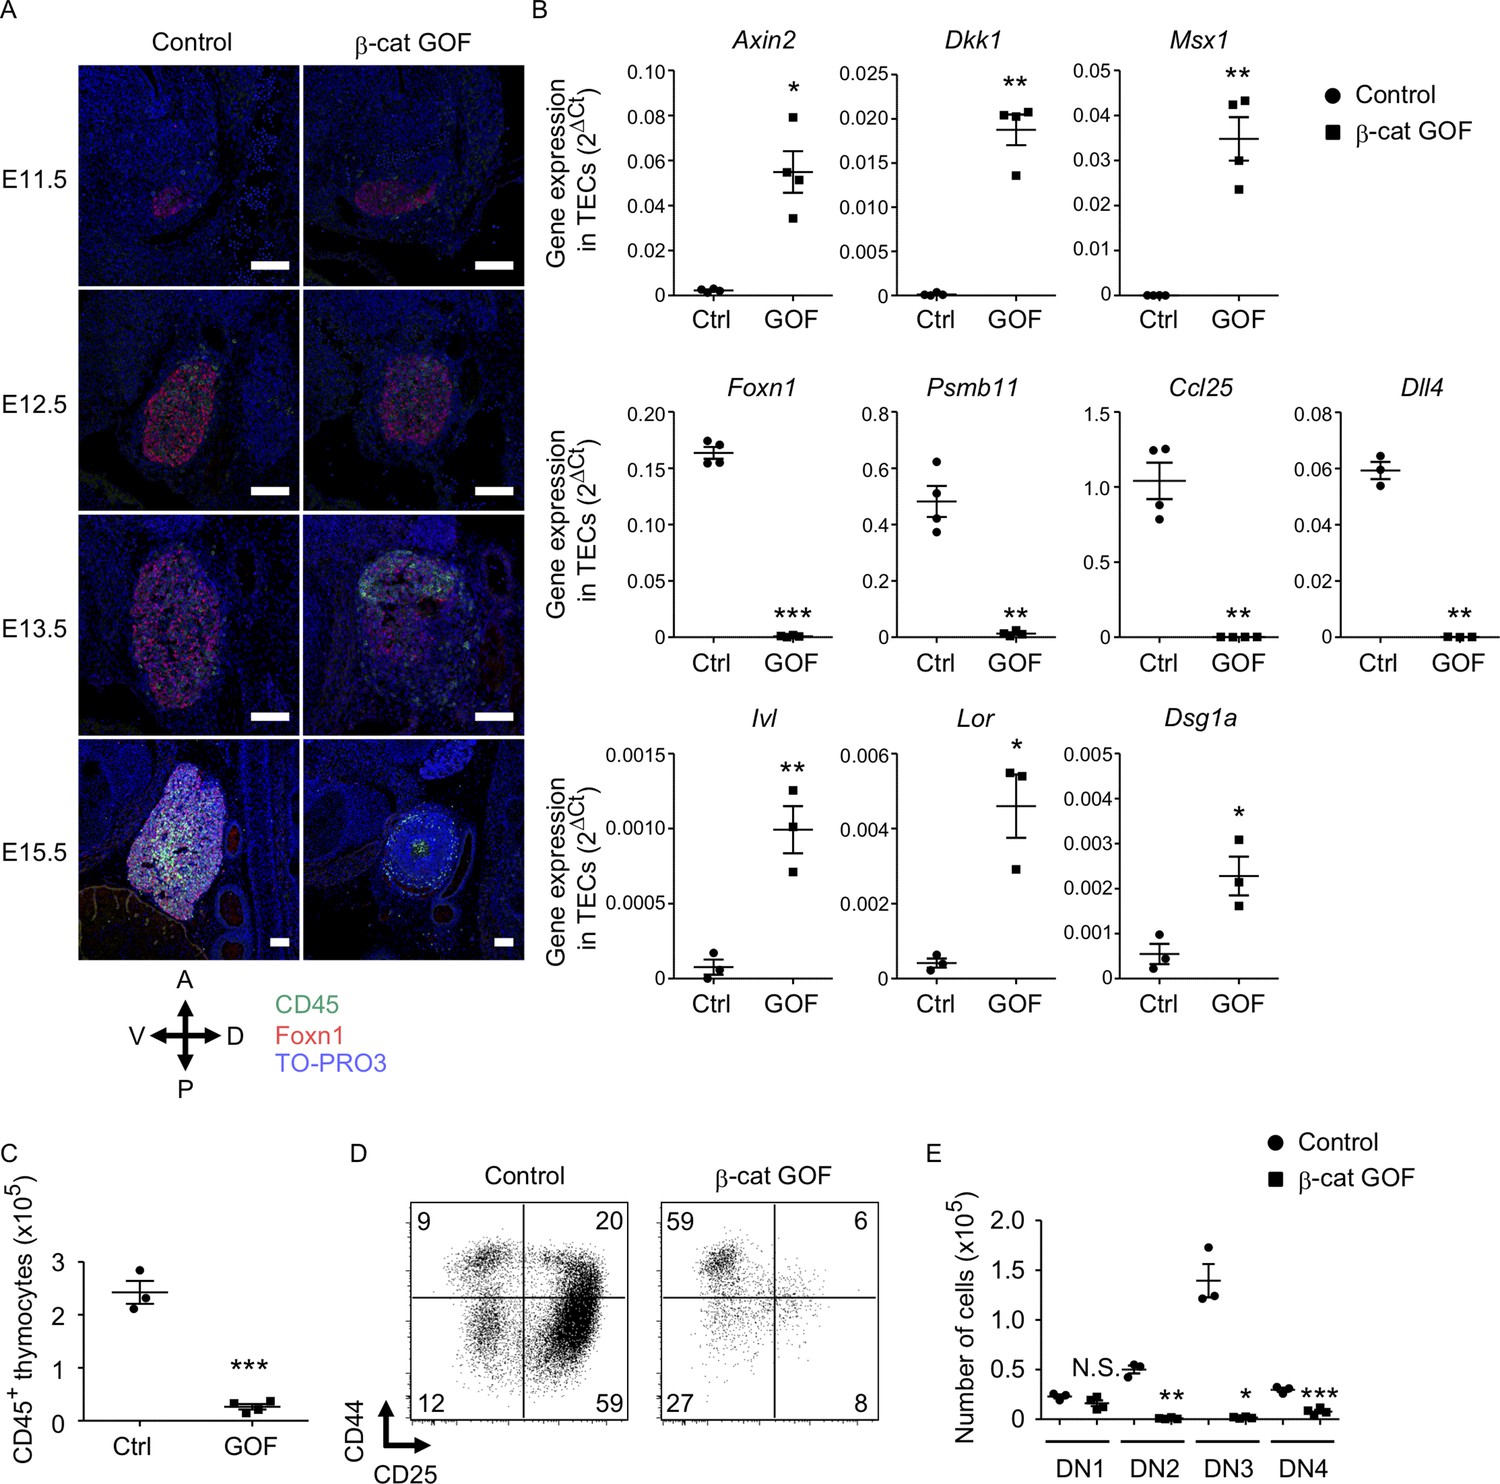
Defective thymus development in β-cat gain-of-function (GOF) embryos.
(A) Immunofluorescence staining for CD45 and Foxn1 on sagittal sections of thymic primordium in control mice and β-cat GOF mice at E11.5–E15.5. The sections were nuclear counterstained with TO-PRO3. Anterior–posterior (A–P) and dorsal–ventral (D–V) orientations of the images are indicated. Representative data from three independent experiments are shown. Bar: 100 μm. (B) Quantitative RT-PCR analysis of mRNA expression levels (means and standard error of the means [SEMs], n = 3–4) of indicated genes relative to Gapdh levels in CD45−EpCAM+ thymic epithelial cells (TECs) isolated from the thymus of control mice and β-cat GOF mice at E15.5. (C) The numbers of CD45+ thymocytes were analyzed by flow cytometry. Plots show the numbers (means and SEMs, n = 3–4) of CD45+ thymocytes in the thymus of control mice and β-cat GOF mice at E15.5. (D) Flow cytometric analysis of double negative (DN) thymocytes from control mice and β-cat GOF mice at E15.5. Shown are profiles of CD44 and CD25 expression. The numbers in dot plots indicate the frequency of cells within indicated area. (E) Cell numbers (means and SEMs, n = 3–4) of indicated DN thymocyte subpopulations from control mice and β-cat GOF mice at E15.5 are plotted. *p < 0.05; **p < 0.01; ***p < 0.001; N.S., not significant.
Figure 2—figure supplement 1
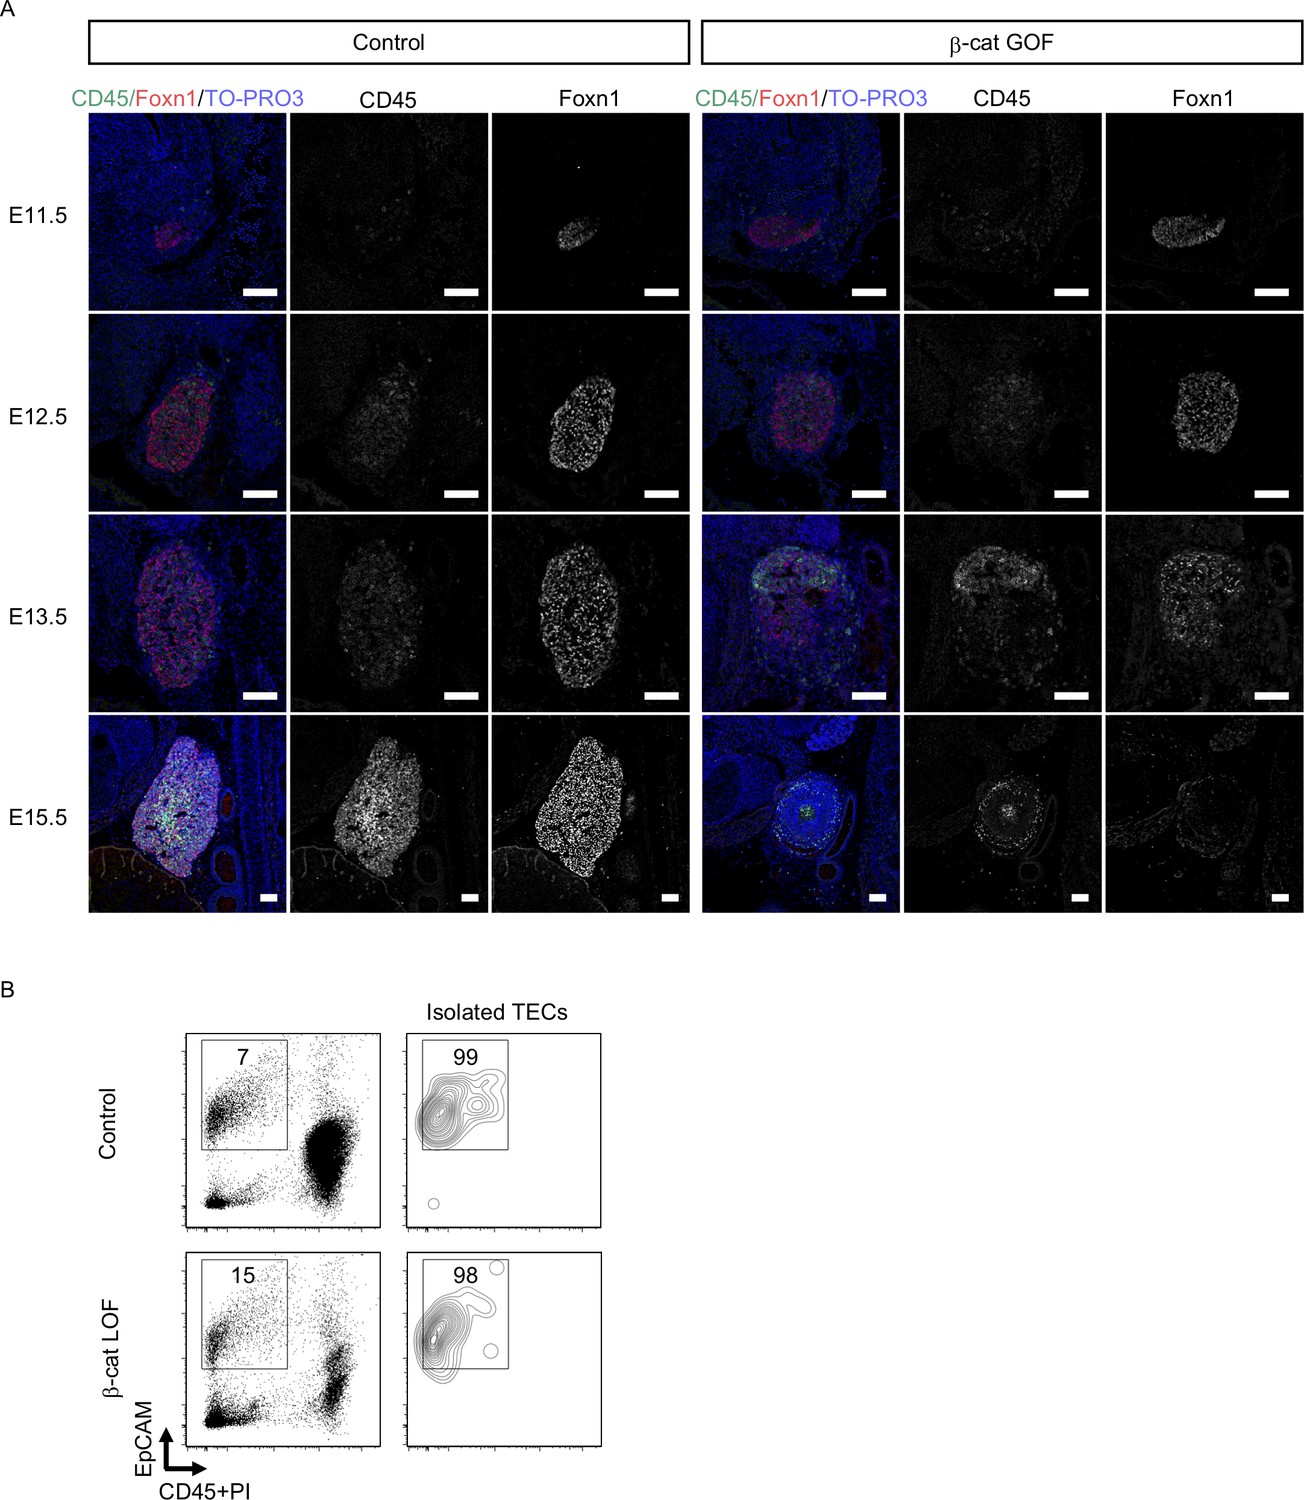
Immunofluorescence analysis of embryonic thymus and purity of isolated TECs.
(A) Immunofluorescence staining for CD45 and Foxn1 on sagittal sections of the thymic primordium in control mice and β-cat gain-of-function (GOF) mice at E11.5–E15.5. Shown are merged images with nuclear counterstaining (TO-PRO3) (left) and images obtained in each channel (middle, right) for the thymus from control mice and β-cat GOF mice at the indicated stages. Representative data from three independent experiments are shown. Bar: 100 μm. (B) Flow cytometric analysis of thymic epithelial cells (TECs) from indicated mice at E15.5, showing the purity of the isolated TECs for quantitative RT-PCR analysis. Shown are representative profiles of CD45, PI, and EpCAM expression in total cells (left) and in isolated CD45−EpCAM+ TECs (right) from control mice and β-cat loss-of-function (LOF) mice. The numbers indicate the frequency of cells within indicated areas.
Figure 3
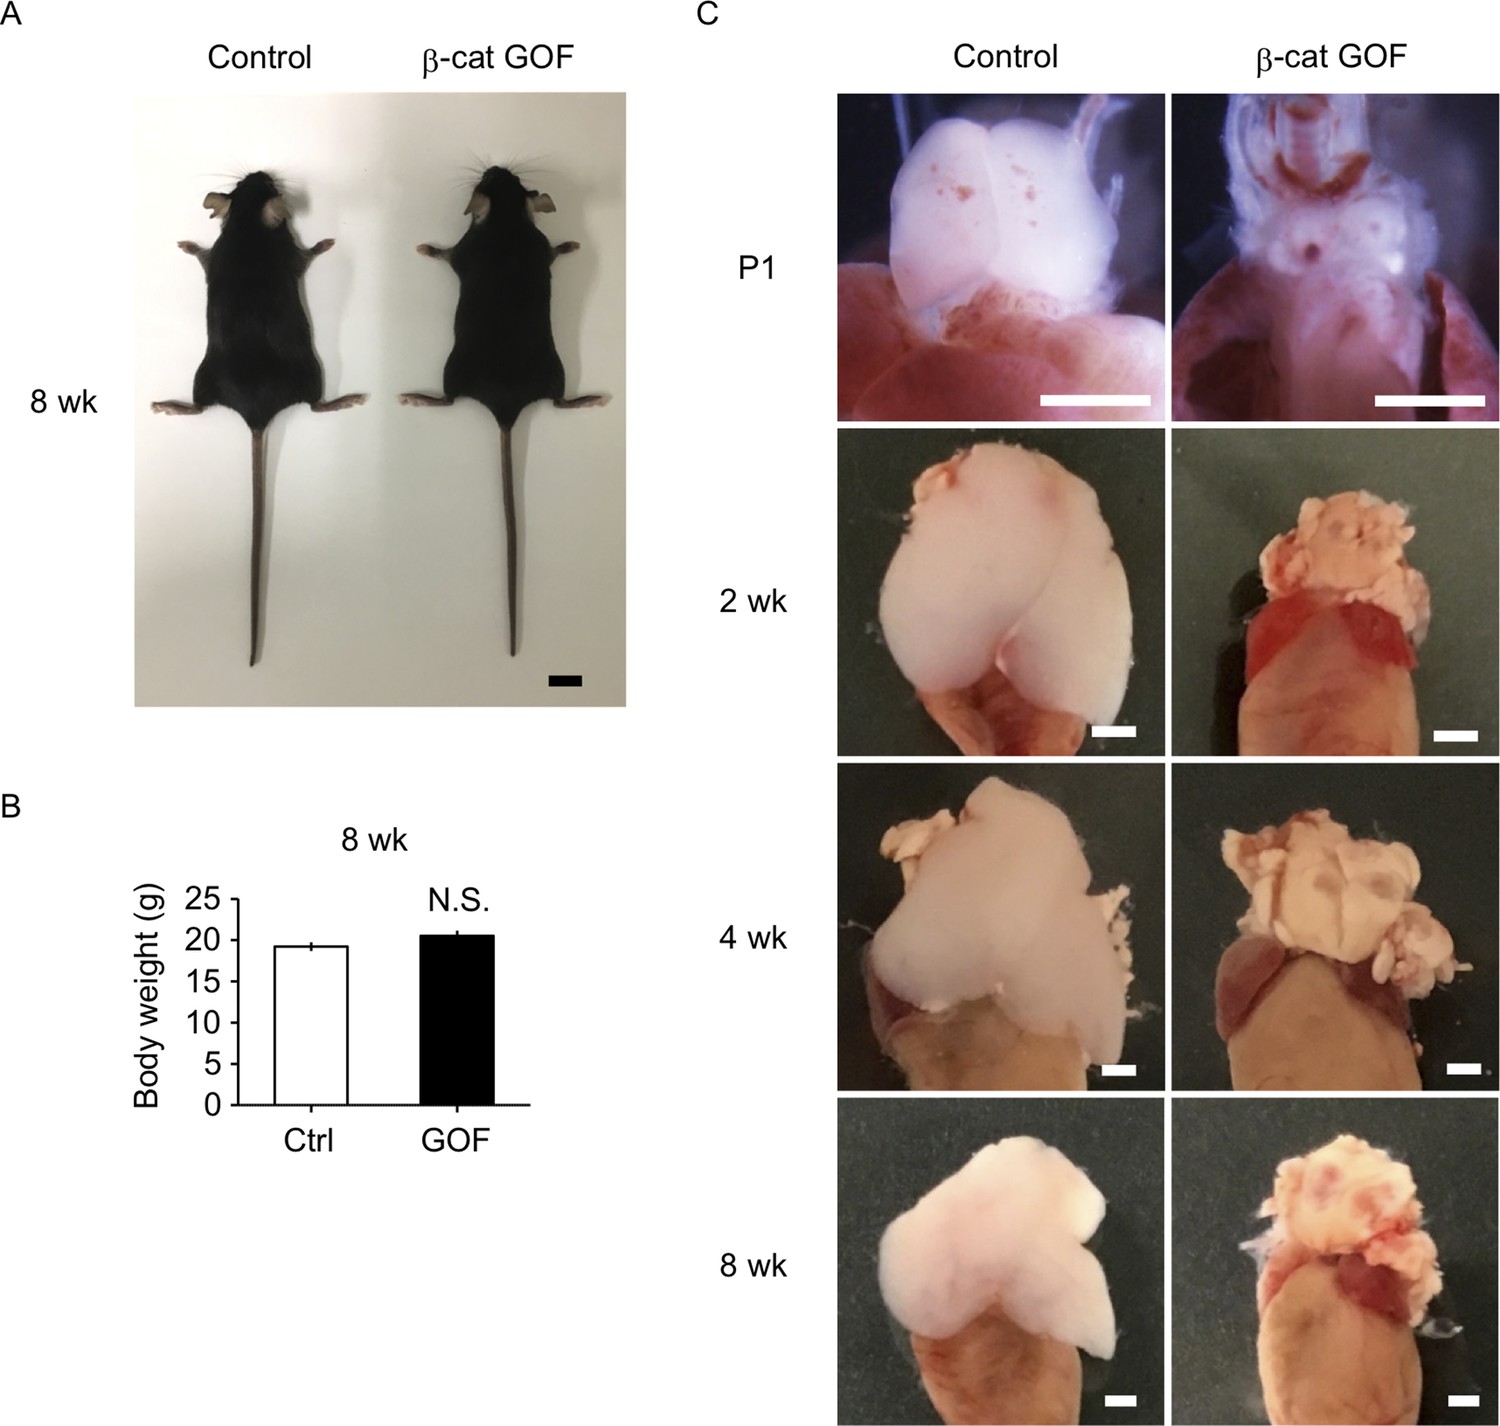
Thymic dysplasia in postnatal β-cat gain-of-function (GOF) mice.
(A) Appearance of control mice and β-cat GOF mice at 8 wk. Bar: 1 cm. (B) Body weight of control mice and β-cat GOF mice at 8 wk (means and standard error of the means [SEMs], n = 4–6). N.S., not significant. (C) Appearance of the thymus in control mice and β-cat GOF mice at postnatal stages (P1–8 wk). Bar: 1 mm.
Figure 4
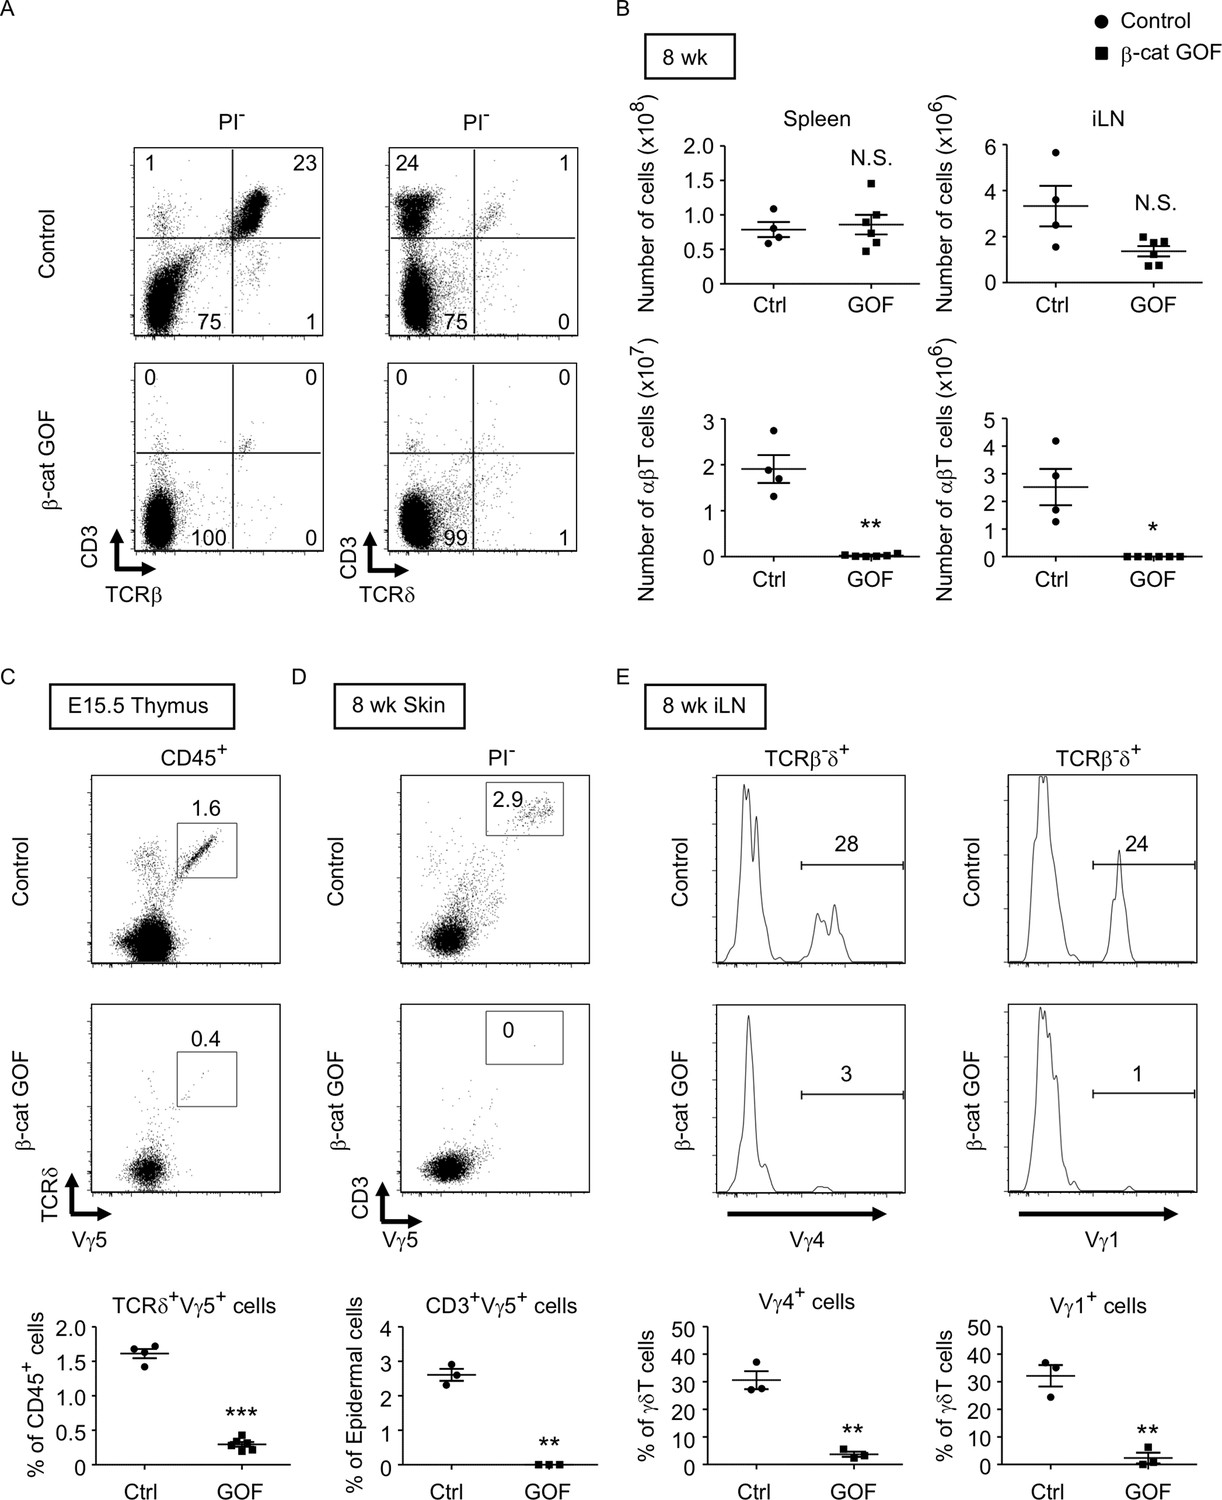
Loss of αβT and γδT cells in secondary lymphoid organs by the overexpression of β-catenin in thymic epithelial cells (TECs).
(A) Flow cytometric analysis of splenocytes from control mice and β-cat gain-of-function (GOF) mice at 11 wk. Shown are representative dot plot profiles of CD3 and TCRβ expression (left) and CD3 and TCRδ expression (right) in PI− viable cells. The numbers in dot plots indicate the frequency of cells within indicated area. (B) Cell numbers (means and standard error of the means [SEMs], n = 4–6) of indicated subpopulations in the spleen (left) and the iLN (right) from control and β-cat GOF mice at 8 wk are plotted. (C) Shown are representative dot plots of TCRδ and Vγ5 expression in CD45+ cells in the thymus from control mice and β-cat GOF mice at E15.5. The frequency of TCRδ+Vγ5+ cells is plotted (mean and SEMs; n = 4–6). (D) Flow cytometric analysis of dendritic epidermal T cells (DETCs) in the skin epidermis from control mice and β-cat GOF mice at 8 wk. Shown are representative dot plot profiles of CD3 and Vγ5 expression in epidermal cells. The numbers in dot plots indicate the frequency of cells within indicated area. The frequency of CD3+Vγ5+ cells in epidermal cells is plotted (means and SEMs; n = 3). (E) Histograms for Vγ4 and Vγ1 expression in TCRβ-δ+ cells in the iLN from control mice and β-cat GOF mice at 8 wk are shown. The frequency of Vγ4+ and Vγ1+ cells is plotted (means and SEMs; n = 3). *p < 0.05; **p < 0.01; ***p < 0.001; N.S., not significant.
Figure 5
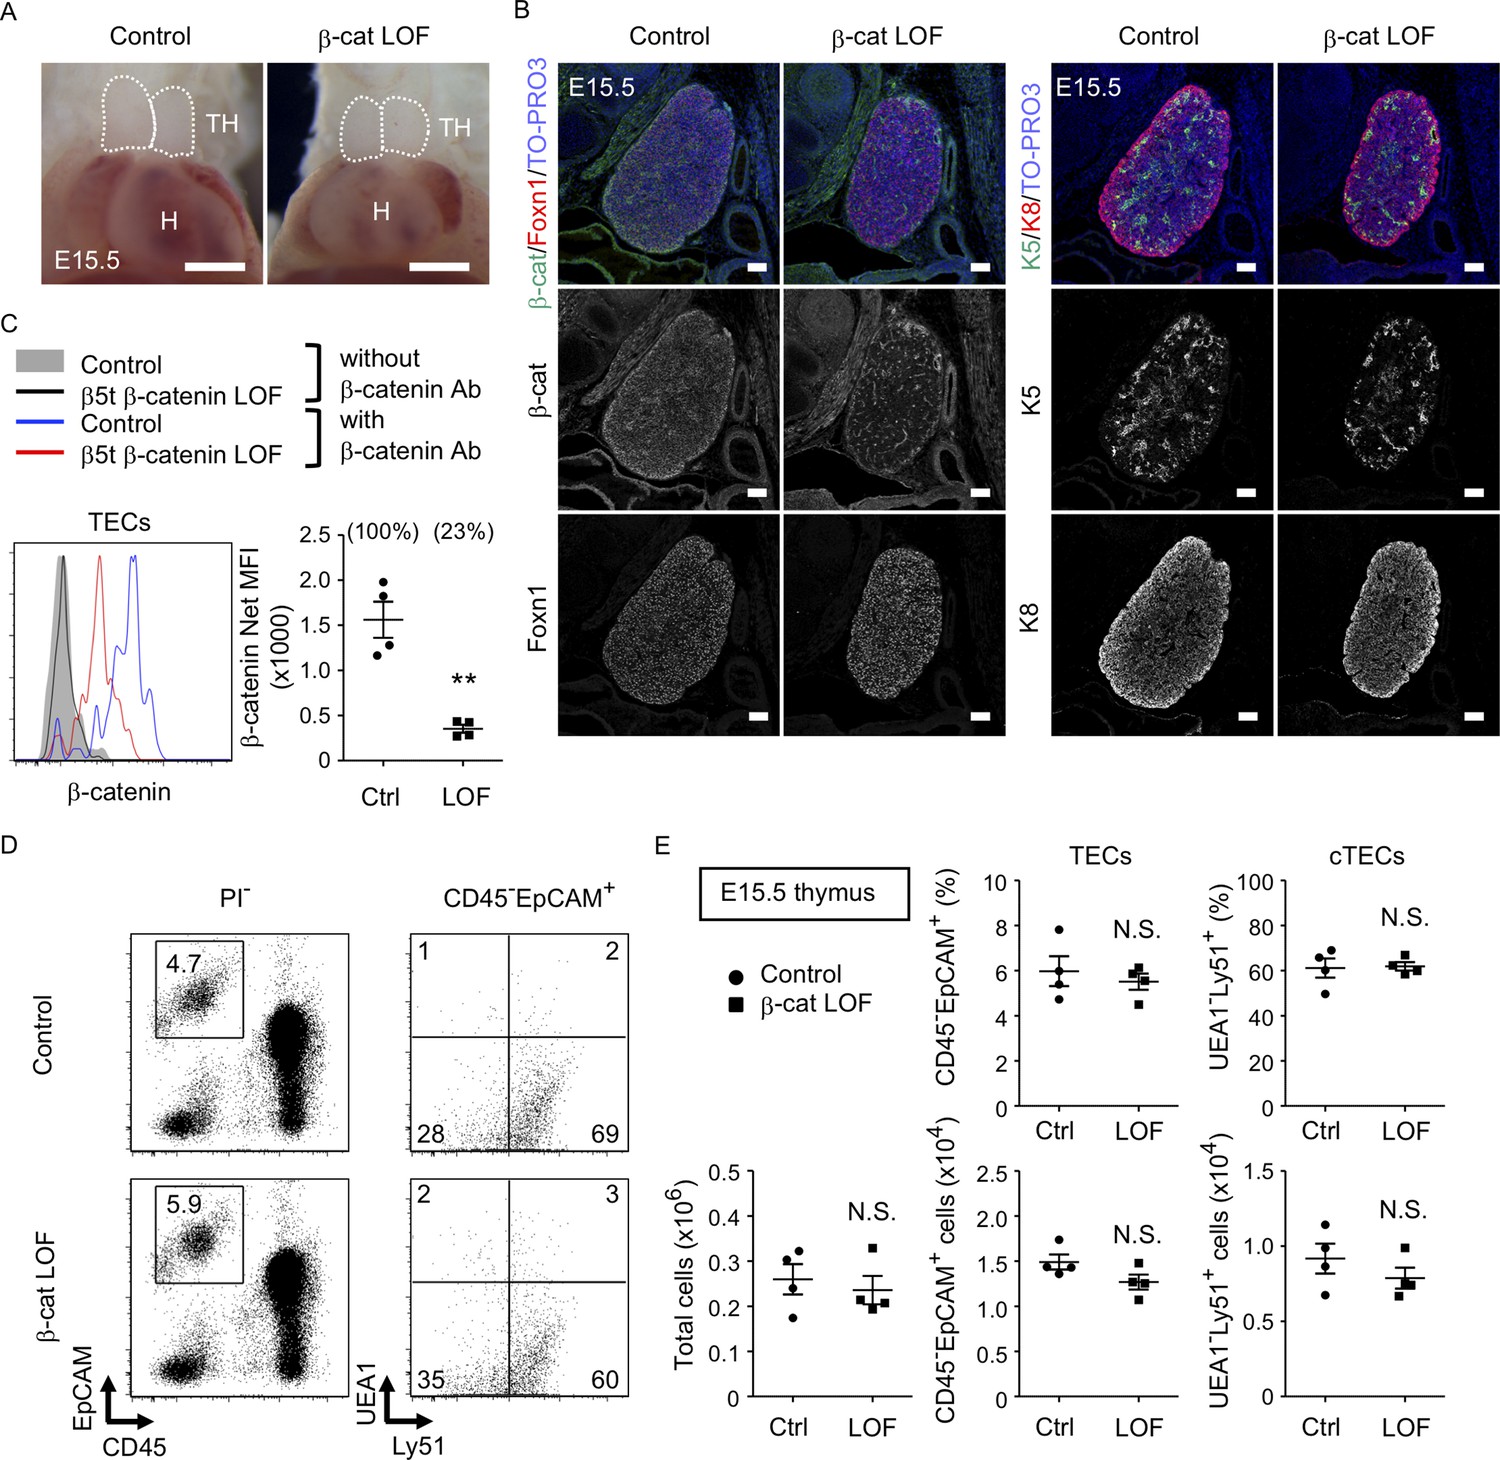
No apparent change in thymus development in β-cat loss-of-function (LOF) embryos.
(A) Thoracic cavity of control mice and β-cat LOF mice at E15.5. Dotted lines show the outline of the thymic primordium. Representative data from three independent experiments are shown. TH: thymus, H: heart. Bar: 1 mm. (B) Immunofluorescence staining for β-catenin and Foxn1 (left) or K5 and K8 (right) on sagittal sections of the thymus from control mice and β-cat LOF mice at E15.5. Shown are merged images with nuclear counterstaining (TO-PRO3) (top) and images obtained in each channel (middle, bottom). Representative data from three independent experiments are shown. Bar: 100 μm. (C) Intracellular staining of β-catenin in CD45−EpCAM+ thymic epithelial cells (TECs) from control mice and β-cat LOF mice at E15.5. Histograms show β-catenin expression in control TECs (blue line) and β-cat LOF TECs (red line). Shaded area and black line represent the fluorescence in the absence of anti-β-catenin antibody in control TECs and β-cat LOF TECs, respectively. Plots show net median fluorescence intensity (MFI) values for β-catenin (means and standard error of the means [SEMs], n = 4). The numbers in parentheses indicate percentage of control value. (D) Flow cytometric analysis of enzyme-digested thymic cells from indicated mice at E15.5. Shown are profiles of EpCAM and CD45 expression in PI− viable cells (left) and UEA1 reactivity and Ly51 expression in CD45−EpCAM+ cells (right). The numbers in dot plots indicate the frequency of cells within indicated area. (E) Plots show the number of total thymic cells (left) and the frequency and the number of total TECs (middle) and cortical thymic epithelial cell (cTECs; right) from control mice and β-cat LOF mice at E15.5 (means and SEMs, n = 4). **p < 0.01; N.S., not significant.
Figure 6
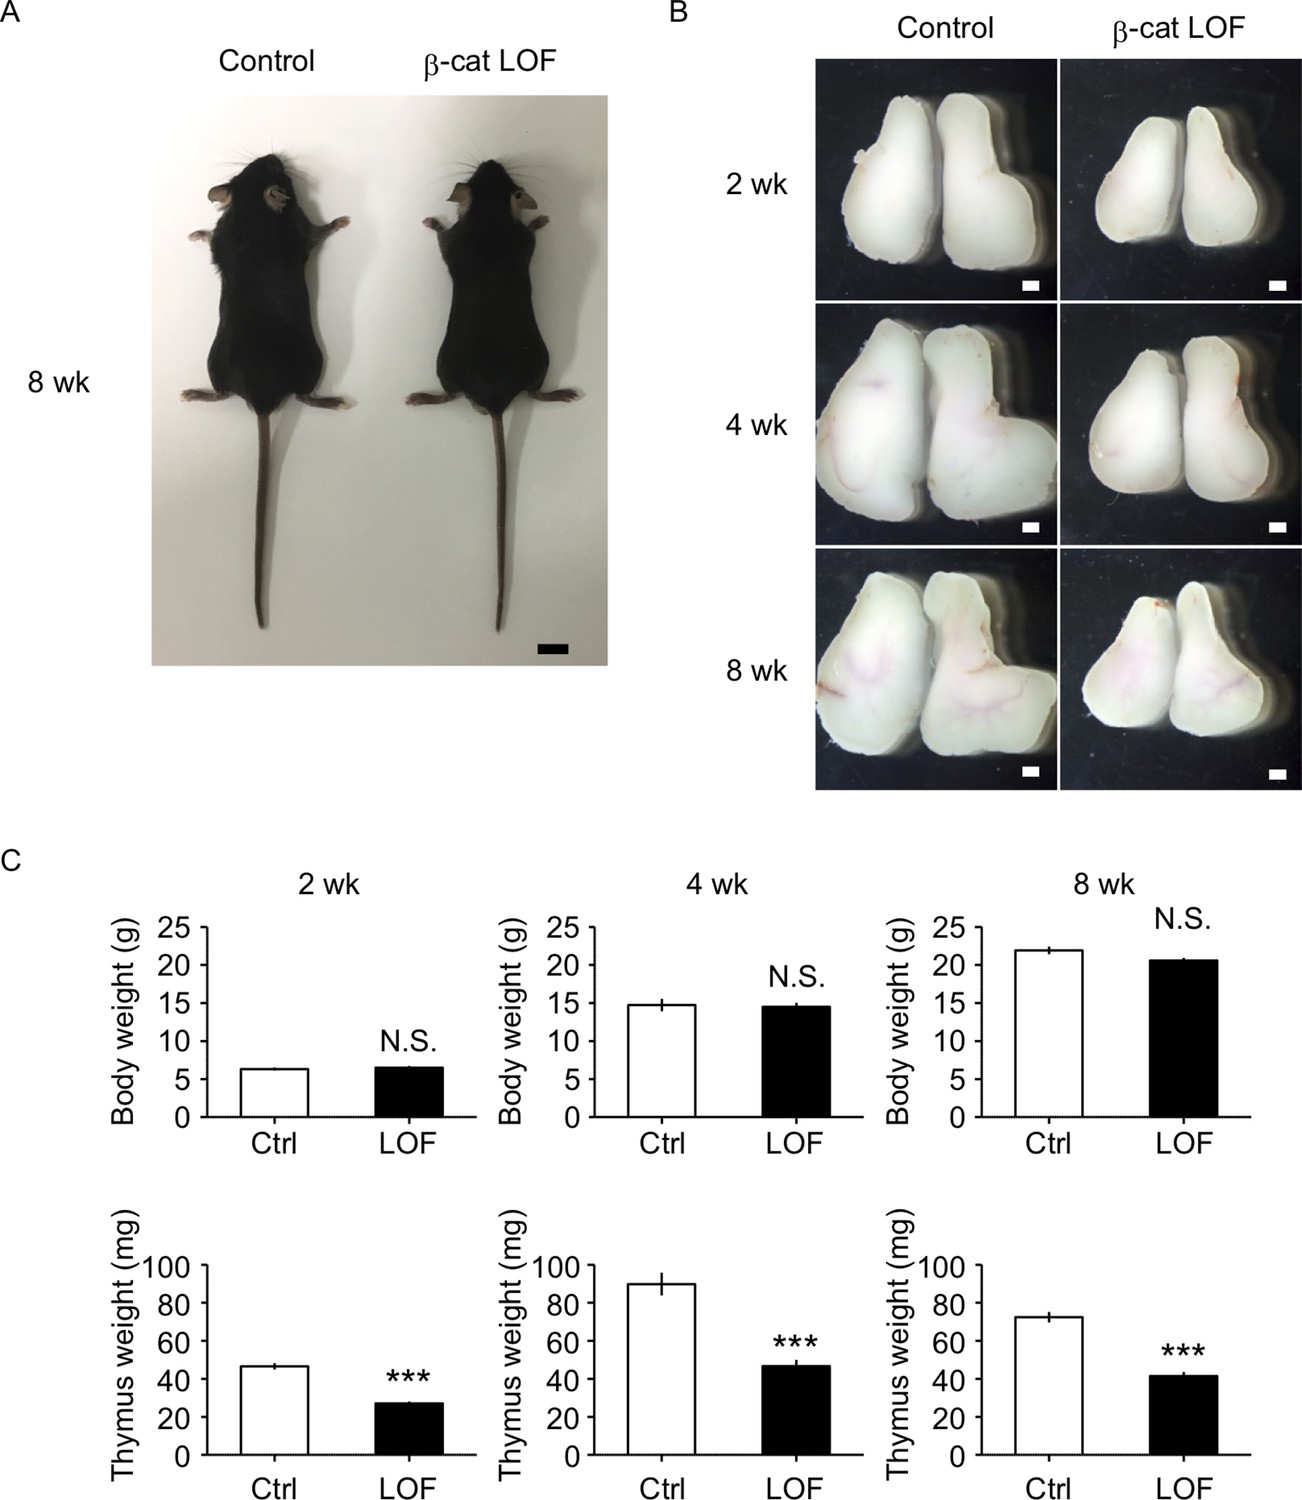
The reduction of thymus size in postnatal β-cat loss-of-function (LOF) mice.
(A) Appearance of control mice and β-cat LOF mice at 8 wk. Bar: 1 cm. (B) Appearance of the thymus from control mice and β-cat LOF mice at postnatal stages (2–8 wk). Representative data from at least three independent experiments are shown. Bar: 1 mm. (C) Bars show body weight (top) and thymus weight (bottom) at 2 wk (left, n = 3), 4 wk (middle, n = 4), and 8 wk (right, n = 5) in control mice and β-cat LOF mice (mean and standard error of the means [SEMs]). ***p < 0.001; N.S., not significant.
Figure 7 with 1 supplement
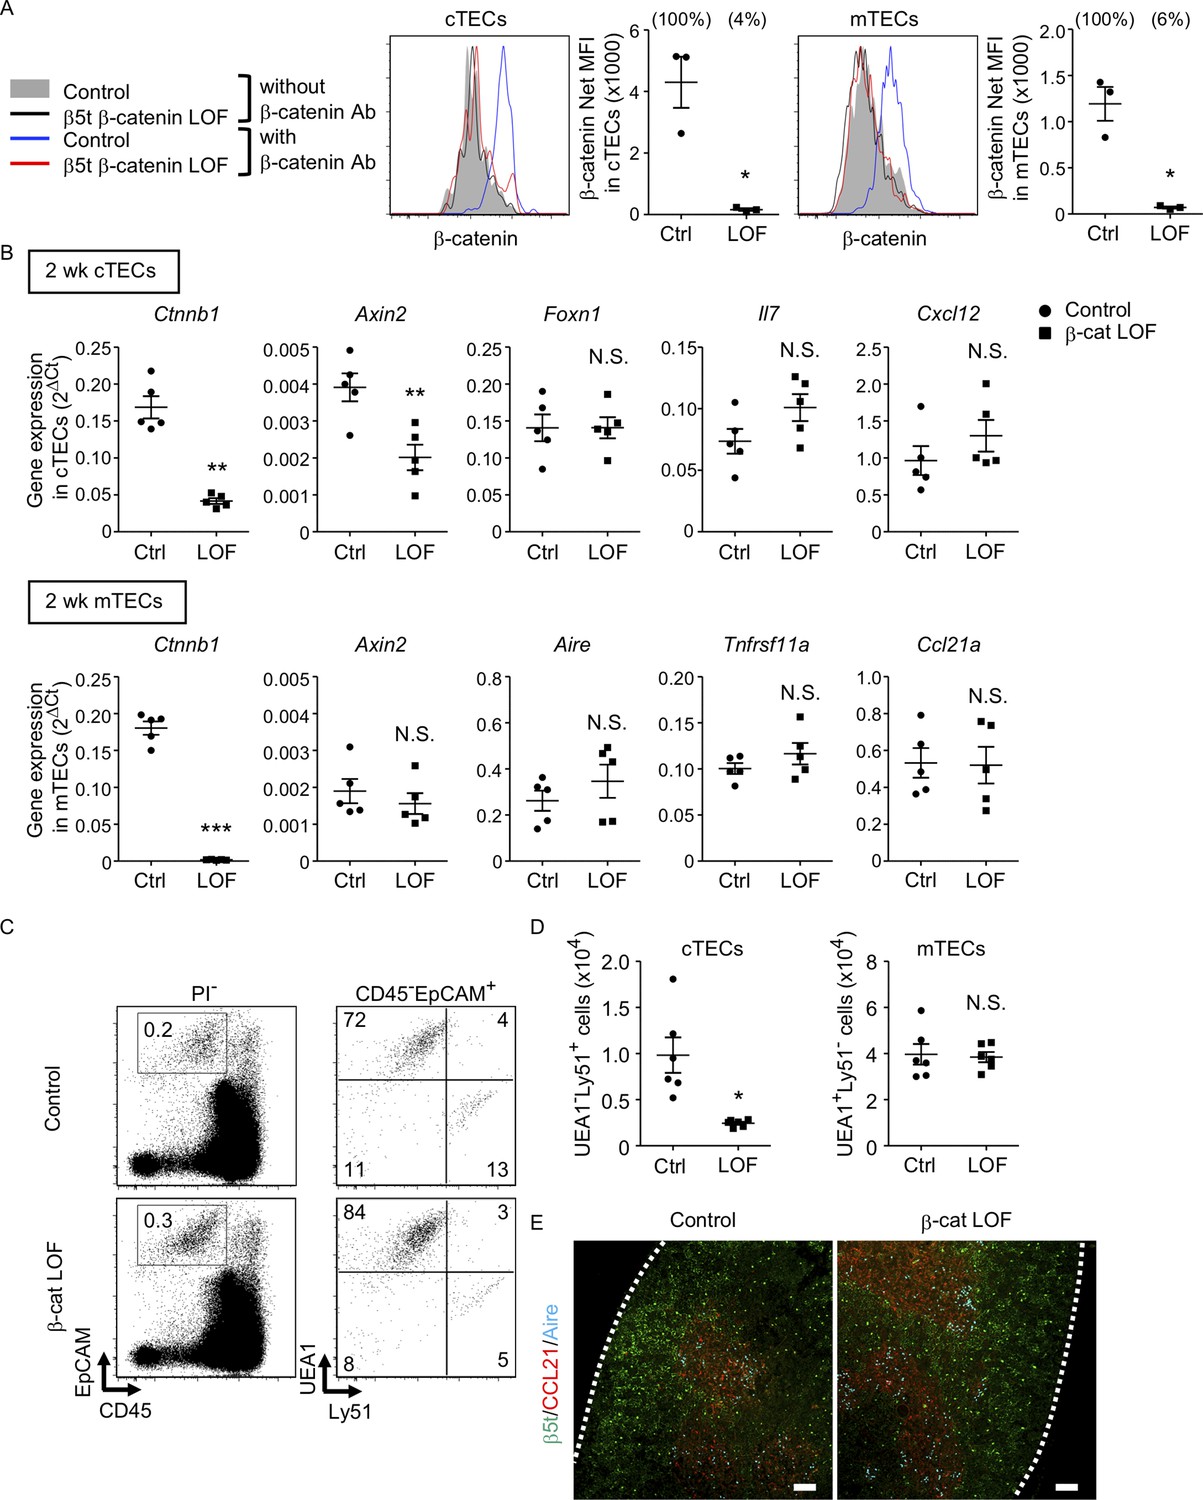
Characteristics of thymic epithelial cells (TECs) in postnatal β-cat loss-of-function (LOF) mice.
(A) Intracellular staining of β-catenin in UEA1−Ly51+ cortical thymic epithelial cells (cTECs; left) and UEA1+Ly51− medullary thymic epithelial cells (mTECs; right) from control mice and β-cat LOF mice at 2 wk. Histograms show β-catenin expression in cTECs and mTECs from control mice (blue line) and β-cat LOF mice (red line). Shaded area and black line represent the fluorescence in the absence of anti-β-catenin antibody in control TECs and β-cat LOF TECs, respectively. Plots show net MFI values for β-catenin in cTECs and mTECs (means and standard error of the means [SEMs], n = 3). The numbers in parentheses indicate percentage of control value. (B) Quantitative RT-PCR analysis of mRNA expression levels (means and SEMs, n = 5) of indicated genes relative to Gapdh levels in UEA1−Ly51+ cTECs (top) and UEA1+Ly51− mTECs (bottom) in the thymus of control mice and β-cat LOF mice at 2 wk. (C) Flow cytometric analysis of enzyme-digested thymic cells from control mice and β-cat LOF mice at 2 wk. Shown are representative profiles of EpCAM and CD45 expression in PI− viable cells (left) and UEA1 reactivity and Ly51 expression in CD45−EpCAM+ viable cells (right). The numbers in dot plots indicate the frequency of cells within indicated area. (D) Plots show the number (means and SEMs, n = 6) of cTECs and mTECs in the thymus from control mice and β-cat LOF mice at 2 wk. (E) Immunofluorescence analysis of β5t (green), CCL21 (red), and Aire (cyan) on transverse sections of thymus from control mice and β-cat LOF mice at 2 wk. Representative data from three independent experiments are shown. Bar: 100 μm. Ctrl: Control, LOF: β-cat LOF. *p < 0.05; **p < 0.01; ***p < 0.001; N.S., not significant.
Figure 7—figure supplement 1
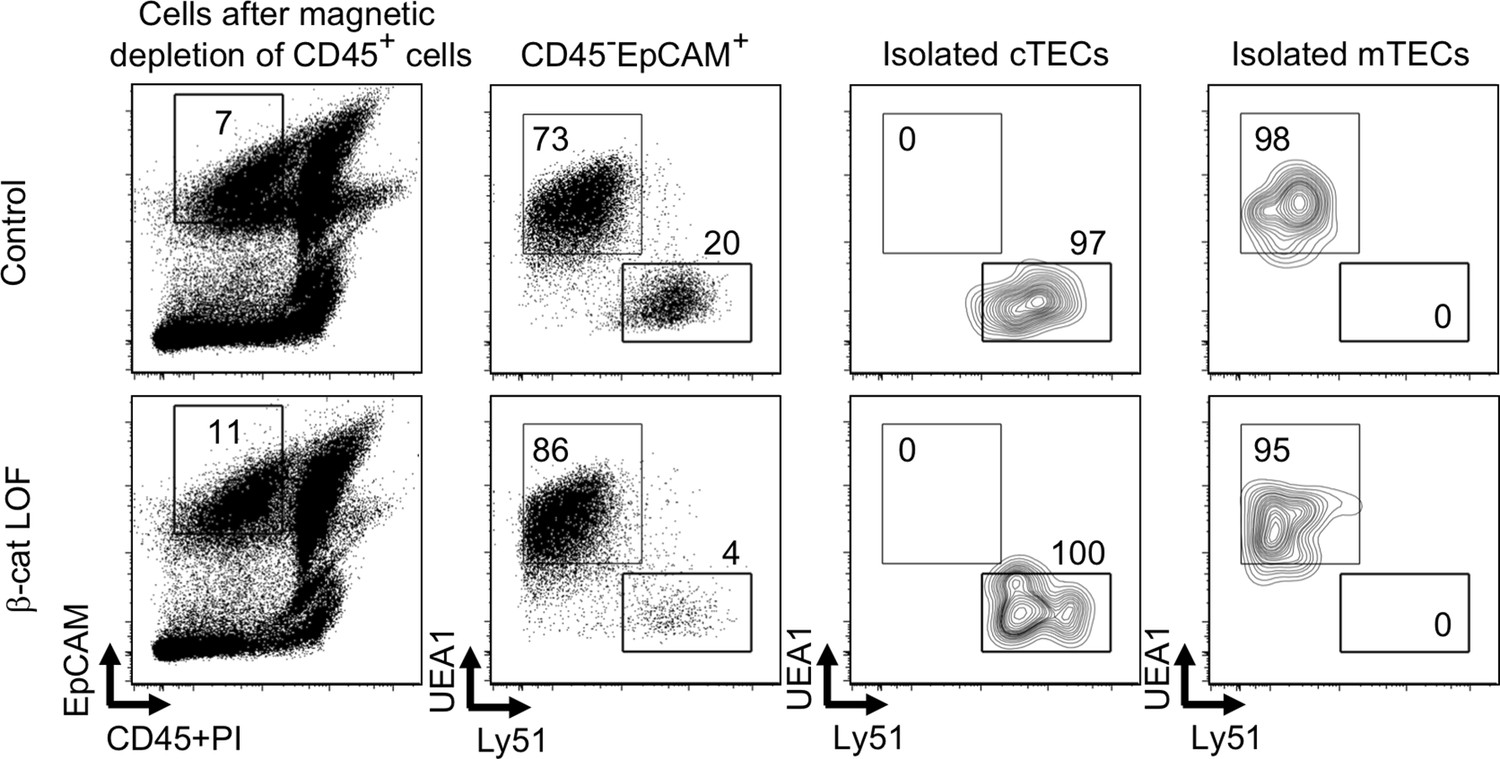
The purity of isolated cortical thymic epithelial cells (cTECs) and medullary thymic epithelial cells (mTECs) for quantitative RT-PCR analysis.
Flow cytometric analysis of cTECs and mTECs from indicated mice at 2 wk. Shown are representative profiles of CD45, PI, and EpCAM expression of total cells after magnetic depletion of CD45+ cells, UEA1 reactivity and Ly51 expression in CD45−EpCAM+ cells, and isolated cTECs and isolated mTECs from control mice and β-cat loss-of-function (LOF) mice. The numbers indicate the frequency of cells within indicated areas.
Figure 8
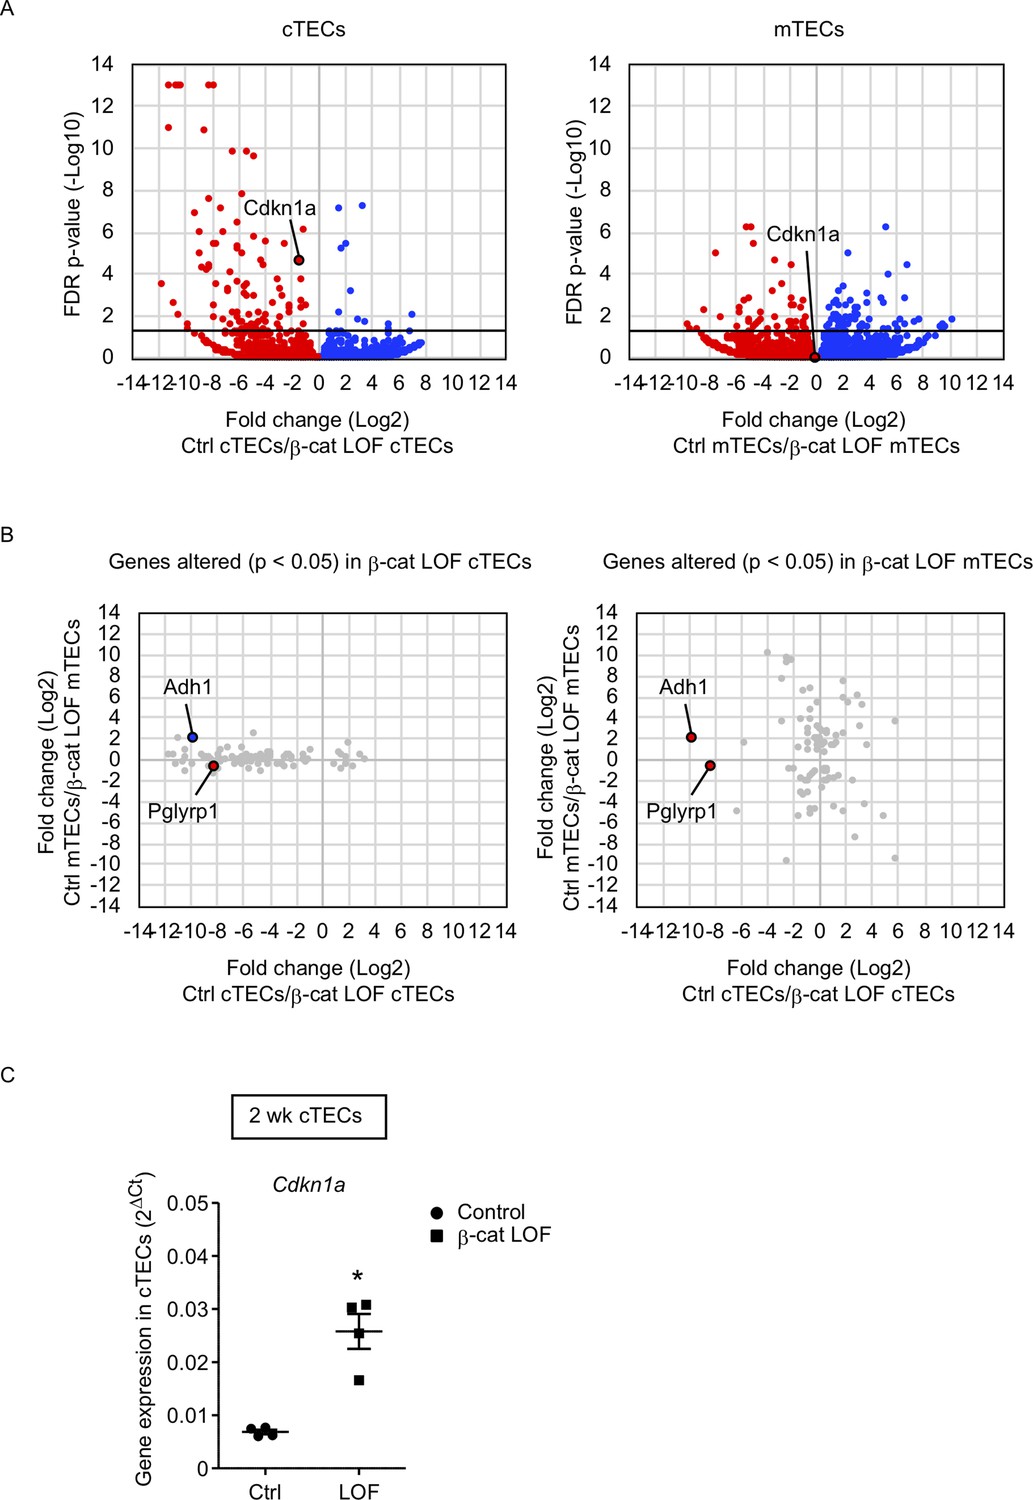
RNA sequencing analysis of cortical thymic epithelial cells (cTECs) and medullary thymic epithelial cells (mTECs) isolated from β-cat loss-of-function (LOF) mice.
(A) Volcano plot analysis of mRNA expression for cTECs (left) and mTECs (right) isolated from control (Ctrl) mice and β-cat LOF mice at 2 wk. Detected genes are plotted as log2 fold change (Ctrl/β-cat LOF) versus −log10 false discovery rate (FDR) p value. Bold horizontal lines in the plot show the p value of 0.05. (B) Correlation plot analysis for the genes differently altered (p < 0.05) in β-cat LOF cTECs (left) and β-cat LOF mTECs (right). Log2 fold changes of genes altered between Ctrl cTECs and β-cat LOF cTECs are plotted against log2 fold changes of genes altered between Ctrl mTECs and β-cat LOF mTECs. (C) Quantitative RT-PCR analysis of Cdkn1a mRNA expression normalized to Gapdh levels in UEA1−Ly51+ cTECs isolated from the thymus of control mice and β-cat LOF mice at 2 wk (means and standard error of the means [SEMs], n = 4). *p < 0.05.
Figure 9
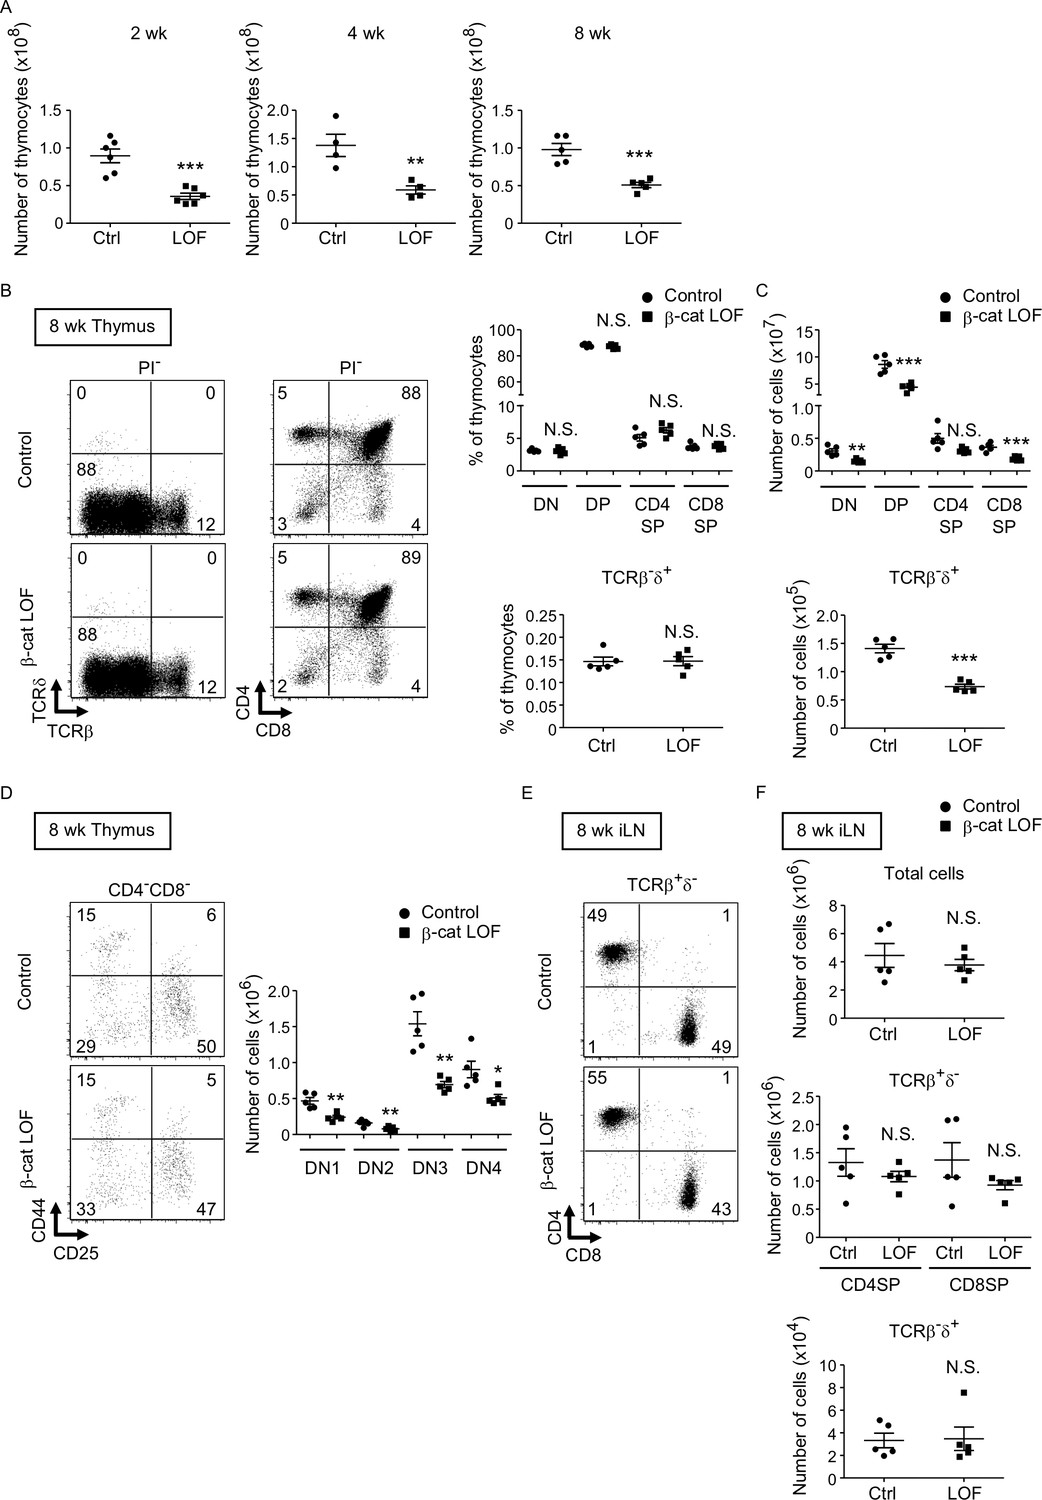
Reduced total thymocyte production in β-cat loss-of-function (LOF) mice during the postnatal development.
(A) Plots show the number (means and standard error of the means [SEMs], n = 4–6) of total thymocytes in the thymus of indicated mice at 2 wk (left), 4 wk (middle), and 8 wk (right). (B) Flow cytometric analysis of thymocytes from control mice and β-cat LOF mice at 8 wk. Shown are representative dot plot profiles of TCRβ and TCRδ expression and CD4 and CD8 expression in PI− viable cells. The numbers in dot plots indicate the frequency of cells within indicated area. Plots show the frequency of indicated thymocyte subpopulations (means and SEMs, n = 5). (C) Cell numbers (means and SEMs, n = 5) of indicated subpopulations in the thymus from control mice and β-cat LOF mice at 8 wk. (D) The frequency and number of DN thymocyte subsets in indicated mice at 8 wk. Dot plots (left) show representative CD44 and CD25 profiles in CD4−CD8− viable thymocytes. The numbers in dot plots indicate the frequency of cells within indicated area. Right panel shows cell numbers (means and SEMs, n = 5) of indicated DN subsets in the thymus from control mice and β-cat LOF mice. (E) Flow cytometric analysis of lymphocytes in the iLN from control mice and β-cat LOF mice at 8 wk. Shown are representative dot plot profiles of CD4 and CD8 expression in TCRβ+δ− viable cells. The numbers in dot plots indicate the frequency of cells within indicated area. (F) Cell numbers (means and SEMs, n = 4–5) of indicated subpopulations in the iLN from control mice and β-cat LOF mice at 8 wk. *p < 0.05; **p < 0.01; ***p < 0.001; N.S., not significant.
Figure 10
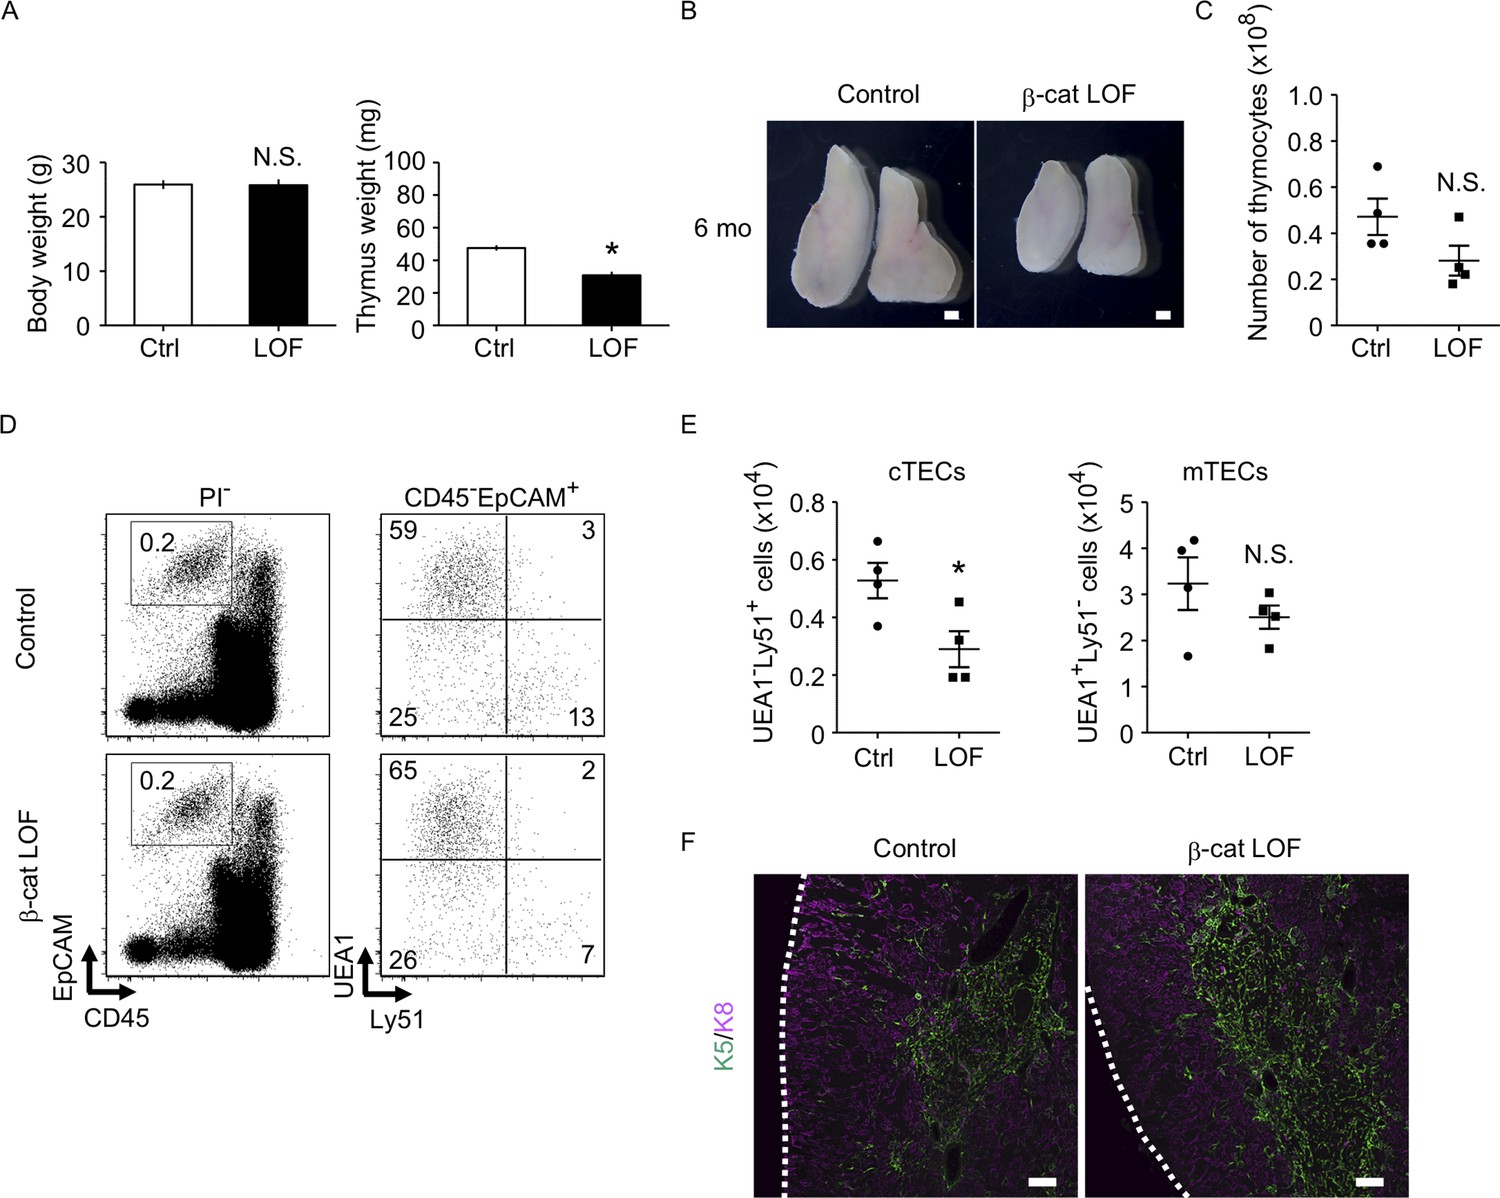
The thymus of β-cat loss-of-function (LOF) mice at 6 mo.
(A) Bars show body weight (left) and thymus weight (right) at 6 mo in control female mice and β-cat LOF female mice (means and standard error of the means [SEMs], n = 4). (B) Appearance of thymus from control mice and β-cat LOF mice at 6 mo. Representative data from four independent experiments are shown. Bar: 1 mm. (C) Plots show the number (means and SEMs, n = 4) of total thymocytes in the thymus from control mice and β-cat LOF mice at 6 mo. (D) Flow cytometric analysis of enzyme-digested thymic cells from control mice and β-cat LOF mice at 6 mo. Shown are representative profiles of EpCAM and CD45 expression in PI− viable cells (left) and UEA1 reactivity and Ly51 expression in CD45−EpCAM+ viable cells (right). The numbers in dot plots indicate the frequency of cells within indicated area. (E) Plots show the number (means and SEMs, n = 4) of cortical thymic epithelial cells (cTECs) and medullary thymic epithelial cells (mTECs) in the thymus from control mice and β-cat LOF mice at 6 mo. (F) Immunofluorescence analysis of K5 (green) and K8 (magenta) on transverse sections of thymus from control mice and β-cat LOF mice at 6 mo. Representative data from three independent experiments are shown. Bar: 100 μm. Ctrl: Control, LOF: β-cat LOF. *p < 0.05; N.S., not significant.
Figure 11
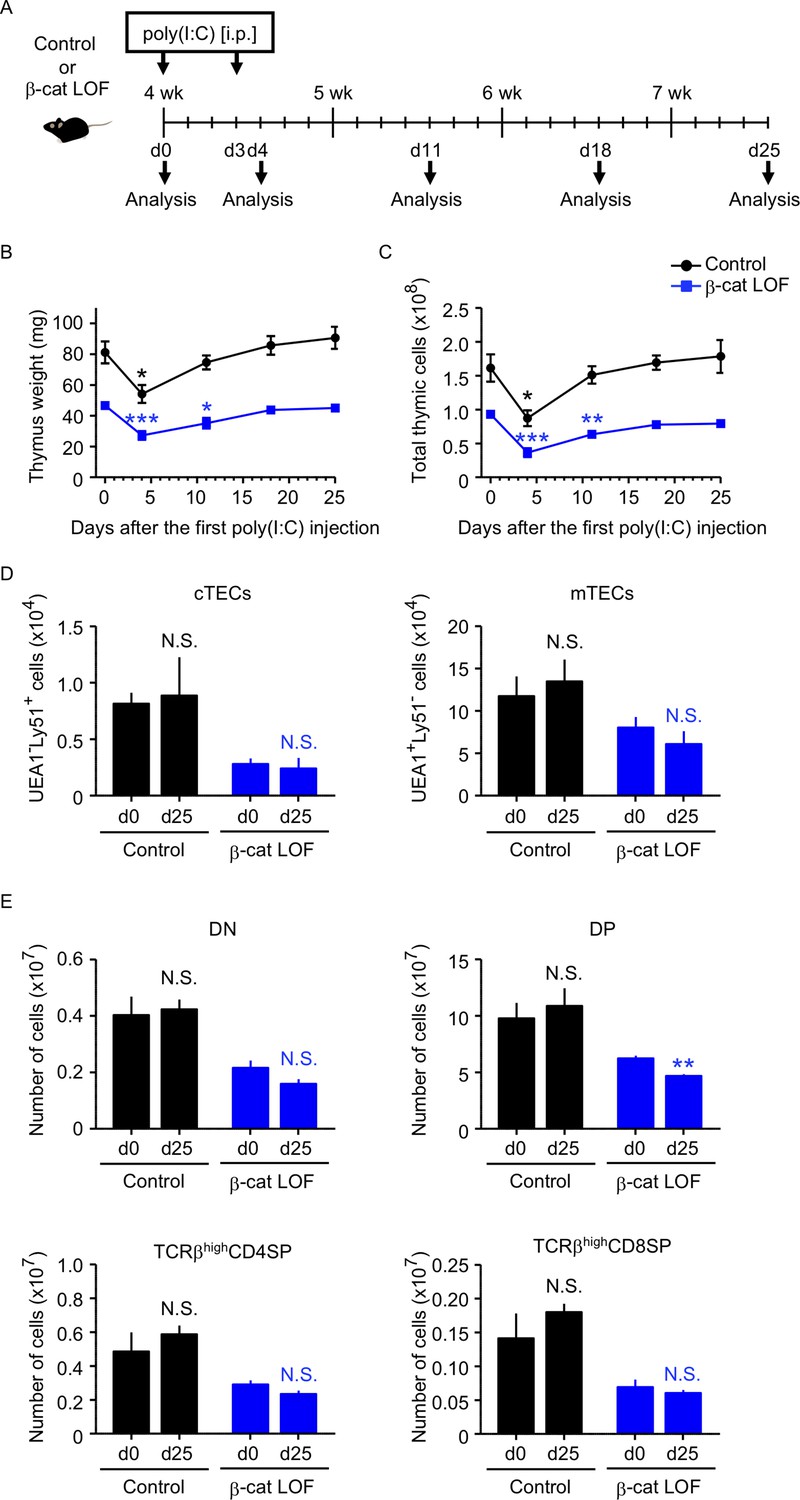
Thymus responses to poly(I:C) administration in β-cat loss-of-function (LOF) mice.
(A) Schematic diagram of poly(I:C) administration. Control mice or β-cat LOF mice at 4 wk were intraperitoneally injected with 250 μg of poly(I:C) on days 0 and 3, and the thymus was analyzed on the indicated days after the first poly(I:C) injection. d, day. Time course of thymus weight (B) and total thymic cellularity (C) in control mice (black line) and β-cat LOF mice (blue line) after poly(I:C) injection (means and standard error of the means [SEMs], n = 3–5). (D) Bars show the number of cortical thymic epithelial cells (cTECs) and medullary thymic epithelial cells (mTECs) on day 0 (d0) and day 25 (d25) after poly(I:C) injection (means and SEMs, n = 4–5) in control mice (black) and β-cat LOF mice (blue). (E) Bars show the number of indicated thymocytes on d0 and d25 after poly(I:C) injection (means and SEMs, n = 4–5) in control mice (black) and β-cat LOF mice (blue). *p < 0.05; **p < 0.01; ***p < 0.001; N.S., not significant.
Figure 12
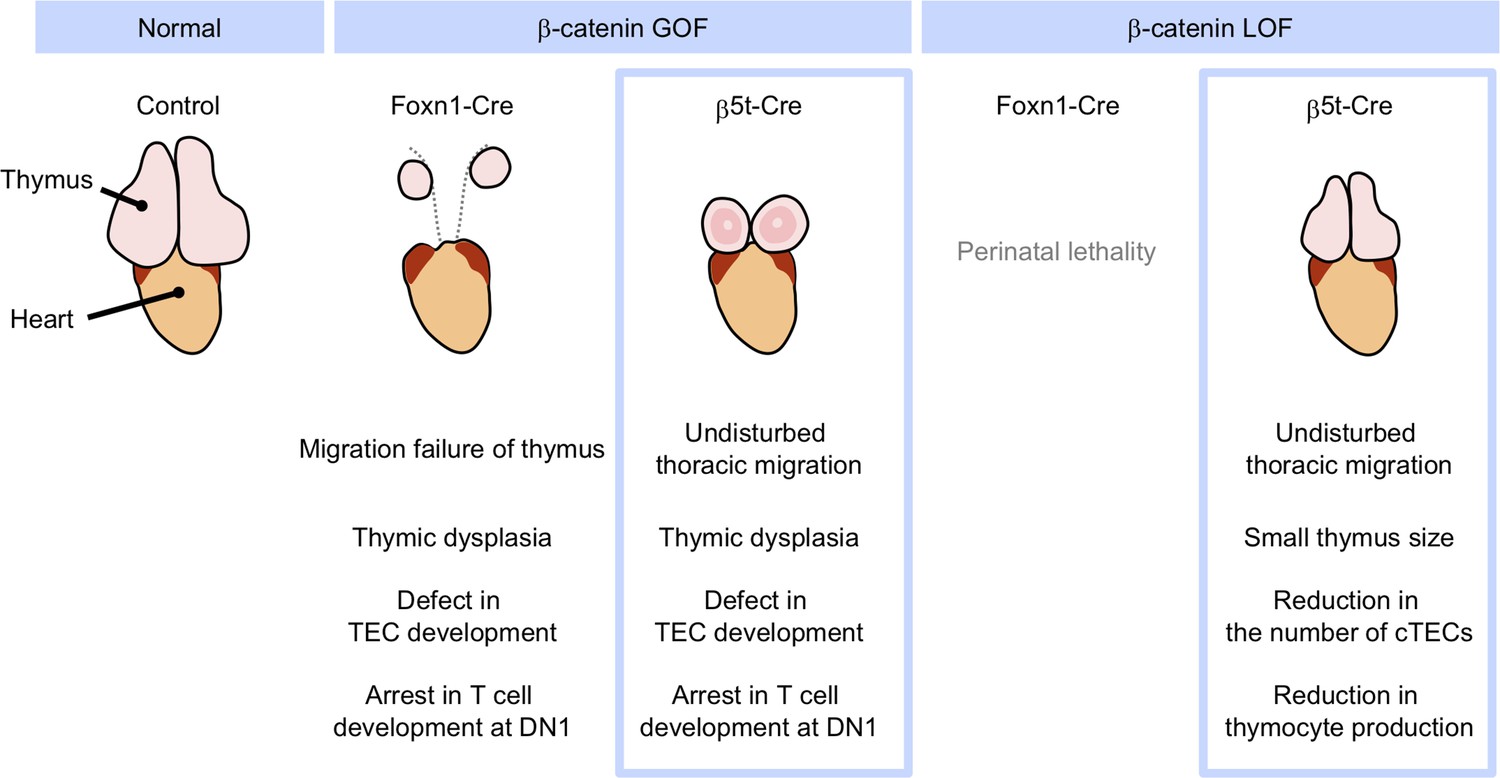
Phenotypic differences between conditional β-cat loss-of-function (LOF) and gain-of-function (GOF) mice during the postnatal period.
GOF of β-catenin using Foxn1-Cre and β5t-iCre causes severe defect in thymic epithelial cell (TEC development and arrest in T-cell development at DN1), whereas Foxn1-Cre-mediated GOF of β-catenin only results in the failure of migration of thymic primordium into the thoracic cavity. LOF of β-catenin using Fonx1-Cre results in perinatal lethality, whereas LOF of β-catenin using β5t-iCre does not lead to reduced viability throughout development. β5t-Cre-mediated LOF of β-catenin results in reduction in thymus size and the number of cortical thymic epithelial cells (cTECs) and total thymocyte production during the postnatal period.
Tables
Key resources table
| Reagent type (species) or resource | Designation | Source or reference | Identifiers | Additional information |
|---|---|---|---|---|
| Strain, strain background (Mus musculus) | C57BL/6N | SLC Japan | RRID:MGI:5295404 | |
| Strain, strain background (Mus musculus) | β5t-iCre | Ohigashi et al., 2013 | N/A | |
| Strain, strain background (Mus musculus) | Ctnnb1 floxed(β-catfl) | Brault et al., 2001 | RRID:IMSR_JAX:004152 | |
| Strain, strain background (Mus musculus) | Ctnnb1 exon 3 floxed(β-catex3fl) | Harada et al., 1999 | N/A | |
| Strain, strain background (Mus musculus) | Rosa26-CAG-loxP-stop-loxP-tdTomato(R26R-tdTomato) | Madisen et al., 2010 | RRID:IMSR_JAX:007914 | |
| Antibody | Anti-Foxn1 (Rabbit polyclonal) | Itoi et al., 2006 | N/A | IHC (1:100) |
| Antibody | Anti-β5t(Rabbit polyclonal) | Murata et al., 2007 | N/A | IHC (1:200) |
| Antibody | Anti-CCL21/6Ckine(Rat monoclonal, Clone 59106) | R&D systems | Cat# MAB457, RRID:AB_2259799 | IHC (1:10) |
| Antibody | Anti-Aire-eFluor 660(Rat monoclonal,Clone 5H12) | e-Bioscience | Cat# 50-5934-82, RRID:AB_2574257 | IHC (1:20) |
| Antibody | Anti-β-catenin(Mouse monoclonal, Clone 14) | BD Transduction Laboratories | Cat# 610154, RRID:AB_397555 | IHC (1:200)FC (1:100) |
| Antibody | Anti-Keratin 5(Chicken polyclonal,Clone Poly9059) | BioLegend | Cat# 905901, RRID:AB_2565054 | IHC (1:500) |
| Antibody | Anti-Keratin 8(Mouse monoclonal, Clone IE8) | BioLegend | Cat# 904804, RRID:AB_2616821 | IHC (1:500) |
| Antibody | Anti-CD45-Biotin(Rat monoclonal, Clone 30-F11) | BioLegend | Cat# 103104, RRID:AB_312969 | IHC (1:100) |
| Antibody | Anti-mouse CD45-PE/Cy5(Rat monoclonal, Clone 30-F11) | BioLegend | Cat# 103110, RRID:AB_312975 | IHC (1:100) |
| Antibody | Anti-CD45-eFluor 450(Rat monoclonal, Clone 30-F11) | eBioscience | Cat# 48-0451-80, RRID:AB_1518807 | FC (1:200) |
| Antibody | CD45 MicroBeads(Rat monoclonal) | Miltenyi Biotec | Cat# 130-052-301, RRID:AB_2877061 | |
| Antibody | Anti-EpCAM-PE/Cy7(Rat monoclonal, Clone G8.8) | BioLegend | Cat# 118216, RRID:AB_1236471 | FC (1:100) |
| Antibody | Anti-Ly51-Alexa Fluor 647(Rat monoclonal, clone 6C3) | BioLegend | Cat# 108312, RRID:AB_2099613 | FC (1:250) |
| Antibody | Anti-Ly51-PE(Rat monoclonal, clone 6C3) | BioLegend | Cat# 108308, RRID:AB_313365 | FC (1:100) |
| Antibody | Ulex Europaeus Agglutinin I (UEA1)-Biotin | Vector Laboratories | Cat# B-1065, RRID:AB_2336766 | FC (1:1000) |
| Antibody | Ulex Europaeus Agglutinin I (UEA1)-DyLight 649 | Vector Laboratories | Cat# DL-1068 | FC (1:500) |
| Antibody | Anti-CD4-APC (Rat monoclonal, Clone RM4-5) | eBioscience | Cat# 17-0042-81, RRID:AB_469322 | FC (1:100) |
| Antibody | Anti-CD8α-eFluor 450 (Rat monoclonal, Clone clone 53-6.7) | Invitrogen | Cat# 48-0081-80, RRID:AB_1272235 | FC (1:200) |
| Antibody | Anti-CD25-FITC(Rat monoclonal, Clone PC61) | BioLegend | Cat# 102006, RRID:AB_312855 | FC (1:250) |
| Antibody | Anti-CD44-PE/Cy7 (Rat monoclonal, Clone IM7) | eBioscience | Cat# 25-0441-81, RRID:AB_469622 | FC (1:100) |
| Antibody | Anti-TCRβ-PE (Armenian hamster monoclonal, Clone H57-597) | BioLegend | Cat# 109207, RRID:AB_313430 | FC (1:100) |
| Antibody | Anti-TCRδ-Biotin (Armenian hamster monoclonal, Clone GL3) | BioLegend | Cat# 118103, RRID:AB_313827 | FC (1:250) |
| Antibody | Anti-Vγ5-FITC (Hamster monoclonal, Clone 536) | BD Pharmingen | Cat# 553229, RRID:AB_394721 | FC (1:100) |
| Antibody | Anti-Vγ4-FITC (Armenian hamster monoclonal, Clone UC3-10A6) | BD Pharmingen | Cat# 553226, RRID:AB_394720 | FC (1:100) |
| Antibody | Anti-Vγ1-FITC(Armenian hamster monoclonal, Clone 2.11) | BioLegend | Cat# 141103, RRID:AB_10694242 | FC (1:100) |
| Antibody | Anti-CD3ε-APC(Armenian hamster monoclonal, Clone 145-2C11) | BioLegend | Cat# 100312, RRID:AB_312677 | FC (1:20) |
| Antibody | Mouse IgG1 (Mouse monoclonal, Clone MOPC-21) | BD Pharmingnen | Cat# 554121, RRID:AB_395252 | FC (1:200) |
| Antibody | Anti-chicken IgG-Alexa Fluor 488 (Goat polyclonal) | Molecular Probes | Cat# A-11039, RRID:AB_142924 | IHC (1:500) |
| Antibody | Anti-mouse IgG-Alexa Fluor 488 (Goat polyclonal) | Invitrogen | Cat# A-11001, RRID:AB_2534069 | IHC (1:500) |
| Antibody | Anti-mouse IgG-Alexa Fluor Plus 488 (Goat polyclonal) | Invitrogen | Cat# A32723, RRID:AB_2633275 | FC (1:800) |
| Antibody | Anti-mouse IgG2a-Alexa Fluor 555 (Goat polyclonal) | Molecular Probes | Cat# A-21137, RRID:AB_2535776 | IHC (1:500) |
| Antibody | Anti-rabbit IgG-Alexa Fluor 488 (Goat polyclonal) | Invitrogen | Cat# A-11034, RRID:AB_2576217 | IHC (1:500) |
| Antibody | Anti-rabbit IgG-Alexa Fluor 555 (Goat polyclonal) | Invitrogen | Cat# A-21429, RRID:AB_2535850 | IHC (1:500) |
| Antibody | Anti-rat IgG-Alexa Fluor 555 (Goat polyclonal) | Invitrogen | Cat# A-21434, RRID:AB_2535855 | IHC (1:500) |
| Peptide, recombinant protein | Streptavidin-Alexa Fluor 488 | Invitrogen | Cat# S32354, RRID:AB_2315383 | IHC (1:500) |
| Peptide, recombinant protein | Streptavidin-APC-eFluor 780 | Invitrogen | Cat# 47-4317-82, RRID:AB_10366688 | FC (1:80) |
| Peptide, recombinant protein | Streptavidin-PE | Invitrogen | Cat# S866 | FC (1:400) |
| Peptide, recombinant protein | DNase I | Roche | Cat# 04716728001 | (0.01%) |
| Commercial assay or kit | RNeasy Plus Micro Kit | Qiagen | Cat# 74,034 | |
| Commercial assay or kit | SMART-seq v4 Ultra Low Input RNA Kit for Sequencing | Takara Bio | Cat# 634,888 | |
| Commercial assay or kit | Nextera XT DNA Library Preparation Kit | Illumina | Cat# FC-131-1024 | |
| Commercial assay or kit | NextSeq 500/550 High Output Kit v2.5 (75 cycles) | Illumina | Cat# 20024906 | |
| Software, algorithm | GraphPad Prism | GraphPad | RRID:SCR_002798 | v7.0e |
| Software, algorithm | CLC Genomics Workbench | Qiagen | RRID:SCR_011853 | v12.0 |
| Other | poly(I:C) HMW | InvivoGen | Cat# tlrl-pic | |
| Other | TO-PRO3 | Thermo Fisher Scientific | Cat# T3605 | IHC (1:1000) |
| Other | Liberase TM | Roche | Cat# 5401127001 | (0.5 or 1 unit/ml) |
Additional files
Download links
A two-part list of links to download the article, or parts of the article, in various formats.
Downloads (link to download the article as PDF)
Open citations (links to open the citations from this article in various online reference manager services)
Cite this article (links to download the citations from this article in formats compatible with various reference manager tools)
Fine-tuning of β-catenin in mouse thymic epithelial cells is required for postnatal T-cell development
eLife 11:e69088.
https://doi.org/10.7554/eLife.69088


