Cooperation among c-subunits of FoF1-ATP synthase in rotation-coupled proton translocation
- Faculty of Education, Tokoha University, Japan
- Department of Chemistry and Biochemistry, National Institute of Technology, Numazu College, Japan
- Department of Chemical and Biological Engineering, National Institute of Technology, Ube College, Japan
- Department of Biophysics, Graduate School of Science, Kyoto University, Japan
Figures
Figure 1
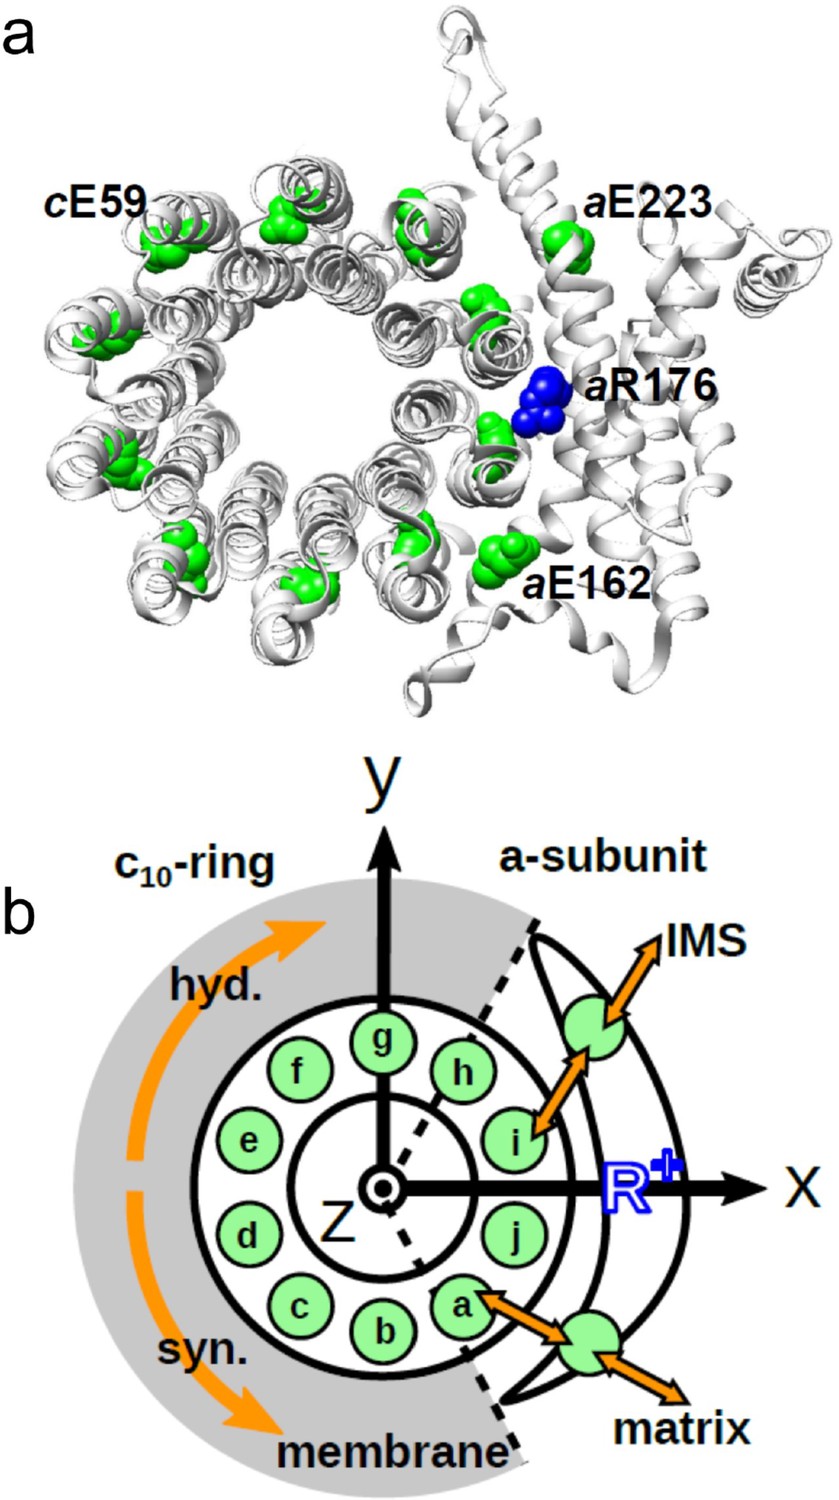
Schematic picture of the a-subunit and c-ring of Fo.
(a) The ac10 part of the Fo region is depicted as a ribbon diagram. Spheres represent cE59, which was substituted in this study, aE223, aE162, and aR176 (blue) (the residue numbers are those from yeast). (b) Schematic diagram of our simulation model. Green circles represent protonatable glutamates. Those in the 10 c-subunits are labeled (a–j). The membrane drawn in gray is modeled implicitly. Protons can hop between cE59 and the glutamates in the a-subunit, aE223, and aE162. Additionally, aE223 and aE162 exchange their protons with the inner membrane space (IMS) and matrix aqueous environment, respectively. Arrows in orange indicate the net proton flow. We set the rotational axis of the c10-ring as the z-axis, and the position of aR176 as the x-axis. Clockwise rotation of the c-ring occurs in the ATP hydrolysis mode, and counterclockwise rotation of the c-ring occurs in the ATP synthesis mode.
-
Figure 1—source data 1
Schematic picture of the a-subunit and c-ring of Fo.
- https://cdn.elifesciences.org/articles/69096/elife-69096-fig1-data1-v1.pdf
-
Figure 1—source data 2
Schematic diagram of simulation model.
- https://cdn.elifesciences.org/articles/69096/elife-69096-fig1-data2-v1.pdf
Figure 2
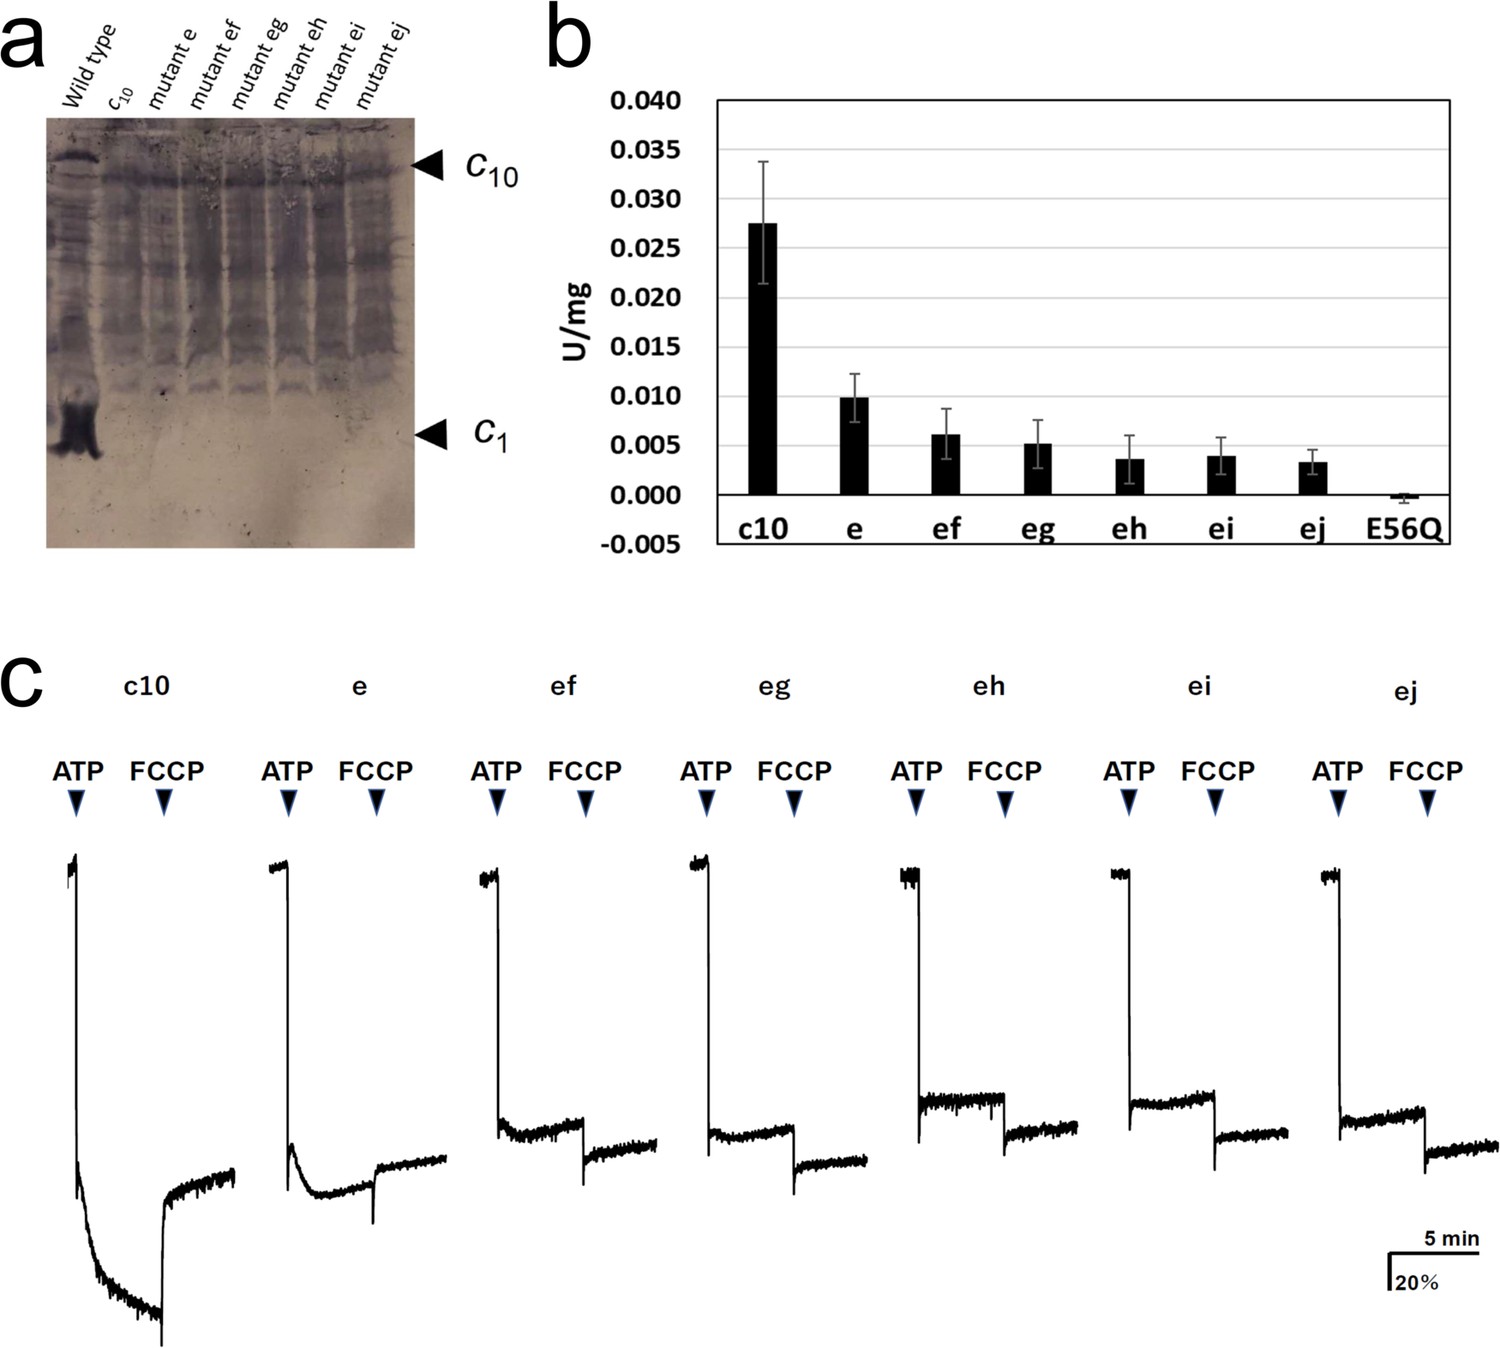
Expression of the mutated Fo-c subunit and proton pump, and ATP synthesis activities of membrane vesicles containing mutated FoF1s.
(a) Proteins were separated using SDS-PAGE and immunoblotted with anti-Fo-c antibodies. (b) ATP synthesis driven by NADH oxidation. The rightmost bars [E56Q] show the results of c10(E56Q)-FoF1. Error bar: standard error. (c) ATP-driven proton pump activity was measured by monitoring ACMA fluorescence quenching.
-
Figure 2—source data 1
Expression of the mutated Fo-c subunit.
- https://cdn.elifesciences.org/articles/69096/elife-69096-fig2-data1-v1.zip
-
Figure 2—source data 2
ATP synthesis activities of membrane vesicles containing mutated FoF1s.
- https://cdn.elifesciences.org/articles/69096/elife-69096-fig2-data2-v1.xlsx
Figure 3 with 2 supplements
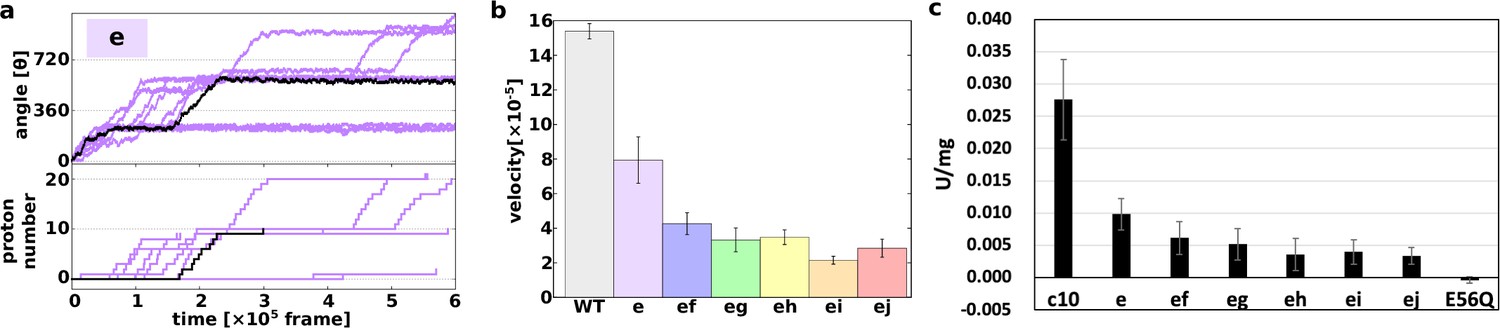
Proton transfer-coupled MD simulation of the WT and hetero mutants with Asp substitution of Glu.
(a) Ten trajectories of the “e” mutant. The black line shows one representative trajectory. Upper part: rotation angle from initial position of c(a); lower part: the number of protons that entered from the IMS channel and were transported to the matrix channel through rotation. (b) Average rotational velocities for WT and mutants. Error bar: standard error. (c) ATP synthesis driven by NADH oxidation. In order to evaluate the correspondence between simulation data and experimental data, ATP synthesis activity which is identical to Figure 2B is shown. IMS, inner membrane space; MD, molecular dynamics; WT, wild-type.
-
Figure 3—source data 1
Proton transfer-coupled MD simulation of the WT and hetero mutants with Asp substitution of Glu.
- https://cdn.elifesciences.org/articles/69096/elife-69096-fig3-data1-v1.zip
Figure 3—figure supplement 1
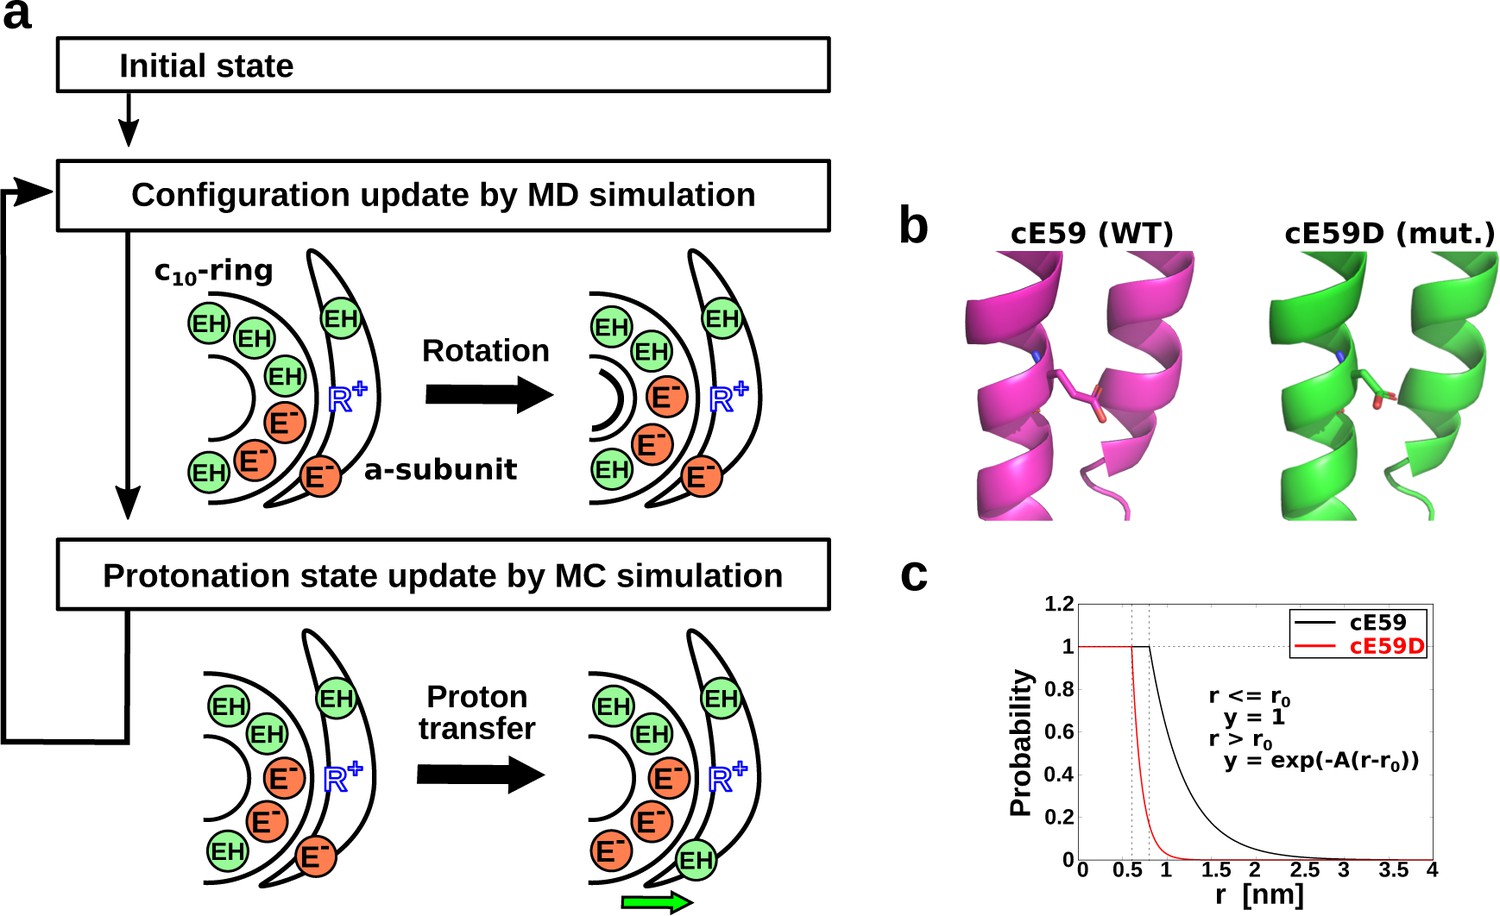
(a) Simulation overview; (b) visualized cE59 (left) and cE59D (right); (c) the transfer efficiency under the effect of mutation.
The plot is exp(−A(r−r0)). (A, r0)=(2.5/nm, 0.8 nm) for cE59 (black plot), and (A, r0)=(9.0/nm, 0.6 nm) for cE59D (red plot).
Figure 3—figure supplement 2

The average rotation velocities of WT and mutant c-rings in MD simulations with different parameter sets in the cE59D mutant.
(a) A=2.5/nm, pKa=7.0 for cE59D. The decay rate, A, was set to the same value as in the WT. (b) A=9.0/nm, pKa=7.8 for cE59D. The pKa value of cE59D was set to be 0.2 units smaller than that of cE59. MD, molecular dynamics; WT, wild-type.
Figure 4
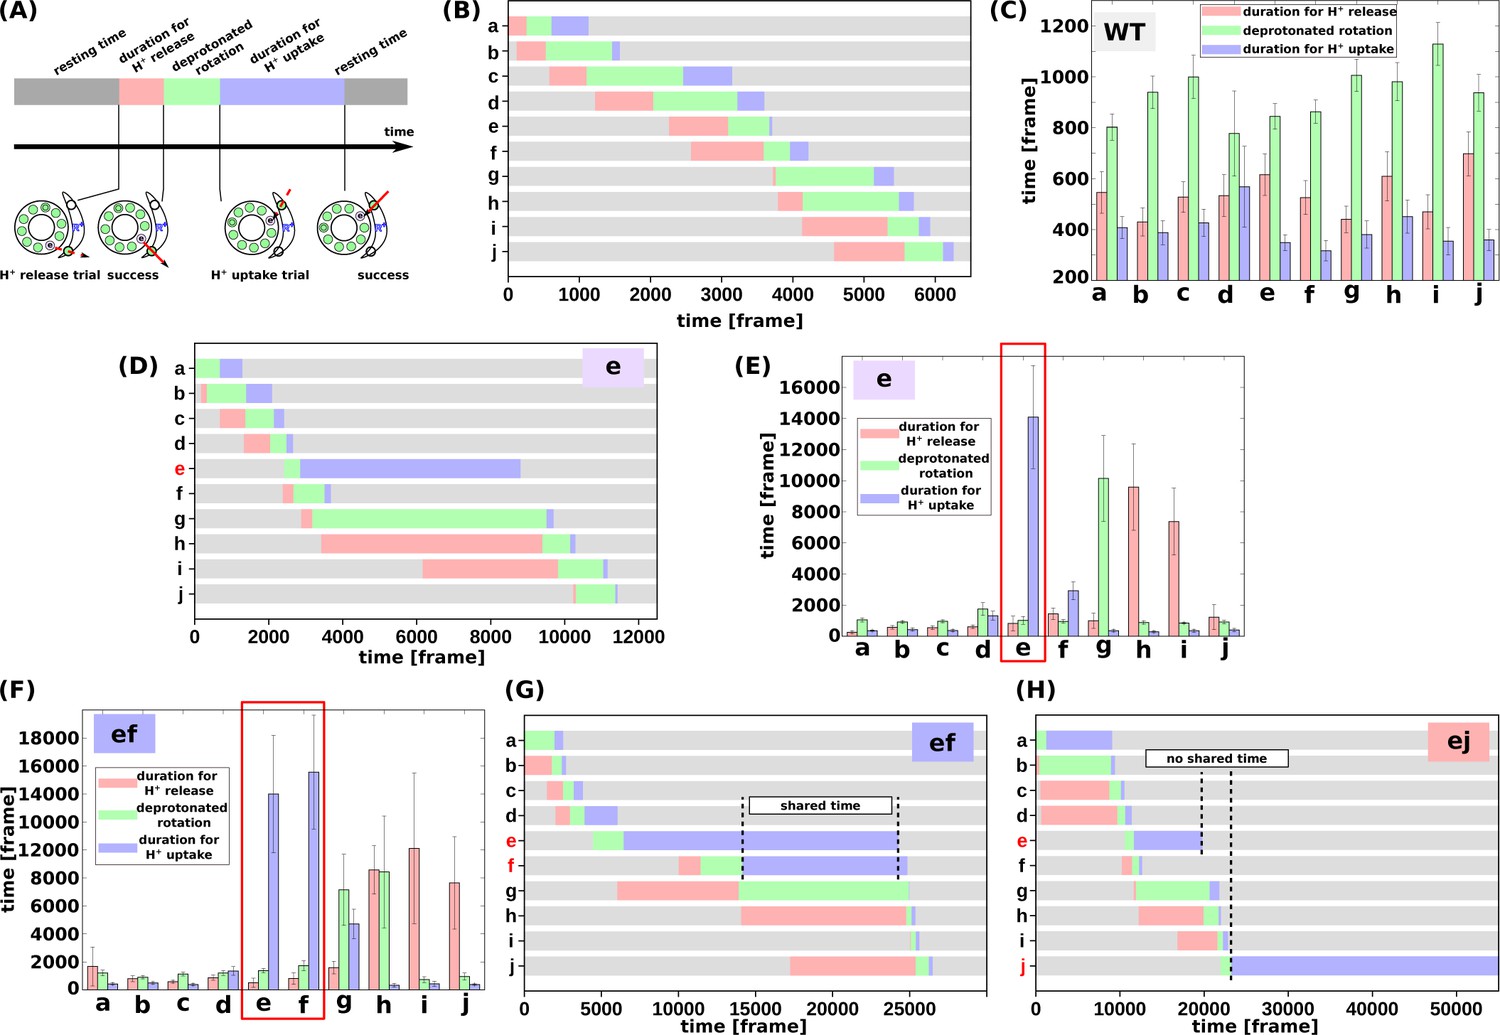
Analysis of the molecular simulations.
(a) Schematic graph of duration times. Total time was divided into the duration for proton release, the duration for deprotonated rotation, the duration for proton uptake, and the resting time. (b) Representative time course of durations for the WT. (c) Histogram of durations for every c-subunit of the WT. (d) Representative time course of durations for the single mutant “e.” (e) Histogram of durations for the single mutant “e.” (f) Representative time course of durations for the double-mutant “ef.” (g) Histogram of durations for the double-mutant “ef.” (h) Representative time course of durations for the double-mutant “ej.” WT, wild-type.
-
Figure 4—source data 1
Analysis of the molecular simulations.
- https://cdn.elifesciences.org/articles/69096/elife-69096-fig4-data1-v1.zip
Tables
Table 1
P-value of ATP synthesis activity between the two mutants.
| e | ef | eg | eh | ei | ej | |
|---|---|---|---|---|---|---|
| c10 | 5.41×10⁻⁷ | 1.08×10⁻⁸ | 6.44×10⁻⁹ | 2.45×10⁻⁹ | 1.88×10⁻⁹ | 1.73×10⁻⁸ |
| e | 5.29×10⁻³ | 9.14×10⁻⁴ | 3.54×10⁻⁵ | 1.61×10⁻⁵ | 6.25×10⁻⁶ | |
| ef | 0.409 | 0.0357 | 0.0435 | 0.0122 | ||
| eg | 0.179 | 0.241 | 0.0752 | |||
| eh | 0.706 | 0.784 | ||||
| ei | 0.420 |
Table 2
Membrane ATPase activity from cells expressing hetero-mutated c-subunits.
| ATPase activity* | ||
|---|---|---|
| Mutant | –DCCD | +DCCD |
| WT | 0.23 | 0.076 |
| c10-fusion | 0.15 | 0.067 |
| Mutant e | 0.087 | 0.076 |
| Mutant ef | 0.090 | 0.065 |
| Mutant eg | 0.078 | 0.070 |
| Mutant eh | 0.086 | 0.073 |
| Mutant ei | 0.088 | 0.080 |
| Mutant ej | 0.083 | 0.068 |
-
*
Membrane ATPase activity was measured after pre-incubation of membranes at 10 mg/ml in PA3 buffer with or without 50 μM DCCD for 20 min at 25°C. Activity is expressed as μmol/min/mg.
Table 3
pKa values predicted by PROPKA.
| c-ring | a | b | c | d | e | f | g | h | i | j |
|---|---|---|---|---|---|---|---|---|---|---|
| cE59 | 7.40 | 6.10 | 5.89 | 5.89 | 5.89 | 5.89 | 5.89 | 6.73 | 8.03 | 7.34 |
| cE59D | 6.49 | 5.37 | 5.16 | 5.16 | 5.16 | 5.16 | 5.16 | 5.85 | 7.08 | 6.54 |
Additional files
Download links
A two-part list of links to download the article, or parts of the article, in various formats.
Downloads (link to download the article as PDF)
Open citations (links to open the citations from this article in various online reference manager services)
Cite this article (links to download the citations from this article in formats compatible with various reference manager tools)
Cooperation among c-subunits of FoF1-ATP synthase in rotation-coupled proton translocation
eLife 11:e69096.
https://doi.org/10.7554/eLife.69096


