Protective mitochondrial fission induced by stress-responsive protein GJA1-20k
- Nora Eccles Harrison Cardiovascular Research and Training Institute, University of Utah, United States
- Howard Hughes Medical Institute, University of Utah, United States
- Department of Biochemistry, University of Utah, United States
- Biomedical Sciences, Noorda College of Osteopathic Medicine, United States
- Department of Neurology, University of California at Los Angeles, United States
- Diabetes and Metabolism Research Center, University of Utah, United States
- Department of Pharmacology and Toxicology, College of Pharmacy, University of Utah, United States
Figures
Figure 1 with 2 supplements
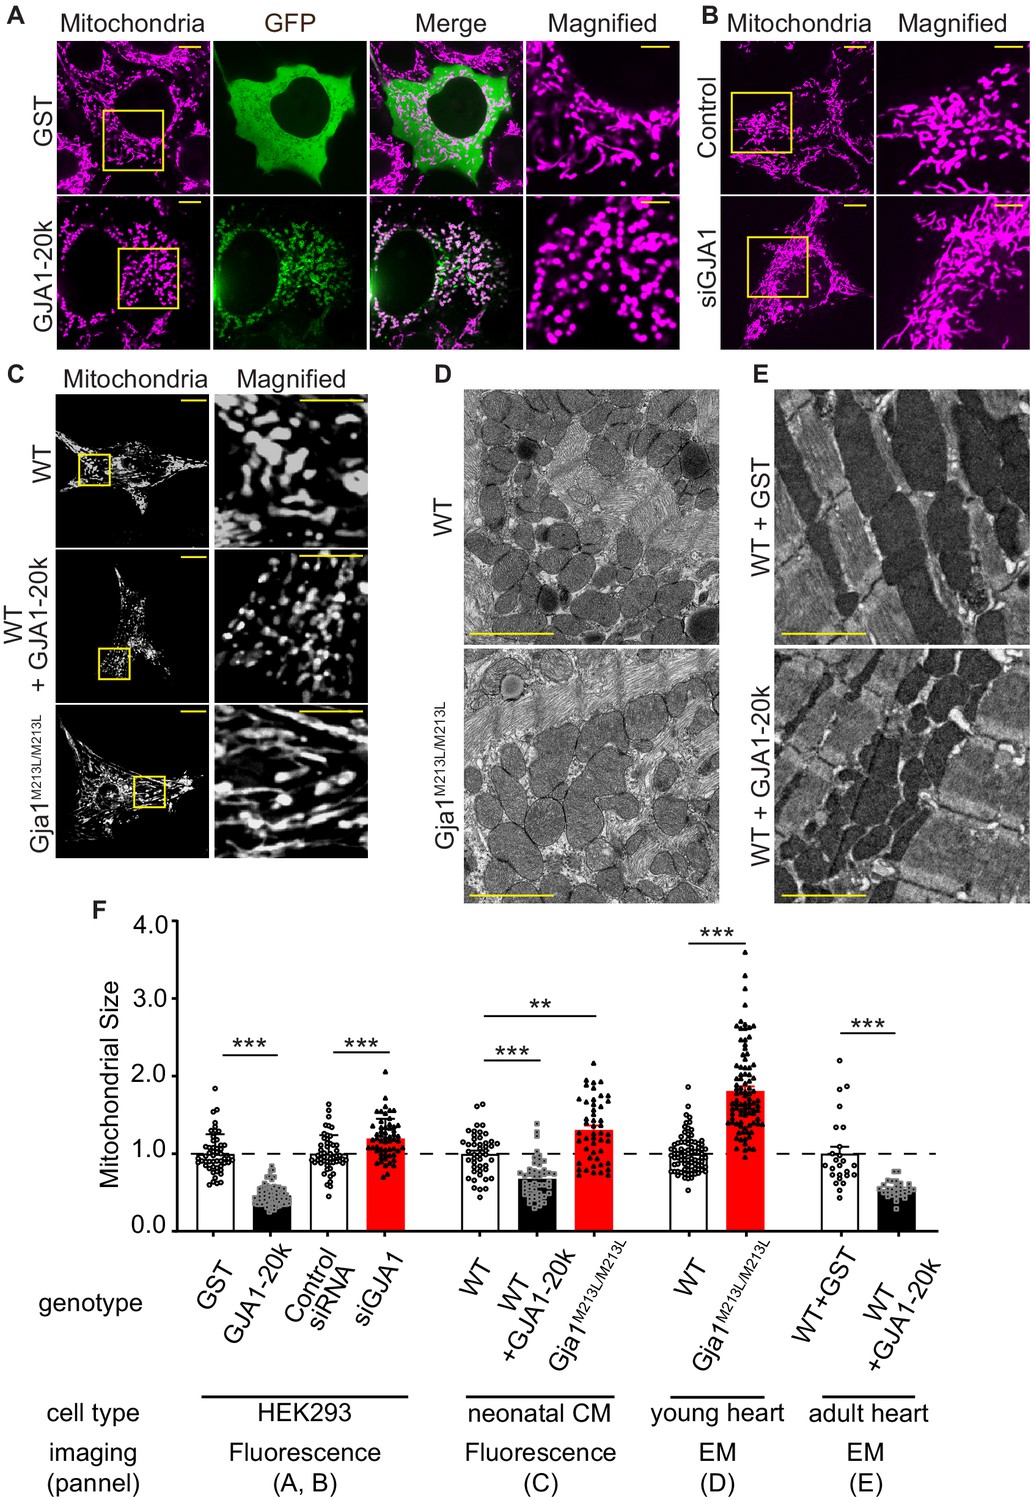
GJA1-20k decreases in mitochondrial size.
(A–C) Representative live cell images of mitochondria in HEK293 (A, GST- or GJA1-20k-transfected; B, Control and siGja1) and mouse neonatal cardiomyocytes (C, WT, GJA1-20k-transducted, and Gja1M213L/M213L). The right-most panels are magnified images. (D) and (E) Representative EM images from young mouse hearts (D, WT or Gja1M213L/M213L) and adult mouse hearts (E, GST- or GJA1-20k-injected). (F) Summary of the fold change in the average area of mitochondria. (n = 51 (GST), 67 (GJA1-20k), 52 (Control), or 57 (siGja1) HEK293) cells from five independent experiments; n = 46 (WT), 47 (GJA1-20k), or 48 (Gja1M213L/M213L) cells from four hearts; n = 84 (WT) or 91 (Gja1M213L/M213L) images from six hearts; n = 25 (GST), or 28 (GJA1-20k) images from three hearts. Graphs were expressed as mean ± SD (HEK293) or± SEM (mouse). p values were determined by two-tailed Mann-Whitney U-test or Kruskal-Wallis test with Dunn’s post-hoc test. **p < 0.01, ***p < 0.001. Scale bars, 10 μm and 5 μm in magnified (A–C); 2 μm (D and E). Exact p values and statistical data are provided in the source data.
-
Figure 1—source data 1
All data points of the mitochondrial size and the statistical data for Figure 1F.
- https://cdn.elifesciences.org/articles/69207/elife-69207-fig1-data1-v1.xlsx
Figure 1—figure supplement 1
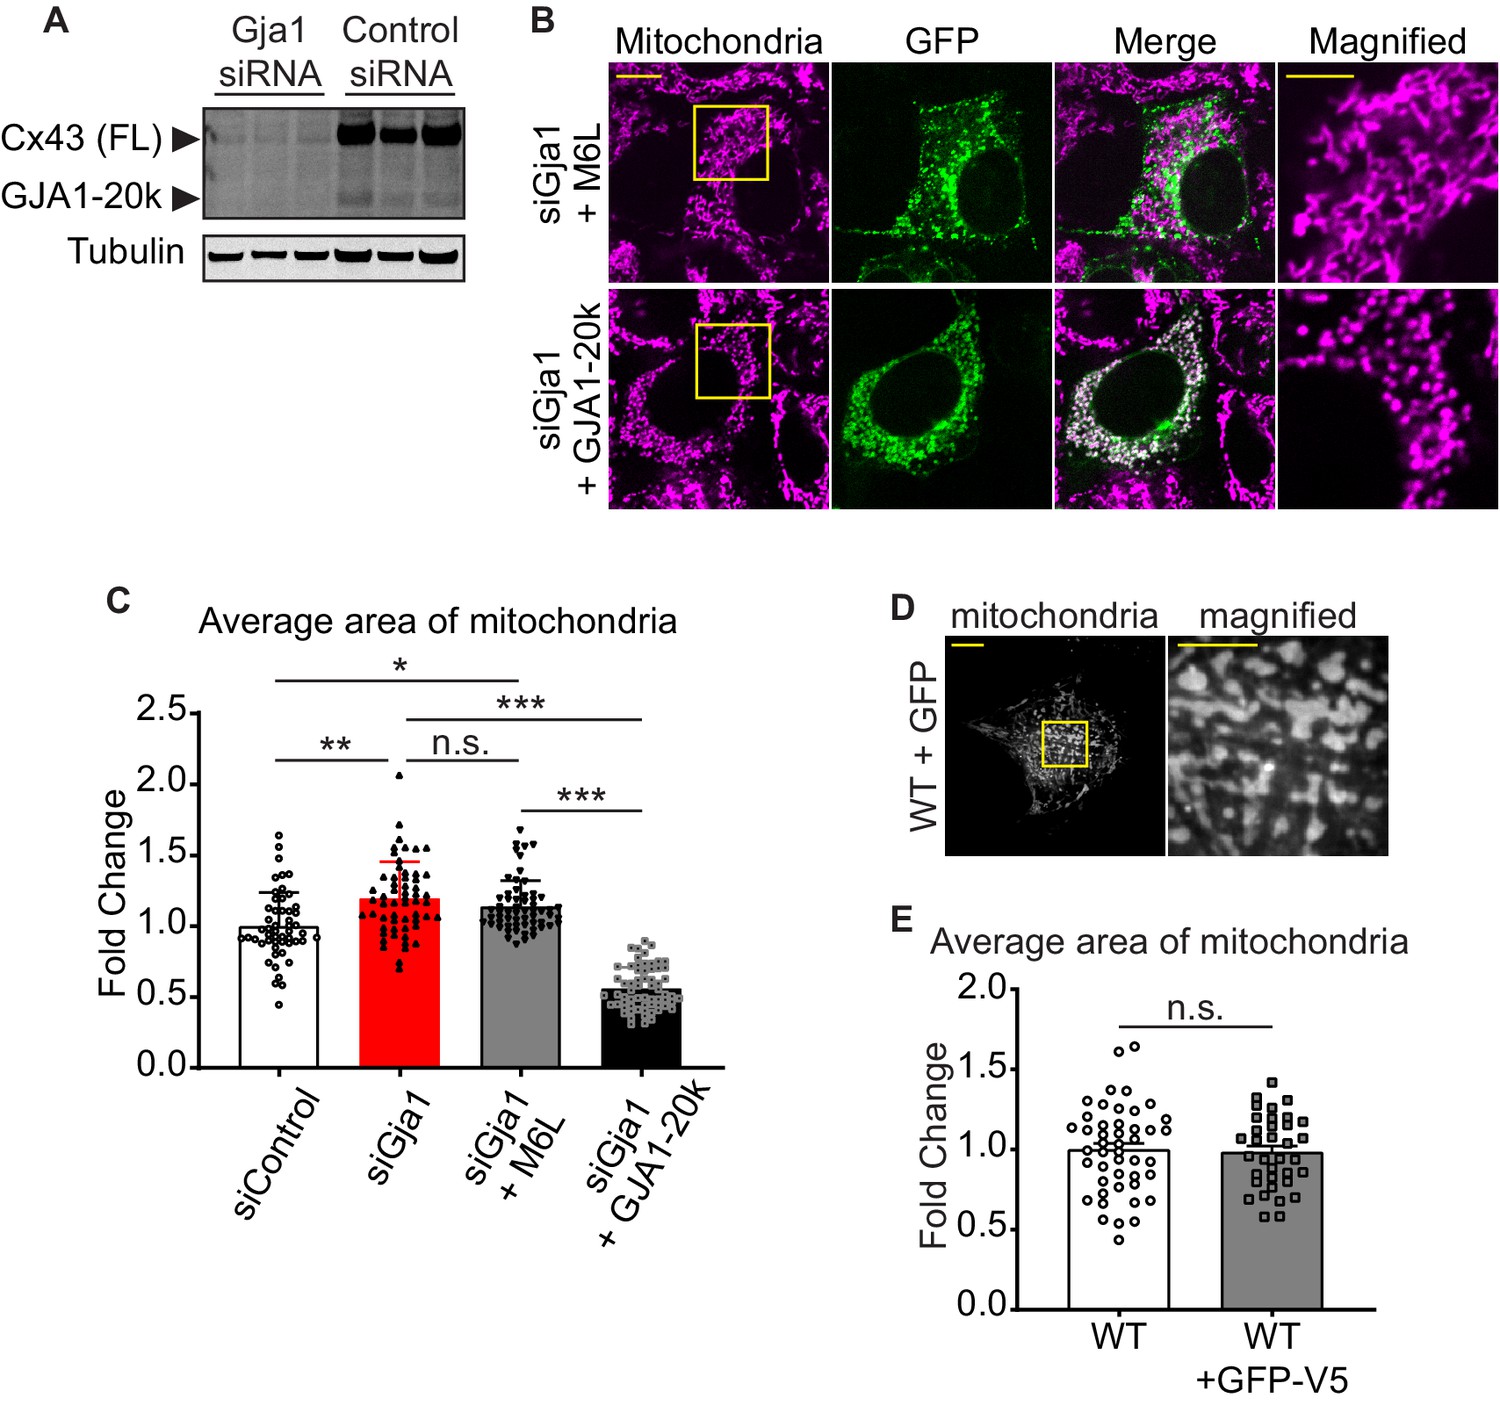
The confirmation of Gja1 knock-down and the mitochondrial morphology rescued by GJA1-20k.
(A) Western blot analysis for Gja1 knock-down by siRNA. Tubulin was used as internal loading control. n = 3 independent experimental repeats. (B) The representative confocal live cell imaging of Gja1 knocked-down HEK293 cells with Cx43-M6L or GJA1-20k transfection. (C) The fold change in the average area of individual mitochondria. n = 52 (Control), 57 (siGja1), 60 (siGja1+ M6 L), or 64 (siGja1+ GJA1-20 k) cells from five independent experiments. The images and the values of Control and siGja1 are also shown in Figure 1. (D) The representative live cell imaging of mitochondria in WT mouse neonatal CMs with adenovirus-mediated GFP induction. The right panel indicates magnified image surrounded by square. (E) The fold change in the average area of individual mitochondria between WT (no virus introduction, the image and the value shown in Figure 1) and GFP-V5 introduction. n = 46 (WT) or 35 (GFP) cells from four hearts. Graphs were expressed as mean ± SD (C) or SEM (E). p values were determined by two-tailed Mann-Whitney U-test or Kruskal-Wallis test with Dunn’s post-hoc test. *p < 0.05, **p < 0.01, ***p < 0.001; n.s., not significant. Scale bars, 10 μm or 5 μm in magnified image. Exact p values and statistical data are provided in the source data.
-
Figure 1—figure supplement 1—source data 1
All data points of the mitochondrial size and the statistical data for Figure 1—figure supplement 1.
- https://cdn.elifesciences.org/articles/69207/elife-69207-fig1-figsupp1-data1-v1.xlsx
Figure 1—figure supplement 2
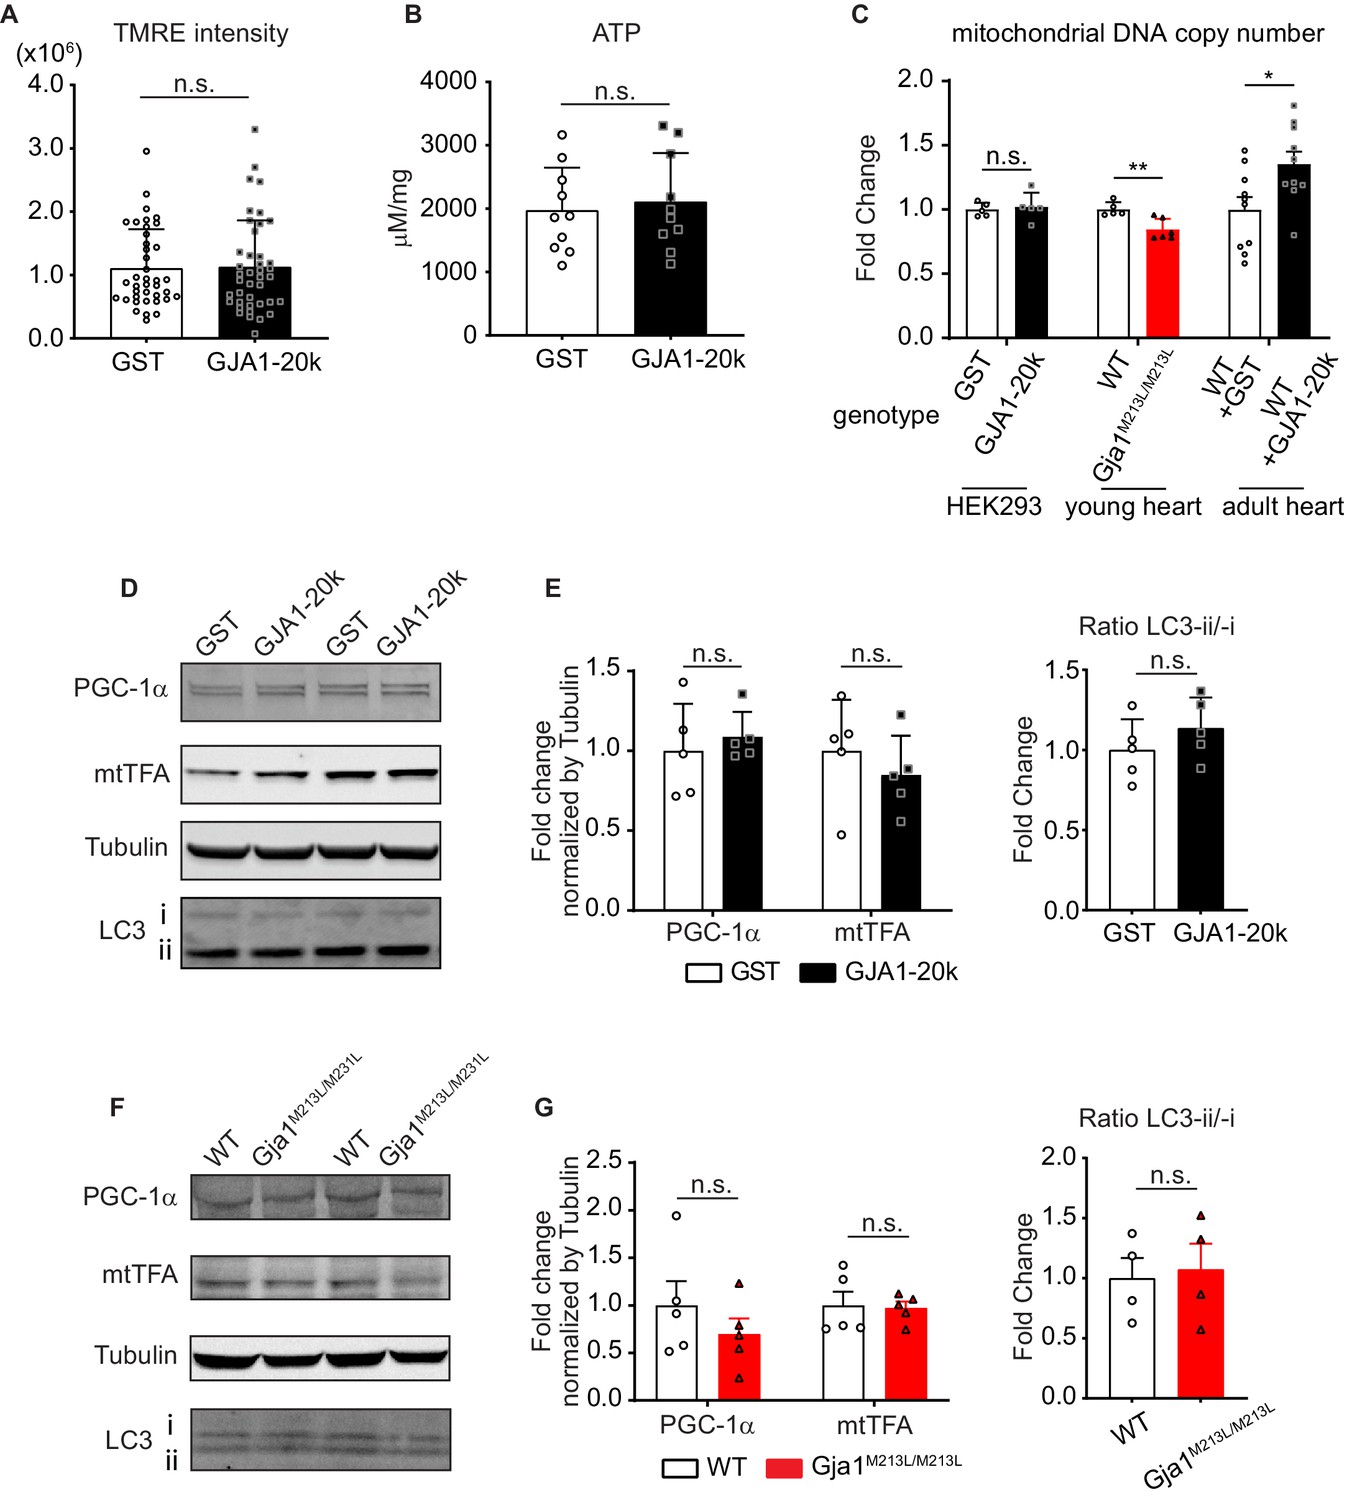
The effects of GJA1-20k on membrane potential, ATP production, mitochondrial biogenesis, and mitophagy.
(A) TMRE intensity (mitochondrial membrane potential) in HEK293 cells with GST or GJA1-20k transfection. n = 39 (GST) or 41 (GJA1-20k) cells from three independent experiments. (B) ATP production from HEK293 cells with GST or GJA1-20k transfection. n = 10 replicates. (C) The fold change in mitochondrial DNA copy number in HEK293 or mouse heart with or without the modification of GJA1-20k expression. n = 5 independent experimental repeats (HEK293); n = 5 (WT), or 6 (Gja1M213L/M213L) hearts; or 10 (AAV9-induced-GST or GJA1-20k) hearts. (D) and (F) Western blot analysis for mitochondrial biogenesis and mitophagy marker proteins in HEK293 cells (D) or mouse hearts (F). Tubulin was used as internal loading control. (E) and (G) The fold change of the level of the proteins and ratio of LC3-ii/-i in HEK293 cells (E) or mouse hearts (G). n = 5 independent experimental repeats (HEK293 cells); 4 (LC3) or five hearts from WT or Gja1M213L/M213L mouse. Graphs were expressed as mean ± SD (HEK293) or SEM (mouse). p values were determined by two-tailed Mann-Whitney U-test. *p < 0.05, **p < 0.01; n.s., not significant. Exact p values and statistical data are provided in the source data.
-
Figure 1—figure supplement 2—source data 1
All data points of the intensity of TMRE, ATP amount, mitochondria DNA copy number, and the protein expression levels and the statistical data for Figure 1—figure supplement 2.
- https://cdn.elifesciences.org/articles/69207/elife-69207-fig1-figsupp2-data1-v1.xlsx
Figure 2 with 1 supplement
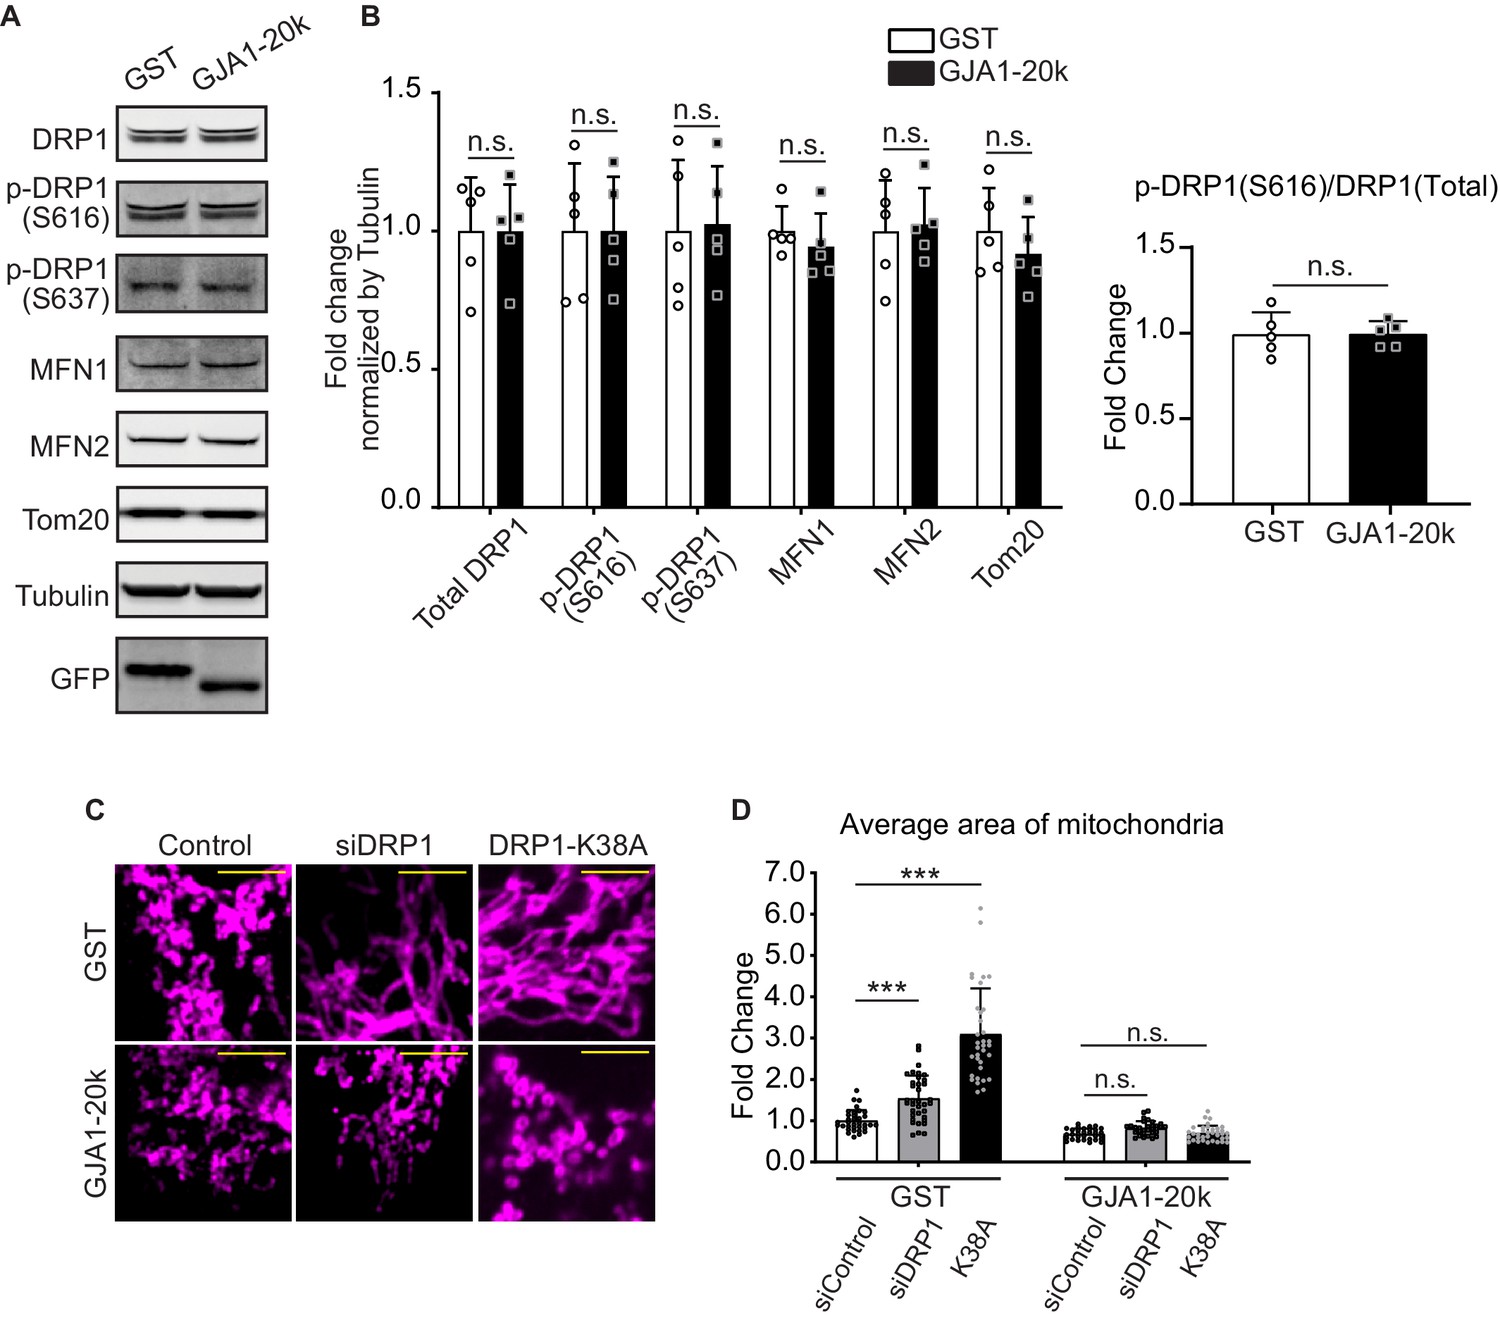
DRP1 is not involved in GJA1-20k-mediated mitochondrial fission.
(A) and (B) Western blot analysis for mitochondrial dynamics related proteins. Transfection was confirmed by GFP bands and the band size difference in GFP is due to the difference in molecular weight between GST and GJA1-20k (A). Tubulin was used as internal loading control. n = 5 independent experimental repeats. (C) Representative fixed cell images of mitochondria (visualized by Tom20) with DRP1 siRNA, K38A treatment, or Control. (D) The fold change in the average area of mitochondria in each treatment. n = 34 (GST, control siRNA), 32 (GJA1-20k, control siRNA), 36 (GST, DRP1 siRNA), 31 (GJA1-20k, DRP1 siRNA), 34 (GST, K38A), or 36 (GJa1-20k, K38A) cells from three independent experiments. Graphs were expressed as mean ± SD. p values were determined by two-tailed Mann-Whitney U-test or two-way ANOVA with Bonferroni’s post-hoc test. ***p < 0.001; n.s., not significant. Scale bars, 5 μm (C). Exact p values and statistical data are provided in the source data.
-
Figure 2—source data 1
All data points of the protein expression and the mitochondrial size and the statistical data for Figure 2.
- https://cdn.elifesciences.org/articles/69207/elife-69207-fig2-data1-v1.xlsx
Figure 2—figure supplement 1
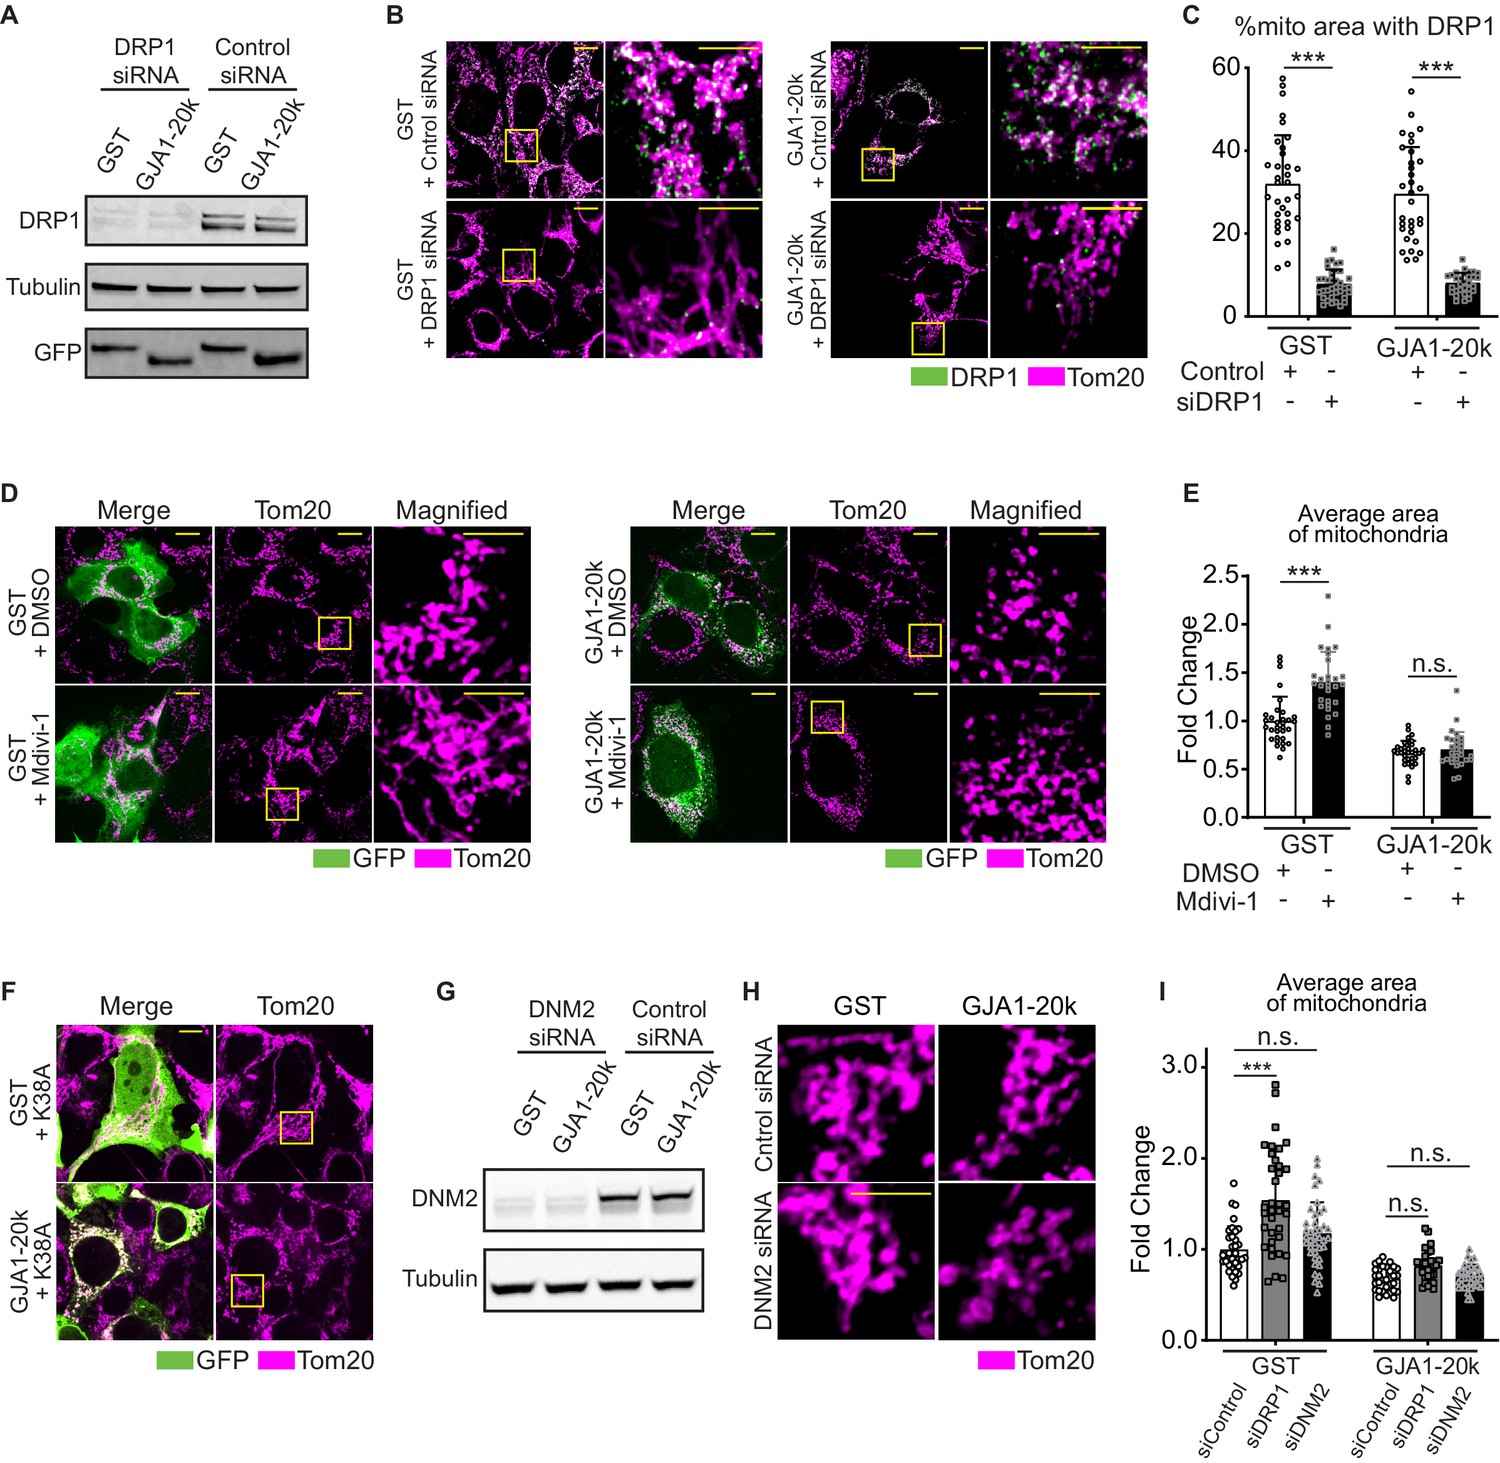
Detailed analysis of DRP1 and DNM2 inhibition and GJA1-20k induced mitochondrial fission.
(A) and (G) Western blot analysis for DRP1 (A) or DNM2 (G) knock-down by siRNA. n = 3 independent experimental repeats. (B), (F), and (H) The representative fixed cell images of mitochondria (and DRP1 in B) with or without siDRP1 (B), DRP1-K38A (F), or siDNM2 (H) treatment. The magnified mitochondria images surrounded by the square in (B) and (F) are used in Figure 2. (C) % area of mitochondria associated with DRP1 with or without siDRP1 treatment. n = 34 (GST, siControl), 32 (GJA1-20k, siControl), 36 (GST, siDRP1), or 31 (GJA1-20k, siDRP1) cells from three independent experiments. (D) The representative fixed cell images of mitochondria with or without Mdivi-1 treatment. The right-most panels are magnified images surrounded by the square. (E) and (I) The fold change in the average area of mitochondria with or without Mdivi-1 (E) or siDNM2 (I) treatment. n = 32 (GST, DMSO), 33 (GJA1-20k, DMSO), or 29 (GST or GJA1-20k, Mdivi-1) cells; 40 (GST, siDNM2) or 33 (GJA1-20k, siDNM2) cells from three independent experiments. The graph of siControl and siDRP1 are used in Figure 2. Mitochondria were visualized by Tom20. Scale bars, 10 μm (B, D, and F) or 5 μm (B and D in magnified image, and H). Graphs were expressed as mean ± SD. p values were determined by two-way ANOVA with Bonferroni’s post-hoc test. ***p < 0.001; n.s., not significant. Exact p values and statistical data are provided in the source data.
-
Figure 2—figure supplement 1—source data 1
All data points of % mitochondria area with DRP1 and mitochondrial size and the statistical data for Figure 2—figure supplement 1.
- https://cdn.elifesciences.org/articles/69207/elife-69207-fig2-figsupp1-data1-v1.xlsx
Figure 3
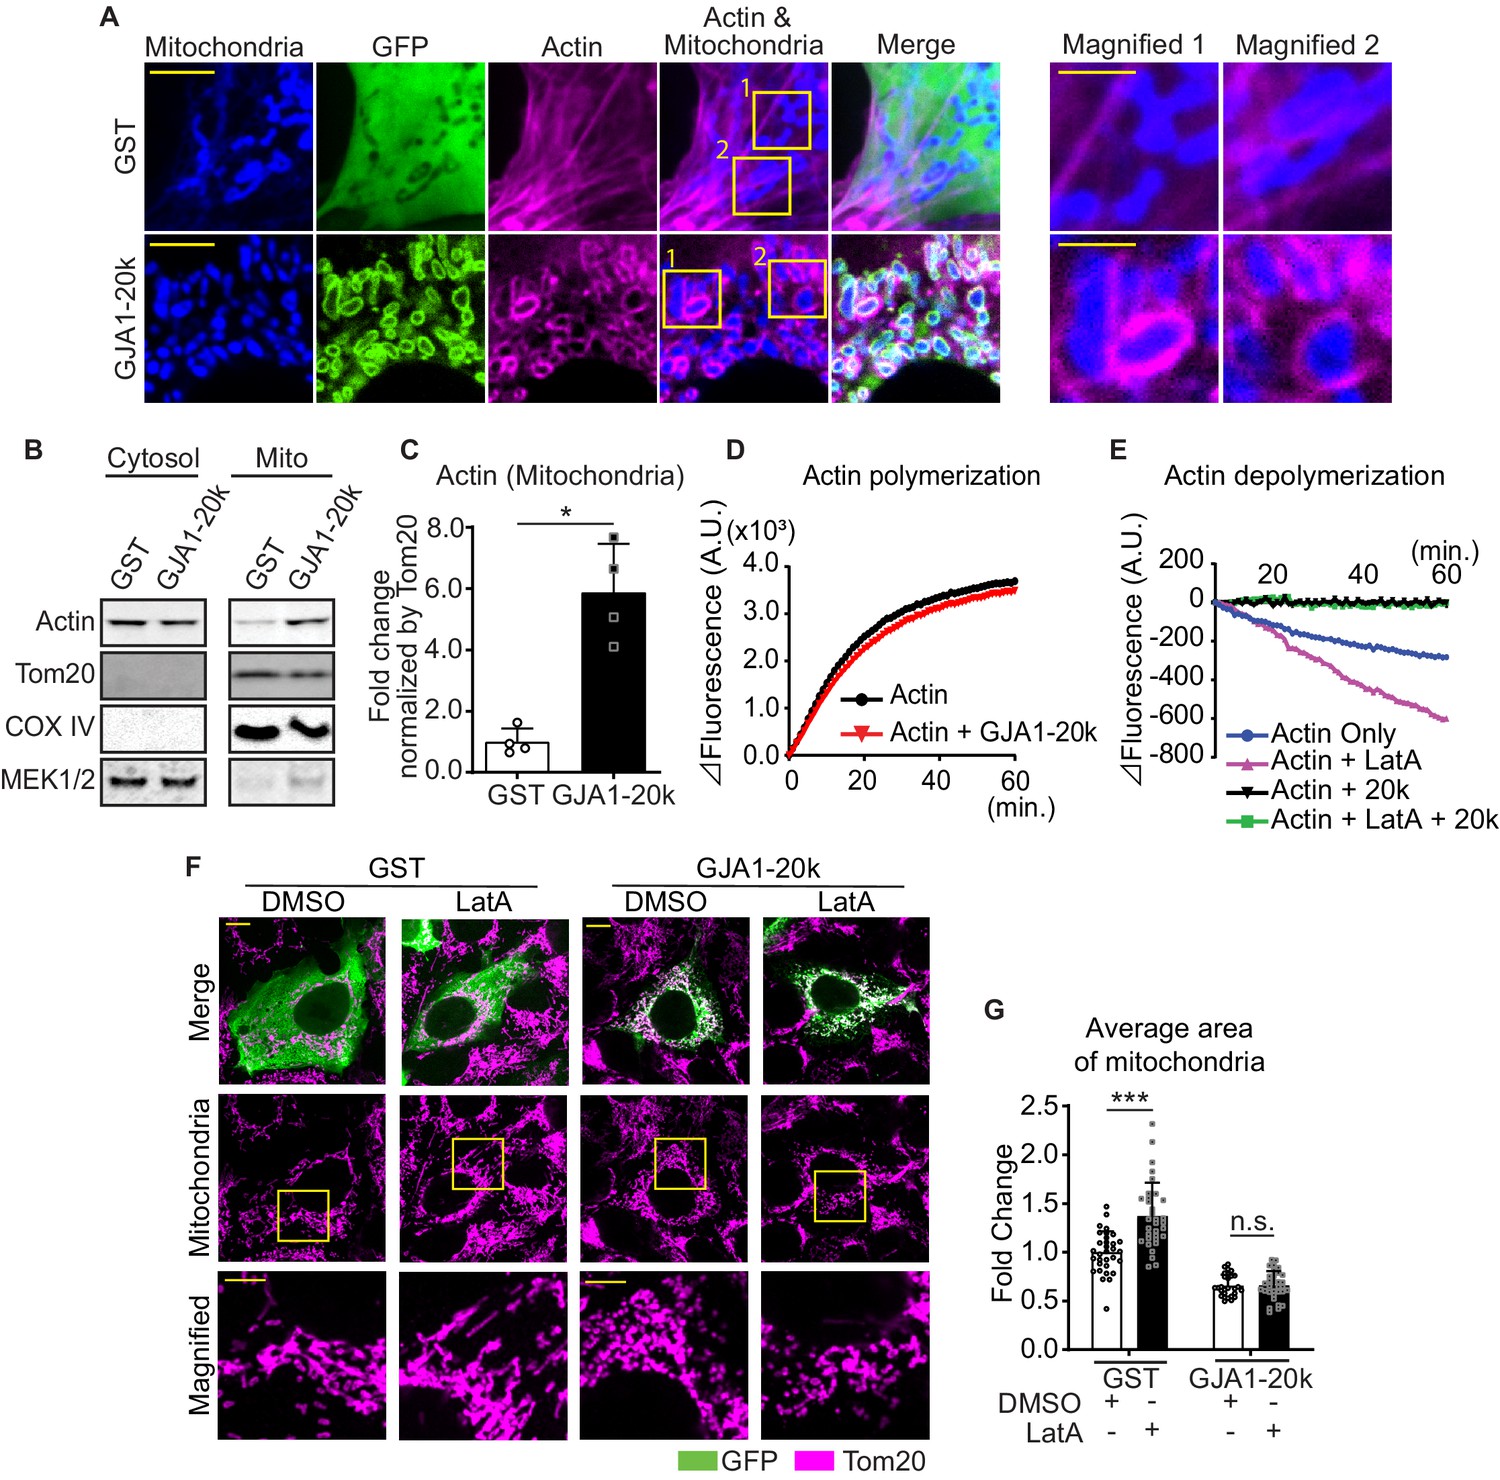
GJA1-20k stabilizes and recruits actin around mitochondria for fission.
(A) Representative live cell images of mitochondria with or without GJA1-20k. Actin was labeled by co-transfection with lifeAct-mCherry. The right-most panels indicate magnified images surrounded by square. (B) and (C) Western blot analysis in cytosol or mitochondrial fraction. MEK1/2 was used as cytosol marker and Tom20 and COX IV as mitochondrial markers (B). Quantification of actin in mitochondrial fraction normalized by Tom20 expression (C). n = 4 independent experimental repeats. (D) and (E) Cell-free actin polymerization (D) and depolymerization (E) assay. (F) Representative fixed cell images of mitochondria (visualized by Tom20) with or without LatA. (G) The fold change in the average area of mitochondria with or without LatA treatment. n = 32 (GST, DMSO), 33 (GST, LatA), 28 (GJA1-20k, DMSO), or 32 (GJA1-20k, LatA) cells from three independent experiments. Graphs were expressed as mean ± SD. p values were determined by two-tailed Mann-Whitney U-test or two-way ANOVA with Bonferroni’s post-hoc test. *p < 0.05, ***p < 0.001; n.s., not significant. Scale bars, 10 μm (F), 5 μm (A and magnified in F) and 2 μm (magnified in A). Exact p values and statistical data are provided in the source data.
-
Figure 3—source data 1
All data points of the actin assay and the mitochondrial size and the statistical data for Figure 3.
- https://cdn.elifesciences.org/articles/69207/elife-69207-fig3-data1-v1.xlsx
Figure 4 with 1 supplement
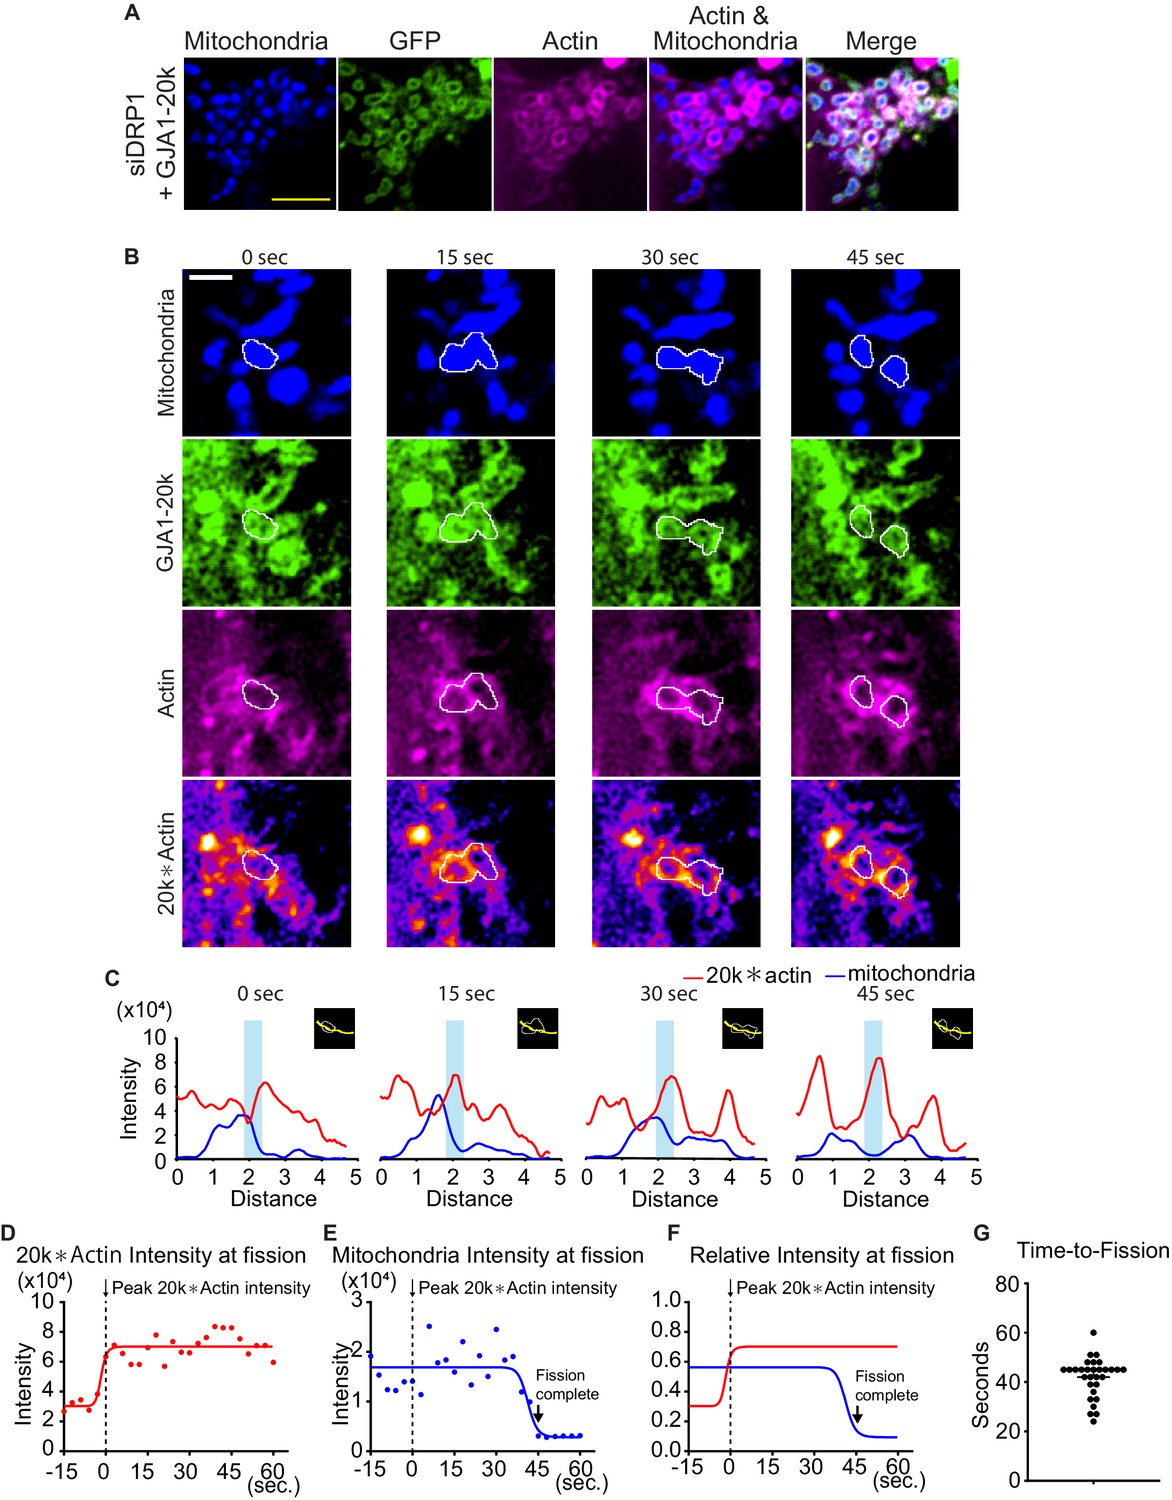
Time course of mitochondria dynamics and actin accumulation at the mitochondrial fission site under siDRP1.
(A) Representative live cell images of mitochondria with GJA1-20k under siDRP1. (B) Representative mitochondrial dynamics in GJA1-20k-transfected cells by time-lapse live cell imaging under siDRP1 treatment. The bottom images (with fire look-up table) indicate the product of GJA1-20k and actin signals. The white lines indicate mitochondrial outlines. Scale bars, 5 μm (A) and 2 μm (B). (C) The intensity of mitochondria and the product of GJA1-20k and actin from (B). The colored areas indicate fission sites along the lines shown in each respective insert. (D–F) The time course of the product of GJA1-20k and actin intensity (D), mitochondrial intensity (E), or combined relative intensity (F) at the fission site from the mitochondrion shown in (B). Curves are four parameters logistic (4PL) fits to the data. Time 0 corresponds to the peak product of actin and GJA1-20k intensity. The arrows indicate the time point at which fission is complete. (G) Measured time from peak product of actin and GJA1-20k intensity to fission in seconds (bars indicate median and 95 % confidence interval). n = 30 events. All data points are provided in the source data.
-
Figure 4—source data 1
All data points of the intensity and time-to-fission for Figure 4.
- https://cdn.elifesciences.org/articles/69207/elife-69207-fig4-data1-v1.xlsx
Figure 4—figure supplement 1
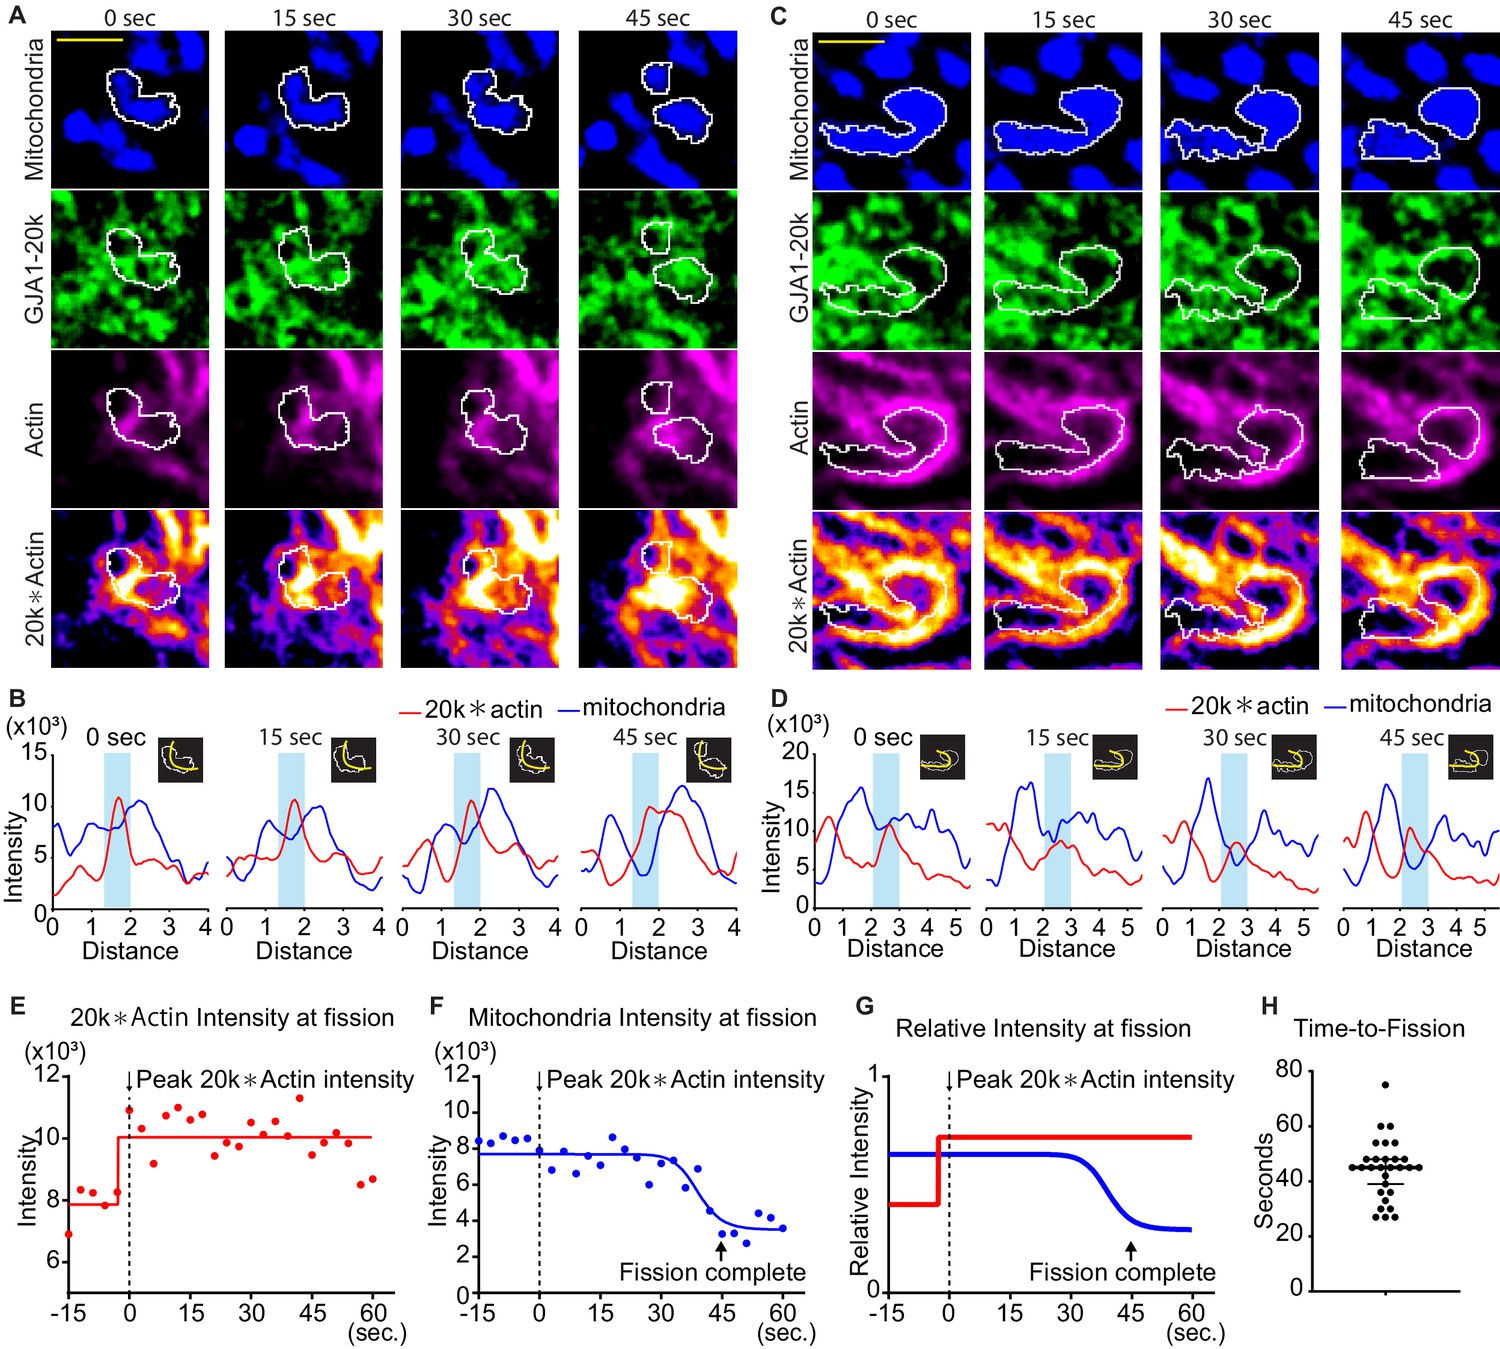
Time course of mitochondria dynamics and actin acumulation at the mitochondrial fission site under Mdivi-1 treatment.
(A) and (C) Representative mitochondrial dynamics in GJA1-20k-transfected cells by time-lapse live cell imaging under Mdivi-1 treatment. The bottom images (with fire look-up table) indicate the product of GJA1-20k and actin signals. The white lines indicate mitochondrial outlines. Scale bars, 2 μm. (B) and (D) The intensity of mitochondria and the product of GJA1-20k and actin from (A) and (C), respectively. The colored areas indicate fission sites along the lines shown in each respective insert. (E–G) The time course of the product of GJA1-20k and actin intensity (E), mitochondrial intensity (F), or combined relative intensity (G) at the fission site from the mitochondrion shown in (A). Curves are four parameters logistic (4PL) fits to the data. Time 0 corresponds to the peak product of actin and GJA1-20k intensity. The arrows indicate the time point at which fission is complete. (H) Measured time from peak product of actin and GJA1-20k intensity to fission in seconds (bars indicate median and 95% confidence interval). n = 29 events. All data points are provided in the source data.
-
Figure 4—figure supplement 1—source data 1
All data points of All data points of the intensity and time-to-fission for Figure 4—figure supplement 1.
- https://cdn.elifesciences.org/articles/69207/elife-69207-fig4-figsupp1-data1-v1.xlsx
Figure 5 with 1 supplement
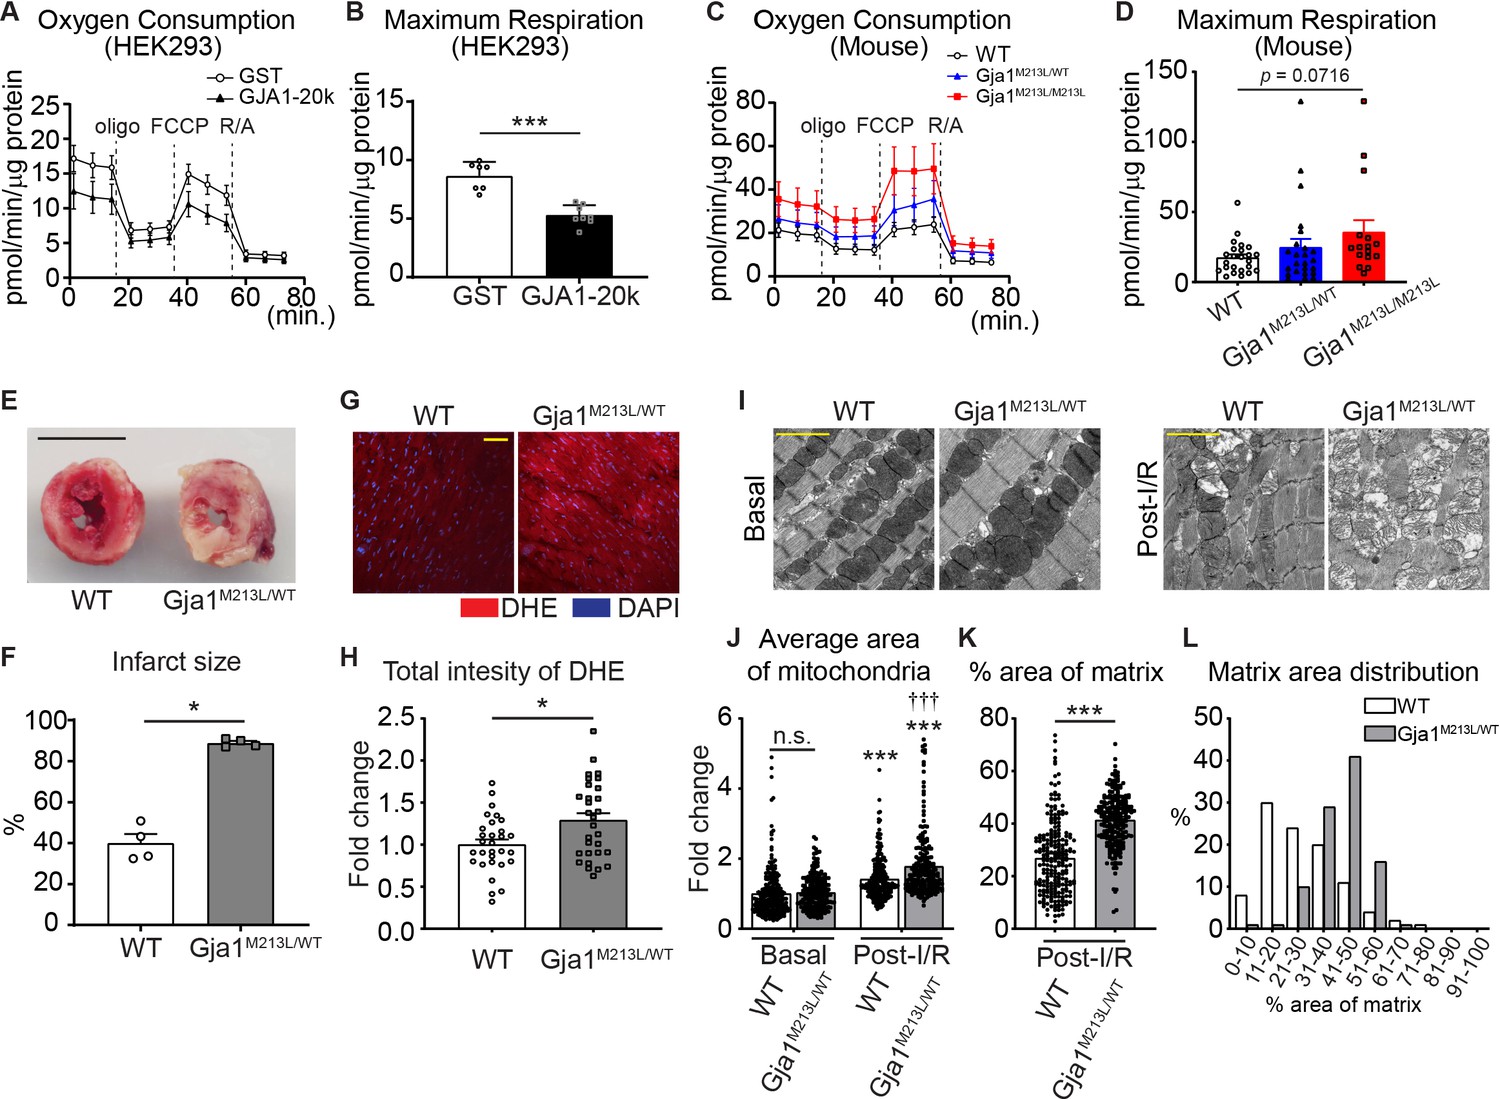
Mitochondrial metabolic function is preserved by GJA1-20k.
(A–D) Real-time change in OCR by Seahorse assay and the maximum respiration in HEK293 cells (A and B) and mouse neonatal CM (C and D). 7 (GST) or 8 (GJA1-20k) replicates from HEK293 cells; n = 24 (WT and Gja1M213L/WT from four hearts) or 16 (Gja1M213L/M213L from three hearts) replicates. (E) Representative images of TTC stained hearts from WT and Gja1M213L/WT mice post-I/R. (F) Quantification of infarct size after I/R. n = 4. (G) Representative images of DHE staining post-I/R from WT or Gja1M213L/WT heart. (H) Relative intensity of DHE. n = 30 images from three hearts in each genotypes. (I) The representative electron microscope images from adult mouse hearts under basal or post-I/R (WT or Gja1M213L/WT). (J) The fold change in the average area of individual mitochondria. n = 240 (WT, Basal), 225 (Gja1M213L/WT, Basal), 229 (WT, post-I/R), or 224 (Gja1M213L/WT, post-I/R) mitochondria from three hearts. (K) % area of mitochondria matrix post-I/R. n = 229 (WT, post-I/R), or 224 (Gja1M213L/WT, post-I/R) mitochondria from three hearts. (L) The distribution of the data set in (K). Graphs were expressed as mean ± SD (HEK293) or SEM (mouse). p values were determined by two-tailed Mann-Whitney U-test, Kruskal-Wallis test with Dunn’s post-hoc test, or two-way ANOVA with Bonferroni’s post-hoc test. *p < 0.05, ***p < 0.001; †††p < 0.001 compared to WT post-I/R; n.s., not significant. Scale bars, 5 mm (E); 50 μm (G); 2 μm (I). Exact p values and statistical data are provided in the source data.
-
Figure 5—source data 1
All data points of the seahorse assay, infarct size, DHE intensity, and mitochondrial analysis and the statistical data for Figure 5.
- https://cdn.elifesciences.org/articles/69207/elife-69207-fig5-data1-v1.xlsx
Figure 5—figure supplement 1
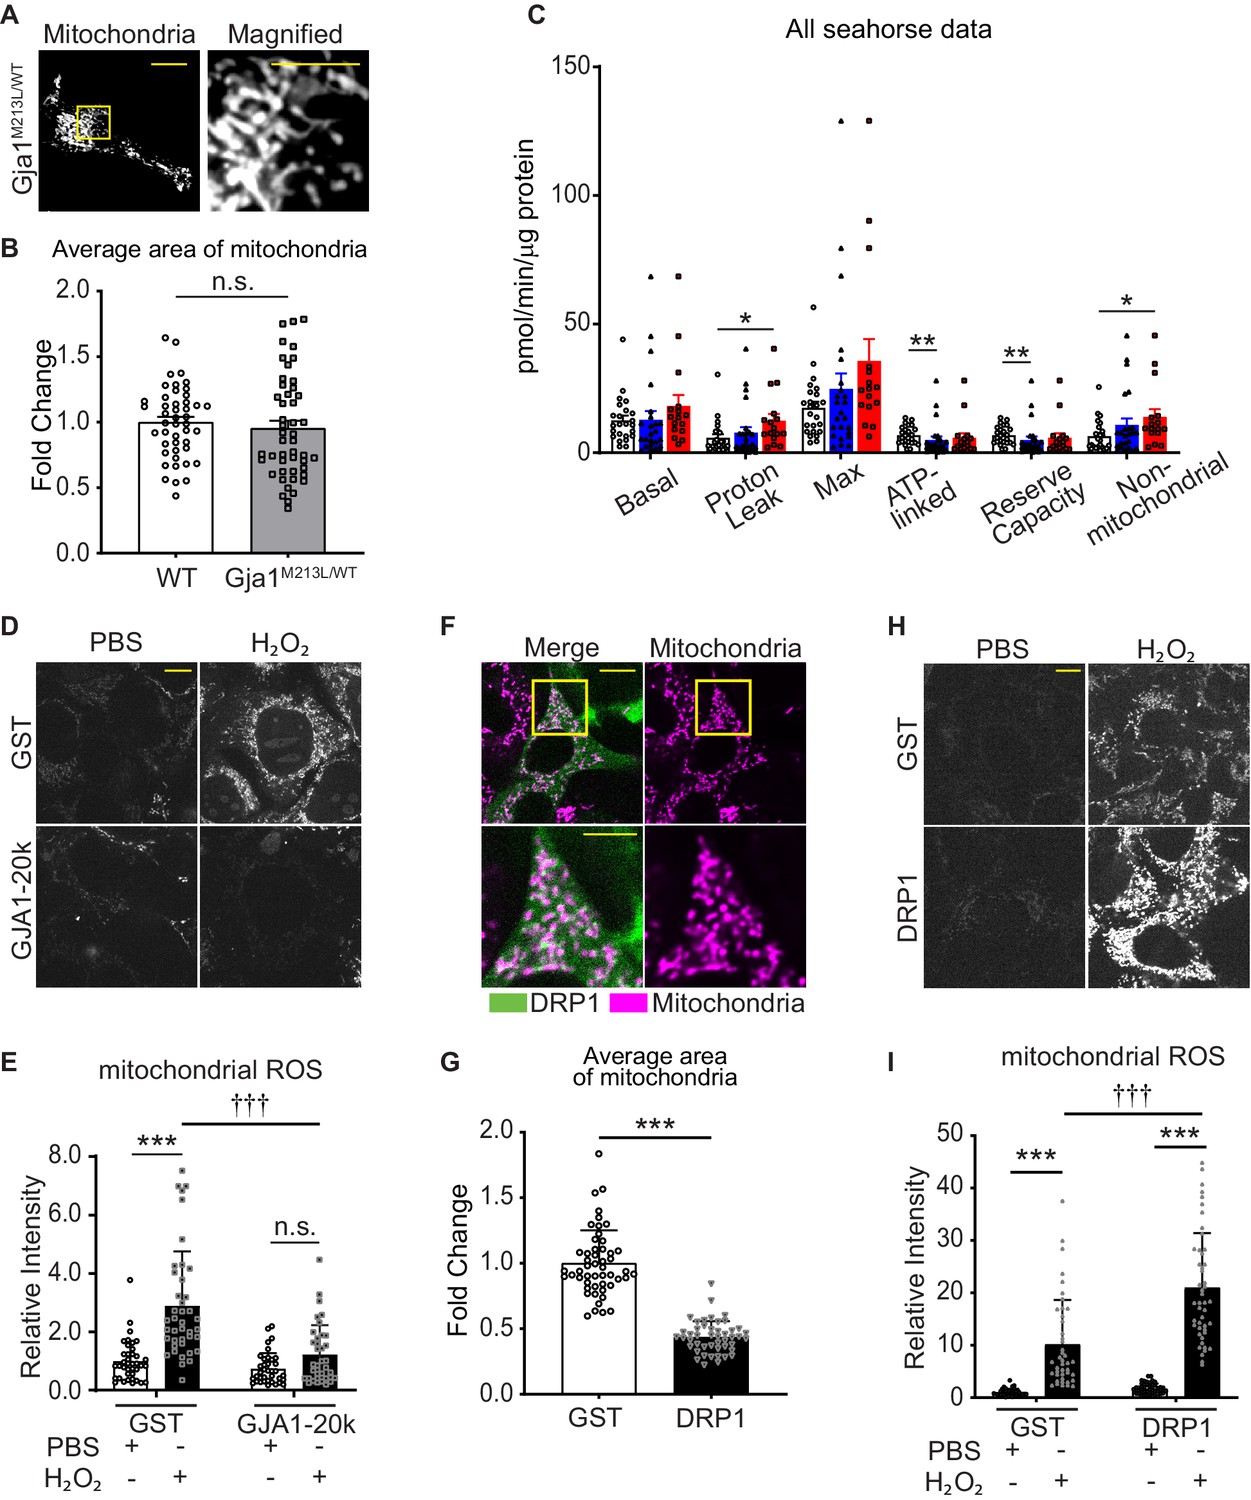
The details of difference between WT and heterozygous Gja1M213L/WT and ROS generation induced by H2O2 stimulation.
(A) Representative live cell images of mitochondria in mouse neonatal CMs from heterozygous Gja1M213L/WT mice. (B) The fold change in the average area of individual mitochondria. n = 46 (WT) or 48 (Gja1M213L/WT) images from four hearts. WT data is used in Figure 1. (C) Quantification of respiration, Proton-leak, Maximum respiration, ATP-production, Reserve capacity, and Non-mitochondrial respiration among genotypes (WT, white; Gja1M213L/WT, blue; Gja1M213L/M231L, red). (D) and (H) Representative live cell images of ROS generation in HEK293 cells with GST or GJA1-20k (D); or GST or DRP1 (H). (E) and (I) Relative intensity of mitoSOX (E) or cellROX (I). n = 39 (GST, PBS), 41 (GST, H2O2), or 37 (GJA1-20k, PBS or H2O2) cells; or 40 (GST, PBS), 43 (GST, H2O2), 48 (DRP1, PBS), or 47 (DRP1, H2O2) cells from three independent experiments. (F) Representative live cell images of mitochondria in HEK293 cells with DRP1 transfection. The bottom panels are magnified images surrounded by square. (G) T the fold change in the average area of mitochondria. n = 47 cells from three independent experiments. GST data is used in Figure 1. Graphs were expressed as mean ± SD (HEK293) or± SEM (mouse). p values were determined by two-tailed Mann-Whitney U-test or Kruskal-Wallis test with Dunn’s post-hoc test, or two-way ANOVA with Bonferroni’s post-hoc test. *p < 0.05, **p < 0.01, ***p < 0.001; †††p < 0.001 compared to GST H2O2. Scale bars, 10 μm and 5 μm in magnified images. Exact p values and statistical data are provided in the source data.
-
Figure 5—figure supplement 1—source data 1
All data points of the mitochondrial size, the detailed seahorse data, and intensity of ROS measurement and the statistical data for Figure 5—figure supplement 1.
- https://cdn.elifesciences.org/articles/69207/elife-69207-fig5-figsupp1-data1-v1.xlsx
Figure 6
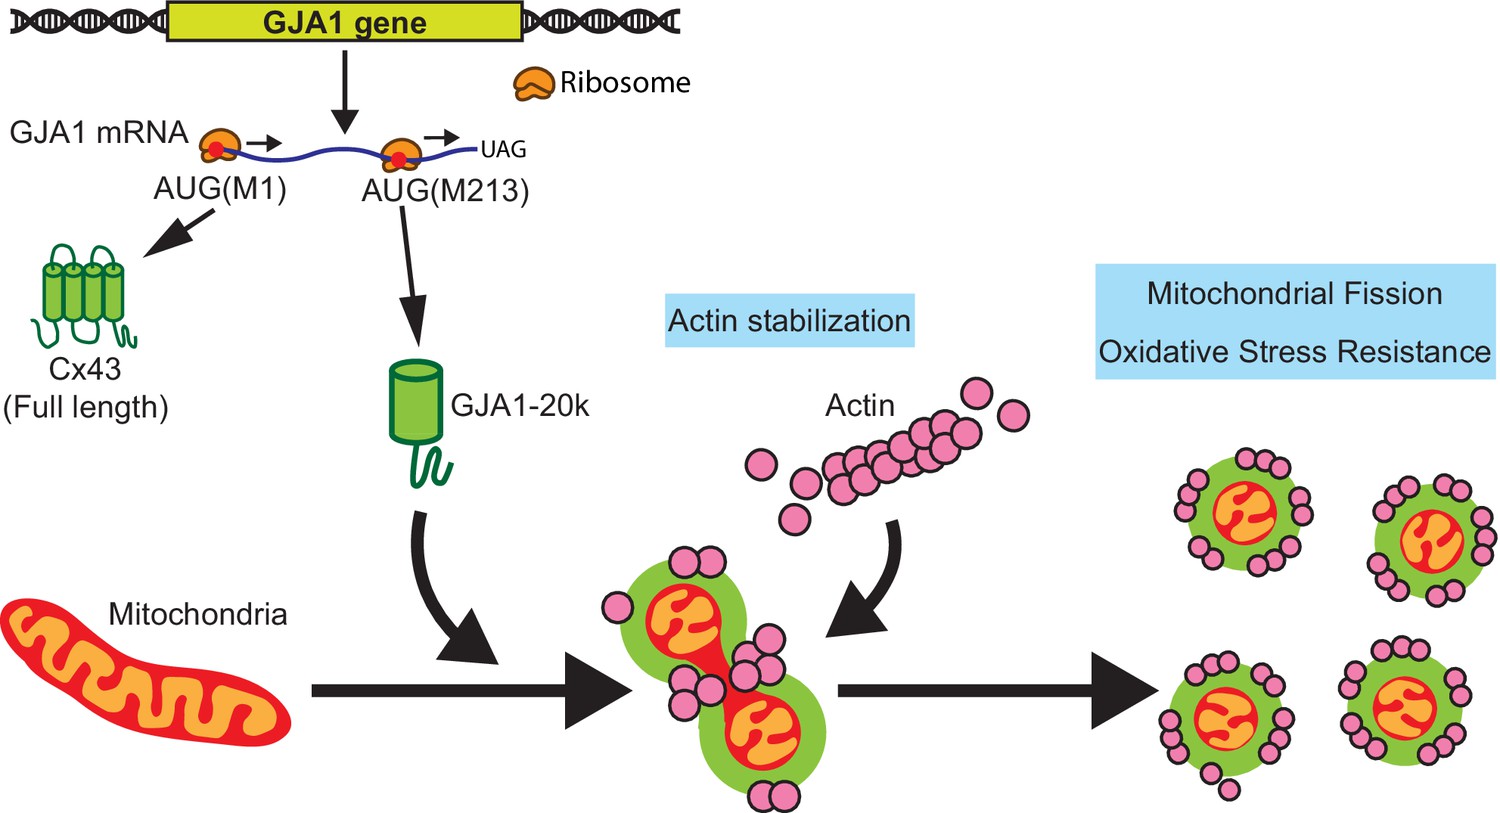
Schematic summary.
GJA1-20k, internally translated from Gja1 mRNA, localizes mitochondria membrane, stabilizes actin cytoskeleton, and recruits actin around mitochondria to both induce mitochondrial fission and achieve oxidative stress resistance.
Author response image 1

The quantification of exogenous GJA1-20k expression in HEK293 cells.
(A) Representative Western blot membrane image from GFP-tagged GJA1-20k transfected cells. (B and C) The quantification of band intensity between endogenous and exogenous GJA1-20k. The graphs were expressed as mean ± SD.
Videos
Video 1
GJA1-20k assembles actin to mitochondrial fission sites and causes fission under siDRP1.
The mitochondrial fission in GJA1-20k-transfected HEK293 cells was monitored under siDRP1 treatment. GJA1-20k (tagged with GFP, green) and mitochondria (indicated by Mitotracker, blue) were simultaneously imaged (left panel), as were mitochondria and actin (indicated by LifeAct-mCherry, red) (middle panel). The spatial coincidence of GJA1-20k and actin were obtained by multiplying GJA1-20k signal with mitochondrial signal, as indicate with a polychromatic fire lookup table (right panel). Note GJA1-20k then actin surround the mitochondria, assembles at the neck of fission site, resulting in fission. The white arrowhead indicates the fission point. Images for each timepoint were obtained every 3 s. There are 17 images for a 51 second clip, played back at five frames per second (about 15 times as fast as real time). Still frames are indicated in Figure 4B.
Video 2
GJA1-20k assembles actin to mitochondrial fission sites and causes fission under Mdivi-1 (clip 1).
The mitochondrial fission in GJA1-20k-transfected HEK293 cells was monitored under Mdivi-1 treatment. GJA1-20k (tagged with GFP, green) and mitochondria (indicated by Mitotracker, blue) were simultaneously imaged (left panel), as were mitochondria and actin (indicated by LifeAct-mCherry, red) (middle panel). The spatial coincidence of GJA1-20k and actin were obtained by multiplying GJA1-20k signal with mitochondrial signal, as indicate with a polychromatic fire lookup table (right panel). Note GJA1-20k then actin surround the mitochondria, assembles at the neck of fission site, resulting in fission. The white arrowhead indicates the fission point. Images for each timepoint were obtained every 3 ss. There are 26 images for a 78 second clip, played back at five frames per second (about 15 times as fast as real time). Still frames are indicated in Figure 4—figure supplement 1A.
Video 3
GJA1-20k assembles actin to mitochondrial fission sites and causes fission under Mdivi-1 (clip 2).
The mitochondrial fission in GJA1-20k-transfected HEK293 cells was monitored under Mdivi-1 treatment. GJA1-20k (tagged with GFP, green) and mitochondria (indicated by Mitotracker, blue) were simultaneously imaged (left panel), as were mitochondria and actin (indicated by LifeAct-mCherry, red) (middle panel). The spatial coincidence of GJA1-20k and actin were obtained by multiplying GJA1-20k signal with mitochondrial signal, as indicate with a polychromatic fire lookup table (right panel). Note GJA1-20k then actin surround the mitochondria, assembles at the neck of fission site, resulting in fission. The white arrowhead indicates the fission point. Images for each timepoint were obtained every 3 s. There are 81 images for a 243 second clip, played back at five frames per second (about 15 times as fast as real time). Still frames are indicated in Figure 4—figure supplement 1C.
Tables
Appendix 1—key resources table
| Reagent type (species) or resource | Designation | Source or reference | Identifiers | Additional information |
|---|---|---|---|---|
| Strain, strain background (Mus musculus) | C57BL/6 J | The Jackson Laboratory | #000664 | |
| Strain, strain background (Mus musculus) | Gja1M213L/M213L | Xiao et al., 2020 (DOI: 10.1172/JCI134682) | ||
| Strain, strain background (AAV9) | AAV9-GST-GFP | Welgen Inc Basheer et al., 2018 (DOI: 10.1172/jci.insight.121900) | ||
| Strain, strain background (AAV9) | AAV9-GJA1-20k-GFP | Welgen Inc Basheer et al., 2018 (DOI: 10.1172/jci.insight.121900) | ||
| Strain, strain background (Aenovirus) | GJA1-20k-V5 | the CURE Vector Core Facility at University California, Los Angeles Basheer et al., 2017 (DOI: 10.1161/CIRCRESAHA.117.311955) | ||
| Strain, strain background (Aenovirus) | GFP-V5 | the CURE Vector Core Facility at University California, Los Angeles Basheer et al., 2017 (DOI: 10.1161/CIRCRESAHA.117.311955) | ||
| Strain, strain background (E. coli) | LOBSTR E. coli Expression Strain | kerafast Andersen et al., 2013; Figure 4—figure supplement 1—source data 1 (DOI: 10.1002/prot.24364) | EC1001 | |
| Cell line (Homo-sapiens) | HEK293FT | Thermo Fisher Scientific | R70007 | |
| Transfected construct (human) | siRNA to Gja1 | Thermo Fisher Scientific | ID HSS178257 | |
| Transfected construct (human) | siRNA to DRP1 | Thermo Fisher Scientific | ID 19561 | |
| Transfected construct (human) | siRNA to Dynamin 2 | Thermo Fisher Scientific | ID s4212 | |
| Antibody | anti-Cx43-CT (Rabbit polyclonal) | Sigma-Aldrich | C6219 | WB (1:2000) |
| Antibody | anti-DRP1 (Mouse monoclonal) | Abcam | Ab56788 | WB (1:500) ICC (1:250) |
| Antibody | anti-phospho-DRP1 at S616 (Rabbit monoclonal) | Cell Signaling Technology | 4,494 S | WB (1:1000) |
| Antibody | anti-phospho-DRP1 at S616 (Rabbit polyclonal) | Cell Signaling Technology | 4,867 S | WB (1:1000) |
| Antibody | anti-MFN1 (Rabbit monoclonal) | Cell Signaling Technology | 14,739 S | WB (1:1000) |
| Antibody | anti-MFN2 (Mouse monoclonal) | Abcam | ab56889 | WB (1:1000) |
| Antibody | anti-MFN2 (Mouse monoclonal) | Abcam | ab56889 | WB (1:1000) |
| Antibody | anti-TOM20 (Mouse monoclonal) | Santa Cruz | sc-17764 | WB (1:500) |
| Antibody | anti-TOM20 (Rabbit polyclonal) | Abcam | ab78547 | ICC (1:1000) |
| Antibody | anti-Tubulin (Rat monoclonal) | Abcam | ab6160 | WB (1:2000) |
| Antibody | anti-GFP (Chicken polyclonal) | Abcam | ab13970 | WB (1:10000) ICC (1:2000) |
| Antibody | anti-actin (Rabbit polyclonal) | Sigma-Aldrich | A2103 | WB (1:2000) |
| Antibody | anti-COX IV (Mouse monoclonal) | Abcam | ab14744 | WB (1:1000) |
| Antibody | anti-MEK1/2 (Mouse monoclonal) | Cell Signaling Technology | 4,694 S | WB (1:1000) |
| Recombinant DNA reagent | pDEST-GJA1-20k-GFP (plasmid) | Fu et al., 2017 (DOI: 10.3389/fphys.2017.00905) | GFP version of Addgene_#49,861 | |
| Recombinant DNA reagent | pDEST-GST-GFP (plasmid) | Fu et al., 2017 (DOI: 10.3389/fphys.2017.00905) | ||
| Recombinant DNA reagent | pDEST-LifeAct-mCherry (plasmid) | Addgene | 40,908 | |
| Recombinant DNA reagent | pDEST-LifeAct-mCherry (plasmid) | Addgene | 40,908 | |
| Recombinant DNA reagent | mCherry-Drp1 (plasmid) | Addgene | 49,152 | |
| Recombinant DNA reagent | pcDNA3-Drp1K38A (plasmid) | Addgene | 45,161 | |
| Sequenced-based reagent | siRNA: Negative Control | Thermo Fisher Scientific | 12935300 | Stealth RNAi |
| Sequenced-based reagent | Gja1_Fw | This paper | PCR primer | GGGGACAAGTTTGTACAAAAAAGCAGGCTT CAGGAGGTATACATATGCATCATCATCATCAT CACGGTGGTGGCGGTTCAGGCGGAGGTGG CTCTGTTAAGGATCGGGTTAAGGGAAAG |
| Sequenced-based reagent | Gja1_Rv | This paper | PCR primer | GGGGACCACTTTGTACAAGAAAGCTGGGTC TTACTAATCGTCATCATCGTCATCATCGTCATC ATCACTTCCACCACTTCCACCGATCT CCAGGTCATCAGGCCG |
| Peptide, recombinant protein | GJA1-20k | This paper | amino acids 236–382 of the full-length human Cx43, NCBI reference NP 000156,1 | |
| Commercial assay or kit | DC Protein Assay | Bio-Rad | 5000116 | |
| Commercial assay or kit | Actin Polymerization Biochem Kit | Cytoskeleton, Inc | BK003 | |
| Commercial assay or kit | Mouse Mitochondrial DNA Copy Number Assay kit | Detroit R&D | NC1134958 | |
| Commercial assay or kit | Human Mitochondrial DNA Monitoring Primer Set | TaKaRa Bio | 7,246 | |
| Commercial assay or kit | Primary Cardiomyocyte Isolation Kit | Life Technologies | 88,281 | |
| Commercial assay or kit | Mitochondria Isolation Kit | Thermo Fisher Scientific | 89,874 | |
| Commercial assay or kit | ATPlite Luminescence Assay System | PerkinElmer | 6016943 | |
| Commercial assay or kit | HisPur Cobalt Purification Kit | Thermo Fisher Scientific | PI-90092 | |
| Chemical compound, drug | FuGene HD | Promega | E2312 | |
| Chemical compound, drug | Lipofectamine RNAiMAX | Thermo Fisher Scientific | 13778150 | |
| Chemical compound, drug | mitochondrial division inhibitor 1 | Sigma-Aldrich | M0199 | 50 µM |
| Chemical compound, drug | Latrunculin A | Sigma-Aldrich | L5163 | 100 nM |
| Chemical compound, drug | Mitotracker Deep Red | Thermo Fisher Scientific | m22426 | 200 nM |
| Chemical compound, drug | Mitotracker Red CMXRos | Thermo Fisher Scientific | M7512 | 200 nM |
| Chemical compound, drug | TMRE | Cayman Chemical Company | 701,310 | 200 nM |
| Chemical compound, drug | MitoSOX Red Mitochondrial Superoxide Indicator | Thermo Fisher Scientific | M36008 | 5 µM |
| Chemical compound, drug | CellROX Deep Red | Thermo Fisher Scientific | C10422 | 5 µM |
| Chemical compound, drug | ProLong Gold antifade regent with DAPI | Thermo Fisher Scientific | P36935 | |
| Software, algorithm | GraphPad Prism 6.0 | GraphPad Software Inc | Windows | |
| Software, algorithm | ImageJ | NIH | Windows | |
| Software, algorithm | Mitochondria morphology plugin | Dagda, Cherra et al. 2009 (DOI: 10.1074/jbc.M808515200) | ||
| Software, algorithm | Chemidoc MP imaging system | Bio-Rad | ||
| Software, algorithm | Image Lab software | Bio-Rad | ||
| Software, algorithm | Adobe Photoshop | Adobe | Version 22.4.2 | |
| Software, algorithm | Adobe Illustrator | Adobe | Version 25.3.1 | |
| Other | triphenyl tetrazolium chloride (Stain) | Sigma-Aldrich | T8877 | |
| Other | dihydroethidium (Stain) | Thermo Fisher Scientific | D23107 |
Additional files
-
Transparent reporting form
- https://cdn.elifesciences.org/articles/69207/elife-69207-transrepform1-v1.pdf
-
Source data 1
Uncropped membranes for all western blots in the manuscript.
- https://cdn.elifesciences.org/articles/69207/elife-69207-supp1-v1.zip
Download links
A two-part list of links to download the article, or parts of the article, in various formats.
Downloads (link to download the article as PDF)
Open citations (links to open the citations from this article in various online reference manager services)
Cite this article (links to download the citations from this article in formats compatible with various reference manager tools)
Protective mitochondrial fission induced by stress-responsive protein GJA1-20k
eLife 10:e69207.
https://doi.org/10.7554/eLife.69207


