Neutrophil extracellular traps arm DC vaccination against NPM-mutant myeloproliferation
- Tumor Immunology Unit, Department of Health Sciences, University of Palermo, Italy
- Department of Research, Fondazione IRCCS Istituto Nazionale Tumori, Italy
- Department of Mathematics and Informatics, University of Palermo, Italy
- Pathology Unit, IRCCS San Raffaele Scientific Institute, Italy
- Cell Factory, Istituto di Ricovero e Cura a Carattere Scientifico Policlinico San Matteo, Italy
- Bioinformatics and Biostatistics Unit, Department of Applied Research and Technological Development, Fondazione IRCCS Istituto Nazionale dei Tumori, Italy
- Department of Experimental, Diagnostic and Specialty Medicine – DIMES, Institute of Hematology "Seràgnoli", Italy
Figures
Figure 1
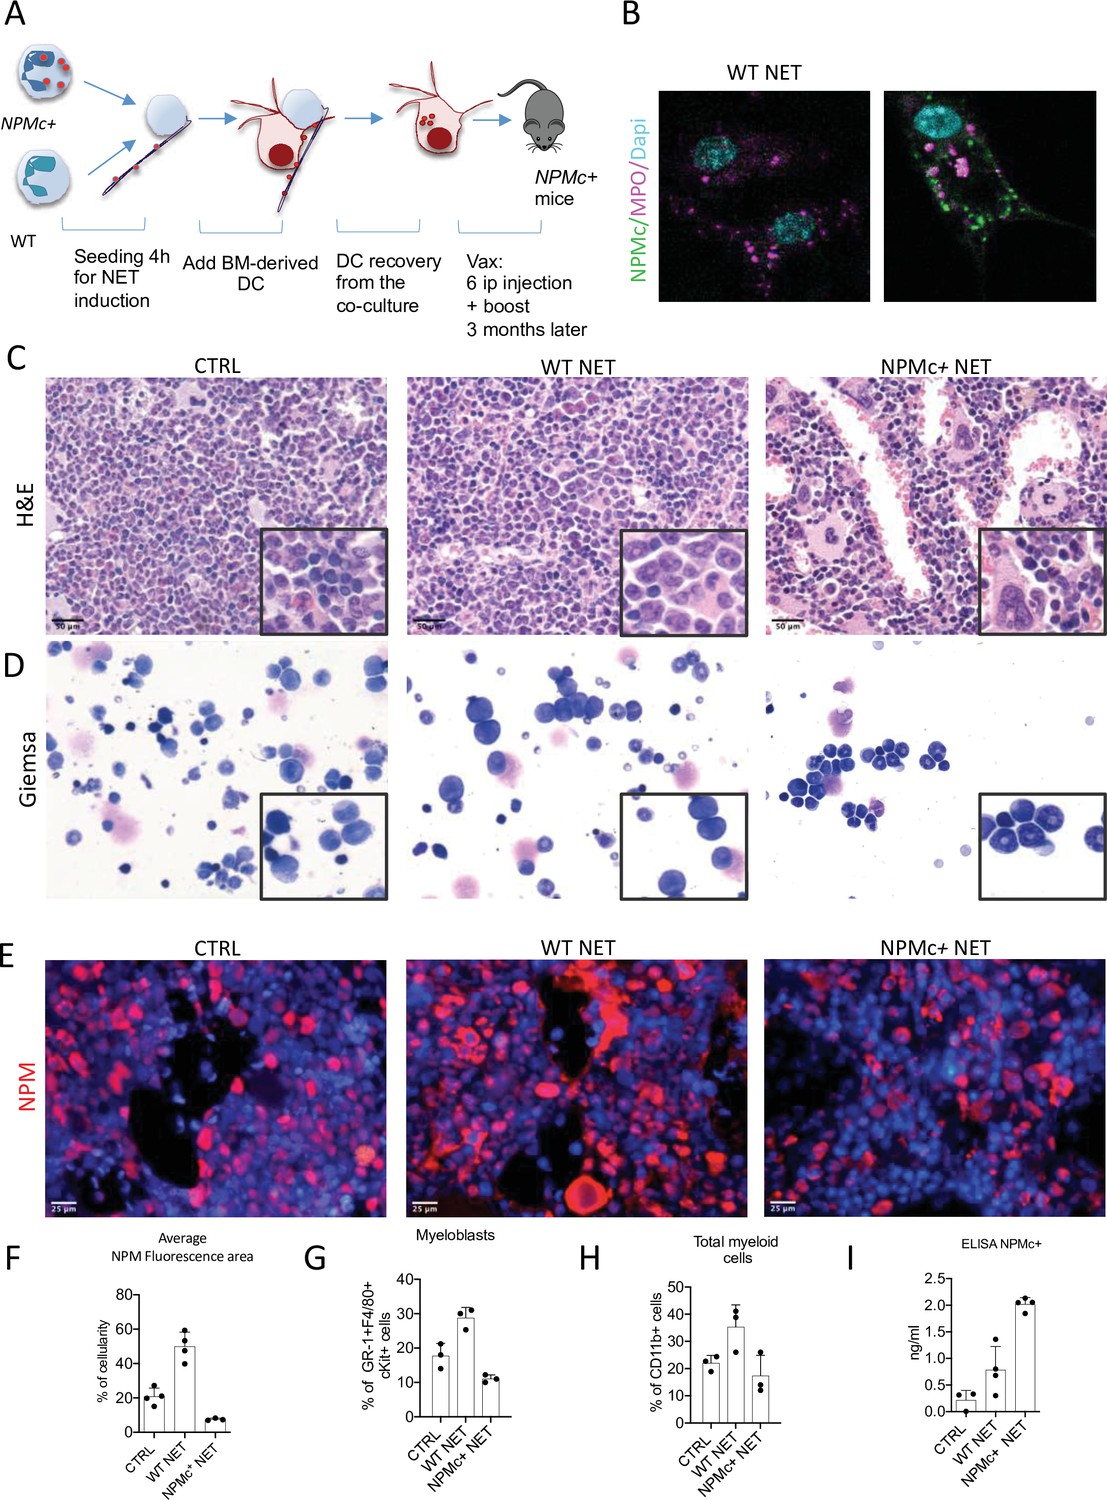
Vaccination with NPM+ NET/DC controls NPMc+-driven myeloproliferation.
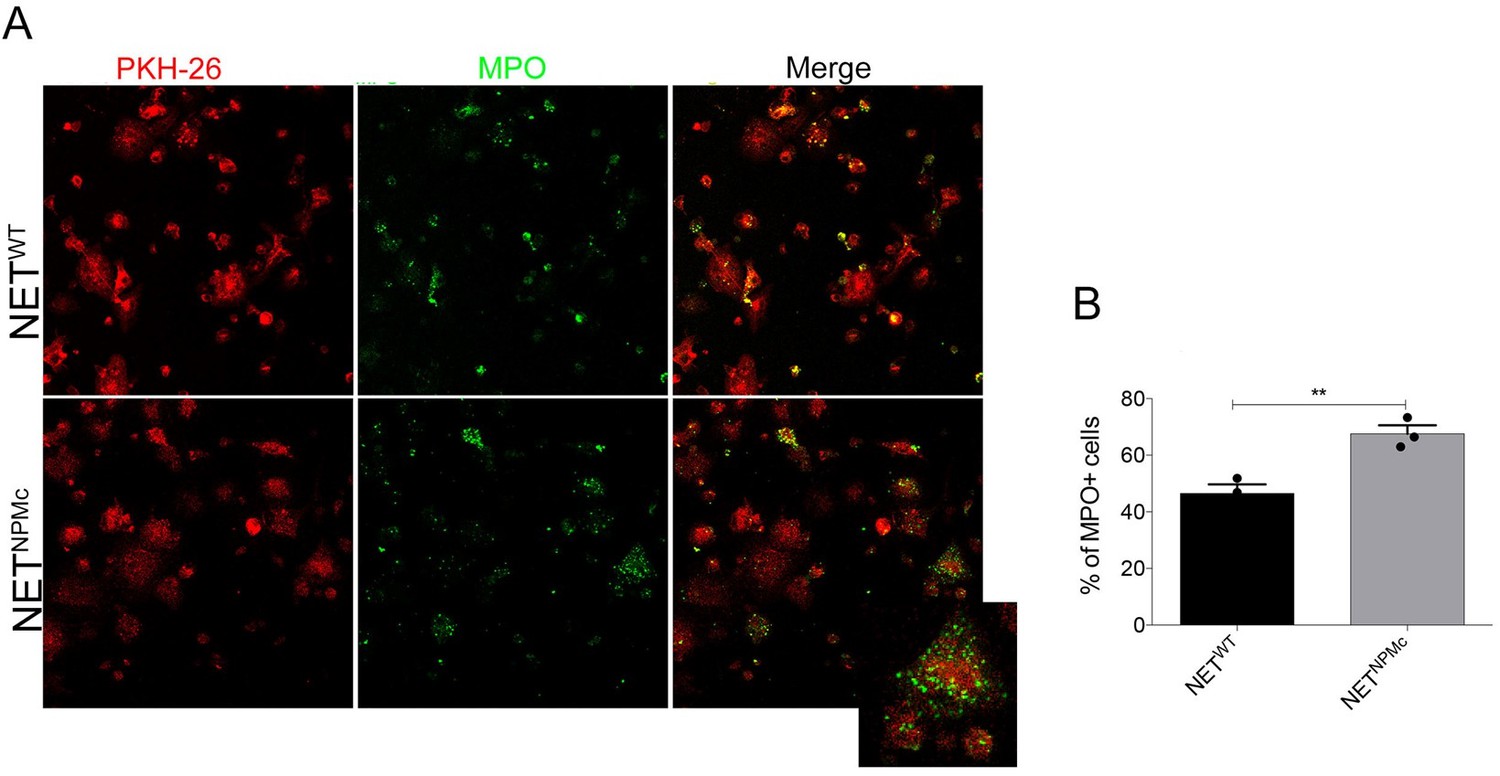
(A) Schematic representation of the vaccination experiment. (B) IF analysis for myeloperoxidase (MPO) (purple) and NPM (green) of DC cocultured with NPMc+ or WT NET. (C) Bone marrow (BM) histopathology of NPMc+ transgenic mice vaccinated with WT or NPMc+ NET-loaded DC or left untreated. (D) May–Grunwald Giemsa staining of BM smears from NPMc+ transgenic mice vaccinated with WT or NPMc+ NET-loaded DC or left untreated. (E) IF analysis for NPM on BM sections from vaccinated or control mice. (F) Quantification of NPMc + areas in the IF analysis (mean with SD; KWMC test p < 0.0001) (Figure 1—source data 1); PB FACS analysis for (G) GR-1+c-Kit+ myeloblasts (mean with SD; KWMC test p: 0.0030) and (H) CD11b+ myeloid cells (mean with SD; KWMC test p: 0.0810)(Figure 1—source data 2); NPMc+ transgenic mice vaccinated with WT or NPMc+ NET-loaded DC or left untreated. (I) Quantification of autoantibodies to mutant NPM developing in the serum of vaccinated mice (mean with SD; KWMC test p: 0.0021) (Figure 1—source data 3). In each graph every point represents a single mouse.
-
Figure 1—source data 1
Quantification of NPMc+ positive area.
- https://cdn.elifesciences.org/articles/69257/elife-69257-fig1-data1-v3.xlsx
-
Figure 1—source data 2
FACS data relative to panels G and H.
- https://cdn.elifesciences.org/articles/69257/elife-69257-fig1-data2-v3.xlsx
-
Figure 1—source data 3
ELISA data relative to the detection of NPM Ab in the sera of vaccinated mice.
- https://cdn.elifesciences.org/articles/69257/elife-69257-fig1-data3-v3.xls
Figure 2
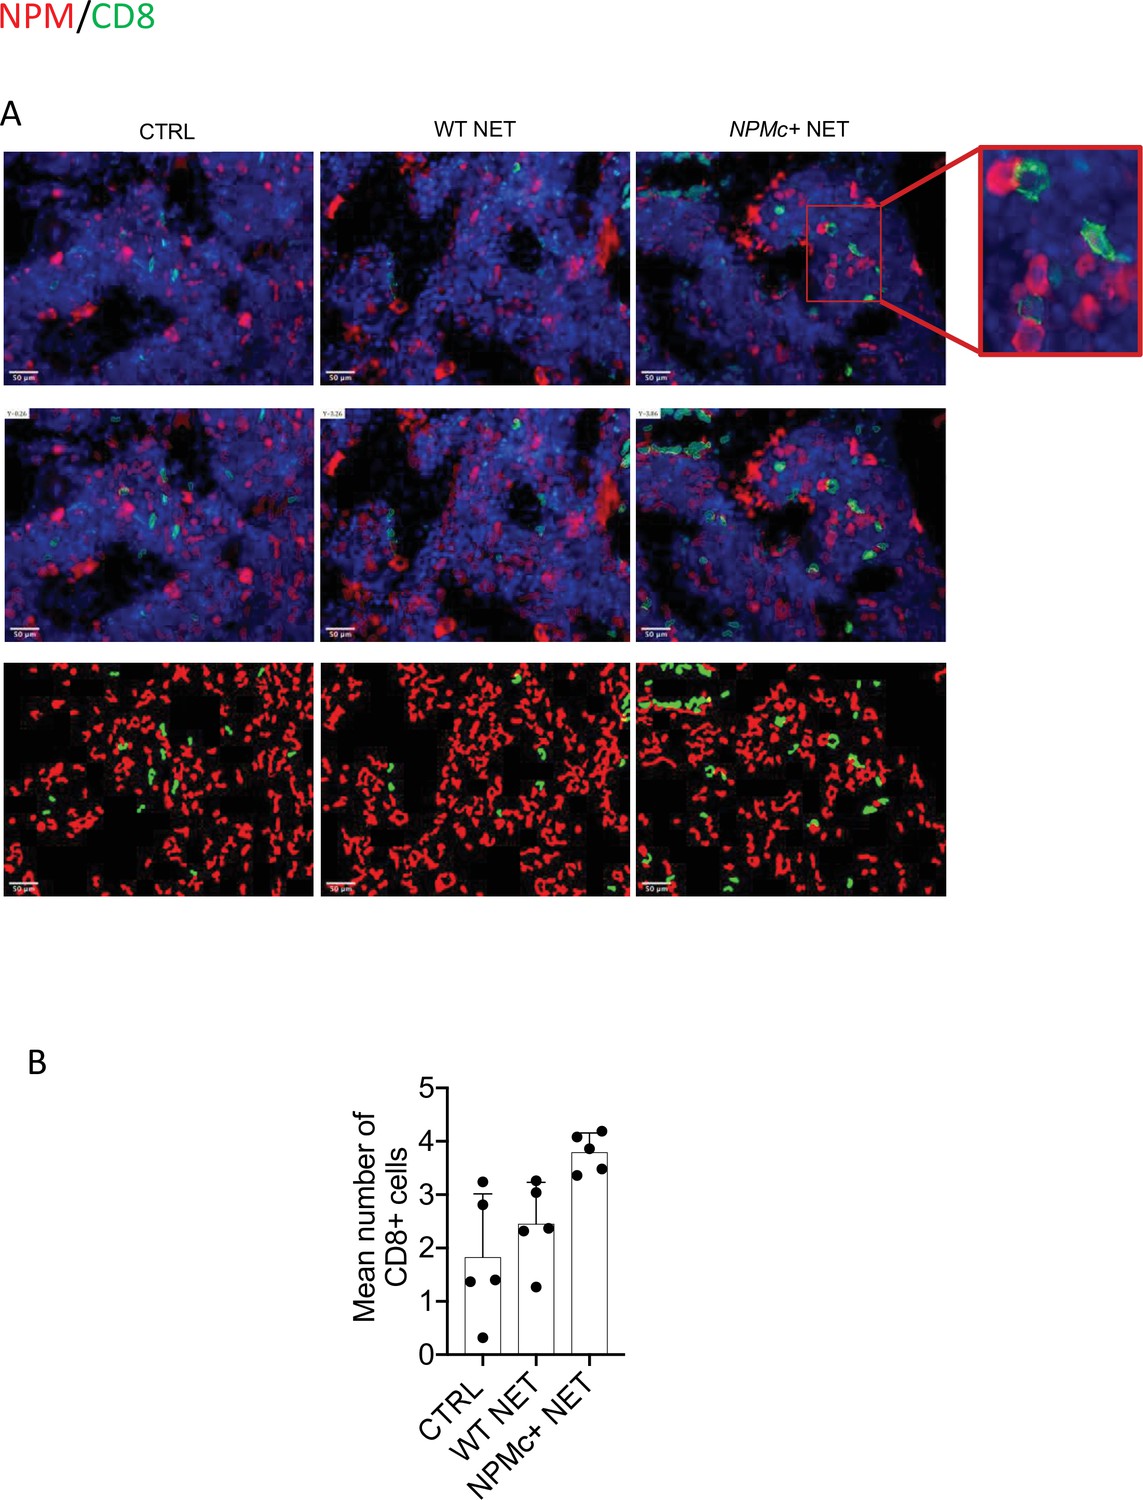
Analysis of CD8 T-cell frequency and interaction with NPMc+ cells in bone marrow (BM) biopsies from control and vaccinated mice.
(A) Representative IF analysis on BM sections of NPMc+ transgenic mice vaccinated with WT or NPMc+ NET-loaded DC or left untreated, showing the reciprocal distribution of CD8+ T cells (green) and NPMc+ (red). (B) Software-based quantitative analysis of cell–cell contact between CD8+ and NPMc+ cells on segmented IF microphotographs; mean with SD, KWMC test p: 0.0016 (source data in Figure 2—source data 1).
-
Figure 2—source data 1
Quantification of CD8/NPM contacts.
- https://cdn.elifesciences.org/articles/69257/elife-69257-fig2-data1-v3.xlsx
Figure 3
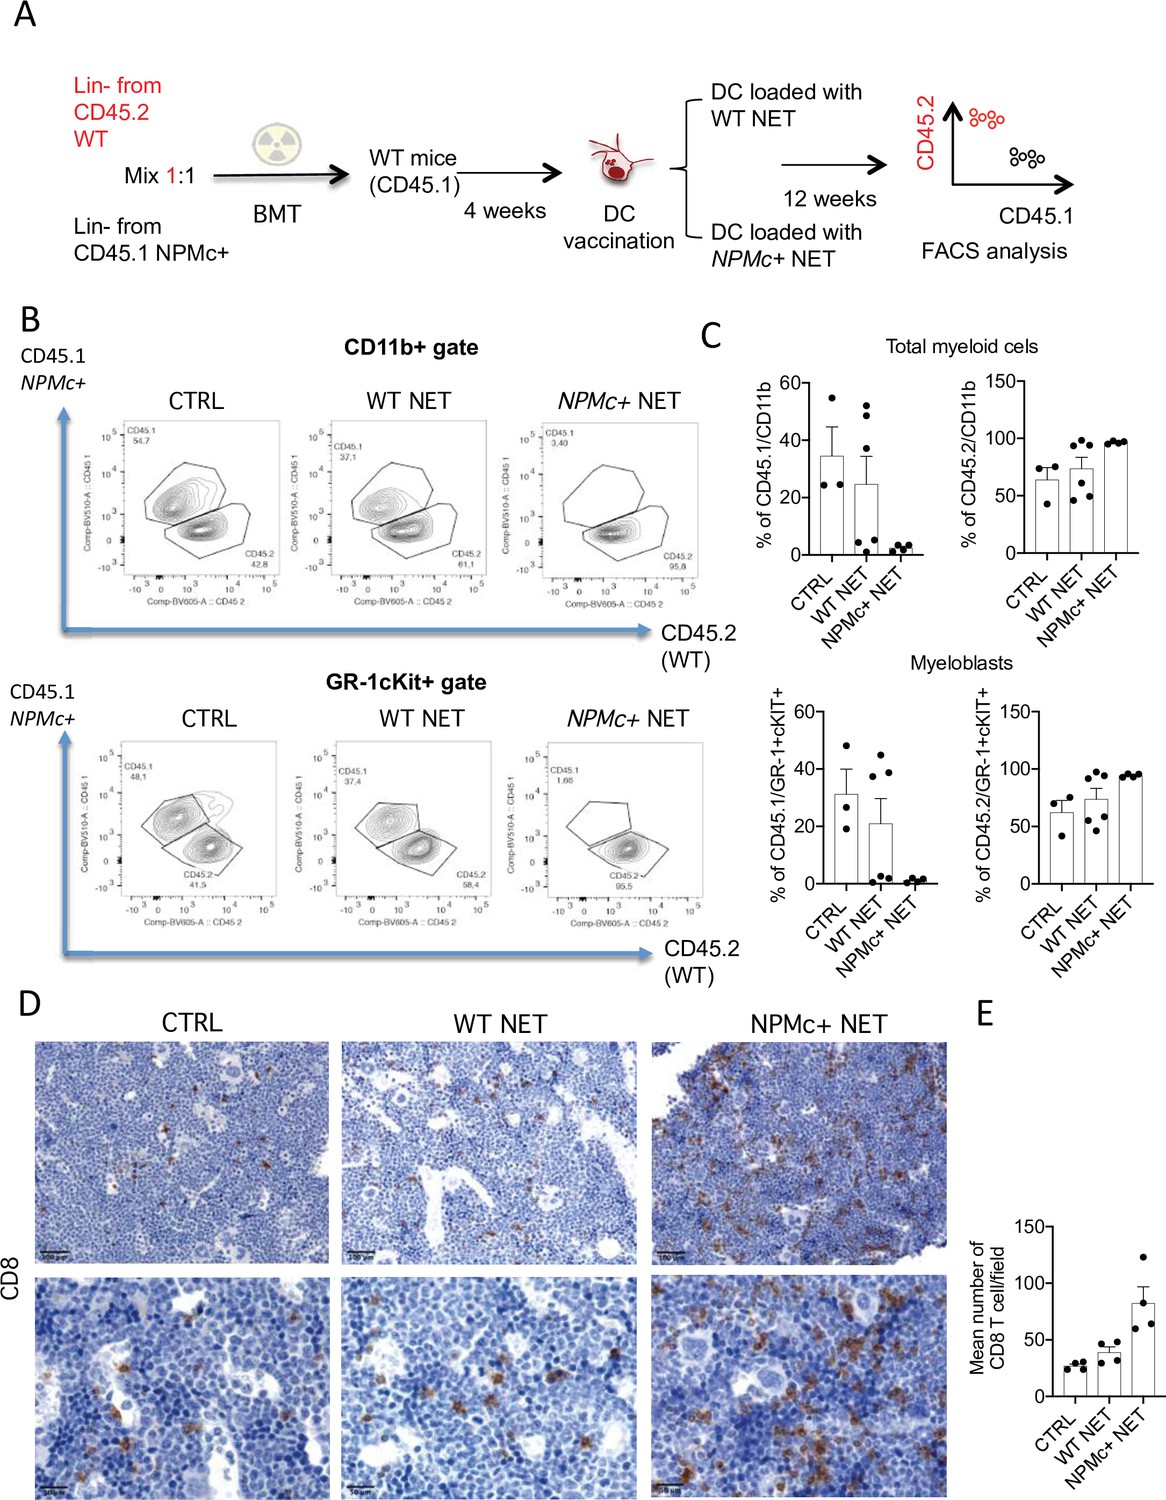
Vaccination with with NPM+ NET/DC controls the expansion of NPMc+ cells in competitive BMT assay.
(A) Schematic representation of the competitive BMT experiment. (B) Representative dot plots showing the frequency of CD45.1 (NPMc+) and CD45.2 (WT) in myeloid cell- (CD11b+) and myeloblast- (GR-1+c-Kit+) gate of bone marrow (BM) chimeras that received vaccination with WT or NPMc+ NET/DC. (C) Cumulative data showing the frequency of CD45.1 (NPMc+) and CD45.2 (WT) within the CD11b+ (mean with SD; KWMC test p: 0.0628 and p: 0.0636, respectively) and GR-1+c-Kit+ (mean with SD; KWMC test p: 0.0625 and p: 0.1134, respectively) gate (original data in Figure 3—source data 1). (D) IHC analysis of CD8+ cells in BM sections of in BM chimeras vaccinated with WT or NPMc+ NET-loaded DC or left untreated. (E) Quantification of CD8+ T cells performed by counting the number of immunoreactive cells out of five nonoverlapping high-power (×400) microscopic fields for every BM sample (mean with SD; KWMC test p: 0.0005) (original data in Figure 3—source data 2).
-
Figure 3—source data 1
Original FACS data for all the displayed groups and variables.
- https://cdn.elifesciences.org/articles/69257/elife-69257-fig3-data1-v3.xlsx
-
Figure 3—source data 2
Quantification of infiltrating CD8+ cells.
- https://cdn.elifesciences.org/articles/69257/elife-69257-fig3-data2-v3.xlsx
Figure 4 with 2 supplements
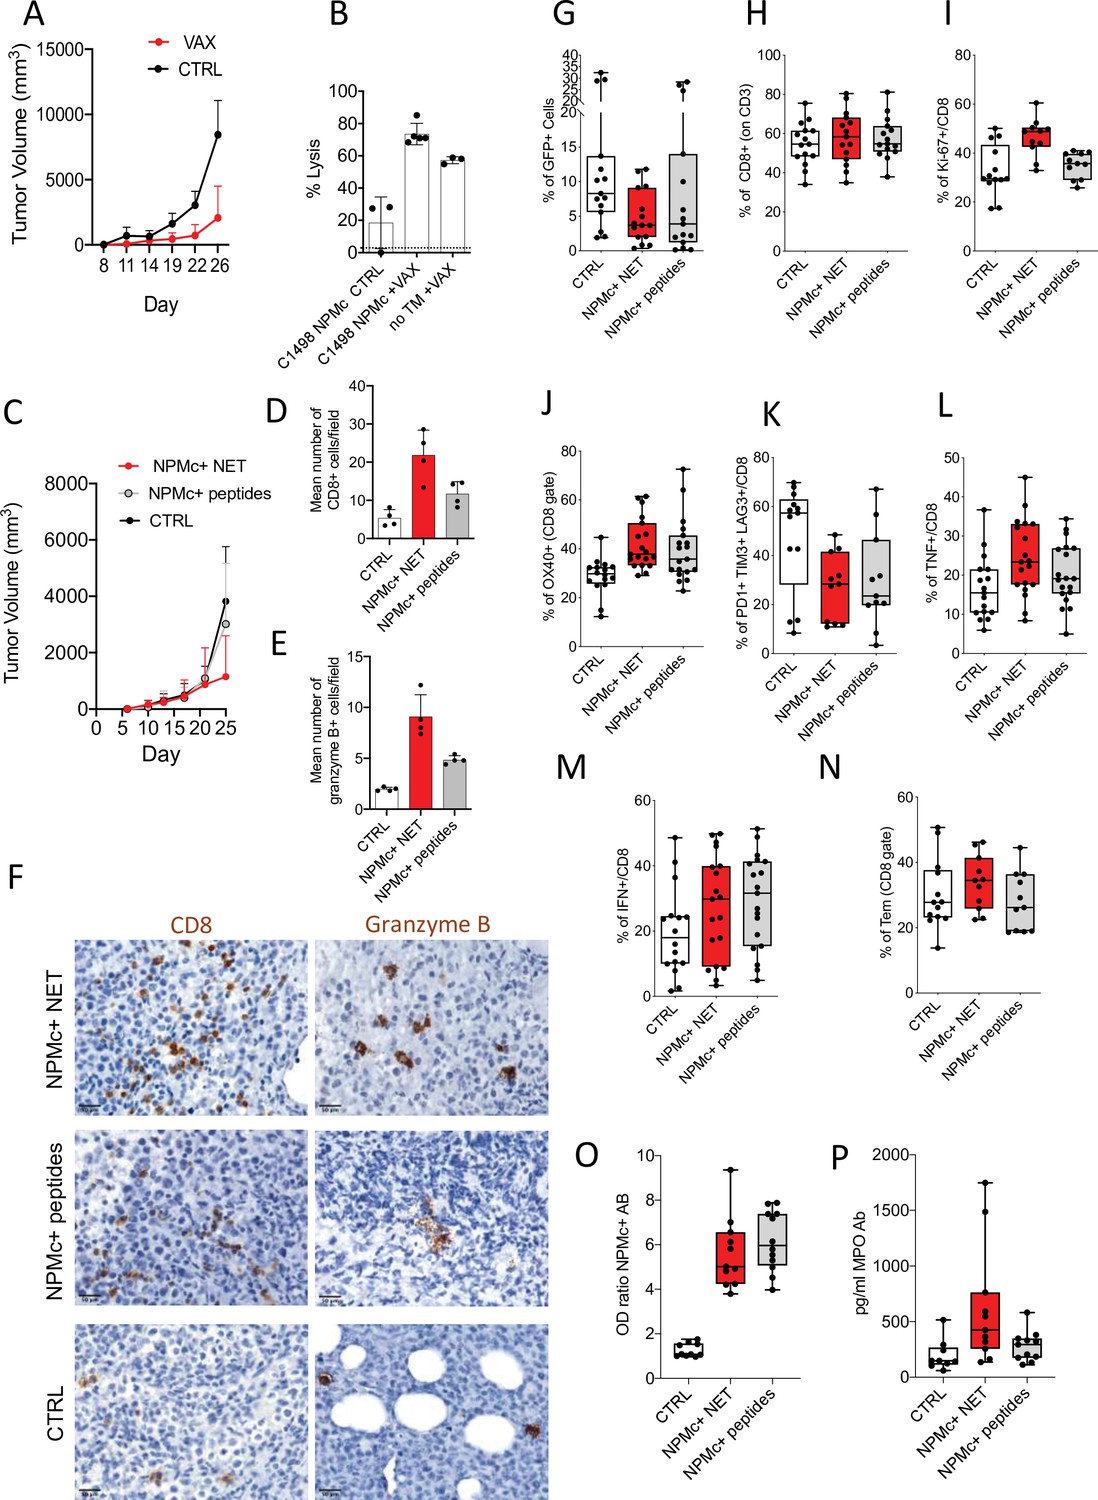
NPMc+ NET vaccination prevents transplantable NPMc+ leukemia cell growth and promotes CD8 lysis.
C1498-NPMc+ leukemia cells were injected s.c. into NPMc+ transgenic mice. NPMc+ NET/DC-based vaccine was administered at days 3, 5, 10, and 14 post leukemia injection. Tumor growth was monitored twice a week. (A) Line chart of the mean with standard deviation (SD) tumor volume (mixed model, p: 0.0214) (original data in Figure 4—source data 1). (B) Elicitation of antigen-specific CD8+ T cells in vaccinated mice. Vaccinated tumor bearing mice (TB) or control mice have been injected with 107 cells containing equal numbers of splenocytes labeled with 1.25 μM (CFSEhi) or 0.125 μM of CFSE (CFSElow). CFSEhi cells were previously pulsed 1 hr with NPMc-MHC-I peptides. Mice were sacrificed the following day, and their splenocytes and lymph nodes analyzed by flow cytometry for the evaluation of the presence of CFSEhi and CFSElow cells. NPMc-specific cytolytic activity was calculated as: (percentage CFSEhigh cells) × 100/(percentage CFSElow cells) (mean with SD; KWMC test p: 0.0007; dotted line refers to the control ‘no TM CTRL) (Figure 4—source data 2). One representative experiment out of three performed. Abbreviations: No TM: mice noninjected with C1498 cells; VAX: vaccinated mice; CTRL: nonvaccinated mice. (C) Take of C1498-NPMc+ cells injected s.c. in NPMc+ transgenic mice vaccinated with DC pulsed with NPMc+ NET or NPMc+ peptides at days 3, 5, 10, and 14 post leukemia injection, line chart of the mean with SD tumor volume (mixed model, p: 0.1443). IHC analysis for CD8 and granzyme B of C1498 tumors subcutaneously grown in NPM1 tg mice that received the different vaccinations. (D) quantification of CD8 (mean with SD; KWMC test p: 0.0010) (original data in Figure 4—source data 4) and (E) granzyme B+ cells (mean with SD; KWMC test p: 0.0001) (original data in Figure 4—source data 5) and (F) representative pictures showing CD8 and granzyme B+ cells in tumors from mice vaccinated with NPMc+ NET or NPMc+ peptides. (G) Frequency of GFP+ cells in mice injected intrabone and vaccinated with DC pulsed with NPMc+ NET or NPMc+ peptides at days 10, 14, 17, and 23 post leukemia cell injection (KW test p: 0.064) (original data in Figure 4—source data 6). FACS analysis showing the frequency of CD8 T cells (KW test p: 0.7496) (H; original data in Figure 4—source data 7), Ki-67+ CD8 T cells (KW test p: 0.0028) (I, original data in Figure 4—source data 8), OX40 + CD8 T cells (analysis of Variance [ANOVA] two-way test, p:0.0066) (J, original data in Figure 4—source data 9), exhausted T cells (PD1+TIM3+LAG3+, panel K, original data in Figure 4—source data 10). KW test p: 0.0417, TNF+ (ANOVA two-way test, p: 0.0324) and IFNg+CD8 T cells (ANOVA two-way test, p: 0.4577) (L, M, original data in Figure 4—source data 11 and Figure 4—source data 12) and the amount of effector memory cells (KW test p: 0.3011) (N, original data in Figure 4—source data 13). Titer of Ab to mutant NPMc and MPO in the sera of vaccinated mice. The NPMc Ab titer (O, original data in Figure 4—source data 14) is shown as OD ratio (KW test p: < 0.0001) whereas the MPO Ab titer (P, original data in Figure 4—source data 15) is shown as pg/ml (KWMC test p: 0.0092). Each boxplot (G–P) indicates the 25th and 75th centiles of the distribution. The horizontal line inside the box indicates the median and the whiskers indicate the extreme measured values.
-
Figure 4—source data 1
Tumor growth evaluation in vaccinated mice.
- https://cdn.elifesciences.org/articles/69257/elife-69257-fig4-data1-v3.xls
-
Figure 4—source data 2
FACS data relative to the in vivo cytotoxicity assay.
- https://cdn.elifesciences.org/articles/69257/elife-69257-fig4-data2-v3.xlsx
-
Figure 4—source data 3
Tumor growth evaluation in mice receiving DC+NPMc+ NET or DC+NPMc+ peptides vaccines.
- https://cdn.elifesciences.org/articles/69257/elife-69257-fig4-data3-v3.xls
-
Figure 4—source data 4
Quantification of infiltrating CD8+ cells by IHC.
- https://cdn.elifesciences.org/articles/69257/elife-69257-fig4-data4-v3.xlsx
-
Figure 4—source data 5
Quantification of infiltrating granzyme B+ cells.
- https://cdn.elifesciences.org/articles/69257/elife-69257-fig4-data5-v3.xlsx
-
Figure 4—source data 6
Original FACS data relative to the frequency of GFP+ cells.
- https://cdn.elifesciences.org/articles/69257/elife-69257-fig4-data6-v3.xlsx
-
Figure 4—source data 7
Original FACS data relative to the frequency of CD8+ cells (CD3 gate).
- https://cdn.elifesciences.org/articles/69257/elife-69257-fig4-data7-v3.xlsx
-
Figure 4—source data 8
Original FACS data relative to the frequency of Ki-67+/CD8 cells.
- https://cdn.elifesciences.org/articles/69257/elife-69257-fig4-data8-v3.xlsx
-
Figure 4—source data 9
Original FACS data relative to the frequency of OX40+ cells (CD8 gate).
- https://cdn.elifesciences.org/articles/69257/elife-69257-fig4-data9-v3.xlsx
-
Figure 4—source data 10
Original FACS data relative to the frequency of PD1+TIM3+LAG3+ on CD8 cells.
- https://cdn.elifesciences.org/articles/69257/elife-69257-fig4-data10-v3.xlsx
-
Figure 4—source data 11
Original FACS data relative to the frequency of TNF+ cells (on CD8+).
- https://cdn.elifesciences.org/articles/69257/elife-69257-fig4-data11-v3.xlsx
-
Figure 4—source data 12
Original FACS data relative to the frequency of IFNg+ cells (on CD8+).
- https://cdn.elifesciences.org/articles/69257/elife-69257-fig4-data12-v3.xlsx
-
Figure 4—source data 13
Original FACS data relative to the frequency of Tem (on CD8+).
- https://cdn.elifesciences.org/articles/69257/elife-69257-fig4-data13-v3.xlsx
-
Figure 4—source data 14
ELISA assay for Ab to mutant NPM original data.
- https://cdn.elifesciences.org/articles/69257/elife-69257-fig4-data14-v3.xlsx
-
Figure 4—source data 15
ELISA assay for Ab to mutant myeloperoxidase (MPO) original data and titration curve.
- https://cdn.elifesciences.org/articles/69257/elife-69257-fig4-data15-v3.xls
Figure 4—figure supplement 1
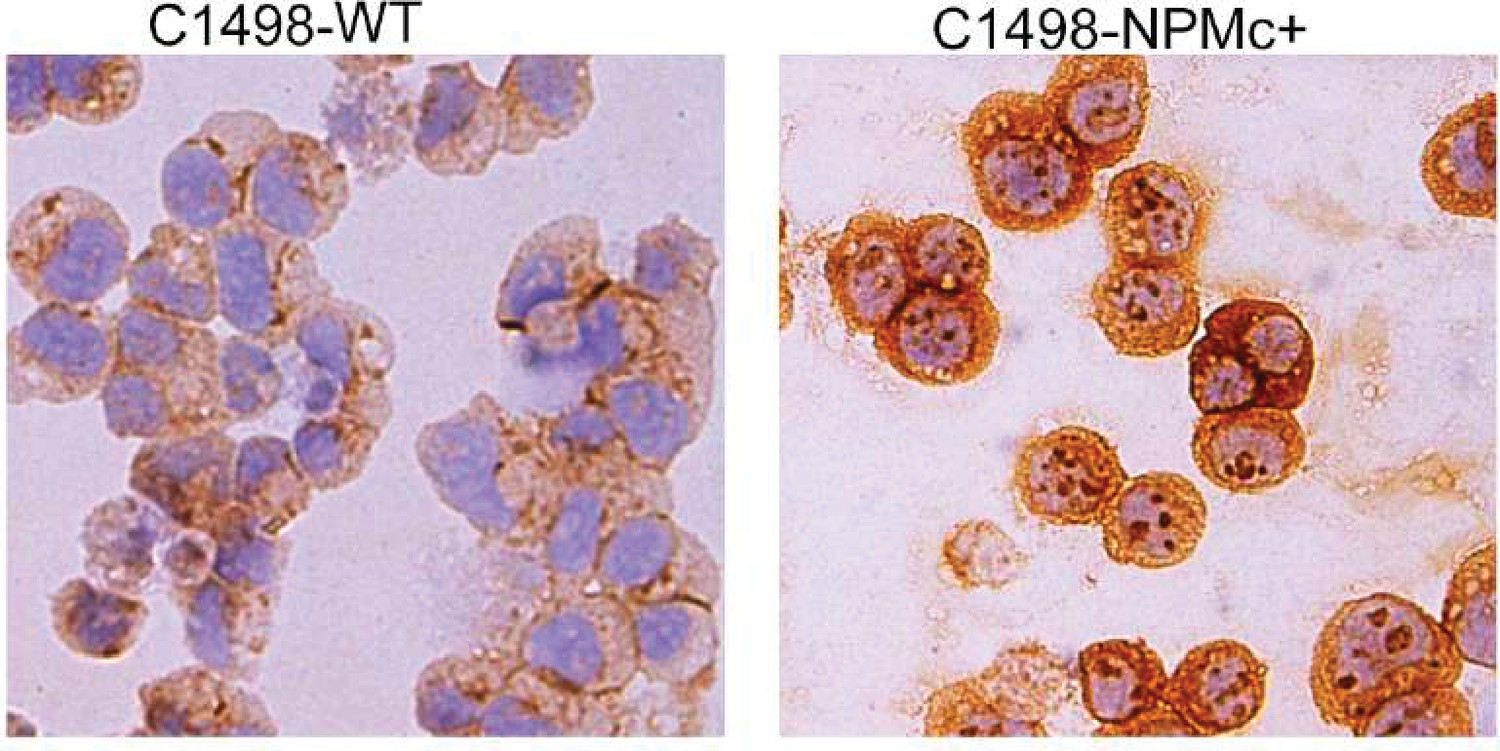
Detection of mutant NPMc+ in C1498 cells infected with a lentiviral vector expressing human mutant NPM1.
Figure 4—figure supplement 2
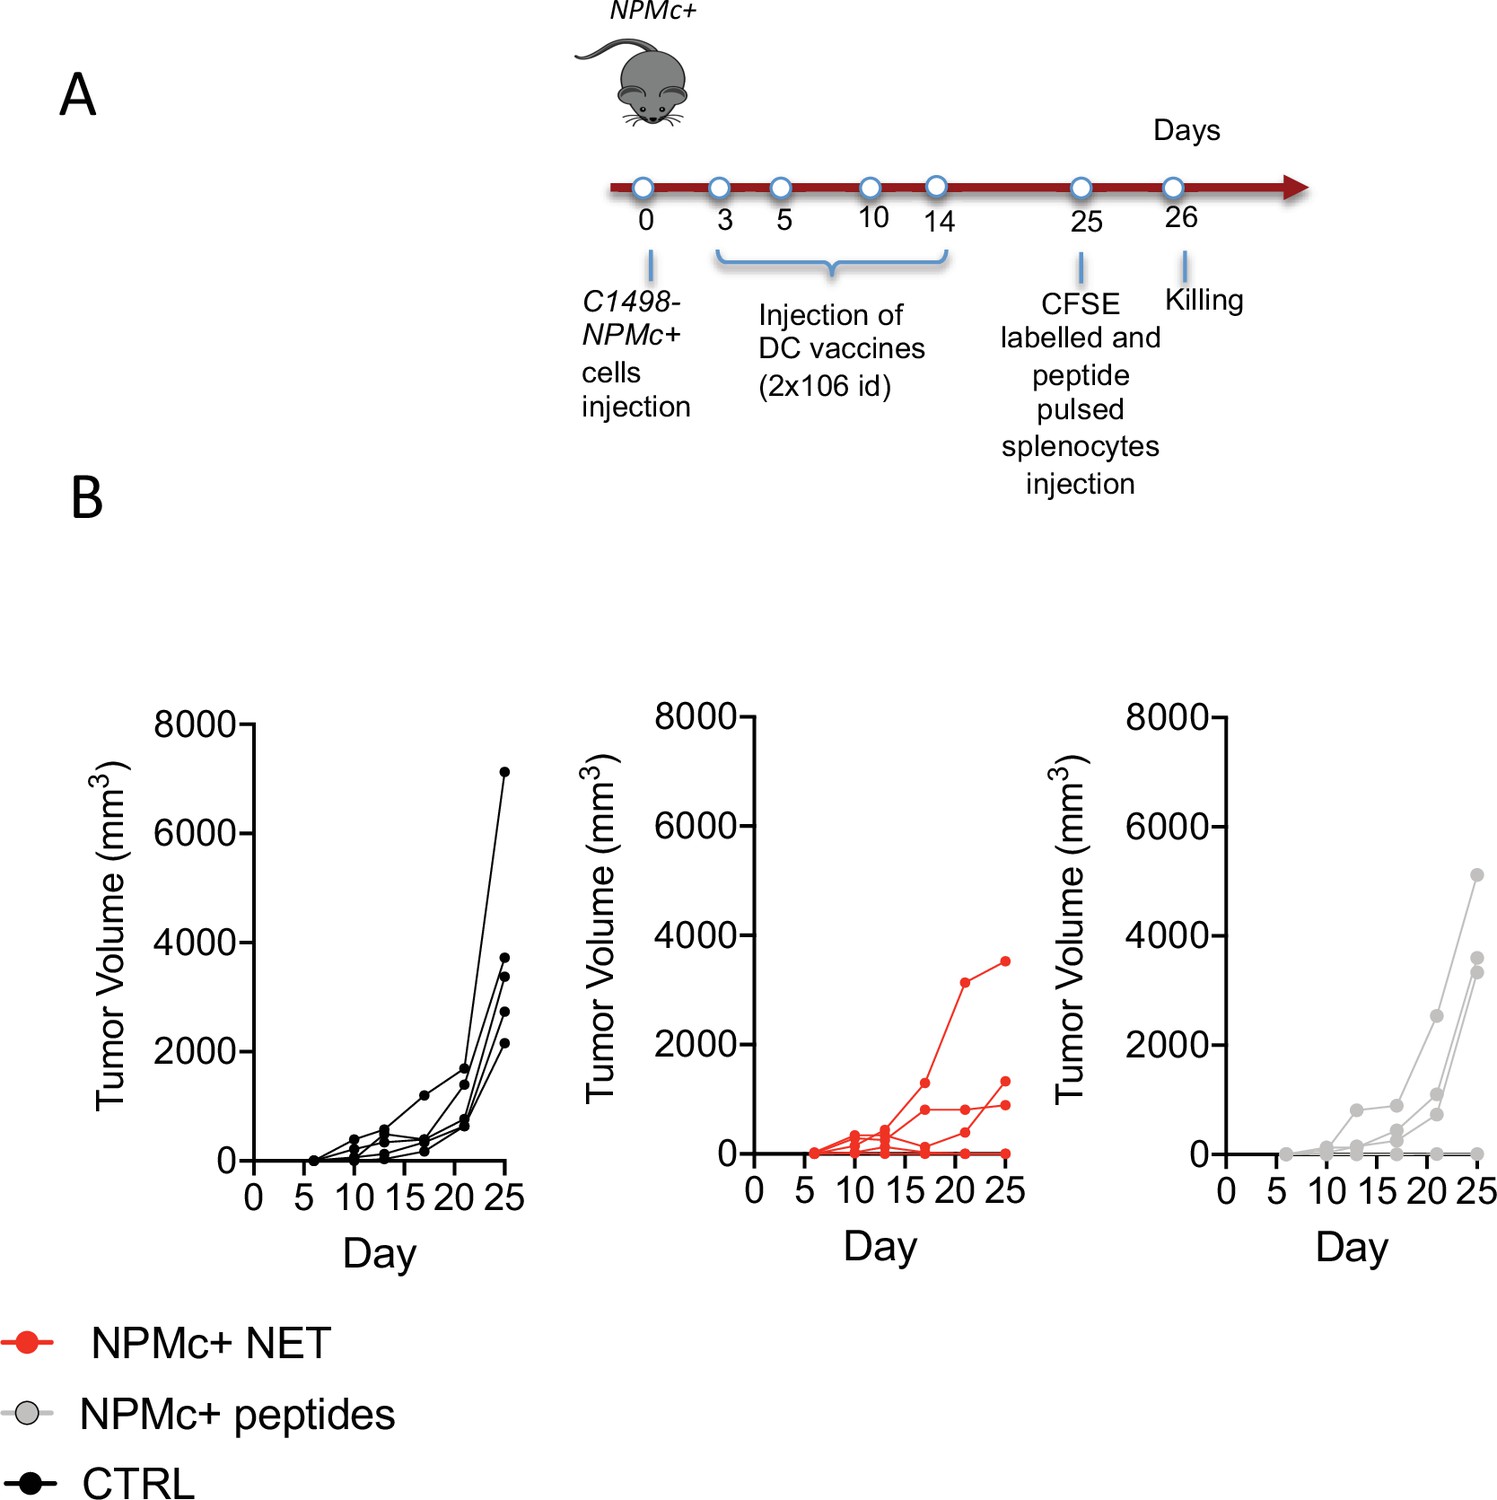
NPMc+ NET vaccination prevents transplantable NPMc+ leukemia cell growth.
(A) Schematic representation of the vaccination experiment. (B) Take of C1498-NPMc+ cells injected s.c. in NPMc+ transgenic mice vaccinated with DC pulsed with NPMc+ NET or NPMc+ peptides at days 3, 5, 10, and 14 post leukemia injection, in each chart every line represent a single mouse.
Author response image 1
Additional files
-
Transparent reporting form
- https://cdn.elifesciences.org/articles/69257/elife-69257-transrepform1-v3.pdf
-
Supplementary file 1
Antibodies for flow cytometry.
- https://cdn.elifesciences.org/articles/69257/elife-69257-supp1-v3.docx
Download links
A two-part list of links to download the article, or parts of the article, in various formats.
Downloads (link to download the article as PDF)
Open citations (links to open the citations from this article in various online reference manager services)
Cite this article (links to download the citations from this article in formats compatible with various reference manager tools)
Neutrophil extracellular traps arm DC vaccination against NPM-mutant myeloproliferation
eLife 11:e69257.
https://doi.org/10.7554/eLife.69257


