Aorta smooth muscle-on-a-chip reveals impaired mitochondrial dynamics as a therapeutic target for aortic aneurysm in bicuspid aortic valve disease
- Department of Cardiac Surgery and Shanghai Institute of Cardiovascular Diseases, Zhongshan Hospital, Fudan University, China
- Institutes of Biomedical Sciences and the Shanghai Key Laboratory of Medical Epigenetics, Shanghai Medical College, Fudan University, China
- The State Key Laboratory of Molecular Engineering of Polymers, Fudan University, China
Figures
Figure 1
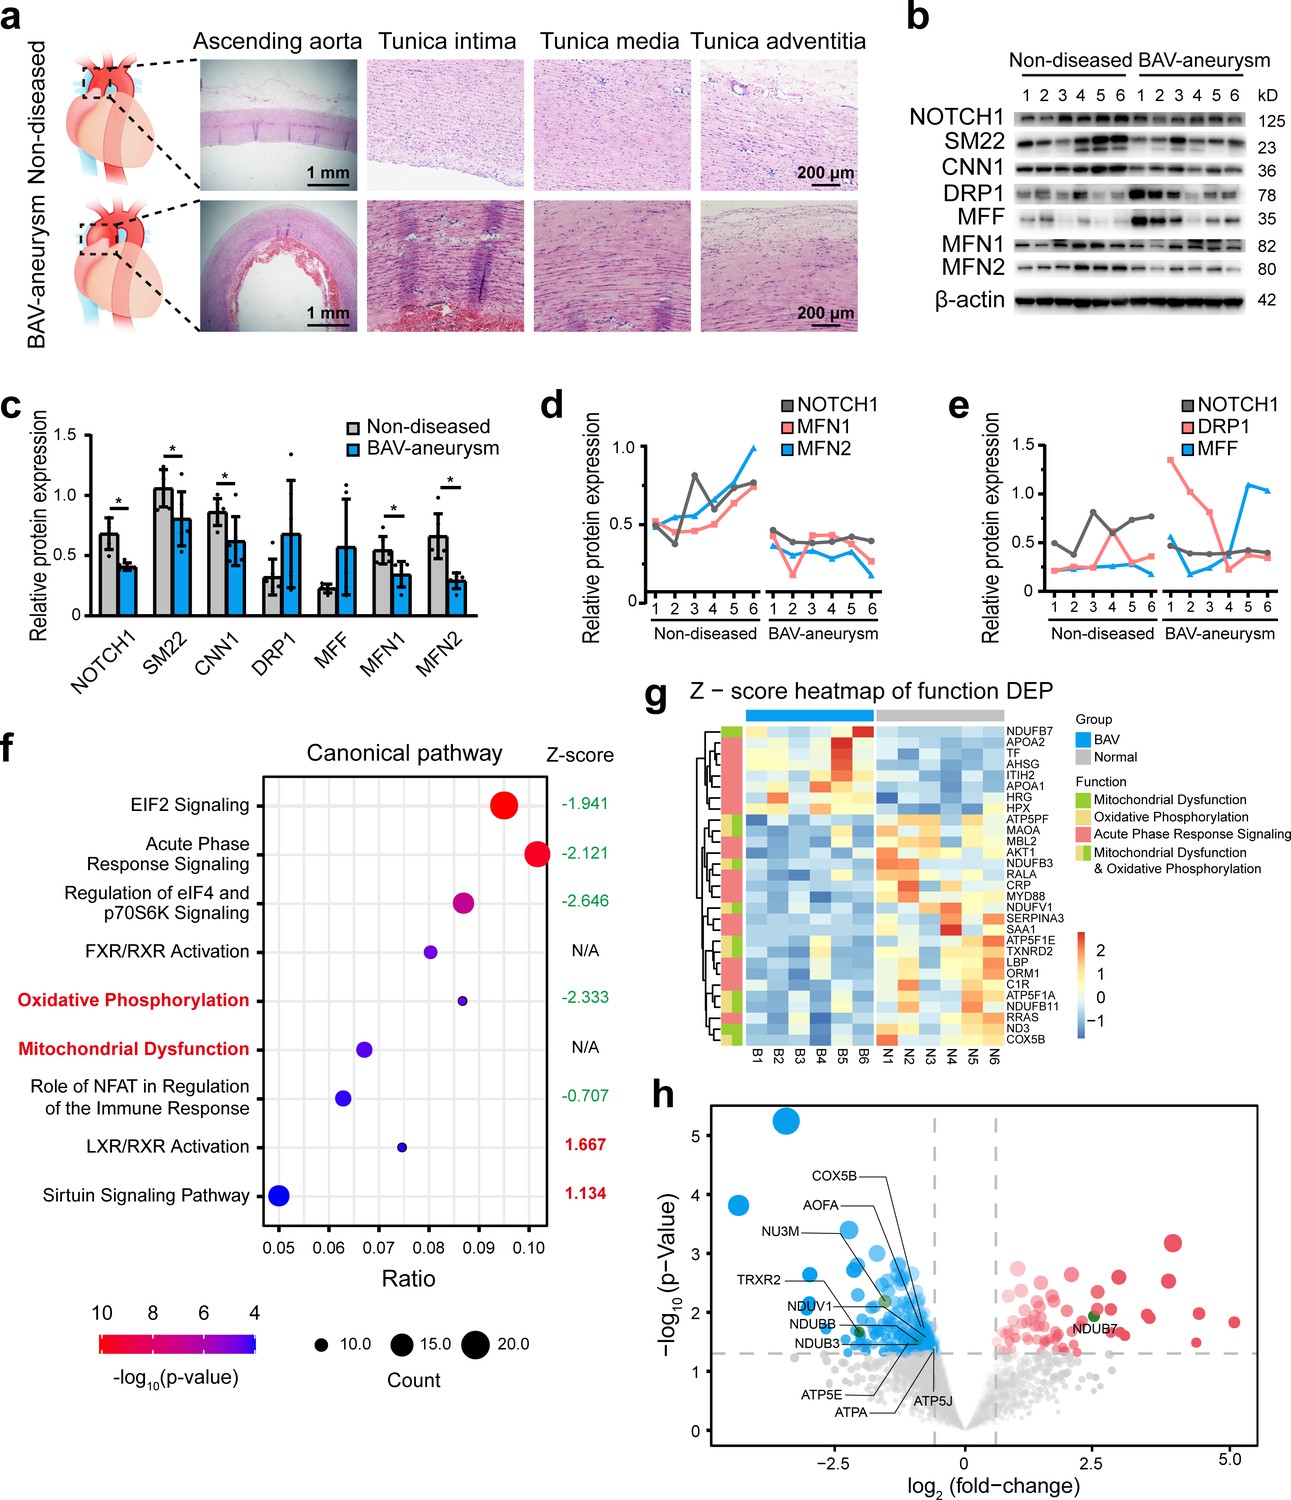
The relationship between NOTCH1 insufficiency and mitochondrial dysfunction in BAV-TAA.
(a) H and E staining of non-diseased and BAV-TAA aortic tissues. The scale bar represents 1 mm in the low field and 200 μm in the high field. (b) Representative images of the western blotting analysis of the expression of NOTCH1, the mitochondrial dynamics proteins DRP-1, MFF, MFN1, and MFN2 and the contractile phenotype proteins SM22 and CNN1 in six non-diseased and six BAV-TAA aortic tissue fragments. (c) Quantification of the total band densities of the proteins normalized to the corresponding band density of β-actin (n = 6, *p < 0.05, two‐tailed Student’s t tests were used between two groups). (d) Correlation analysis among the quantified protein expression levels of NOTCH1, MFN1, and MFN2. A positive correlation was found between NOTCH1 and MFN1 or MFN2 in aortic tissues. The R2 between NOTCH1 and MFN2 was 0.8069, and that between NOTCH1 and MFN1 was 0.6137. (e) Correlation analysis between the quantified protein expression of NOTCH1 and DRP1 or MFF. No correlation was found. (f) The enriched canonical pathways identified by IPA. (g) Heatmap of the expression of enriched proteins involved in mitochondrial dysfunction, the oxidative phosphorylation pathways and acute phase response signaling. (h) Volcano plot visualization of the differentially expressed proteins related to mitochondrial dysfunction. The colors indicate the following: gray, no differential expression; red, upregulated proteins; and blue, downregulated proteins. The proteins related to mitochondrial dysfunction are labeled. All the data are expressed as the means ± SDs.
-
Figure 1—source data 1
The original raw data for western blotting.
- https://cdn.elifesciences.org/articles/69310/elife-69310-fig1-data1-v2.zip
-
Figure 1—source data 2
List of total differential protein expression between non-diseased and BAV-TAA aortic tissues.
- https://cdn.elifesciences.org/articles/69310/elife-69310-fig1-data2-v2.zip
-
Figure 1—source data 3
The total enriched canonical pathways in BAV-TAA aortic tissues.
- https://cdn.elifesciences.org/articles/69310/elife-69310-fig1-data3-v2.zip
-
Figure 1—source data 4
List of total protein expression between non-diseased and BAV-TAA aortic tissues.
- https://cdn.elifesciences.org/articles/69310/elife-69310-fig1-data4-v2.zip
Figure 2 with 9 supplements

Schematic design and strain characterization of the aorta smooth muscle-on-a-chip model.
(a) Schematic overview of the in vitro chip model. (b) Cross-sectional view of the microfluidic aorta smooth muscle-on-a-chip model showing the deformations of the PDMS membranes under different vacuum pressures. The scale bar represents 5 mm. (c) Measured tensile strains of the upper (red) and lower (blue) membranes at negative pressures of 10 kPa and 15 kPa for five cycles. The peak tensile strain per cycle averaged 7.18 ± 0.44% with a cyclic negative pressure of 10 kPa and 17.28 ± 0.91% with a cyclic negative pressure of 15 kPa.
-
Figure 2—source data 1
The quantification data for measurement of tensile strains of the upper and lower membranes.
- https://cdn.elifesciences.org/articles/69310/elife-69310-fig2-data1-v2.zip
Figure 2—figure supplement 1
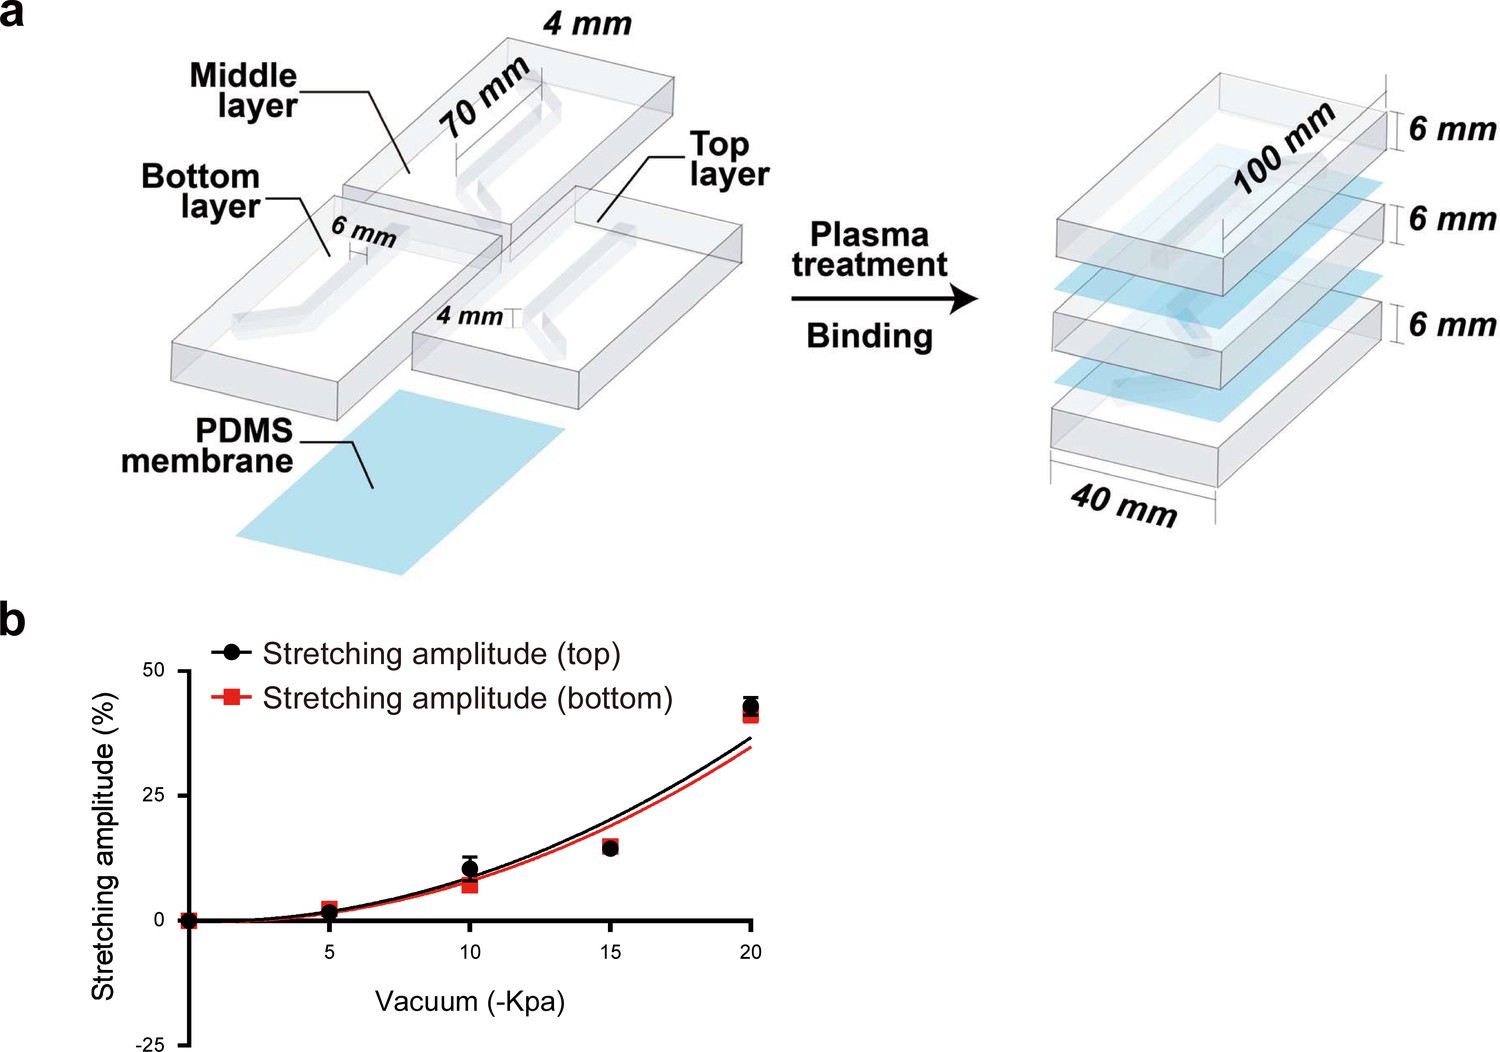
Characterization and parameters of the aorta smooth muscle-on-a-chip model.
(a) Assembly and parameters of the PDMS aorta-on-a-chip model. (b) Membrane deformation under different vacuum pressures (0 kPa, 10 kPa, 15 kPa, and 20 kPa).
Figure 2—figure supplement 2
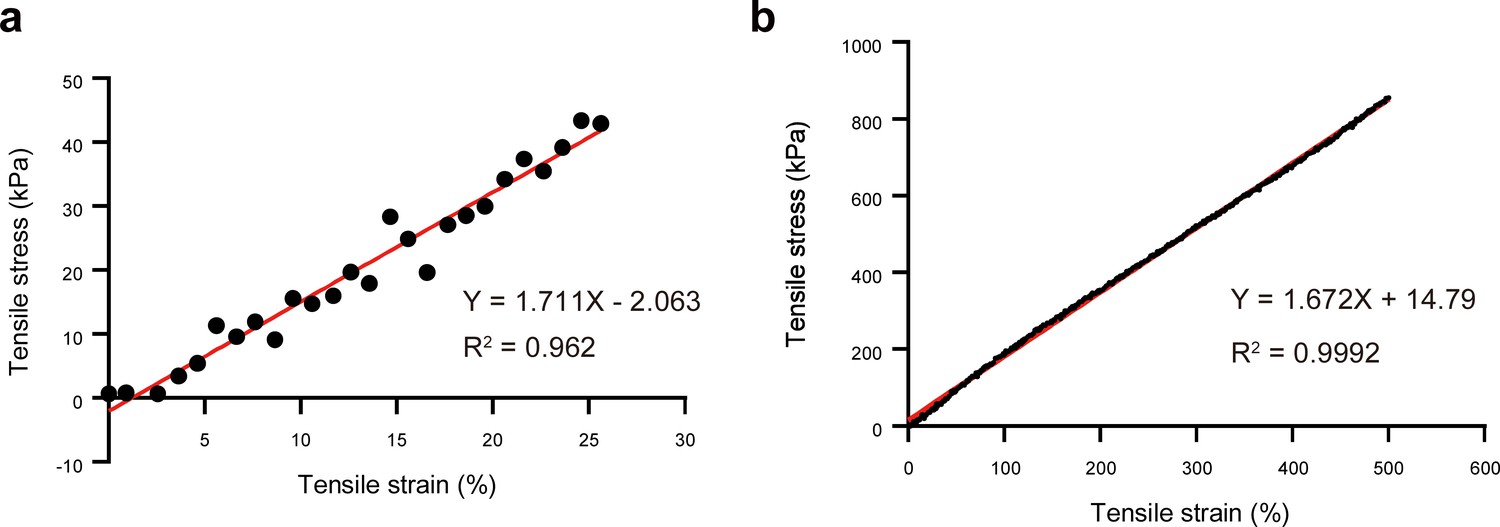
Tensile stress–strain responses of PDMS membrane.
(a) Tensile strains of 25%. (b) Tensile strains of 500%.
-
Figure 2—figure supplement 2—source data 1
The raw data of Tensile stress–strain responses of PDMS membrane.
- https://cdn.elifesciences.org/articles/69310/elife-69310-fig2-figsupp2-data1-v2.zip
Figure 2—figure supplement 3
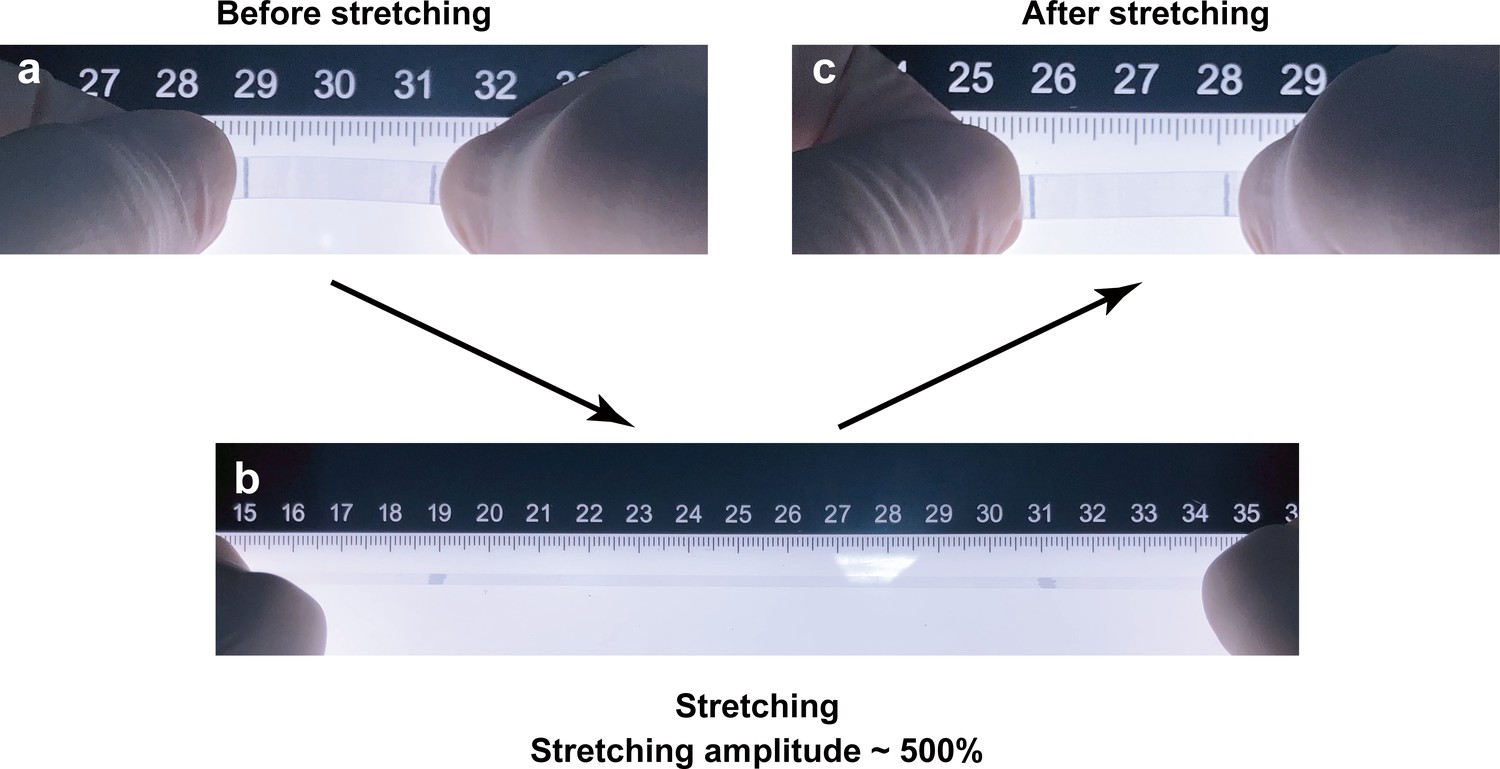
The photographs of a piece of highly (500%) stretched PDMS membrane.
The photographs of a piece of PDMS membrane before stretching (a), 500% elongation (b), recovered PDMS membrane (c) after 500% stretching.
Figure 2—animation 1
Cross-sectional deformation of the PDMS membranes in the microfluidic chip with a 2 mm culturing channel, at the cyclic pressure of -10 kPa.
Figure 2—animation 2
Cross-sectional deformation of the PDMS membranes in the microfluidic chip with a 2 mm culturing channel, at the cyclic pressure of -15 kPa.
Figure 2—animation 3
Cross-sectional deformation of the PDMS membranes in the microfluidic chip with a 4 mm culturing channel, at the cyclic pressure of -10 kPa.
Figure 2—animation 4
Cross-sectional deformation of the PDMS membranes in the microfluidic chip with a 4 mm culturing channel, at the cyclic pressure of -15 kPa.
Figure 2—animation 5
Cross-sectional deformation of the PDMS membranes in the microfluidic chip with a 6 mm culturing channel, at the cyclic pressure of -10 kPa.
Figure 2—animation 6
Cross-sectional deformation of the PDMS membranes in the microfluidic chip with a 6 mm culturing channel, at the cyclic pressure of -15 kPa.
Figure 3
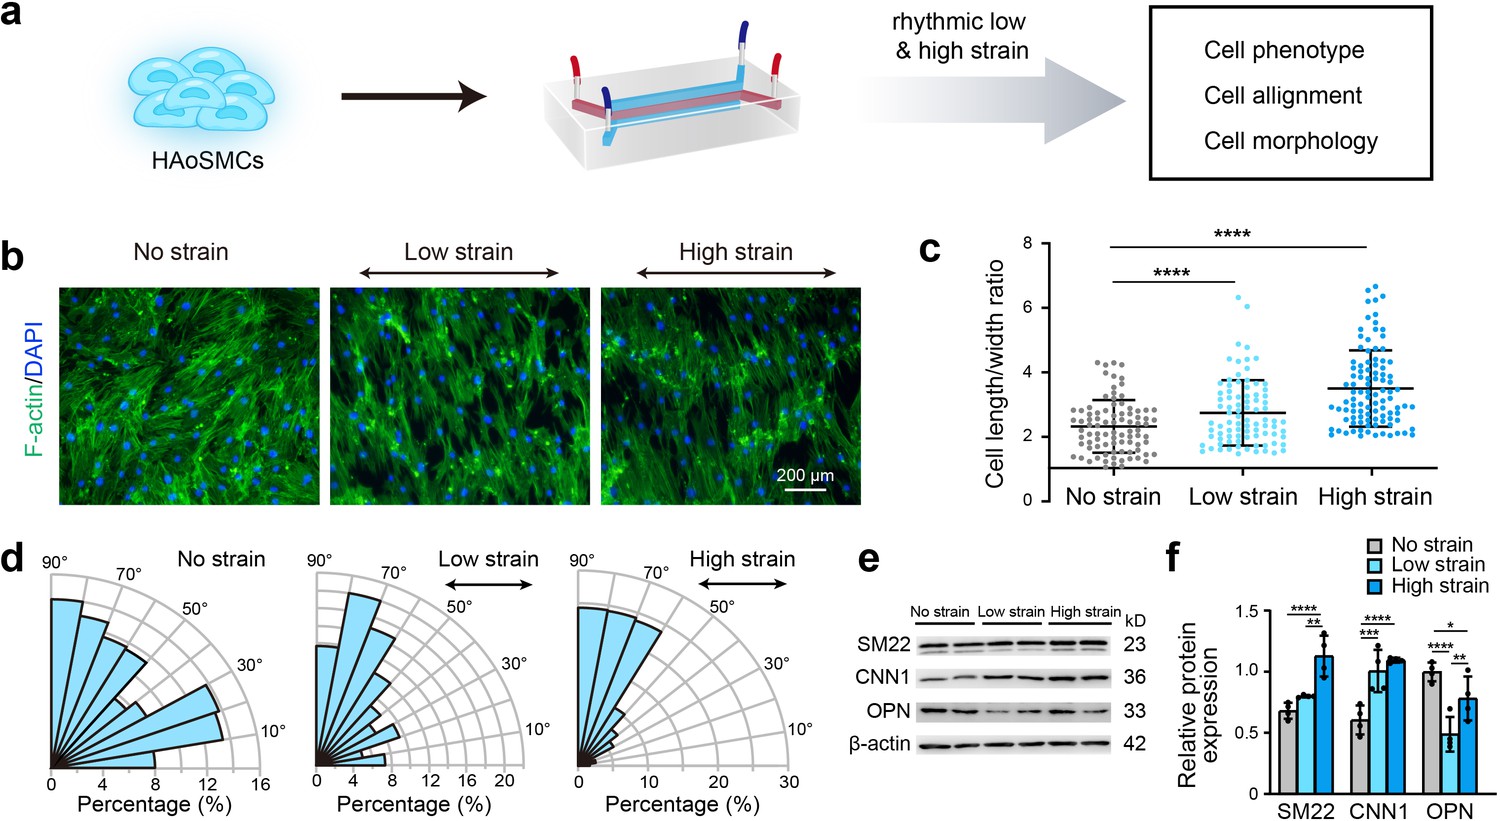
Effect of rhythmic strain on the cell morphology, alignment, and phenotype.
(a) Schematic workflow of cell culture on the chip model. (b) Representative images of cytoskeletal F-actin staining of HAoSMCs exposed to low or high rhythmic strain for 24 hr. The scale bar represents 200 μm. (c) Length-to-width ratio of HAoSMCs after exposure to low or high rhythmic strain for 24 hr. (n = 3, cells were measured in three fields per sample,data from every single cell were plotted. ****p < 0.0001, one-way ANOVA followed by Tukey’s post hoc test). (d) Alignments of HAoSMCs exposed to low or high rhythmic strain for 24 hr. (e) Representative images of the western blotting analyses of protein markers of the contractile phenotype (SM22 and CNN1) and synthetic phenotype (OPN) of HAoSMCs after exposure to low or high rhythmic strain for 24 hr. (f) Quantification of the total band densities for individual proteins normalized to the corresponding band of β-actin (n = 4, *p < 0.05, **p < 0.01, ***p < 0.001, ****p < 0.0001, one-way ANOVA followed by Tukey’s post hoc test). All the data are expressed as the means ± SDs.
-
Figure 3—source data 1
The quantification data for cell length-to-width ratio.
- https://cdn.elifesciences.org/articles/69310/elife-69310-fig3-data1-v2.zip
-
Figure 3—source data 2
The quantification data for orientation of the cells.
- https://cdn.elifesciences.org/articles/69310/elife-69310-fig3-data2-v2.zip
-
Figure 3—source data 3
The original raw data for western blotting.
- https://cdn.elifesciences.org/articles/69310/elife-69310-fig3-data3-v2.zip
Figure 4 with 1 supplement
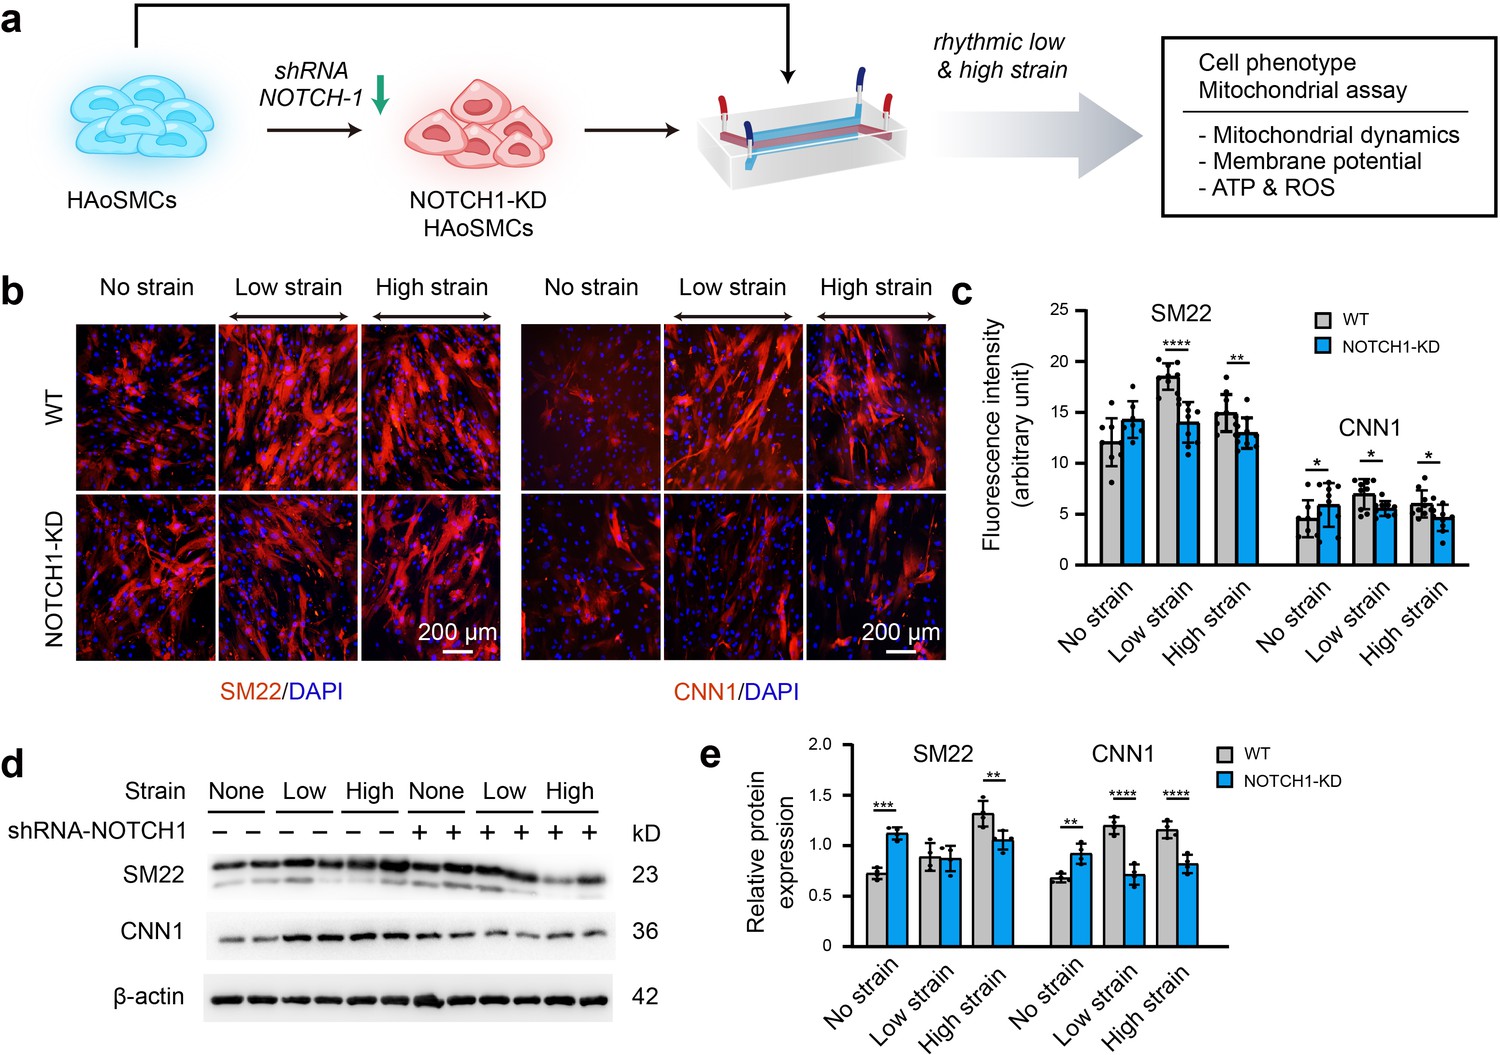
Phenotypic switching of NOTCH1-insufficient HAoSMCs under static and rhythmic strain conditions.
(a) Schematic workflow of NOTCH1-KD HAoSMCs on the chip model. (b) Representative images of immunofluorescence staining of SM22 and CNN1 after exposure to rhythmic low or high strain for 24 hr. The scale bar represents 200 μm. (c) Intensity of immunofluorescence staining of SM22 and CNN1 (n=3, data from three independent biological replicates each with two to four technical replicates were plotted. *p < 0.05, **p < 0.01, ****p < 0.0001, two-way ANOVA followed by Tukey’s post hoc test). (d) Representative images of the western blotting analyses of SM22 and CNN1 in the WT and NOTCH1-KD groups exposed to rhythmic low or high strains for 24 hr. (e) Quantification of the total band densities for individual proteins normalized to the corresponding band density of β-actin (n = 4, **p < 0.01, ***p < 0.001, ****p < 0.0001, two-way ANOVA followed by Tukey’s post hoc test). All the data are expressed as the means ± SDs.
-
Figure 4—source data 1
The data for intensity of immunofluorescence staining of SM22 and CNN1.
- https://cdn.elifesciences.org/articles/69310/elife-69310-fig4-data1-v2.zip
-
Figure 4—source data 2
The original raw data for western blotting.
- https://cdn.elifesciences.org/articles/69310/elife-69310-fig4-data2-v2.zip
Figure 4—figure supplement 1
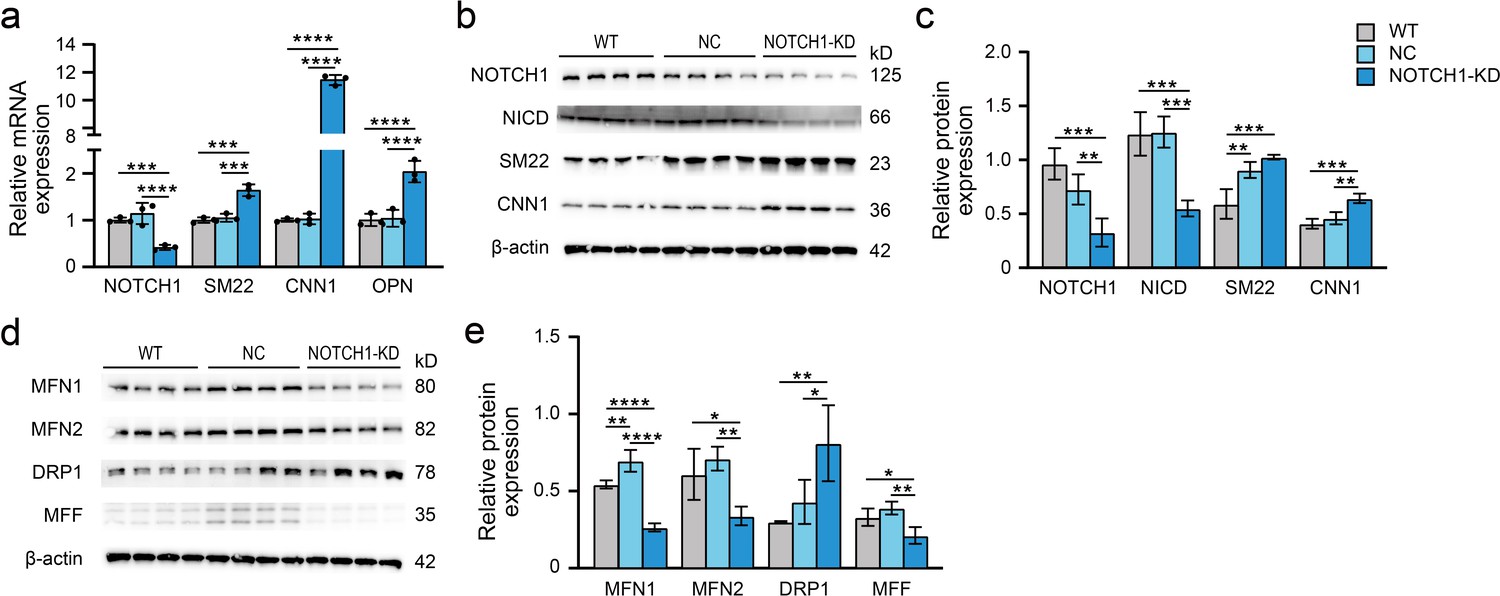
Alteration of NOTCH1 signaling, phenotype and mitochondrial dynamics in HAoSMCs after NOTCH1 shRNA transfection.
-
Figure 4—figure supplement 1—source data 1
The original raw data for western blotting.
- https://cdn.elifesciences.org/articles/69310/elife-69310-fig4-figsupp1-data1-v2.zip
Figure 5
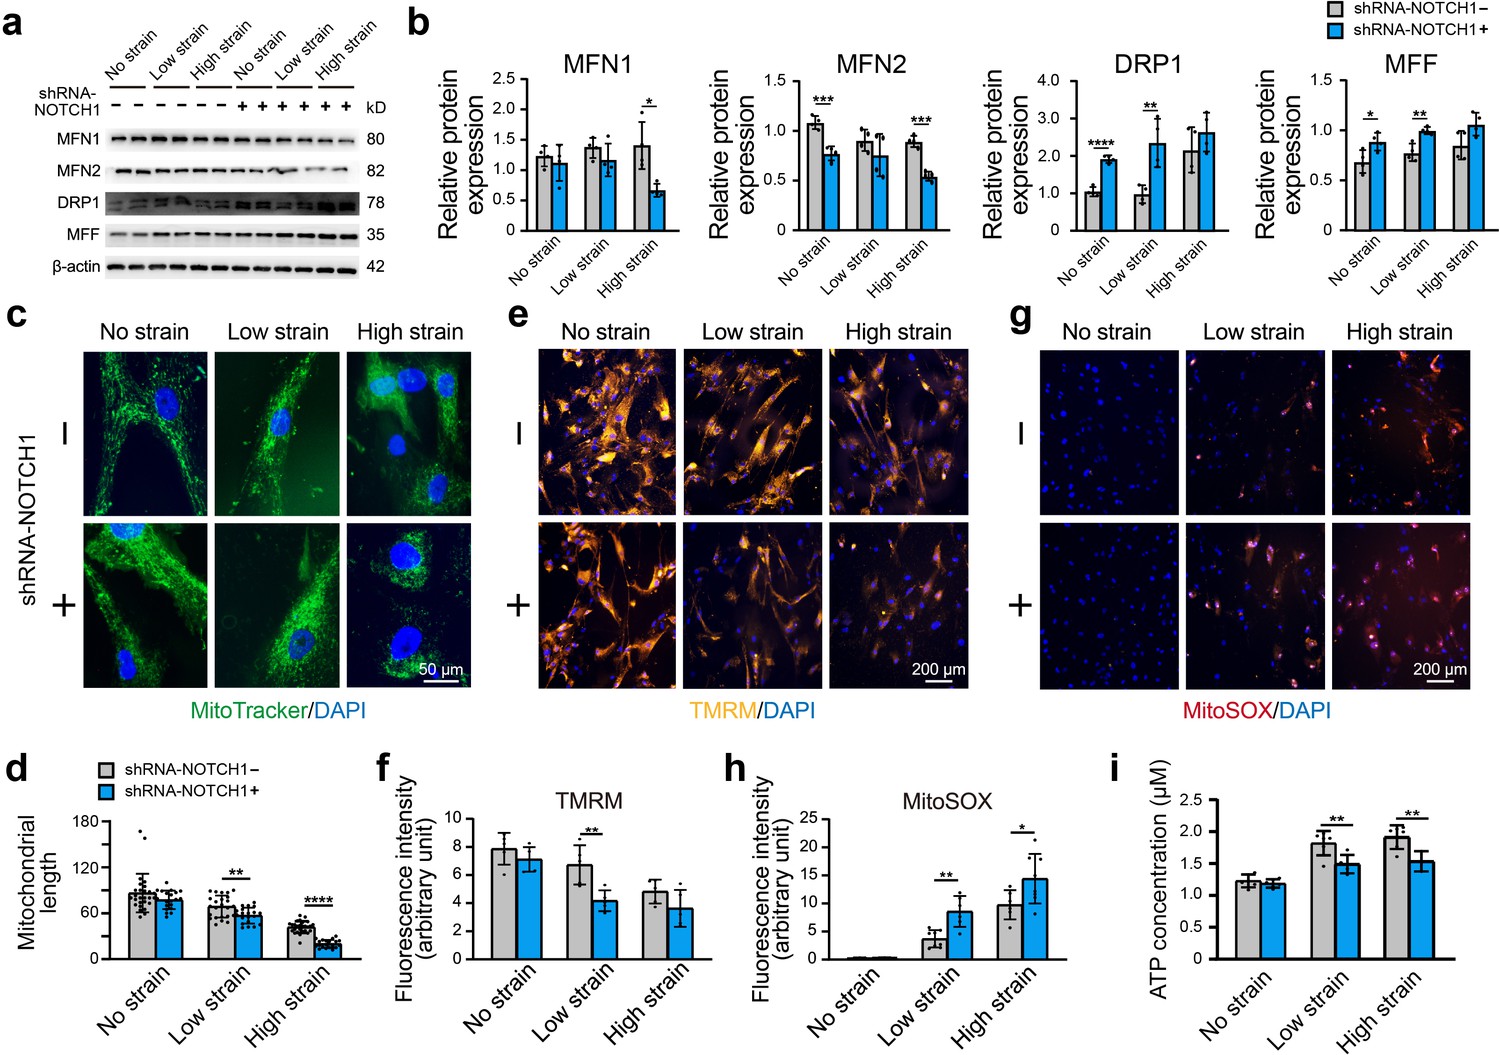
Effect of NOTCH1 insufficiency on mitochondrial dynamics and function in HAoSMCs.
(a) Representative images of the western blotting analyses of MFN1, MFN2, DRP1 and MFF expression in the WT and NOTCH1-KD groups under rhythmic low or high strain or static conditions. (b) Quantification of the total band densities for four individual proteins normalized to the corresponding band density of β-actin (n = 4, *p < 0.05, **p < 0.01, ***p < 0.001, ****p < 0.0001, two-way ANOVA followed by Tukey’s post hoc test). (c) MitoTracker staining images of the mitochondrial morphologies in the WT and NOTCH1-KD groups under rhythmic low or high strain or static conditions. The scale bar represents 50 μm. (d) Quantification of the mitochondria length (n = 3, **p < 0.01, ****p < 0.0001, two-way ANOVA followed by Tukey’s post hoc test). (e) TMRM staining of the mitochondrial membrane potentials in the WT and NOTCH1-KD groups under rhythmic low or high strain or static conditions. The scale bar represents 100 μm. (f) Quantification of the relative TMRM fluorescence intensity (**p < 0.01, two-way ANOVA followed by Tukey’s post hoc test). (g) MitoSOX staining of mitochondrial superoxide generation in the WT and NOTCH1-KD groups. The scale bar represents 100 μm. (h) Quantification of the relative MitoSOX fluorescence intensity (n=3, data from three independent biological replicates each with two to three technical replicates were plotted. *p < 0.05, **p < 0.01, two-way ANOVA followed by Tukey’s post hoc test). (i) The ATP concentrations were measured using an ATP Determination Kit (n=3, data from three independent biological replicates each with two technical replicates were plotted. **p < 0.01, two-way ANOVA followed by Tukey’s post hoc test). Quantitative measurements were calculated using ImageJ software. All the data are expressed as the means ± SDs.
-
Figure 5—source data 1
The quantification data for mitochondria length.
- https://cdn.elifesciences.org/articles/69310/elife-69310-fig5-data1-v2.zip
-
Figure 5—source data 2
The quantification data for relative TMRM fluorescence intensity.
- https://cdn.elifesciences.org/articles/69310/elife-69310-fig5-data2-v2.zip
-
Figure 5—source data 3
The quantification data for relative MitoSOX fluorescence intensity.
- https://cdn.elifesciences.org/articles/69310/elife-69310-fig5-data3-v2.zip
-
Figure 5—source data 4
The data for ATP concentrations.
- https://cdn.elifesciences.org/articles/69310/elife-69310-fig5-data4-v2.zip
-
Figure 5—source data 5
The original raw data for western blotting.
- https://cdn.elifesciences.org/articles/69310/elife-69310-fig5-data5-v2.zip
Figure 6 with 2 supplements
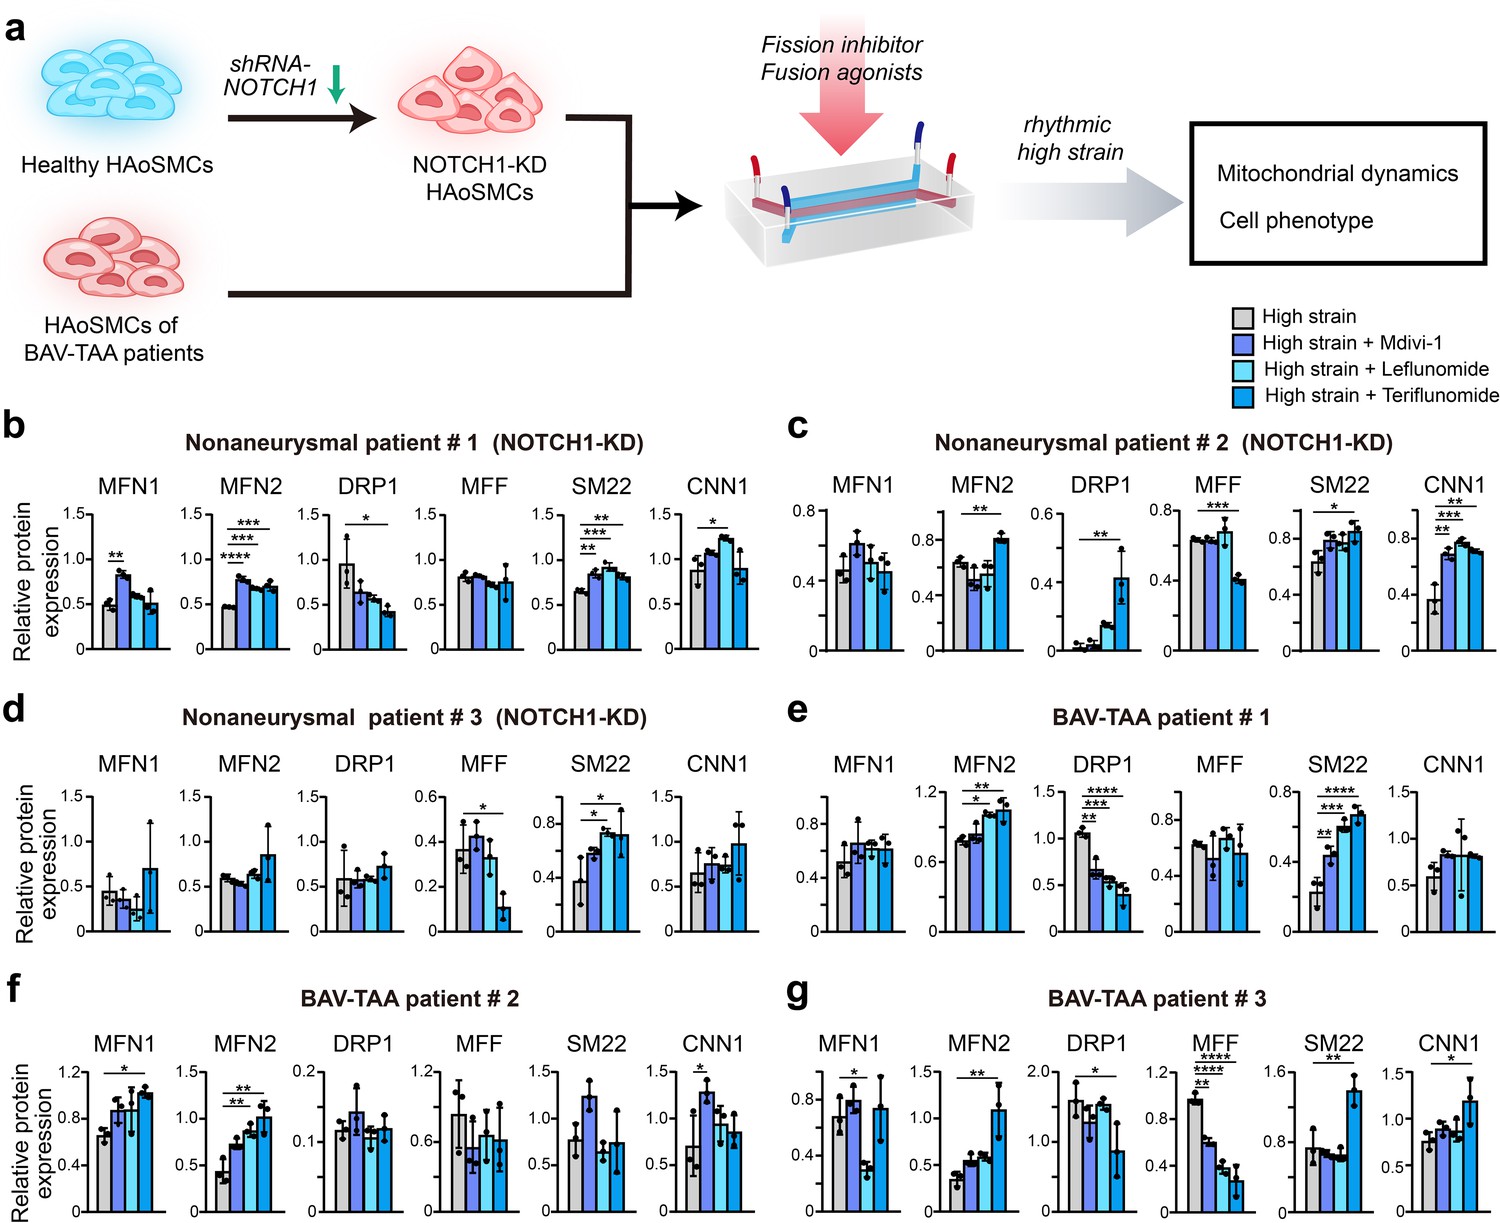
Screening of drugs that can rescue the cell phenotype and mitochondrial dynamics using the chip model.
(a) Schematic workflow of the experimental design. After treatment with treated with Mdivi-1, leflunomide and teriflunomide on the chip models with (b) a NOTCH1-knockdown HAoSMC cell line (CRL1999), (c) NOTCH1-knockdown p-HAoSMCs isolated from non-diseased aortic tissues, (d) NOTCH1-knockdown p-HAoSMCs purchased from ATCC, and (e–g) p-HAoSMCs isolated from aortic tissues from three patients with BAV-TAA, quantification of the total band densities of the mitochondria-related proteins MFN1, MFN2, DRP-1, and MFF and the contractile phenotype proteins SM22 and CNN1 were normalized to the corresponding band densities of β-actin. All the data are expressed as the means ± SDs. n = 3, *p < 0.05, **p < 0.01, ***p < 0.001, ****p < 0.0001, one-way ANOVA followed by Tukey’s post hoc test.
-
Figure 6—source data 1
The original raw data for western blotting.
- https://cdn.elifesciences.org/articles/69310/elife-69310-fig6-data1-v2.zip
Figure 6—figure supplement 1
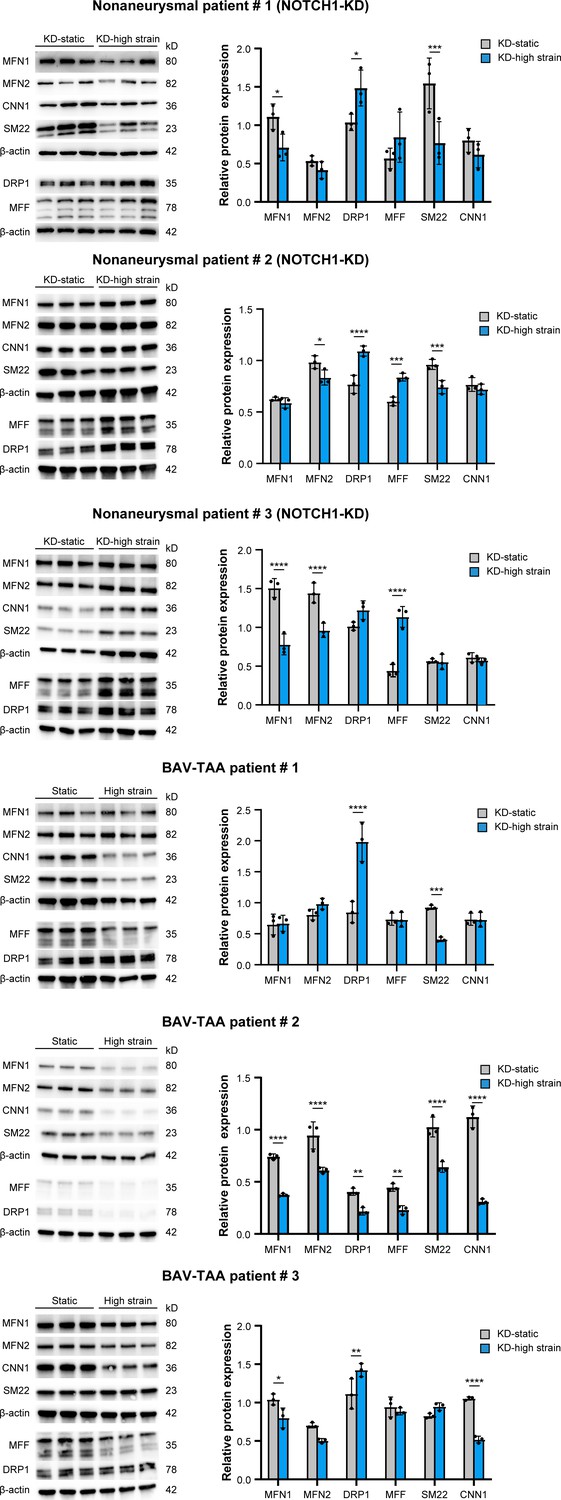
Expressions of phenotype and mitochondrial dynamics related proteins in NOTCH1-knockdown HAoSMCs and p-HAoSMCs from BAV-TAA aortic tissues.
-
Figure 6—figure supplement 1—source data 1
The original raw data for western blotting.
- https://cdn.elifesciences.org/articles/69310/elife-69310-fig6-figsupp1-data1-v2.zip
-
Figure 6—figure supplement 1—source data 2
The original raw data for western blotting.
- https://cdn.elifesciences.org/articles/69310/elife-69310-fig6-figsupp1-data2-v2.zip
Figure 6—figure supplement 2
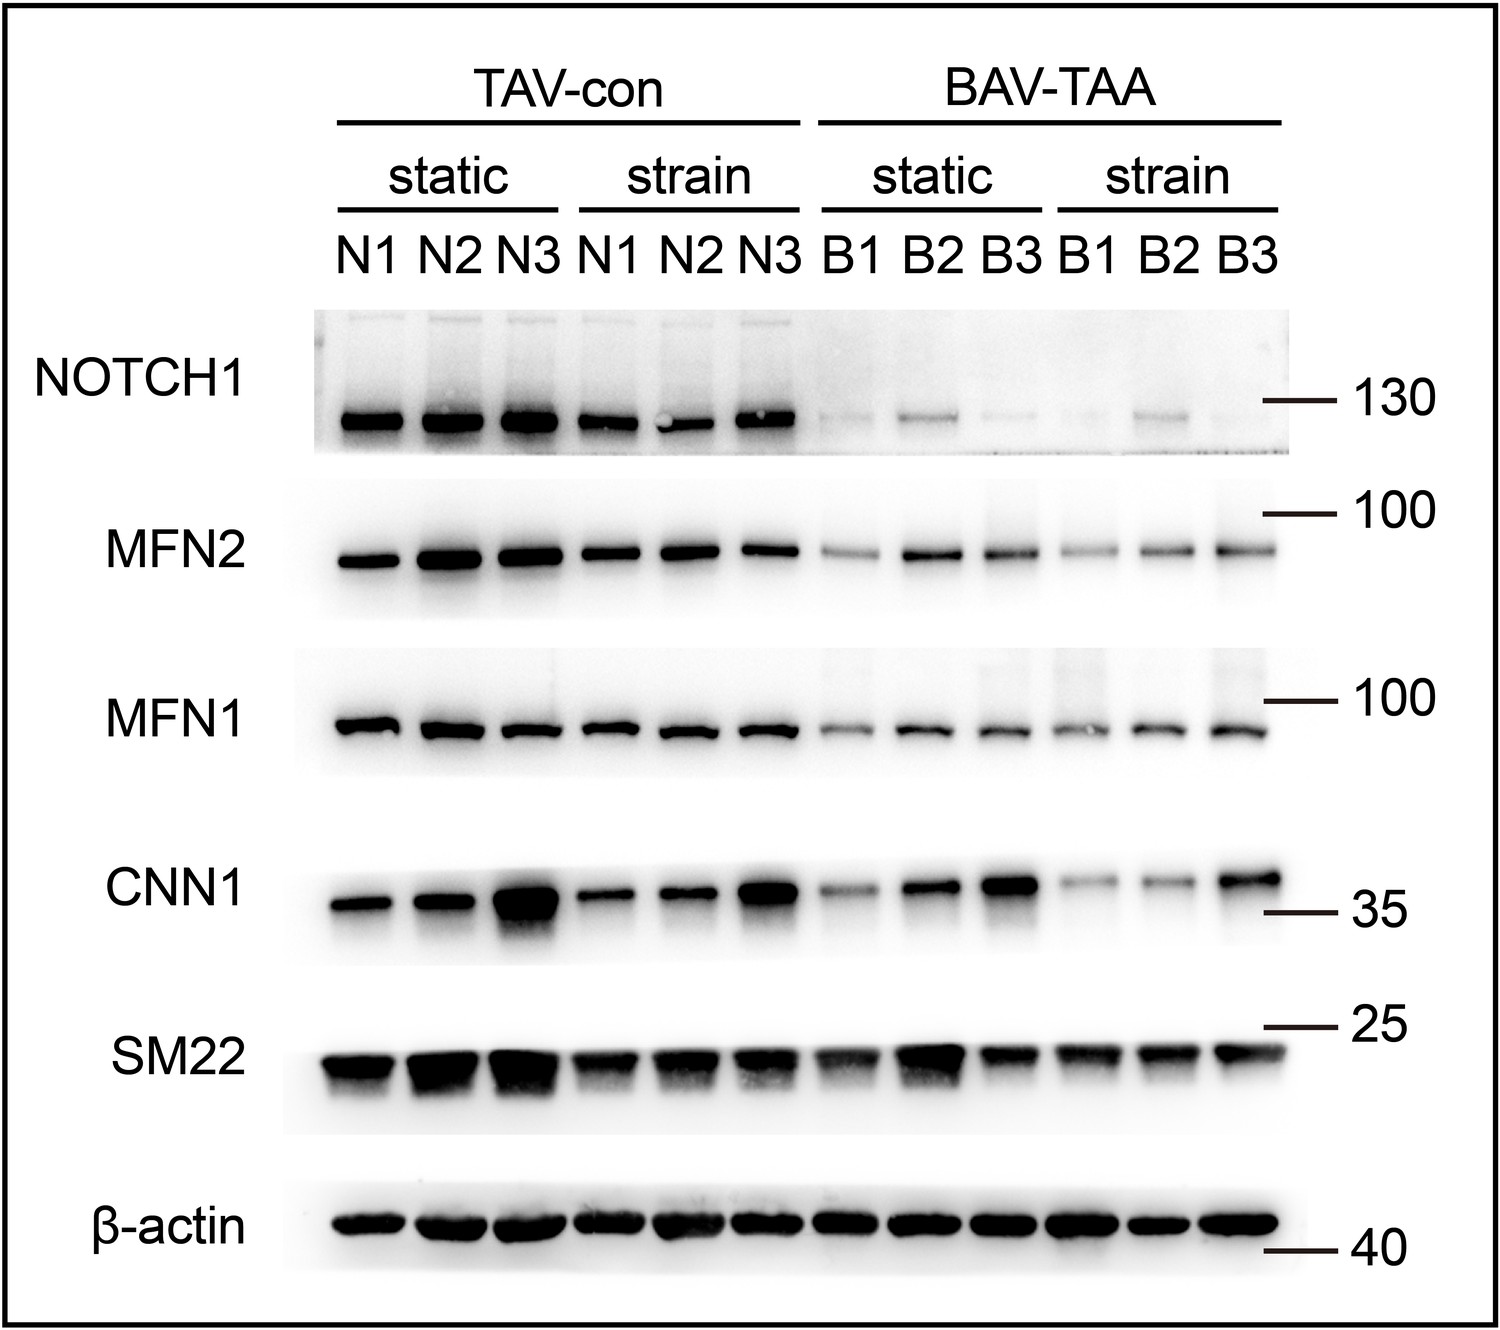
Expressions of NOTCH1, phenotype and mitochondrial dynamics related proteins in p-HAoSMCs from BAV-TAA aortic tissues.
Tables
Key resources table
| Reagent type (species) or resource | Designation | Source or reference | Identifiers | Additional information |
|---|---|---|---|---|
| Gene (Homo sapiens) | NOTCH1 | NCBI | ID: 4851 | |
| Cell line (Homo sapiens) | Human aortic smooth muscle cell line | ATCC | CRL1999, Lot Number: 70019189, RRID:CVCL_4009 | Female, 11 months old, Caucasian |
| Cell line (Homo sapiens) | Primary human aortic smooth muscle cells | ATCC | PCS100012 | Male, 29 years old, African American |
| Cell line (Homo sapiens) | Primary human aortic smooth muscle cells | This paper | Primary human aortic smooth muscle cells isolated from non-diseased and BAV-TAA patients (Asian). | |
| Transfected construct (human) | NOTCH1 targeted shRNA | GeneChem (Shao et al., 2015). | ||
| Biological sample (human) | Ascending aorta | Zhongshan Hospital, Fudan University | Ascending aortic tissues from non-diseased and BAV-TAA patients. | |
| Antibody | Anti-DRP1 (D6C7) (Rabbit monoclonal) | Cell Signaling Technology | Cat # 8570S, RRID:AB_10950498 | (1:1000), western blotting |
| Antibody | Anti-MFF (E5W4M) (Rabbit monoclonal) | Cell Signaling Technology | Cat # 84580, RRID:AB_2728769 | (1:1000), western blotting |
| Antibody | Anti-Mitofusin-1 (D6E2S) (Rabbit monoclonal) | Cell Signaling Technology | Cat # 14739S, RRID:AB_2744531 | (1:1000), western blotting |
| Antibody | Anti-Mitofusin-2 (D1E9) (Rabbit monoclonal) | Cell Signaling Technology | Cat # 11925, RRID:AB_2750893 | (1:1000), western blotting |
| Antibody | Anti- Notch1 [EP1238Y] (Rabbit monoclonal) | Abcam | Cat # ab52627, RRID:AB_881725 | (1:1000), western blotting |
| Antibody | Anti- TAGLN (SM22) (Rabbit polyclonal) | Abcam | Cat # ab14106, AB_443021 | (1:1000), western blotting, (1:300) for IF |
| Antibody | Anti- Calponin (CNN1) (Rabbit monoclonal) | Abcam | Cat # ab46794, RRID:AB_2291941 | (1:1000), western blotting, (1:300) for IF |
| Commercial assay or kit | Tetramethylrhodamine methyl ester (TMRM) | Thermo Fisher Scientific | Cat # I34361 | |
| Commercial assay or kit | MitoSOX | Thermo Fisher Scientific | Cat # M36008 | |
| Commercial assay or kit | MitoTracker | Thermo Fisher Scientific | Cat # M22426 | |
| Chemical compound, drug | Mdivi-1 | Sigma | Cat # M0199 | a final concentration of 30 μM. |
| Chemical compound, drug | Leflunomide | Sigma | Cat # L5025 | a final concentration of 75 μM. |
| Chemical compound, drug | Teriflunomide | Sigma | Cat # SML0936 | a final concentration of 75 μM. |
| Other | Commercial flexible PDMS membrane | Hangzhou Bald Advanced Materials | # KYQ-200 |
Additional files
-
Supplementary file 1
Supplementary information table 1.
(a) Clinical characteristics of the patients. (b) Primary antibodies used for western blotting and immunohistochemistry. (c) The enriched canonical pathways identified by ingenuity pathway analysis (IPA). (d) Differential protein expression of mitochondrial dysfunction and oxidative phosphorylation pathways between non-diseased and BAV-TAA tissues. (e) Clinical Characteristics of the p-HAoSMCs from BAV-TAA patients.
- https://cdn.elifesciences.org/articles/69310/elife-69310-supp1-v2.doc
-
Supplementary file 2
List of total differential protein expression between non-diseased and BAV-TAA tissues.
- https://cdn.elifesciences.org/articles/69310/elife-69310-supp2-v2.csv
-
Transparent reporting form
- https://cdn.elifesciences.org/articles/69310/elife-69310-transrepform-v2.docx
Download links
A two-part list of links to download the article, or parts of the article, in various formats.
Downloads (link to download the article as PDF)
Open citations (links to open the citations from this article in various online reference manager services)
Cite this article (links to download the citations from this article in formats compatible with various reference manager tools)
Aorta smooth muscle-on-a-chip reveals impaired mitochondrial dynamics as a therapeutic target for aortic aneurysm in bicuspid aortic valve disease
eLife 10:e69310.
https://doi.org/10.7554/eLife.69310


