Transcriptomics-informed large-scale cortical model captures topography of pharmacological neuroimaging effects of LSD
- Department of Psychiatry, Yale University, United States
- Pharmaco-Neuroimaging and Cognitive-Emotional Processing, Department of Psychiatry, Psychotherapy and Psychosomatics, University Hospital for Psychiatry Zurich, Switzerland
- Department of Psychiatry, Yale University School of Medicine, United States
- Interdepartmental Neuroscience Program, Yale University, United States
- Neuropsychopharmacology and Brain Imaging, Department of Psychiatry, Psychotherapy and Psychosomatics, University Hospital for Psychiatry Zurich, Switzerland
Figures
Figure 1 with 1 supplement

Schematic overview of the biophysical modeling framework.
(A) Each node in the large-scale model represents a cortical microcircuit comprised of recurrently coupled excitatory (E) and inhibitory (I) neuronal populations. The model includes one node for each of the 180 left-hemispheric parcels in the Human Connectome Project’s Multi-Modal Parcellation (MMP1.0). Nodes interact through structured long-range excitatory projections, the strengths of which are constrained by a diffusion magnetic resonance imaging (MRI)-derived structural connectivity (SC) matrix. (B) Simulated synaptic activity in each node is transformed to a simulated blood oxygen level-dependent (BOLD) signal using the Balloon-Windkessel model of the hemodynamic response. (C) Lysergic acid diethylamide (LSD)’s effect on cortical microcircuitry is modeled as a modulation of neural gain due to serotonin-2A (5-HT2A) receptor agonism by the LSD molecule. The degree to which neural gain is modulated within an area is scaled in proportion to the regional expression level of HTR2A, the gene which encodes the 5-HT2A receptor protein. Gain curves of the excitatory and inhibitory neuronal populations are modulated independently, permitting cell-type specific effects. (D) Global brain connectivity (GBC), a graph-theoretic functional measure, is dramatically altered following LSD administration. The functional MRI (fMRI)-derived map of the change in GBC (ΔGBC) under LSD, relative to placebo, specifies the target model output. To simulate brain function in the LSD and placebo drug conditions, we simulate GBC maps with and without gain modulation, respectively. We compute the difference between the model GBC maps to construct a simulated ΔGBC map. Quantitative comparisons between empirical and model ΔGBC maps determine how well the model captures the topography of LSD-induced functional disruptions.
Figure 1—figure supplement 1
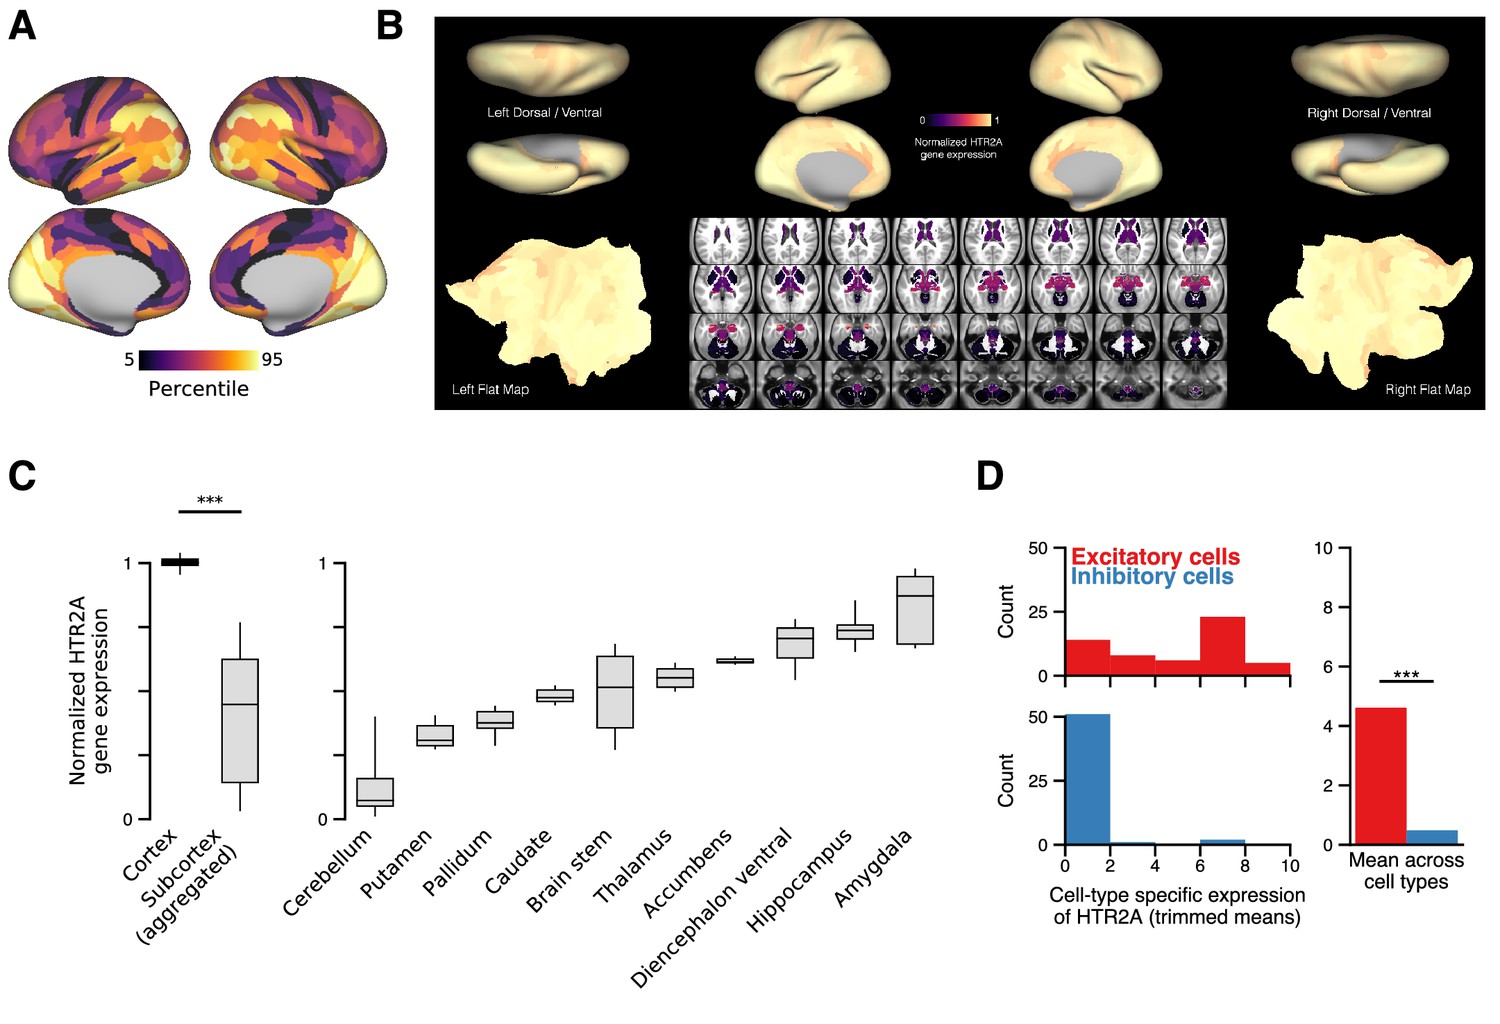
In the human brain, HTR2A is predominately expressed in cortical pyramidal neurons.
In the human brain, HTR2A is predominately expressed in cortical pyramidal neurons. (A) Cortical topography of the HTR2A expression map. (B) Whole-brain topography of the HTR2A expression map. For subcortex, we use the 358 subcortical parcels in the Cole-Anticevic Brain Network Parcellation (CAB-NP) (Ji et al., 2019). Expression levels are linearly rescaled such that the minimum value is zero, and the cortical parcel-wise average is one. The large difference between expression levels in cortex and subcortex is much greater than the variance across parcels within the cortex. Note that the Allen Human Brain Atlas has unilateral sampling of gene expression in the left hemisphere (Hawrylycz et al., 2015), and therefore the map is made bilaterally symmetric at the parcel level for cortex and coordinate level for subcortex. Gene expression mapping follows the method of Burt et al., 2018. (C) HTR2A expression levels grouped by gross anatomical structure. Box plots mark the median and inner quartile ranges for expression levels across parcels within each anatomical structure, and whiskers indicate the 95% confidence interval. ‘Subcortex (aggregated)’ comprises parcel expression levels for all subcortical structures (i.e., all 358 subcortical parcels). Expression of HTR2A is significantly higher in cortex than in subcortex (; p < machine precision; Wilcoxon signed-rank test). (D) The distribution of HTR2A expression levels across excitatory (red) and inhibitory (blue) human cortical cell types. HTR2A is significantly more expressed in excitatory neurons than in inhibitory neurons (W = 141,943; p < machine precision; Wilcoxon signed-rank test).
Figure 2 with 1 supplement
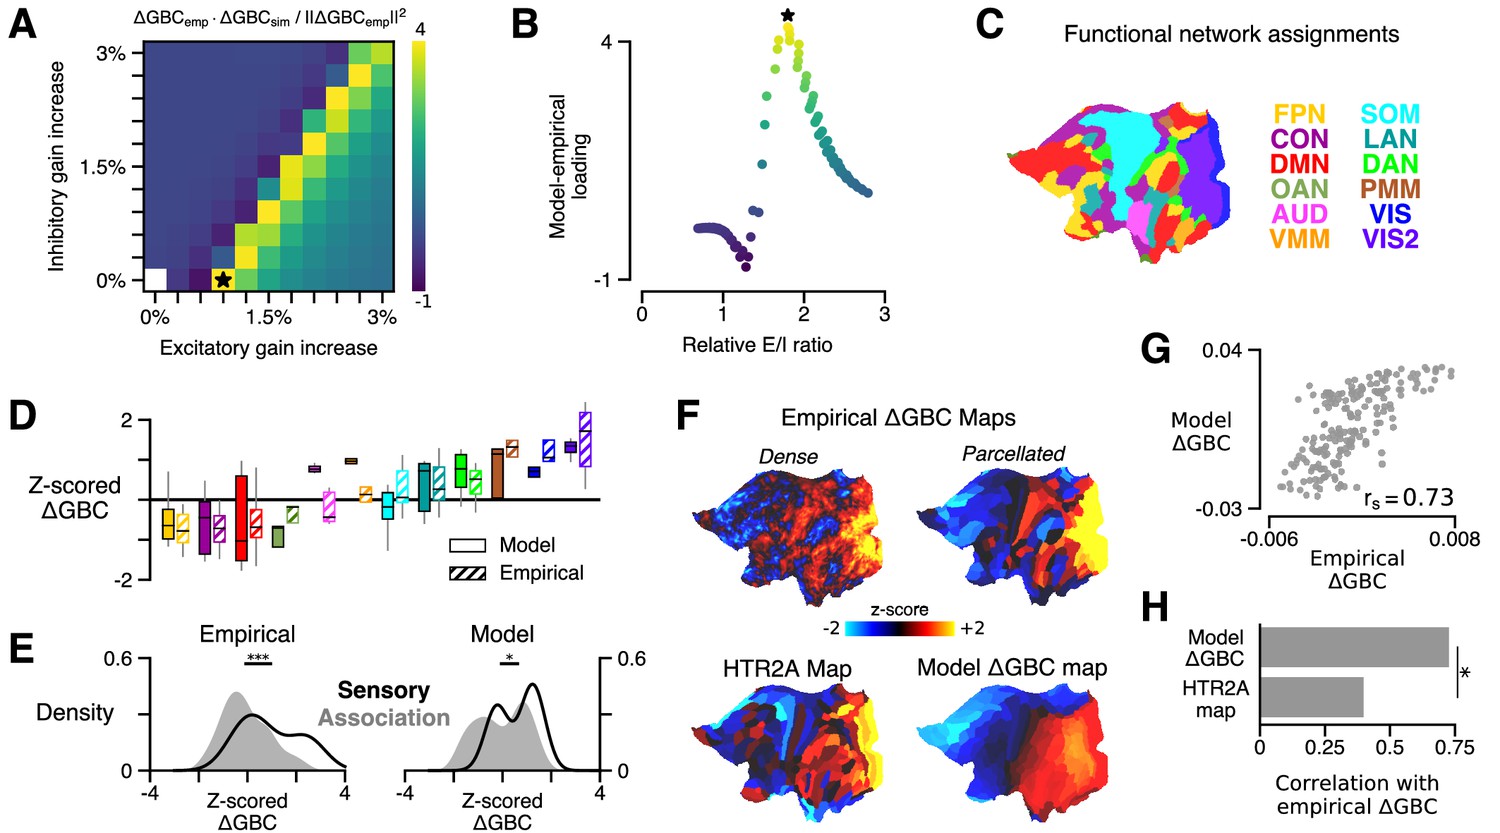
HTR2A-mediated excitatory gain modulation captures effects of lysergic acid diethylamide (LSD) on human cortical global brain connectivity (GBC) topography.
(A) Two-dimensional grid search over the two free model parameters. Parameters govern the gain modulation of inhibitory and excitatory neuronal populations in the model. Model-empirical loading – the quantity shown in the heatmap – is defined as the dot product between the empirical change in GBC (ΔGBC) map and a model ΔGBC map, normalized by the squared norm of the empirical ΔGBC map. Loading is maximized for the combination of parameters indicated by the black star. (B) At each point on the grid (i.e., for each combination of gain-modulatory parameters), we computed the excitatory-to-inhibitory (E/I) firing rate ratio, expressed in terms of its unperturbed value. This amounts to computing , where is the E/I ratio in the model with gain modulation, and denotes the E/I ratio in the model without gain modulation. E/I ratio is defined in the model as the ratio of the mean excitatory firing rate (computed across nodes) to the mean inhibitory firing rate. (C) Functional network assignments for each cortical parcel are determined by the Cole-Anticevic Brain Network Parcellation (CAB-NP): ventral multi-modal (VMM), language (LAN), dorsal attention (DAN), posterior multi-modal (PMM), primary visual (VIS), secondary visual (VIS2), frontoparietal (FPN), cingulo-opercular (CON), default mode (DMN), orbito-affective (OAN), auditory (AUD), and somatomotor (SOM) networks. Network colors mirror (Ji et al., 2019). (D) Functional network-level comparisons between simulated (solid) and empirical (striped) z-scored ΔGBC map values. Box plots mark the median and inner quartile ranges for parcels in each network, and whiskers indicate the 95% confidence interval. (E) Distributions of z-scored ΔGBC map values across cortical parcels in primary sensory networks (AUD, VIS, VIS2, SOM; black line with no fill) and association networks (gray fill with no line). Endpoints of the horizontal black lines (top) correspond to the distributions’ means. Distributions significantly differ empirically (p < 10−4; spatial autocorrelation-preserving surrogate map test) and in the model (p = 0.02; spatial autocorrelation-preserving surrogate map test). (F) Spatial topographies of the dense and parcellated empirical ΔGBC maps; the strongest-loading model ΔGBC map; and the HTR2A gene expression map. Maps are portrayed on flattened (unfolded) representations of the cortical surface. (G) Scatter plot illustrating the parcel-wise relationship between the strongest-loading model ΔGBC map and the empirical ΔGBC map. (H) Spearman rank correlations between the empirical ΔGBC map and: (i) the strongest-loading model ΔGBC map; and (ii) the HTR2A expression map. Empirical ΔGBC topography is better explained by the dynamical model than by the HTR2A map (p < 0.05; test for dependent correlations).
Figure 2—figure supplement 1
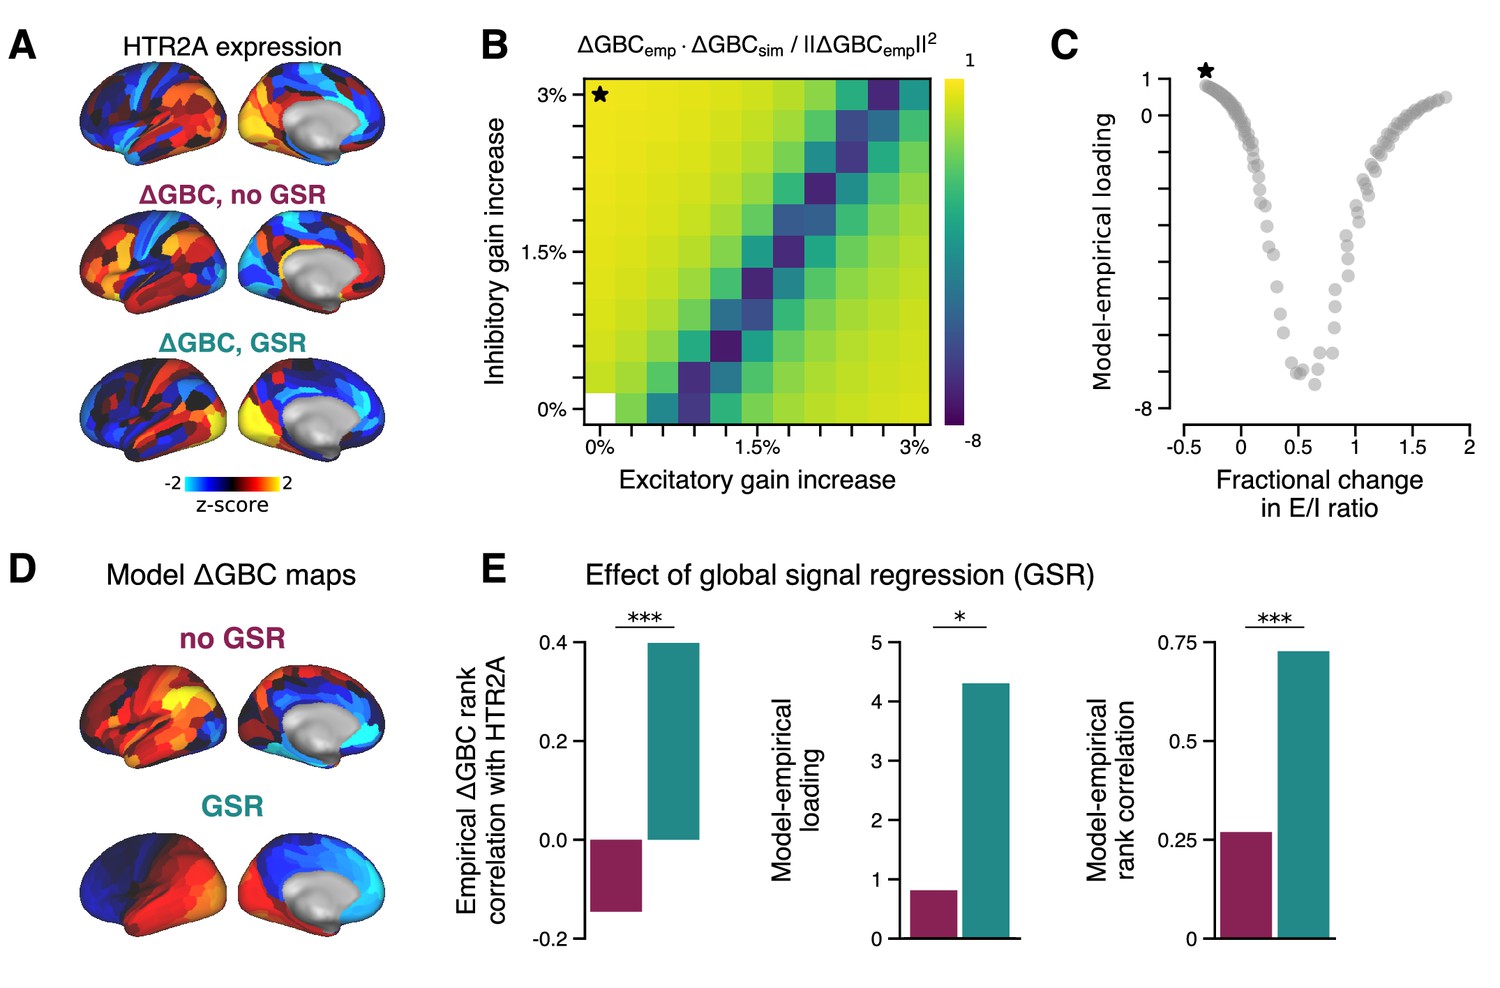
Effect of global signal regression (GSR) on model performance.
Effect of GSR on model performance. (A) The HTR2A gene expression map is significantly correlated with the empirical GS-regressed change in global brain connectivity (ΔGBC) map (; p < 10−5; Spearman rank correlation). In contrast, the empirical ΔGBC map constructed without GSR correlates only very weakly, and negatively, with the HTR2A map (; p = 0.05). (B) Model-empirical loadings for the empirical ΔGBC map with no GSR (Figure 2A). Black star indicates model parameters which yielded maximal loading. (C) Model-empirical loading as a function of fractional change in model excitatory-to-inhibitory (E/I) ratio following gain modulation (related to Figure 2B). (D) The strongest loading model ΔGBC maps, with and without GSR. (E) Performing GSR significantly improves: the Spearman rank correlation between the HTR2A expression map and the empirical ΔGBC map (left; p < 10−5; test for difference between dependent correlations); maximal model-empirical loading (center; p = 0.03; spatial autocorrelation-preserving surrogate map test); and the Spearman rank correlation between the model and empirical ΔGBC maps (right; p < 10−5; test for difference between dependent correlations). Purple, without GSR; cyan, with GSR.
Figure 3
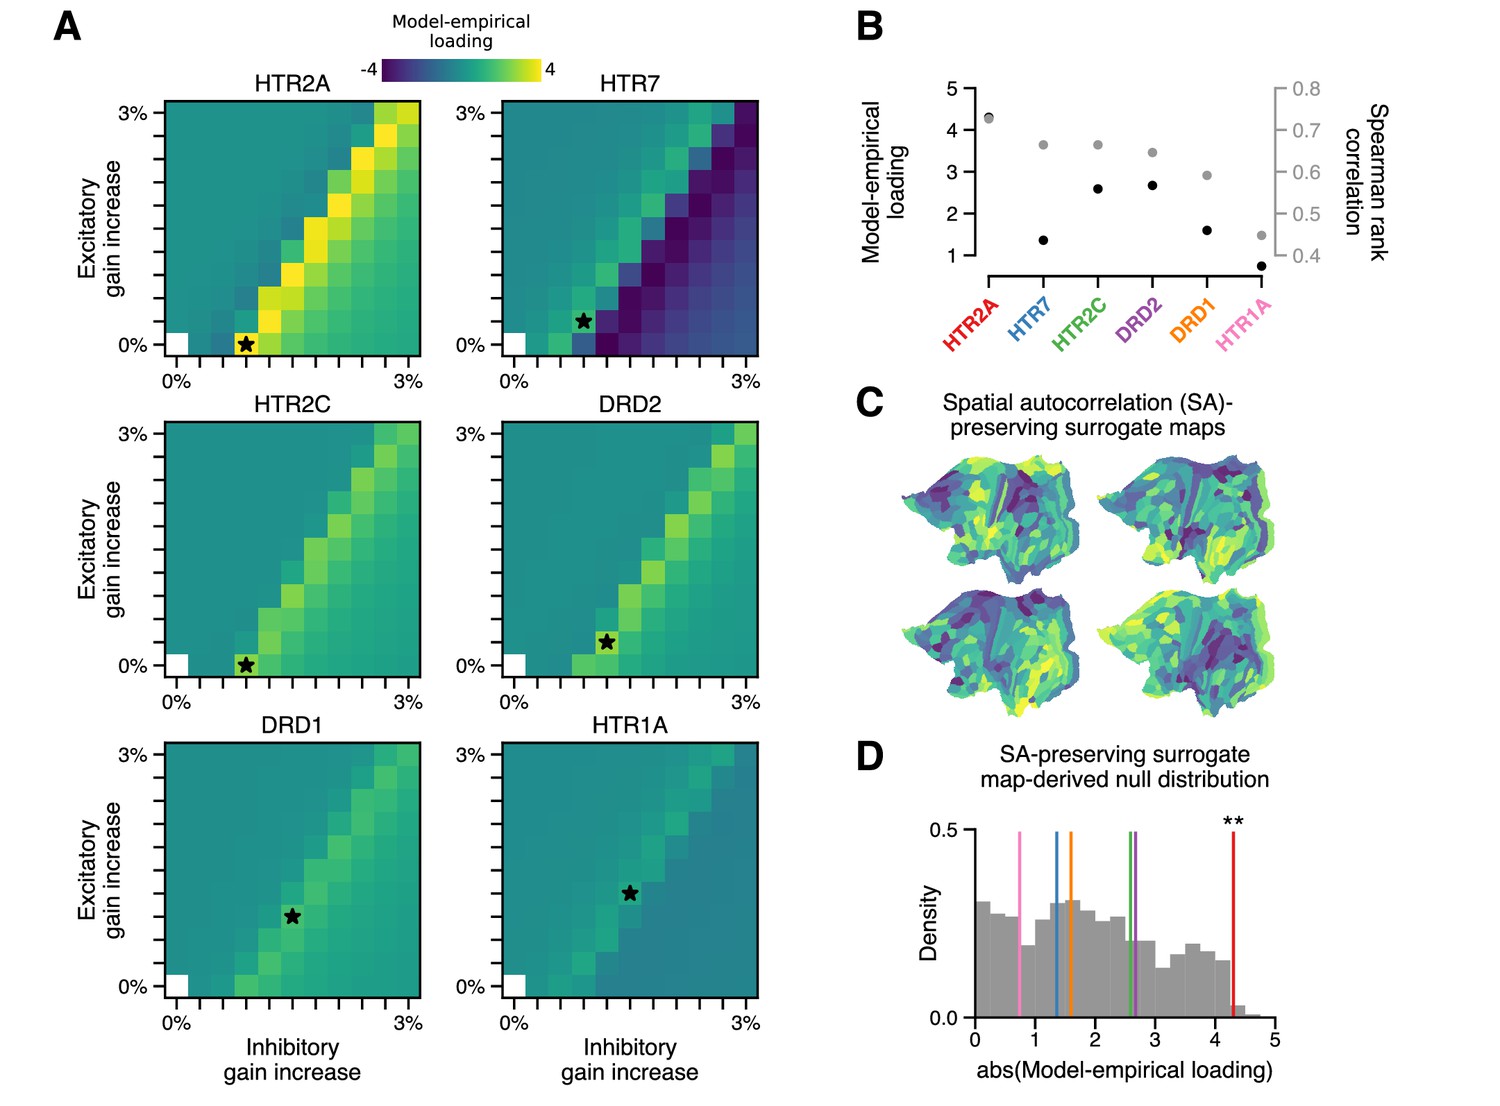
The topography of lysergic acid diethylamide (LSD)-induced cortical global brain connectivity (GBC) changes is specifically attributable to the spatial distribution of 5-HT2A receptors, as indexed by the HTR2A map.
(A) Two-dimensional grid searches over free model parameters. For each heatmap, gain modulation is scaled in proportion to regional expression levels of different serotonergic (HTR) and dopaminergic (DRD) receptor-encoding genes, each of which is agonized by LSD. Black stars indicate maximal model-empirical loadings for each heatmap. (B) Model-empirical loading (left axis) and Spearman rank correlation (right axis) are greatest when gain is modulated by regional expression levels of HTR2A. Model change in GBC (ΔGBC) maps used in this analysis were generated using the gain-modulatory parameters that maximized model-empirical loadings, as indicated on each heatmap. (C,D) Following Burt et al., 2020, we generate surrogate brain maps with randomized spatial topographies that, by construction, exhibit spatial autocorrelation that has been matched to that of the HTR2A map. These spatial autocorrelation-preserving surrogate brain maps are used to construct a null distribution of the expected magnitude of model-empirical loading under random chance. Each sample in the null distribution (gray; N = 1000) was constructed by modulating gain in proportion to the values in a random spatial autocorrelation-preserving surrogate brain map, then re-computing model-empirical loading. Colored lines correspond to the different receptor-encoding genes (as reported in panel B). ** p < 0.01.
Figure 4 with 1 supplement
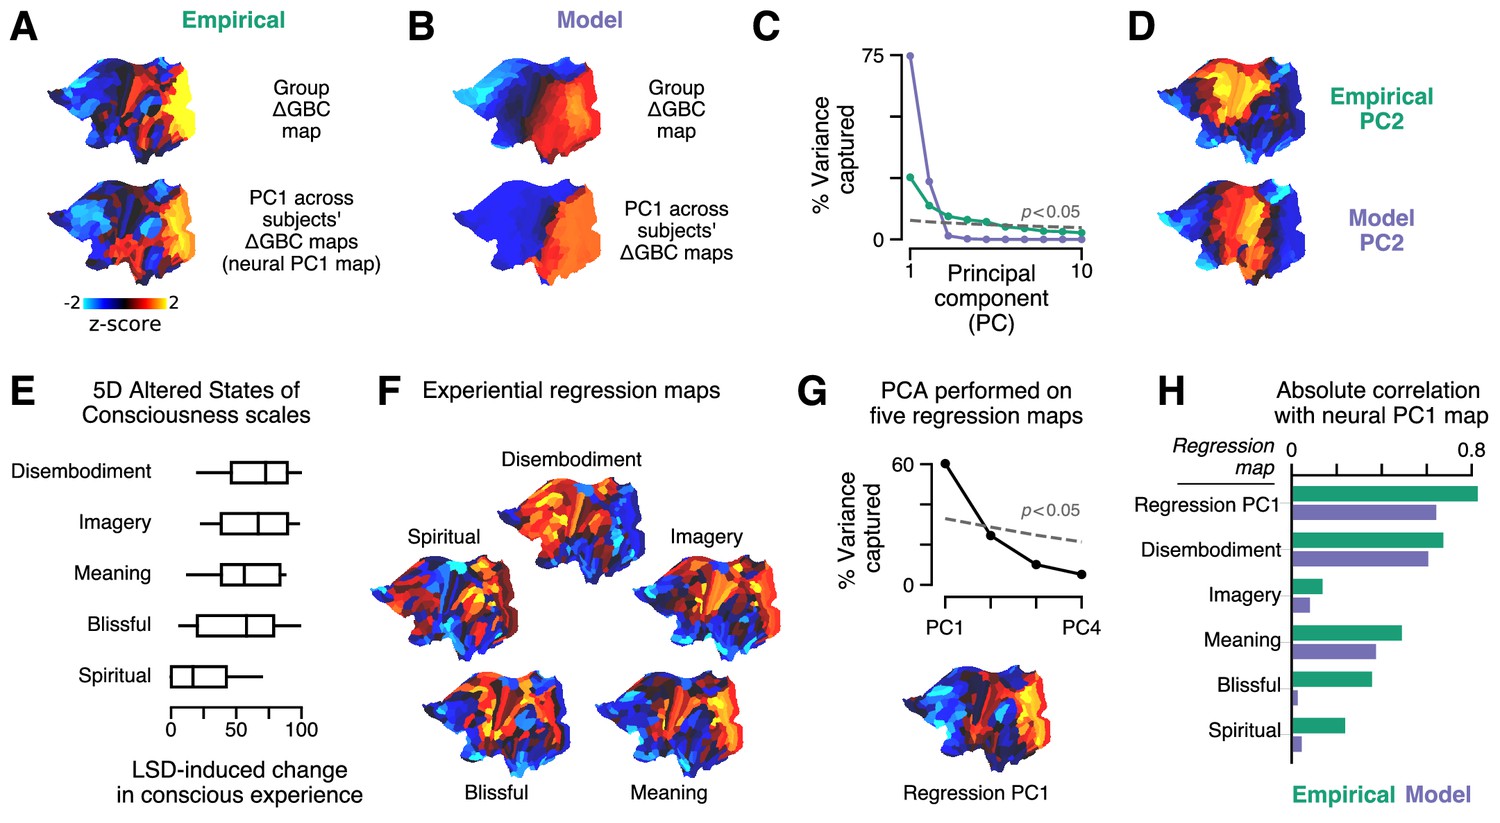
Model fits to individual subjects capture experientially relevant modes of neural variation.
(A–D) Characteristic patterns of inter-individual variability in cortical change in global brain connectivity (ΔGBC) topography. (A) The empirical group-averaged ΔGBC map (top), and the leading principal component (PC1) computed across 24 subjects’ empirical ΔGBC maps (bottom). (B) The model ΔGBC map fit to the group-averaged data (top), and the PC1 computed across 24 subjects’ model ΔGBC maps (bottom). (C) Empirical (green) and model (purple) PC variance spectra. The first five empirical PCs and the first two model PCs survived permutation testing (p < 0.05, 1000 permutations). (D) Empirical and model PC2 maps. (E–H) Linking individual differences in ΔGBC to individual differences in lysergic acid diethylamide (LSD)-induced alterations of consciousness. (E) Changes in subjects’ conscious experience under LSD relative to placebo as determined by the five-dimensional (5D) altered states of consciousness (5D-ASC) questionnaire: disembodiment, elementary imagery, changed meaning of percepts, blissful state, and spiritual experience. Box plots mark the median and inner quartile ranges for each scale, and whiskers indicate the 95% confidence interval. Positive values indicate an increase under lysergic acid diethylamide (LSD). (F) Experiential regression maps are constructed by performing linear regressions, across subjects, between changes in an experiential score (the target variable) and changes in GBC within a single parcel (the predictor variable). For each 5D-ASC scale, we performed 180 regressions – one per parcel – across 24 subjects. Brain maps illustrate the first-order regression coefficients. Experiential regression maps therefore illustrate patterns of GBC variation that predict experiential variation. (G) We performed principal components analysis (PCA) on the five experiential regression maps to derive experiential regression map principal components (PCs). Top: variance spectrum for the experiential regression map PCs. PC1 survives permutation testing (p < 0.05, 1000 permutations). Bottom: experiential regression map PC1, which captures 60% of variance across experiential regression maps. (H) Spearman rank correlations between experiential regression maps and neural PC1 maps.
Figure 4—figure supplement 1
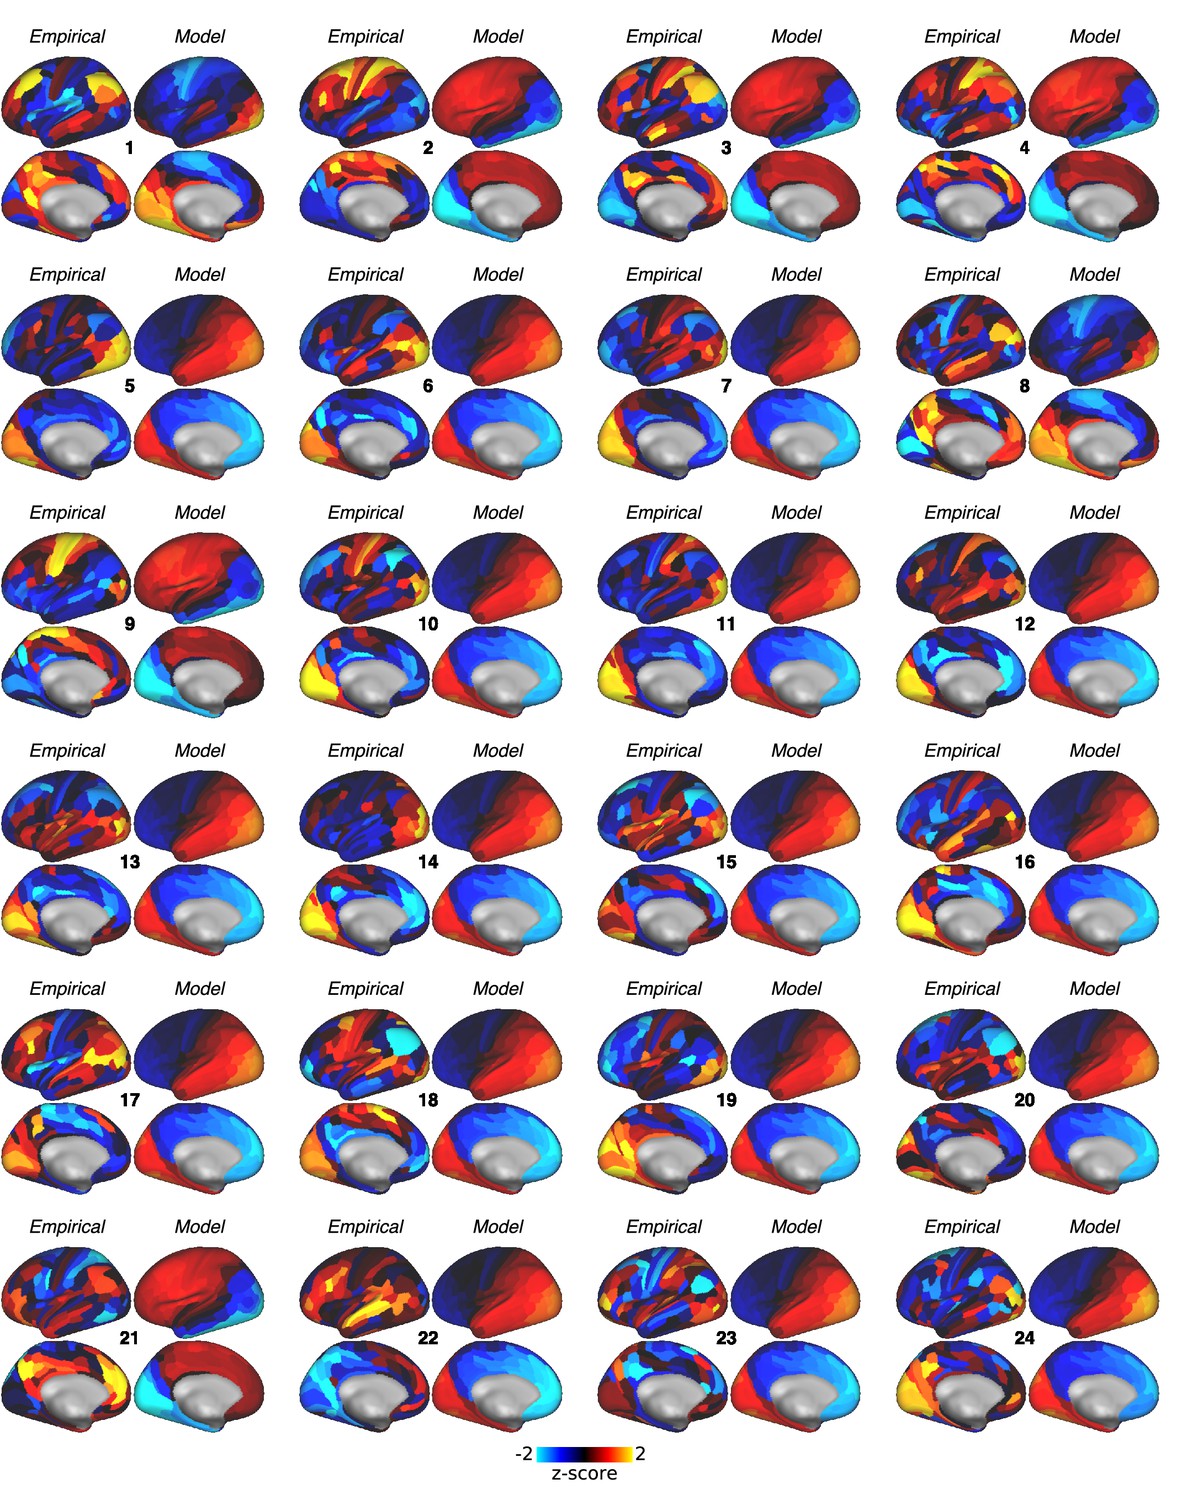
Empirical change in global brain connectivity (ΔGBC) maps for each subject.
Empirical ΔGBC maps for each subject. For each subject, we repeated the model-fitting procedure that was used for the group-level analysis: the global coupling parameter was first set to the value that maximized the Spearman rank correlation between off-diagonal elements of the model functional connectivity (FC) matrix and empirical subject-specific placebo FC matrix. Gain-modulatory parameters were then set to the values that maximized model-empirical loading (computed using the subject-specific empirical map).
Tables
Table 1
Fixed parameter values used in synaptic and hemodynamic equations.
| Excitatory populations | Inhibitory populations | |
|---|---|---|
| Synaptic model parameters | ||
| 0.382 nA | – | |
| 0.15 nA | – | |
| γ | 0.641 | – |
| 1.0 | – | |
| 0.1 s | – | |
| 310 nC−1 | – | |
| 125 Hz | – | |
| 0.16 s | – | |
| – | 0.7 | |
| – | 0.01 s | |
| – | 615 nC−1 | |
| – | 177 Hz | |
| – | 0.087 s | |
| Hemodynamic model parameters | ||
| ρ | 0.34 | – |
| α | 0.32 | – |
| V0 | 0.02 | – |
| γ | 0.41 s−1 | – |
| κ | 0.65 s−1 | – |
| k1 | 3.72 | – |
| k2 | 0.53 | – |
| k3 | 0.53 | – |
Additional files
Download links
A two-part list of links to download the article, or parts of the article, in various formats.
Downloads (link to download the article as PDF)
Open citations (links to open the citations from this article in various online reference manager services)
Cite this article (links to download the citations from this article in formats compatible with various reference manager tools)
Transcriptomics-informed large-scale cortical model captures topography of pharmacological neuroimaging effects of LSD
eLife 10:e69320.
https://doi.org/10.7554/eLife.69320


