Tracking excess mortality across countries during the COVID-19 pandemic with the World Mortality Dataset
- Hebrew University, Israel
- Institute for Ophthalmic Research, University of Tübingen, Germany
Figures
Figure 1
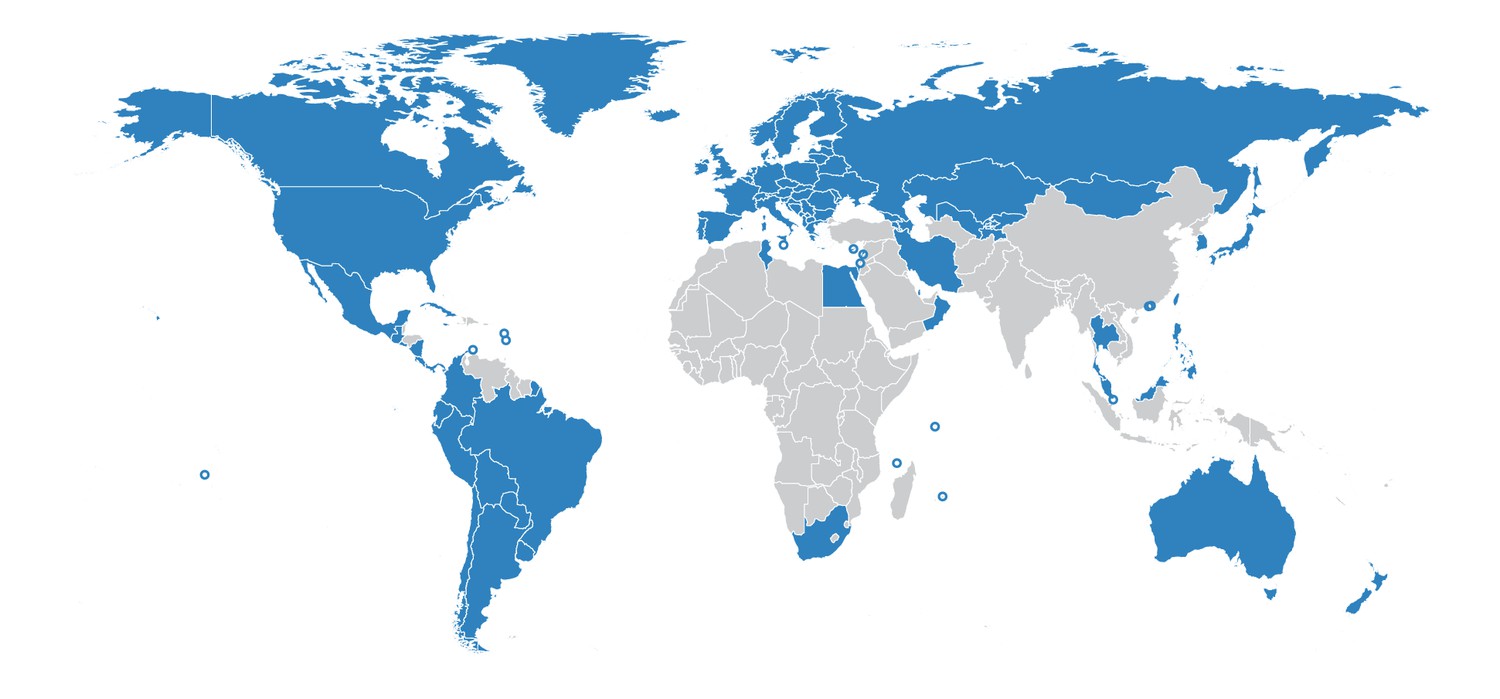
Countries in the World Mortality Dataset are shown in blue.
Small countries and territories are shown with circles.
Figure 2 with 1 supplement
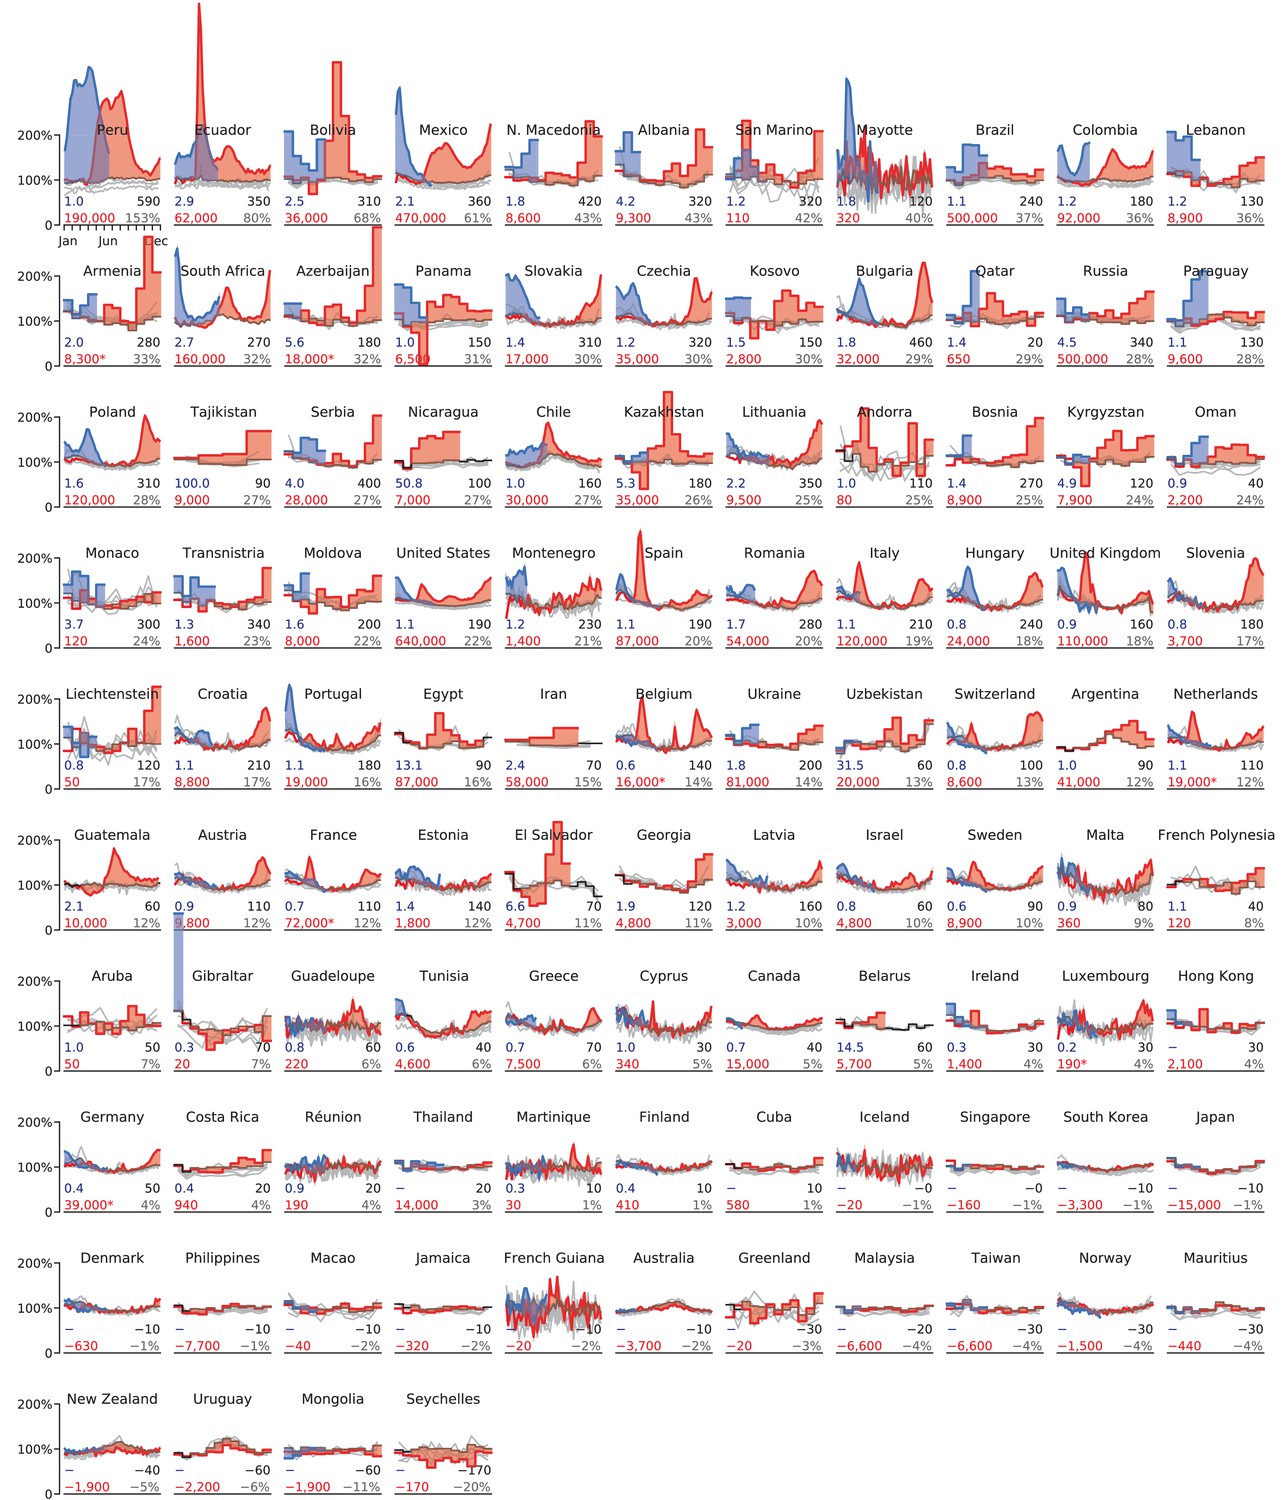
Excess mortality time series.
Each subplot shows baseline mortality (black), mortality in 2015–2019 (gray), in 2020 (red) and in 2021 (blue). Excess mortality is shown in red/blue shading. The numbers in each subplot are: total excess mortality (red), excess mortality per 100,000 population (black), excess mortality as a percentage of annual baseline mortality (gray), and undercount ratio of COVID-19 deaths (blue). See text for the exact definitions. All numbers were rounded to two significant digits; numbers below 100 to one significant digit. The -axis in each subplot starts at 0 and goes until 200% where 100% corresponds to the average baseline mortality. The -axis covers the entire year. Asterisks mark excess mortality estimates that were downwards corrected (see Materials and methods). Countries are sorted by the excess mortality as a percentage of annual baseline mortality (gray number). Undercount estimates are not shown for countries with negative total excess deaths and for selected countries where excess deaths were likely not related to the COVID-19 pandemic (Hong Kong, Thailand, Cuba); see Materials and methods.
Figure 2—figure supplement 1

Excess mortality time series, normalized per population size.
The figure is fully analogous to Figure 2, but countries are sorted by the excess mortality per 100,000 population, and all shown curves are normalized to yield mortality per 1000 people per year (each data point shows what mortality per 1000 people per year would be if the death rate stayed at the same level throughout the year).
Figure 3 with 1 supplement
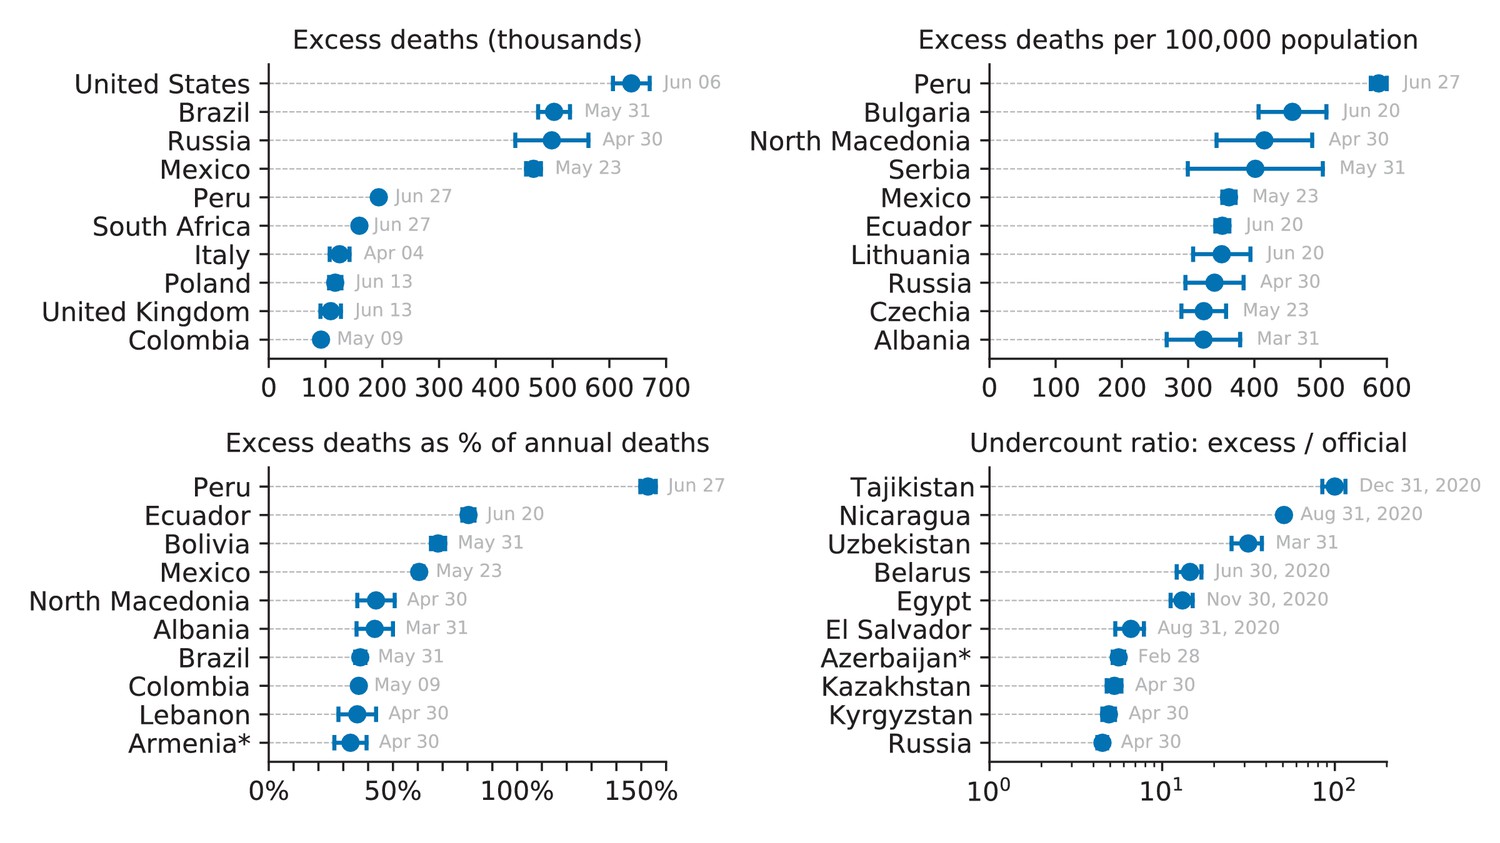
Top 10 countries in the World Mortality Dataset by various excess mortality measures.
Each subplot shows the top 10 countries for each of our four excess mortality measures: total number of excess deaths; excess deaths per 100,000 population; excess deaths as a percentage of baseline annual mortality; undercount ratio (ratio of excess deaths to reported COVID-19 deaths by the same date). Error bars denote 95% confidence intervals corresponding to the uncertainty of the excess deaths estimate. Countries with population below 500,000 are not shown. Different countries have different reporting lags, so the estimates shown here correspond to different time points, as indicated. Excess mortality estimates in Armenia and Azerbaijan were downwards corrected by 4000 to account for the war casualties (see Materials and methods).
Figure 3—figure supplement 1
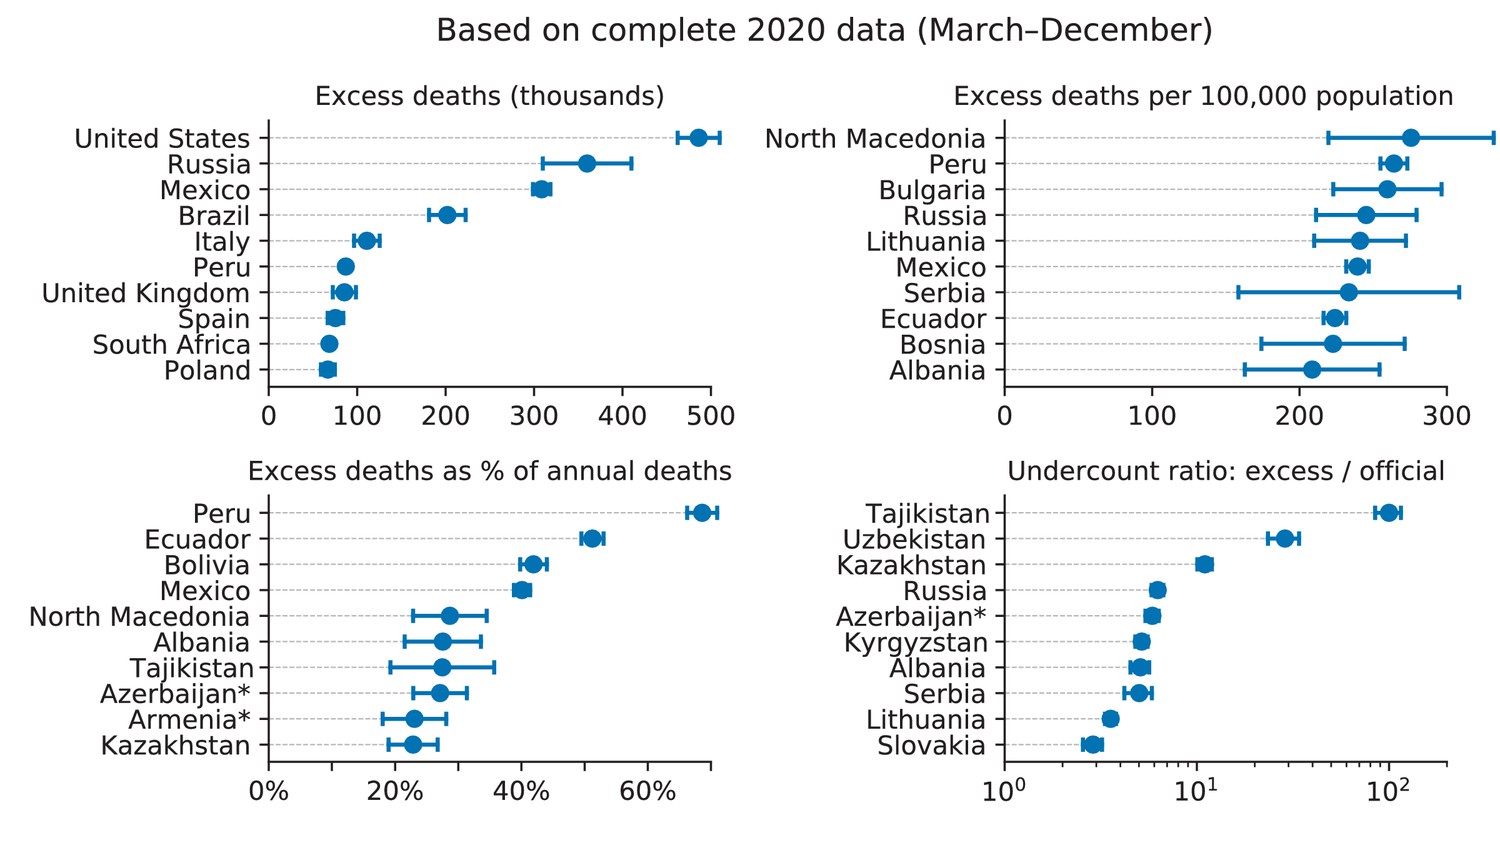
Top 10 countries in the World Mortality Dataset by various excess mortality measures by the end of 2020.
Each subplot shows the top 10 countries for each of our four excess mortality measures: total number of excess deaths; excess deaths per 100,000 population; excess deaths as a percentage of baseline annual mortality; undercount ratio (ratio of excess deaths to reported COVID-19 deaths by the same date). Error bars denote 95% confidence intervals corresponding to the uncertainty of the excess deaths estimate. Countries with population below 500,000 are not shown. Excess mortality estimates in Armenia and Azerbaijan were downwards corrected by 4000 to account for the war casualties (see Materials and mthods).
Figure 4
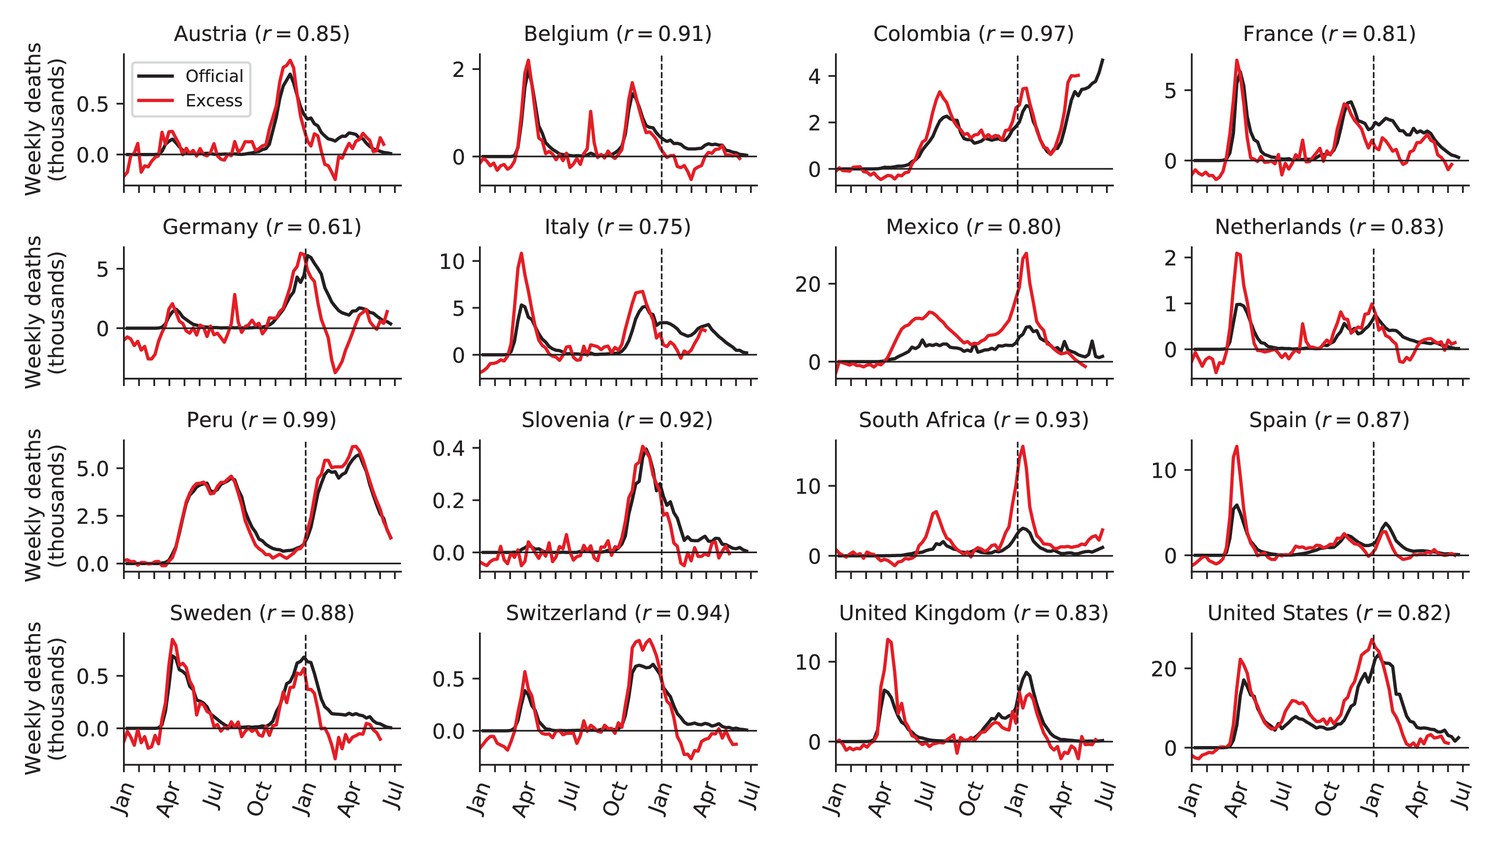
Relation between weekly excess deaths and weekly reported COVID-19 deaths.
Sixteen selected countries are shown together with the Pearson correlation coefficient () between the two time series, starting from week 10 of 2020. Note the peak in excess mortality (but not in the reported COVID-19 deaths) associated with the August 2020 heat wave in Belgium, France, Germany, and Netherlands.
Tables
Table 1
Excess mortality metrics for all countries in the dataset.
Abbreviations: ‘w’ – weekly data, ‘m’ – monthly data, ‘q’ – quarterly data. All numbers were rounded to two significant digits; numbers below 100 — to one significant digit. See text for the exact definitions of all reported metrics. ‘Official’ means the official daily reported number of COVID-19 deaths. Undercount estimates are not shown for countries with negative total excess deaths and for selected countries where excess deaths were likely not related to the COVID-19 pandemic (Hong Kong, Thailand, Cuba); see Materials and methods.
| Country | Data until | Type | Official | Excess | std | z | Undercount | Per 100k | Increase |
|---|---|---|---|---|---|---|---|---|---|
| Albania | Mar 31, 2021 | m | 2,200 | 9,300 | ±810 | 11.4 | 4.2 | 320 | 43 |
| Andorra | Dec 31, 2020 | m | 80 | 80 | ±30 | 3.1 | 1.0 | 110 | 25 |
| Argentina | Dec 31, 2020 | m | 43,000 | 41,000 | ±nan | nan | 1.0 | 90 | 12 |
| Armenia | Apr 30, 2021 | m | 4,100 | 8,300 | ±840 | 10.0 | 2.0 | 280 | 33 |
| Aruba | Dec 31, 2020 | m | 50 | 50 | ±30 | 1.5 | 1.0 | 50 | 7 |
| Australia | Mar 28, 2021 | w | 910 | −3,700 | ±1,000 | 3.6 | – | −10 | −2 |
| Austria | Jun 13, 2021 | w | 10,000 | 9,800 | ±1,400 | 7.0 | 0.9 | 110 | 12 |
| Azerbaijan | Feb 28, 2021 | m | 3,200 | 18,000 | ±1,400 | 13.0 | 5.6 | 180 | 32 |
| Belarus | Jun 30, 2020 | m | 390 | 5,700 | ±930 | 6.1 | 14.5 | 60 | 5 |
| Belgium | Jun 13, 2021 | w | 25,000 | 16,000 | ±1,800 | 8.7 | 0.6 | 140 | 14 |
| Bolivia | May 31, 2021 | m | 14,000 | 36,000 | ±770 | 46.4 | 2.5 | 310 | 68 |
| Bosnia | Mar 31, 2021 | m | 6,600 | 8,900 | ±990 | 9.0 | 1.4 | 270 | 25 |
| Brazil | May 31, 2021 | m | 460,000 | 500,000 | ±14,000 | 35.0 | 1.1 | 240 | 37 |
| Bulgaria | Jun 20, 2021 | w | 18,000 | 32,000 | ±1,800 | 17.5 | 1.8 | 460 | 29 |
| Canada | Mar 07, 2021 | w | 22,000 | 15,000 | ±1,700 | 8.6 | 0.7 | 40 | 5 |
| Chile | Jun 13, 2021 | w | 31,000 | 30,000 | ±1,100 | 26.7 | 1.0 | 160 | 27 |
| Colombia | May 09, 2021 | w | 77,000 | 92,000 | ±1,500 | 61.2 | 1.2 | 180 | 36 |
| Costa Rica | Dec 31, 2020 | m | 2,200 | 940 | ±370 | 2.5 | 0.4 | 20 | 4 |
| Croatia | May 30, 2021 | w | 8,000 | 8,800 | ±1,000 | 8.8 | 1.1 | 210 | 17 |
| Cuba | Dec 31, 2020 | m | 150 | 580 | ±2,100 | 0.3 | – | 10 | 1 |
| Cyprus | May 09, 2021 | w | 330 | 340 | ±160 | 2.1 | 1.0 | 30 | 5 |
| Czechia | May 23, 2021 | w | 30,000 | 35,000 | ±1,800 | 18.8 | 1.2 | 320 | 30 |
| Denmark | Jun 20, 2021 | w | 2,500 | −630 | ±610 | 1.0 | – | −10 | −1 |
| Ecuador | Jun 20, 2021 | w | 21,000 | 62,000 | ±960 | 64.4 | 2.9 | 350 | 80 |
| Egypt | Nov 30, 2020 | m | 6,600 | 87,000 | ±13,000 | 6.9 | 13.1 | 90 | 16 |
| El Salvador | Aug 31, 2020 | m | 720 | 4,700 | ±890 | 5.3 | 6.6 | 70 | 11 |
| Estonia | Jun 27, 2021 | w | 1,300 | 1,800 | ±300 | 6.0 | 1.4 | 140 | 12 |
| Finland | Jun 13, 2021 | w | 960 | 410 | ±680 | 0.6 | 0.4 | 10 | 1 |
| France | Jun 13, 2021 | w | 110,000 | 72,000 | ±8,000 | 8.9 | 0.7 | 110 | 12 |
| French Guiana | Jun 13, 2021 | w | 130 | −20 | ±60 | 0.3 | – | −10 | −2 |
| French Polynesia | Dec 31, 2020 | m | 110 | 120 | ±90 | 1.4 | 1.1 | 40 | 8 |
| Georgia | Dec 31, 2020 | m | 2,500 | 4,800 | ±1,000 | 4.7 | 1.9 | 120 | 11 |
| Germany | Jun 20, 2021 | w | 90,000 | 39,000 | ±17,000 | 2.3 | 0.4 | 50 | 4 |
| Gibraltar | Jan 31, 2021 | m | 80 | 20 | ±20 | 1.1 | 0.3 | 70 | 7 |
| Greece | May 02, 2021 | w | 10,000 | 7,500 | ±2,000 | 3.8 | 0.7 | 70 | 6 |
| Greenland | Dec 31, 2020 | m | 0 | −20 | ±30 | 0.5 | – | −30 | −3 |
| Guadeloupe | Jun 13, 2021 | w | 260 | 220 | ±110 | 2.0 | 0.8 | 60 | 6 |
| Guatemala | Dec 27, 2020 | w | 4,800 | 10,000 | ±700 | 14.5 | 2.1 | 60 | 12 |
| Hong Kong | Mar 31, 2021 | m | 200 | 2,100 | ±1,100 | 1.9 | – | 30 | 4 |
| Hungary | May 30, 2021 | w | 30,000 | 24,000 | ±2,300 | 10.2 | 0.8 | 240 | 18 |
| Iceland | Mar 21, 2021 | w | 30 | −20 | ±70 | 0.2 | – | −0 | −1 |
| Iran | Sep 21, 2020 | q | 24,000 | 58,000 | ±7,900 | 7.3 | 2.4 | 70 | 15 |
| Ireland | May 31, 2021 | m | 5,000 | 1,400 | ±730 | 1.9 | 0.3 | 30 | 4 |
| Israel | May 30, 2021 | w | 6,400 | 4,800 | ±550 | 8.9 | 0.8 | 60 | 10 |
| Italy | Apr 04, 2021 | w | 110,000 | 120,000 | ±9,000 | 13.9 | 1.1 | 210 | 19 |
| Jamaica | Nov 30, 2020 | m | 260 | −320 | ±310 | 1.0 | – | −10 | −2 |
| Japan | Apr 30, 2021 | m | 10,000 | −15,000 | ±12,000 | 1.3 | – | −10 | −1 |
| Kazakhstan | Apr 30, 2021 | m | 6,600 | 35,000 | ±3,400 | 10.3 | 5.3 | 180 | 26 |
| Kosovo | Mar 31, 2021 | m | 1,900 | 2,800 | ±310 | 8.9 | 1.5 | 150 | 30 |
| Kyrgyzstan | Apr 30, 2021 | m | 1,600 | 7,900 | ±670 | 11.8 | 4.9 | 120 | 24 |
| Latvia | Jun 13, 2021 | w | 2,500 | 3,000 | ±440 | 6.8 | 1.2 | 160 | 10 |
| Lebanon | Apr 30, 2021 | m | 7,300 | 8,900 | ±970 | 9.2 | 1.2 | 130 | 36 |
| Liechtenstein | Apr 30, 2021 | m | 60 | 50 | ±30 | 1.7 | 0.8 | 120 | 17 |
| Lithuania | Jun 20, 2021 | w | 4,400 | 9,500 | ±600 | 15.9 | 2.2 | 350 | 25 |
| Luxembourg | Jun 06, 2021 | w | 820 | 190 | ±140 | 1.4 | 0.2 | 30 | 4 |
| Macao | Apr 30, 2021 | m | 0 | −40 | ±110 | 0.3 | – | −10 | −2 |
| Malaysia | Mar 31, 2021 | m | 1,300 | −6,600 | ±1,900 | 3.5 | – | −20 | −4 |
| Malta | May 16, 2021 | w | 420 | 360 | ±120 | 3.0 | 0.9 | 80 | 9 |
| Martinique | Jun 13, 2021 | w | 100 | 30 | ±110 | 0.3 | 0.3 | 10 | 1 |
| Mauritius | Apr 30, 2021 | m | 20 | −440 | ±240 | 1.8 | – | −30 | −4 |
| Mayotte | Jun 13, 2021 | w | 170 | 320 | ±50 | 6.5 | 1.8 | 120 | 40 |
| Mexico | May 23, 2021 | w | 220,000 | 470,000 | ±6,600 | 70.1 | 2.1 | 360 | 61 |
| Moldova | Mar 31, 2021 | m | 5,000 | 8,000 | ±880 | 9.0 | 1.6 | 200 | 22 |
| Monaco | May 31, 2021 | m | 30 | 120 | ±50 | 2.5 | 3.7 | 300 | 24 |
| Mongolia | May 31, 2021 | m | 280 | −1,900 | ±490 | 3.9 | – | −60 | −11 |
| Montenegro | Mar 28, 2021 | w | 1,200 | 1,400 | ±170 | 8.4 | 1.2 | 230 | 21 |
| Netherlands | Jun 20, 2021 | w | 18,000 | 19,000 | ±1,900 | 9.8 | 1.1 | 110 | 12 |
| New Zealand | Jun 06, 2021 | w | 30 | −1,900 | ±410 | 4.7 | – | −40 | −5 |
| Nicaragua | Aug 31, 2020 | m | 140 | 7,000 | ±270 | 26.0 | 50.8 | 100 | 27 |
| North Macedonia | Apr 30, 2021 | m | 4,900 | 8,600 | ±770 | 11.3 | 1.8 | 420 | 43 |
| Norway | Jun 20, 2021 | w | 790 | −1,500 | ±530 | 2.9 | – | −30 | −4 |
| Oman | May 31, 2021 | m | 2,300 | 2,200 | ±330 | 6.7 | 0.9 | 40 | 24 |
| Panama | Apr 30, 2021 | m | 6,200 | 6,500 | ±420 | 15.7 | 1.0 | 150 | 31 |
| Paraguay | May 31, 2021 | m | 9,100 | 9,600 | ±920 | 10.3 | 1.1 | 130 | 28 |
| Peru | Jun 27, 2021 | w | 190,000 | 190,000 | ±2,000 | 95.9 | 1.0 | 590 | 153 |
| Philippines | Dec 31, 2020 | m | 9,200 | −7,700 | ±5,900 | 1.3 | – | −10 | −1 |
| Poland | Jun 13, 2021 | w | 75,000 | 120,000 | ±5,500 | 21.1 | 1.6 | 310 | 28 |
| Portugal | Jun 06, 2021 | w | 17,000 | 19,000 | ±2,100 | 9.0 | 1.1 | 180 | 16 |
| Qatar | Apr 30, 2021 | m | 460 | 650 | ±70 | 9.2 | 1.4 | 20 | 29 |
| Romania | Apr 25, 2021 | w | 31,000 | 54,000 | ±3,500 | 15.3 | 1.7 | 280 | 20 |
| Russia | Apr 30, 2021 | m | 110,000 | 500,000 | ±33,000 | 15.2 | 4.5 | 340 | 28 |
| Réunion | Jun 13, 2021 | w | 210 | 190 | ±130 | 1.5 | 0.9 | 20 | 4 |
| San Marino | May 31, 2021 | m | 90 | 110 | ±30 | 3.4 | 1.2 | 320 | 42 |
| Serbia | May 31, 2021 | m | 6,900 | 28,000 | ±3,600 | 7.7 | 4.0 | 400 | 27 |
| Seychelles | Dec 31, 2020 | m | 0 | −170 | ±40 | 4.1 | – | −170 | −20 |
| Singapore | Mar 31, 2021 | m | 30 | −160 | ±380 | 0.4 | – | −0 | −1 |
| Slovakia | May 16, 2021 | w | 12,000 | 17,000 | ±920 | 18.1 | 1.4 | 310 | 30 |
| Slovenia | May 23, 2021 | w | 4,700 | 3,700 | ±370 | 10.0 | 0.8 | 180 | 17 |
| South Africa | Jun 27, 2021 | w | 60,000 | 160,000 | ±nan | nan | 2.7 | 270 | 32 |
| South Korea | May 02, 2021 | w | 1,800 | −3,300 | ±2,900 | 1.1 | – | −10 | −1 |
| Spain | Jun 20, 2021 | w | 81,000 | 87,000 | ±6,300 | 13.9 | 1.1 | 190 | 20 |
| Sweden | Jun 06, 2021 | w | 15,000 | 8,900 | ±1,100 | 8.5 | 0.6 | 90 | 10 |
| Switzerland | Jun 06, 2021 | w | 10,000 | 8,600 | ±1,100 | 8.0 | 0.8 | 100 | 13 |
| Taiwan | May 31, 2021 | m | 140 | −6,600 | ±5,700 | 1.2 | – | −30 | −4 |
| Tajikistan | Dec 31, 2020 | q | 90 | 9,000 | ±1,400 | 6.6 | 100.0 | 90 | 27 |
| Thailand | Jun 30, 2021 | m | 2,100 | 14,000 | ±13,000 | 1.1 | – | 20 | 3 |
| Transnistria | May 31, 2021 | m | 1,200 | 1,600 | ±240 | 6.4 | 1.3 | 340 | 23 |
| Tunisia | Feb 14, 2021 | w | 7,500 | 4,600 | ±1,100 | 4.3 | 0.6 | 40 | 6 |
| Ukraine | Apr 30, 2021 | m | 44,000 | 81,000 | ±13,000 | 6.4 | 1.8 | 200 | 14 |
| United Kingdom | Jun 13, 2021 | w | 130,000 | 110,000 | ±9,200 | 11.9 | 0.9 | 160 | 18 |
| United States | Jun 06, 2021 | w | 590,000 | 640,000 | ±16,000 | 38.9 | 1.1 | 190 | 22 |
| Uruguay | Dec 31, 2020 | m | 170 | −2,200 | ±710 | 3.2 | – | −60 | −6 |
| Uzbekistan | Mar 31, 2021 | m | 630 | 20,000 | ±3,900 | 5.0 | 31.5 | 60 | 13 |
Additional files
Download links
A two-part list of links to download the article, or parts of the article, in various formats.
Downloads (link to download the article as PDF)
Open citations (links to open the citations from this article in various online reference manager services)
Cite this article (links to download the citations from this article in formats compatible with various reference manager tools)
Tracking excess mortality across countries during the COVID-19 pandemic with the World Mortality Dataset
eLife 10:e69336.
https://doi.org/10.7554/eLife.69336


