Revisiting the guidelines for ending isolation for COVID-19 patients
- interdisciplinary Biology Laboratory (iBLab), Division of Biological Science, Graduate School of Science, Nagoya University, Japan
- Department of Mathematics, Pusan National University, Republic of Korea
- Department of Epidemiology and Biostatistics, Indiana University School of Public Health-Bloomington, United States
- International Research Center for Neurointelligence, The University of Tokyo, Japan
- Department of Virology II, National Institute of Infectious Diseases, Japan
- Research Center for Drug and Vaccine Development, National Institute of Infectious Diseases, Japan
- Department of Applied Biological Science, Tokyo University of Science, Japan
- Department of Infectious Diseases, Nagasaki University Graduate School of Biomedical Sciences, Japan
- Division of Respirology, Rheumatology, Infectious Diseases, and Neurology, Department of Internal Medicine, Faculty of Medicine, University of Miyazaki, Japan
- Institute of Mathematics for Industry, Kyushu University, Japan
- Institute for the Advanced Study of Human Biology (ASHBi), Kyoto University, Japan
- NEXT-Ganken Program, Japanese Foundation for Cancer Research (JFCR), Japan
- Science Groove Inc, Japan
- Laboratory for the Modeling of Biological and Socio-technical Systems, Northeastern University, United States
Figures
Figure 1 with 1 supplement
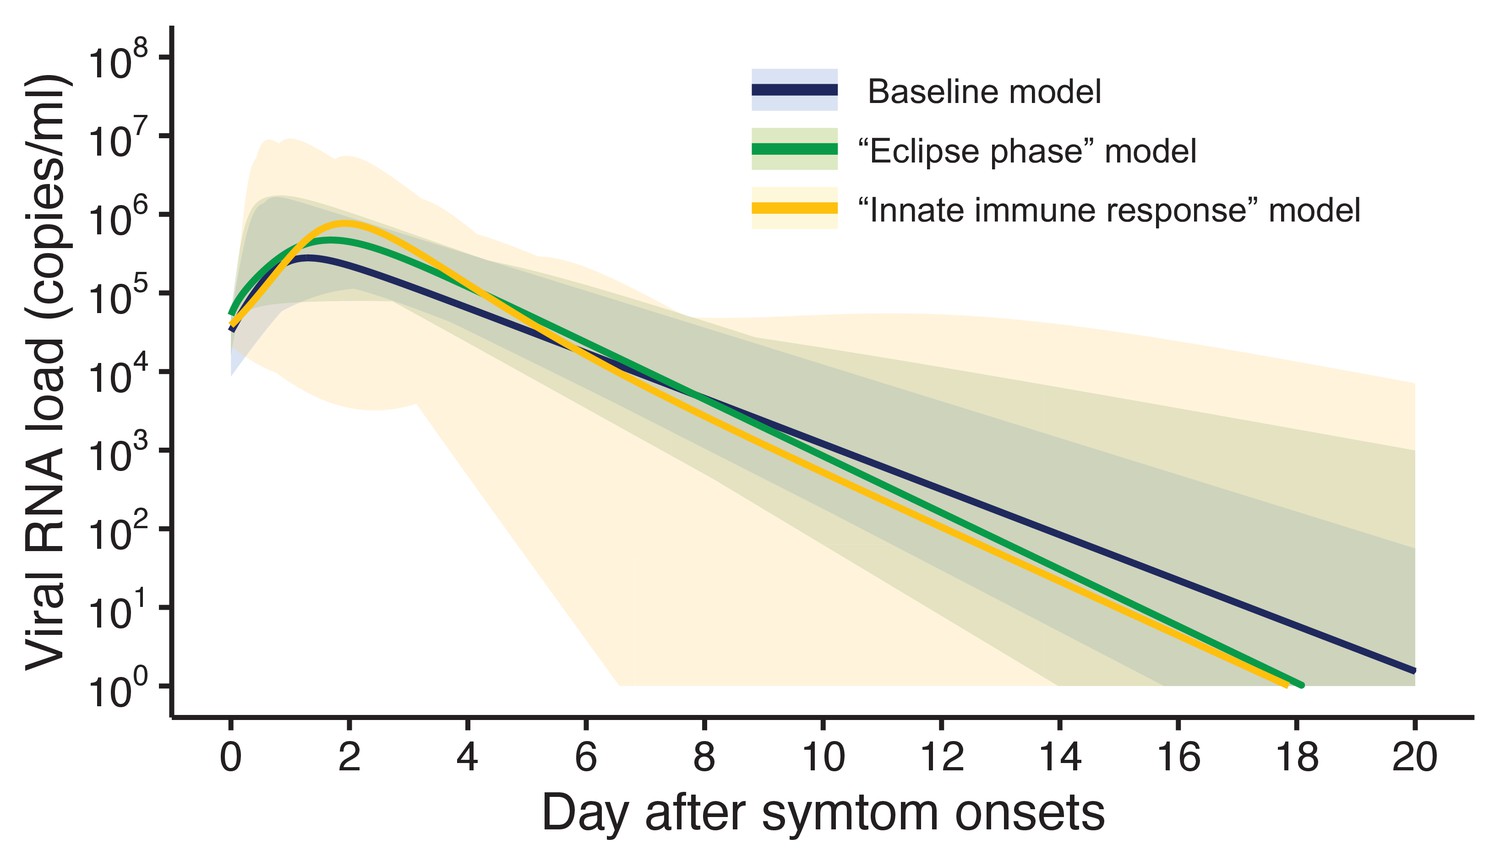
Estimated viral load curves from the three analyzed models.
The solid lines are the estimated viral load curves of the three models for the best fit parameters (Blue: baseline model, Green: ‘ecliplse phase’ model, Yellow: ‘innate immune response’ model). The shaded regions correspond to 95% predictive intervals. The 95% predictive interval was created using bootstrap approach.
-
Figure 1—source data 1
Estimated viral load curves from the three analyzed models.
The numbers in parentheses are the 95% empirical CI.
- https://cdn.elifesciences.org/articles/69340/elife-69340-fig1-data1-v1.docx
Figure 1—figure supplement 1

Observed and estimated viral load for individual patients.
The dots and curves represent the observed and estimated viral load (Blue: baseline model, Green: ‘ecliplse phase’ model, Yellow: ‘innate immune response’ model), respectively. The detection limit for each patient is shown as dotted horizontal line.
Figure 2
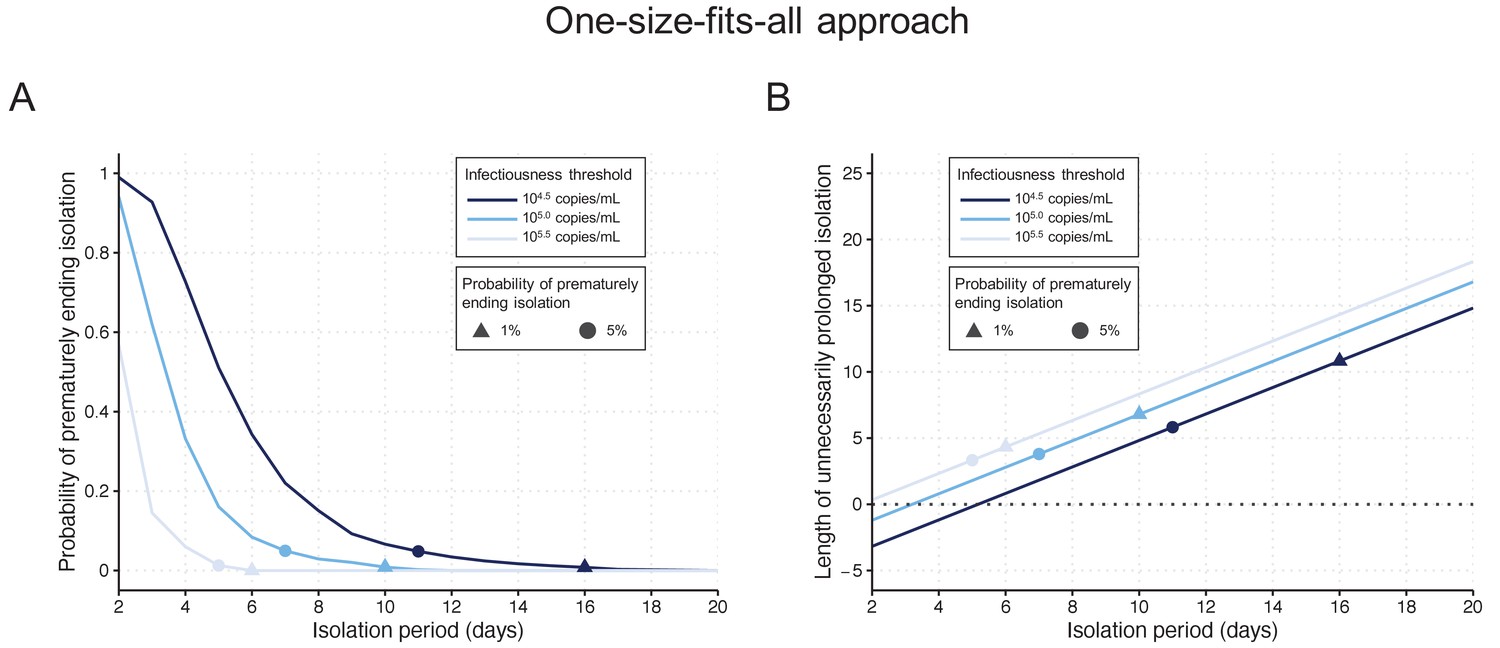
One-size-fits-all approach.
(A) Probability of prematurely ending the isolation of infectious patients for different lengths of the isolation period and for different infectiousness threshold values. (B) Mean length of unnecessarily prolonged isolation for different lengths of the isolation period and for different infectiousness threshold values. Color keys and symbols apply to both panels. Note that the symbols correspond to the shortest isolation periods when the condition is met.
-
Figure 2—source data 1
Probability of prematurely ending isolation and mean length of unnecessarily prolonged isolation under the one-size-fits-all approach.
The numbers in parentheses are the 95% empirical CI.
- https://cdn.elifesciences.org/articles/69340/elife-69340-fig2-data1-v1.docx
Figure 3
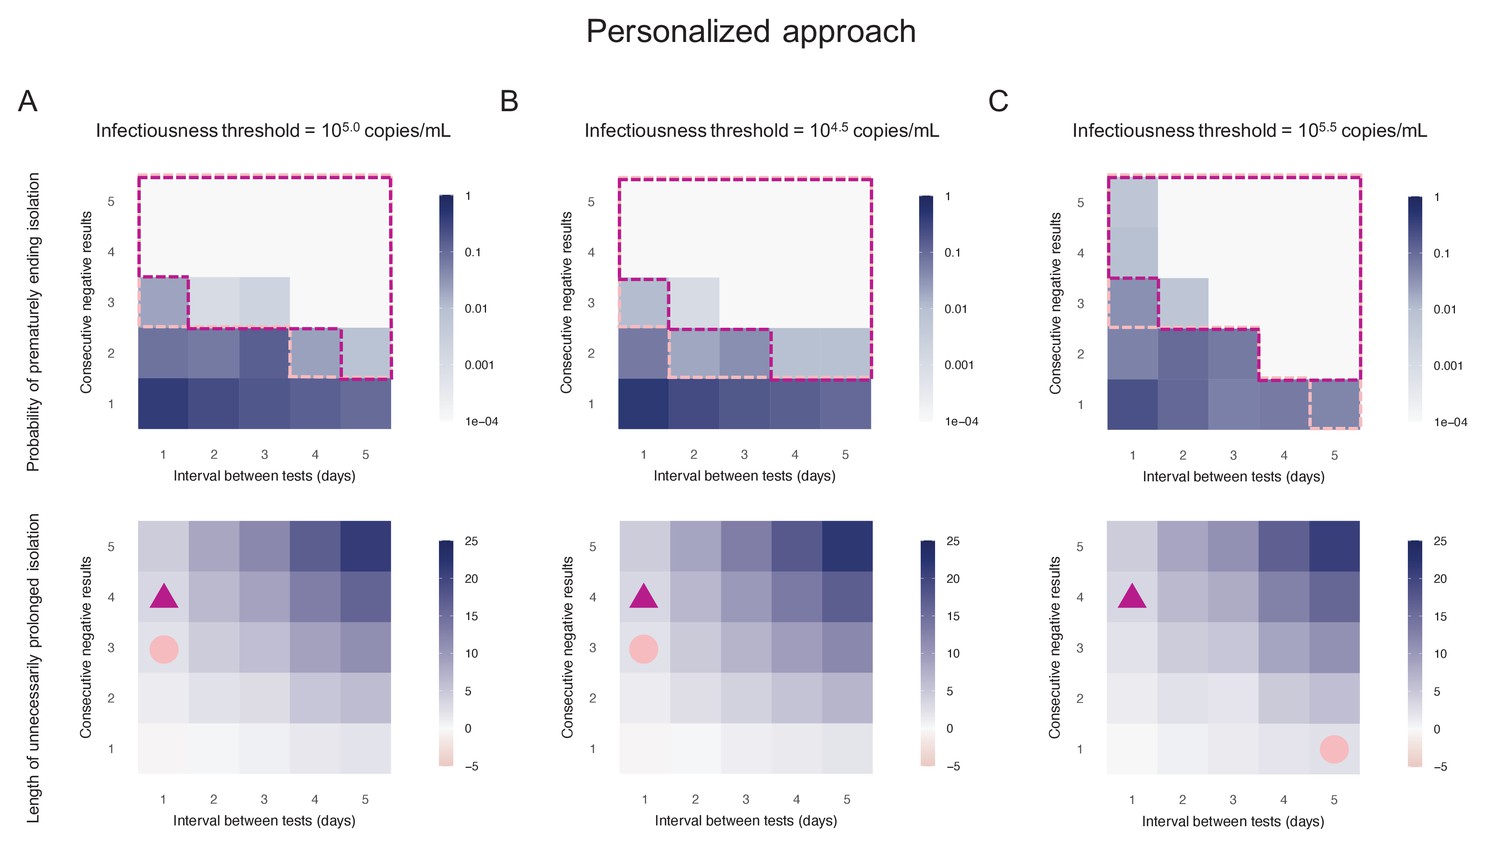
Personalized approach.
(A) Probability of prematurely ending isolation (upper panels) and mean length of unnecessarily prolonged isolation (lower panels) for different values of the interval between PCR tests and the number of consecutive negative results necessary to end isolation; the infectiousness threshold value is set to 105.0 copies/mL. The areas surrounded by purple and pink dotted lines are those with 1% or 5% or lower of risk of prematurely ending isolation of infectious patients, respectively, and the triangles and circles correspond to the conditions which realize the shortest prolonged isolation within each area. (B) Same as A, but for an infectiousness threshold value of 104.5 copies/mL. (C) Same as A, but for an infectiousness threshold value of 105.5 copies/mL. Color keys and symbols apply to all panels.
-
Figure 3—source data 1
Probability of prematurely ending isolation of infectious patients with different guidelines (with 105.0 copies/mL as an infectiousness threshold value).
The cell with numbers in bold corresponds to the baseline. The numbers in parentheses are the 95% CI.
- https://cdn.elifesciences.org/articles/69340/elife-69340-fig3-data1-v1.docx
-
Figure 3—source data 2
Length of unnecessarily prolonged isolation with different guidelines (with 105.0 copies/mL as an infectiousness threshold value).
The cell with numbers in bold corresponds to the baseline. The numbers in parentheses are the empirical 95% CI.
- https://cdn.elifesciences.org/articles/69340/elife-69340-fig3-data2-v1.docx
-
Figure 3—source data 3
Probability of prematurely ending isolation of infectious patients with different guidelines (with 104.5 copies/mL as an infectiousness threshold value).
The cell with numbers in bold corresponds to the baseline. The numbers in parentheses are the 95% CI.
- https://cdn.elifesciences.org/articles/69340/elife-69340-fig3-data3-v1.docx
-
Figure 3—source data 4
Length of unnecessarily prolonged isolation with different guidelines (with 104.5 copies/mL as an infectiousness threshold value).
The cell with numbers in bold corresponds to the baseline. The numbers in parentheses are the empirical 95% CI.
- https://cdn.elifesciences.org/articles/69340/elife-69340-fig3-data4-v1.docx
-
Figure 3—source data 5
Probability of prematurely ending isolation of infectious patients with different guidelines (with 105.5 copies/mL as an infectiousness threshold value).
The cell with numbers in bold corresponds to the baseline. The numbers in parentheses are the 95% CI.
- https://cdn.elifesciences.org/articles/69340/elife-69340-fig3-data5-v1.docx
-
Figure 3—source data 6
Length of unnecessarily prolonged isolation with different guidelines (with 105.5 copies/mL as an infectiousness threshold value).
The cell with numbers in bold corresponds to the baseline. The numbers in parentheses are the empirical 95% CI.
- https://cdn.elifesciences.org/articles/69340/elife-69340-fig3-data6-v1.docx
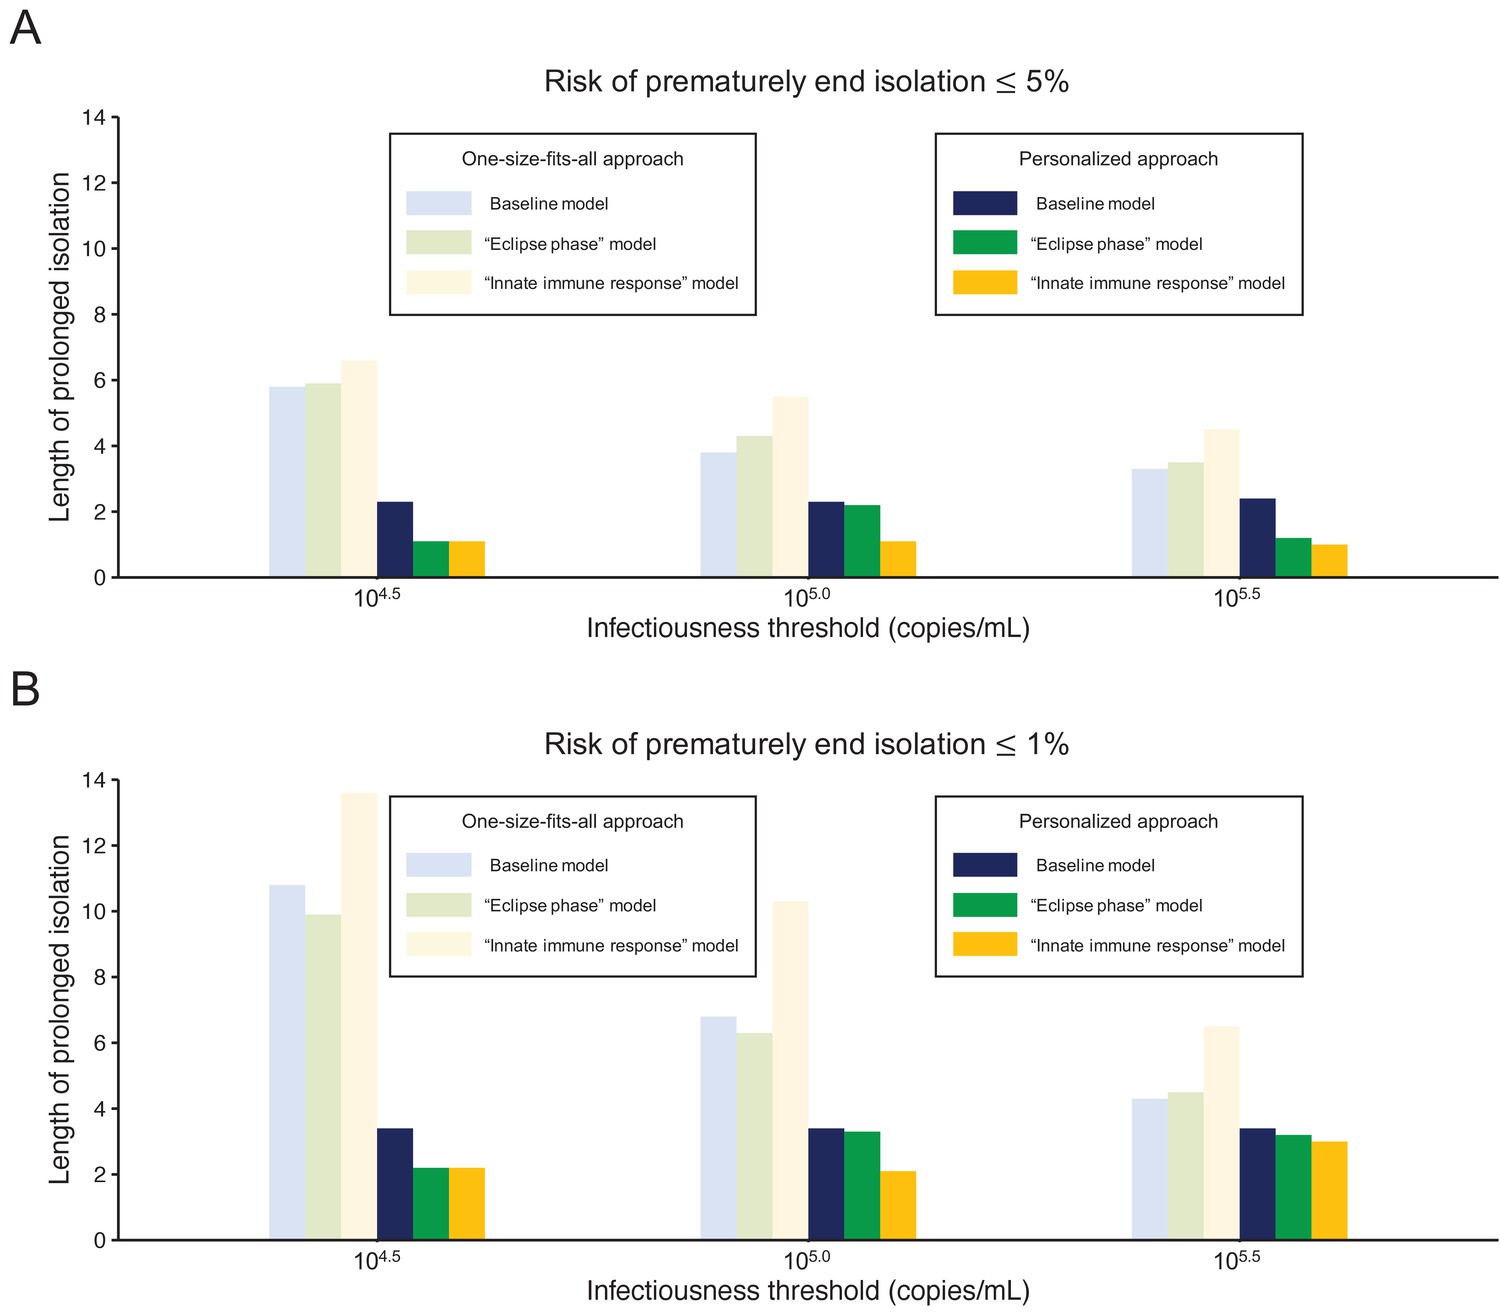
Figure 4
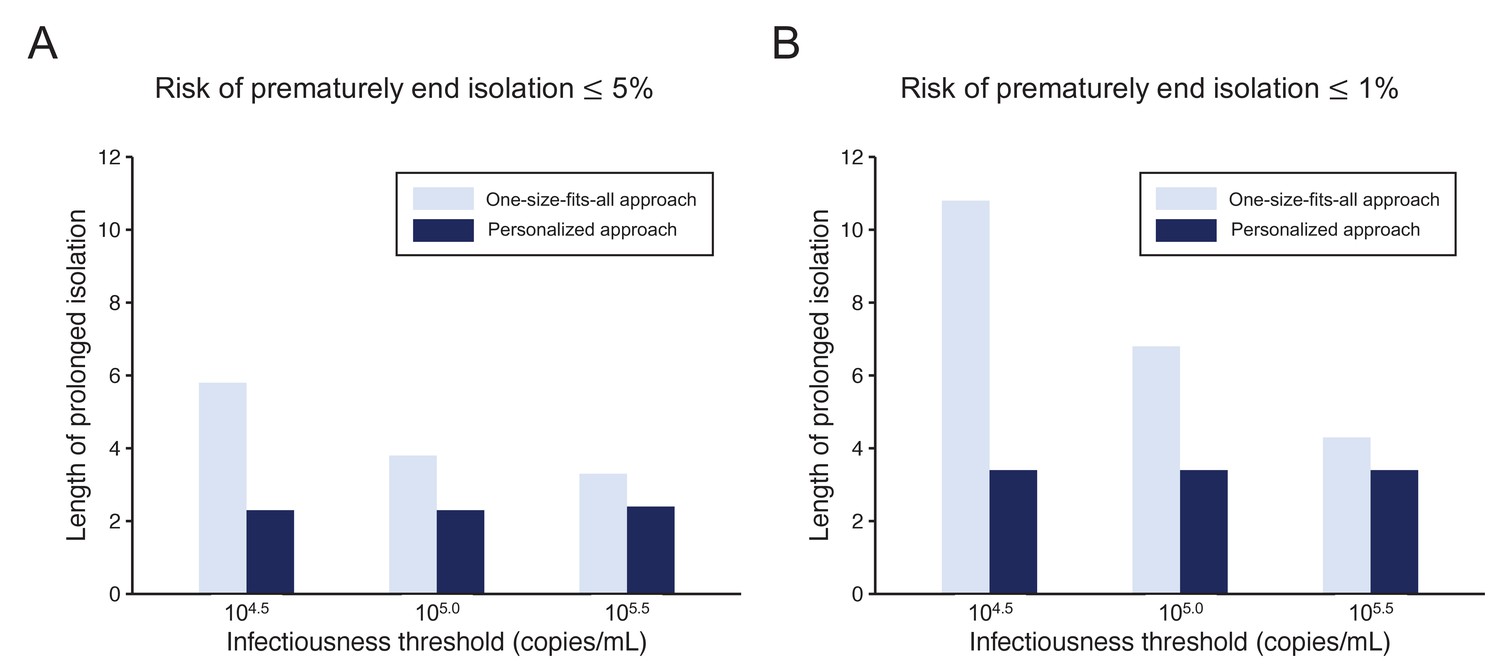
Comparison between the one-size-fits-all and the personalized approach.
(A) Mean length of prolonged isolation for different infectiousness threshold values and for the two approaches when considering a 5% or lower risk of prematurely ending isolation. Note that for the personalized approach, the interval between PCR tests and the number of consecutive negative results necessary to end isolation were selected to minimize the duration of prolonged isolation. (B) Same as A, but considering a 1% or lower risk of prematurely ending isolation. Color keys apply to both panels.
-
Figure 4—source data 1
Mean length of unnecessarily prolonged isolation (days) with different guidelines and infectiousness threshold values controlling the risk of prematurely ending isolation ≤ 5% and ≤ 1%.
The numbers in parentheses are the empirical 95% CI.
- https://cdn.elifesciences.org/articles/69340/elife-69340-fig4-data1-v1.docx
Figure 5
Comparison between alternative models.
(A) Mean length of prolonged isolation for different infectiousness threshold values and for the two approaches when considering a 5% or lower risk of prematurely ending isolation and for the three analyzed models. Note that for the personalized approach, the interval between PCR tests and the number of consecutive negative results necessary to end isolation were selected to minimize the duration of prolonged isolation. (B) Same as A, but considering a 1% or lower risk of prematurely ending isolation. Color keys apply to both panels.
-
Figure 5—source data 1
Mean length of unnecessarily prolonged isolation (days) with different guidelines and infectiousness threshold values controlling the risk of prematurely ending isolation ≤ 5% and ≤ 1% for the three analyzed models.
The numbers in parentheses are the empirical 95% CI.
- https://cdn.elifesciences.org/articles/69340/elife-69340-fig5-data1-v1.docx
Figure 6
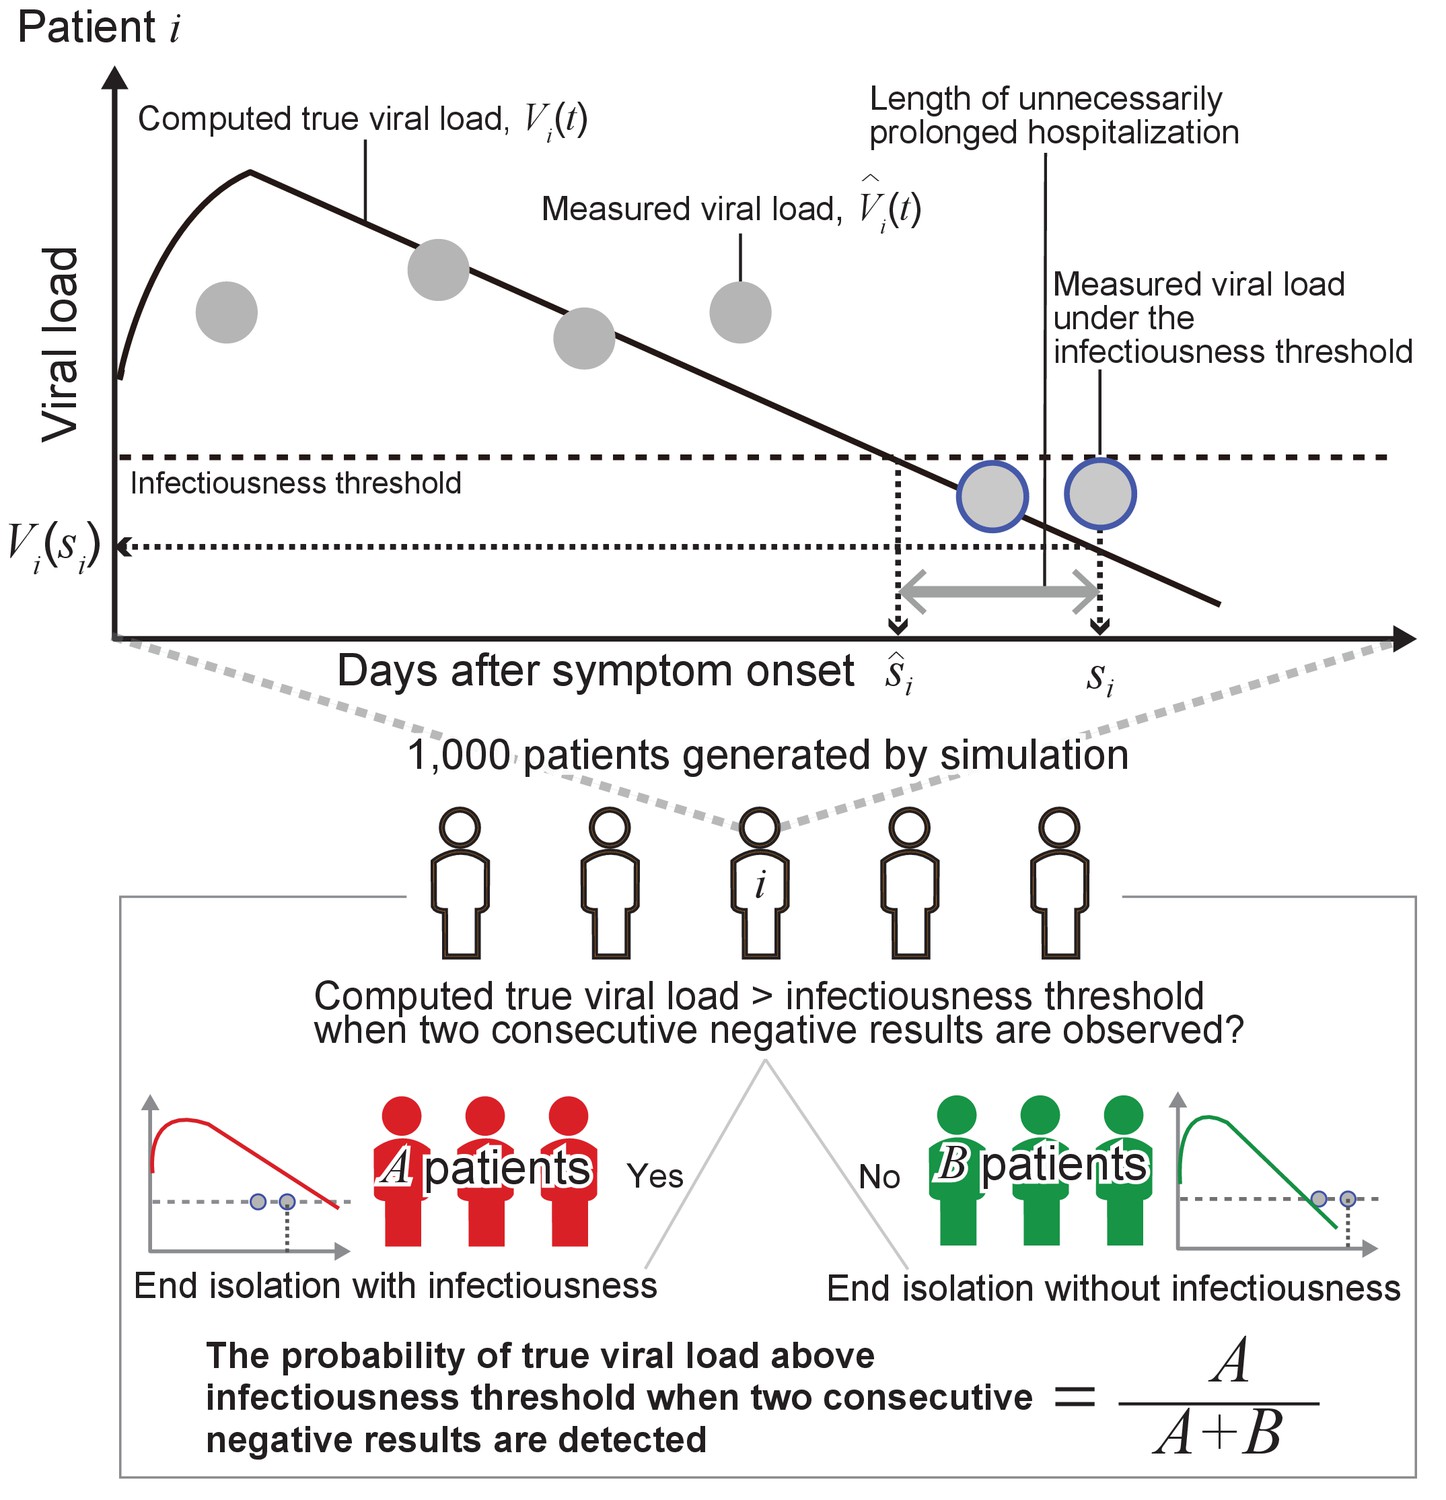
Schematic of the adopted methodology.
Tables
Table 1
Summary of the viral load data used for modeling.
| Source | Country | # of included (excluded) patients | Sampling site | Reporting unit | Detection limit (copies/mL) | Symptom onset of patients | Age‡ | Sex (M:F) |
|---|---|---|---|---|---|---|---|---|
| Young et al. | Singapore | 12 (6) | nasopharynx | cycle threshold* | 68.0 | 1/21 - 1/30 | 37.5 (31–56) | 6:6 |
| Zou et al. | China | 8 (8) | nose | cycle threshold* | 15.3 | 1/11 - 1/26 | 52.5 (28–78) | 3:5 |
| Kim et al. | Korea | 2 (7) | nasopharynx and oropharynx | cycle threshold* | 68.0 | NA | NA | NA |
| Wölfel et al. | Germany | 8 (1) | pharynx | viral load (copies/swab)† | 33.3 | 1/23 - 2/4 | NA | NA |
-
*Viral load was calculated from cycle threshold values using the conversion formula: (Peiris et al., 2003).
† One swab = 3 mL (Wölfel et al., 2020).
-
‡ Median (range).
Additional files
-
Supplementary file 1
Estimated parameters of the three models.
- https://cdn.elifesciences.org/articles/69340/elife-69340-supp1-v1.docx
-
Supplementary file 2
AIC and BIC of the three models.
- https://cdn.elifesciences.org/articles/69340/elife-69340-supp2-v1.docx
-
Transparent reporting form
- https://cdn.elifesciences.org/articles/69340/elife-69340-transrepform-v1.docx
Download links
A two-part list of links to download the article, or parts of the article, in various formats.
Downloads (link to download the article as PDF)
Open citations (links to open the citations from this article in various online reference manager services)
Cite this article (links to download the citations from this article in formats compatible with various reference manager tools)
Revisiting the guidelines for ending isolation for COVID-19 patients
eLife 10:e69340.
https://doi.org/10.7554/eLife.69340


