Structure of Mycobacterium tuberculosis cytochrome bcc in complex with Q203 and TB47, two anti-TB drug candidates
- State Key Laboratory of Medicinal Chemical Biology, College of Pharmacy, Nankai University, China
- State Key Laboratory of Medicinal Chemical Biology, College of Life Sciences, Nankai University, China
- Shanghai Institute for Advanced Immunochemical Studies and School of Life Science and Technology, ShanghaiTech University, China
- Bioland Laboratory (Guangzhou Regenerative Medicine and Health - Guangdong Laboratory), China
- School of Chemistry and Molecular Biosciences, The University of Queensland, Australia
- National Laboratory of Biomacromolecules, CAS Center for Excellence in Biomacromolecules, Institute of Biophysics, China
- Laboratory of Structural Biology, Tsinghua University, China
Figures
Figure 1
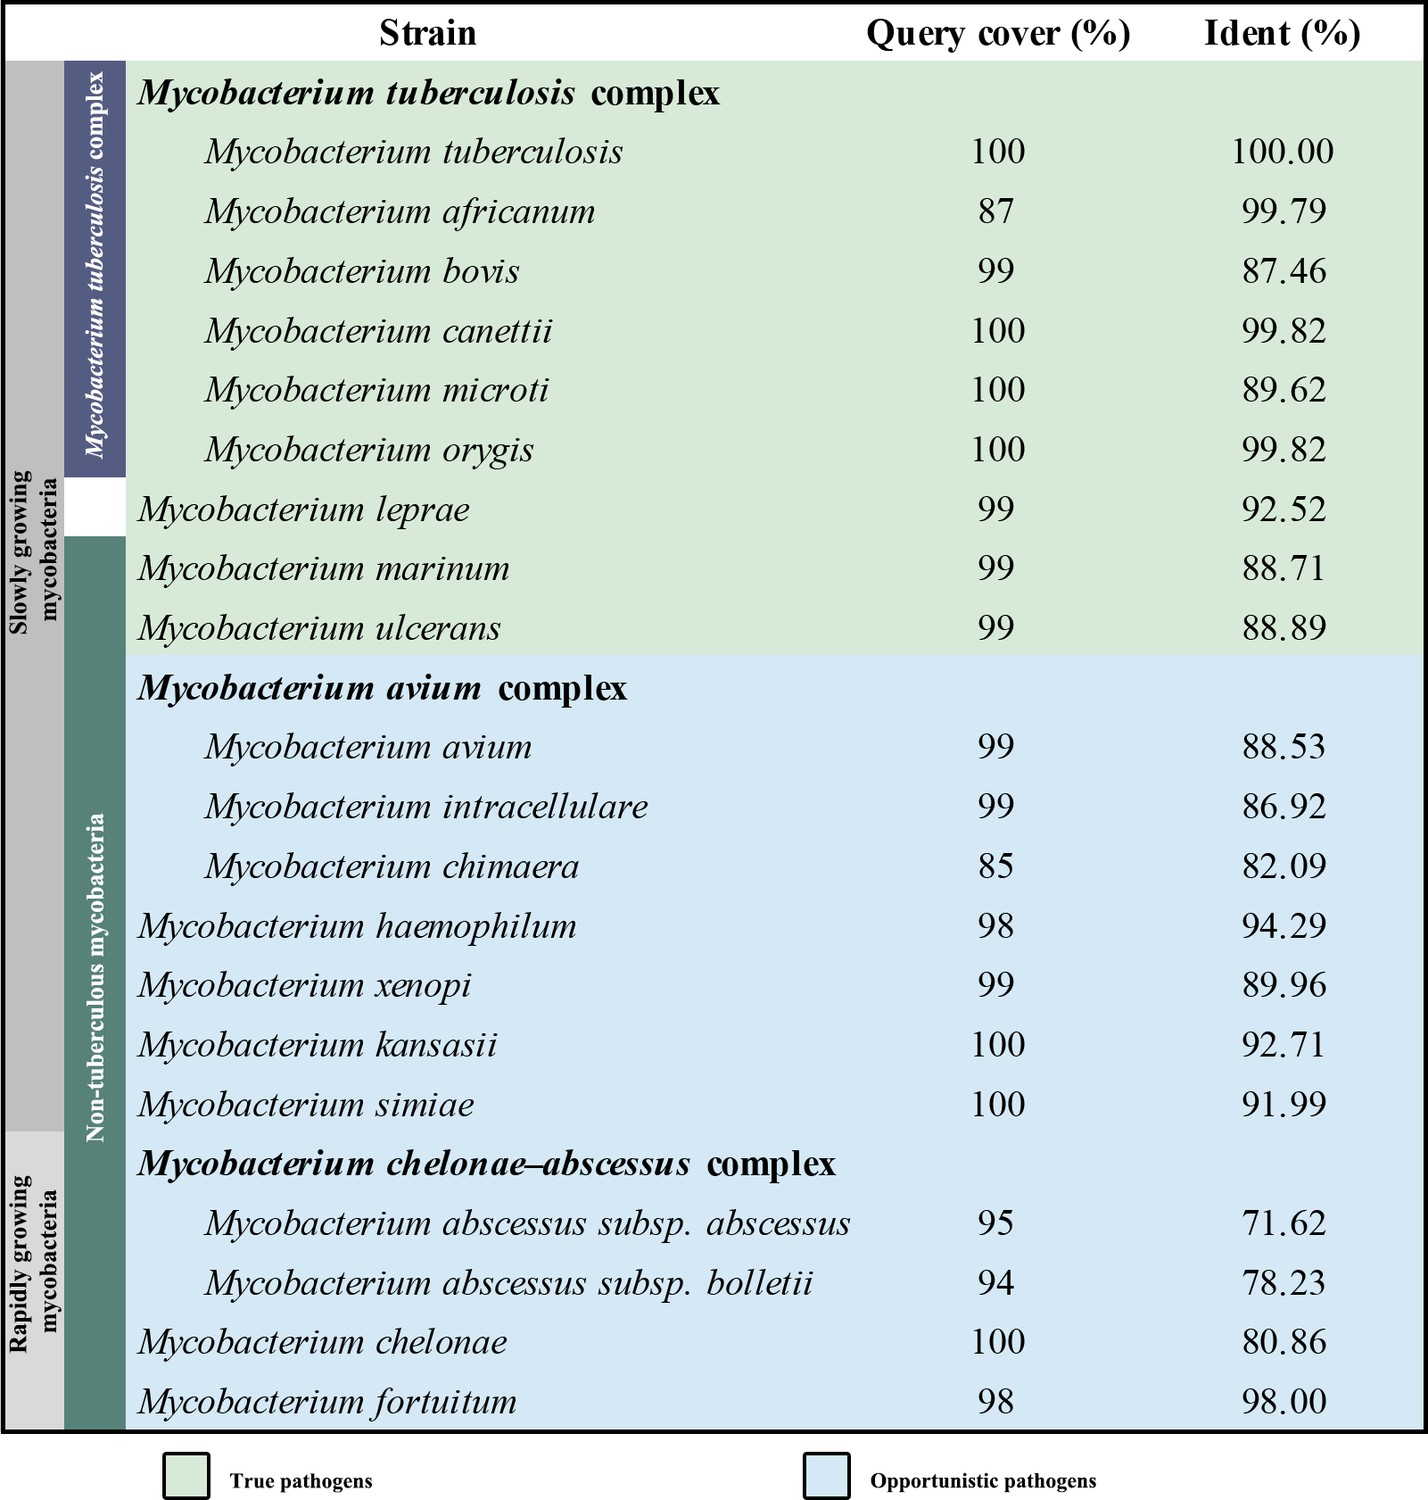
Sequence similarity comparison of M. tuberculosis QcrB with other pathogenic mycobacteria.
Figure 2 with 5 supplements

Overall architecture of the hybrid supercomplex.
(A) Front view and (B) top view of the cryo-electron microscopy (cryo-EM) map of hybrid supercomplex at 2.68 Å resolution. QcrA, QcrB, and QcrC of the M. tuberculosis cytochrome bcc are colored teal, purple, and salmon, respectively. Other subunits of the hybrid supercomplex are in gray. (C) Cartoon representation of cytochrome bcc, using the same color scheme as above. The twofold symmetry of the dimer is depicted by the gray axis. The heme groups (bH, bL, cD1, and cD2) and menaquinone/menaquinol (MKP/MKN) are shown as stick models. The [2Fe-2S] clusters are shown as spheres. (D) A cross-sectional view (top) of the helices in the cytochrome bcc dimer.
-
Figure 2—source data 1
Oxygen consumption of the hybrid supercomplex measures using Clark-type oxygen electrode.
- https://cdn.elifesciences.org/articles/69418/elife-69418-fig2-data1-v1.xlsx
Figure 2—figure supplement 1
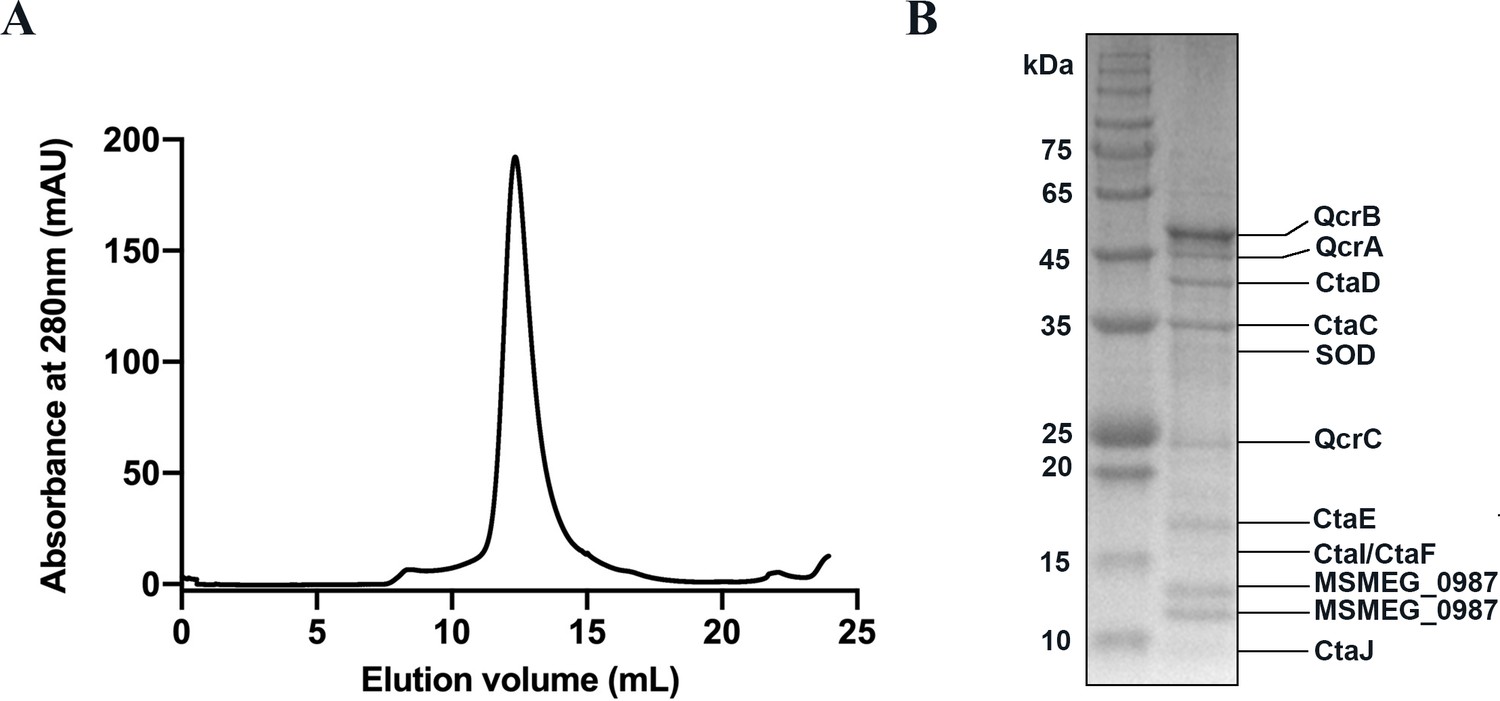
Purification and identification of the hybrid supercomplex consisting of M. tuberculosis CIII and M. smegmatis CIV.
(A) The elution profile of the hybrid supercomplex from size-exclusion chromatography (SEC). (B) SDS-PAGE of the pooled fraction from the SEC in (A).
-
Figure 2—figure supplement 1—source data 1
The elution profile of the hybrid supercomplex from size-exclusion chromatography.
- https://cdn.elifesciences.org/articles/69418/elife-69418-fig2-figsupp1-data1-v1.csv
-
Figure 2—figure supplement 1—source data 2
SDS-PAGE of the pooled fraction from the size-exclusion chromatography.
- https://cdn.elifesciences.org/articles/69418/elife-69418-fig2-figsupp1-data2-v1.tif
Figure 2—figure supplement 2
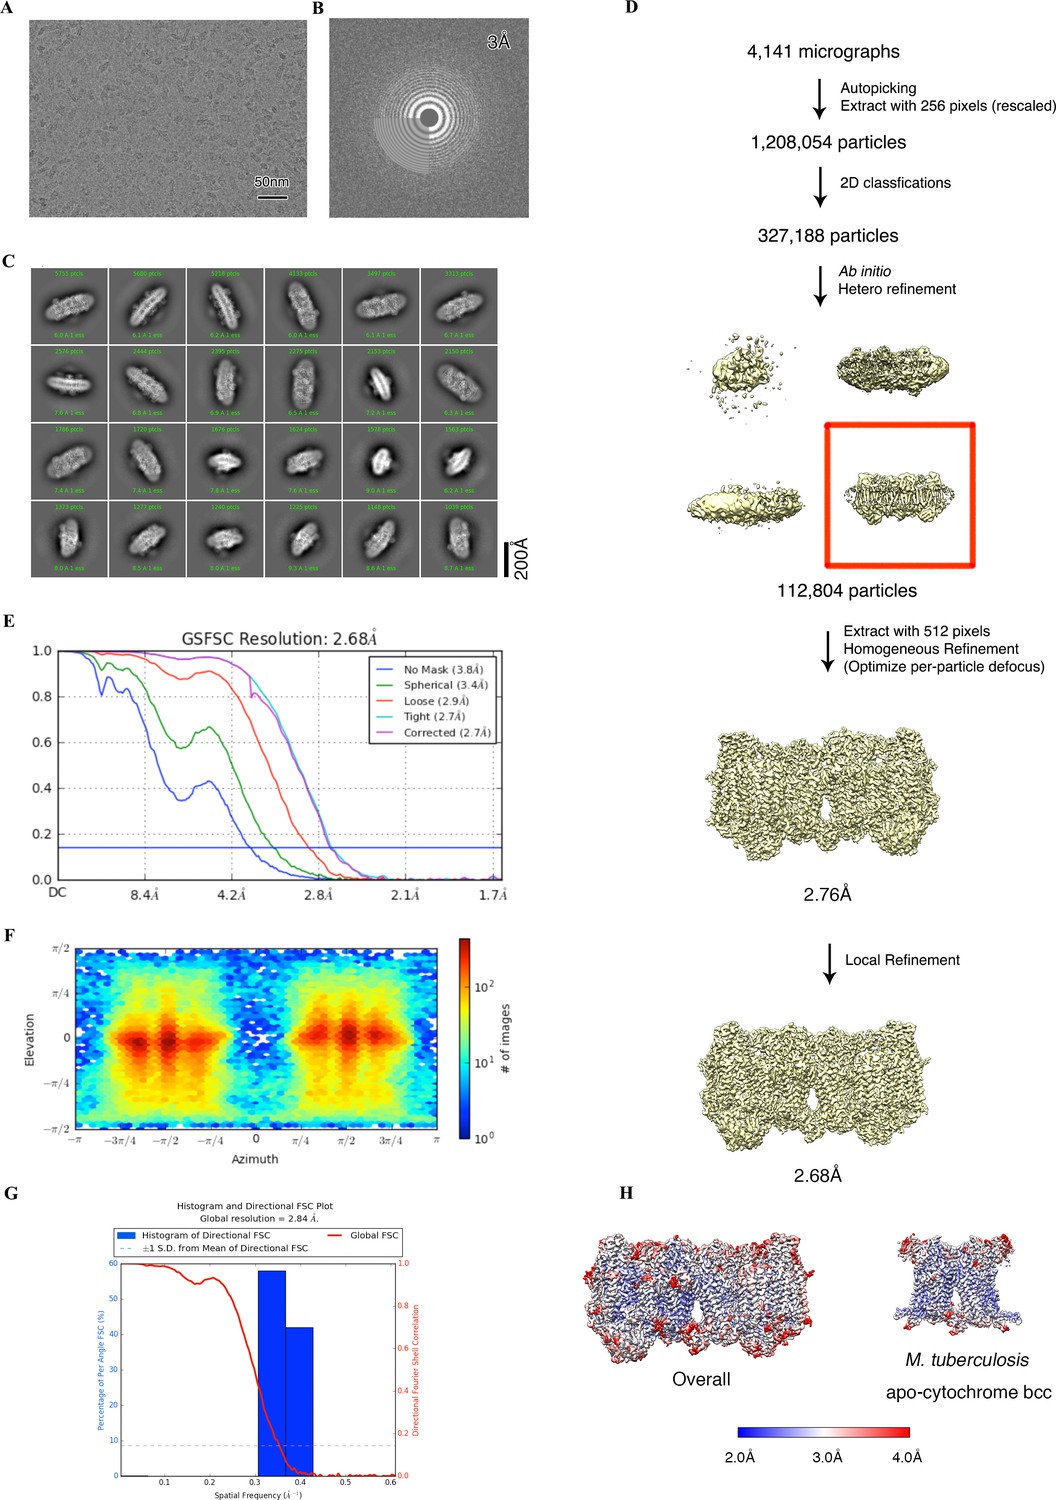
Cryo-electron microscopy (cryo-EM) data processing of the apo hybrid supercomplex consisting of M. tuberculosis CIII and M. smegmatis CIV.
(A) Representative electron micrograph of the cryo-EM sample. (B) CTF fit of the motion-corrected micrographs. (C) Representative 2D classification averages calculated from selected particles. (D) Workflow of data processing for the apo hybrid supercomplex. (E) Fourier shell correlation (FSC) curves of 3D reconstructions. (F) View direction of all particles used in the final 3D reconstruction. (G) 3D FSC histogram of the final map. (H) The overall and Mtb cytochrome bcc maps, colored according to the local resolution.
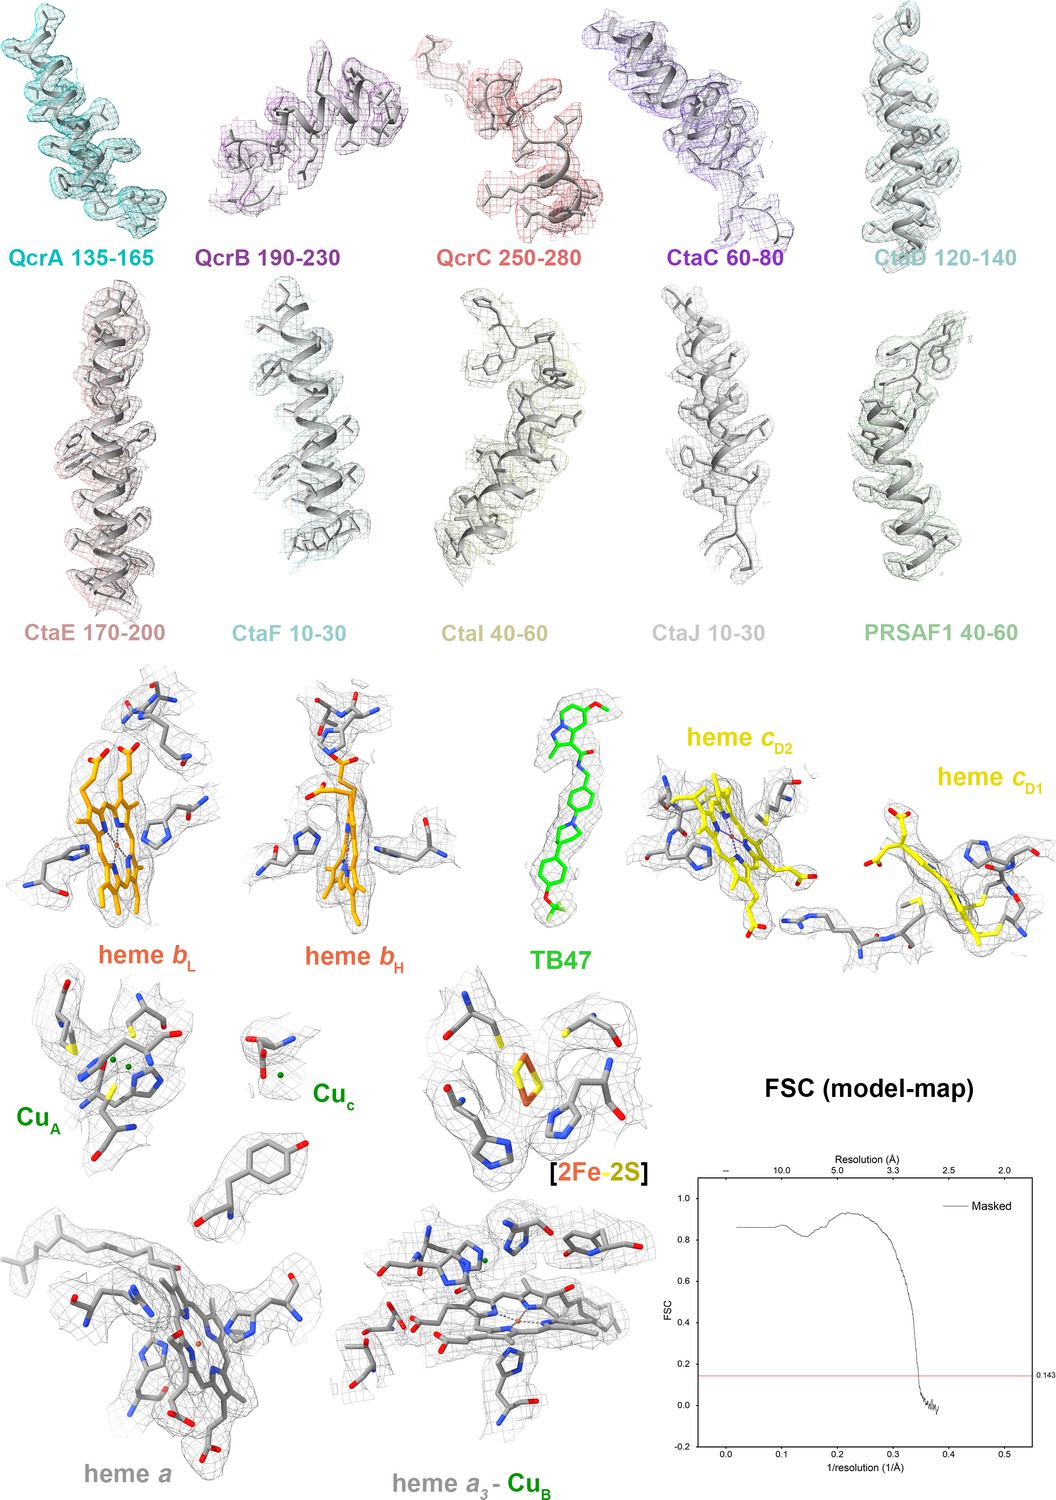
Figure 2—figure supplement 3
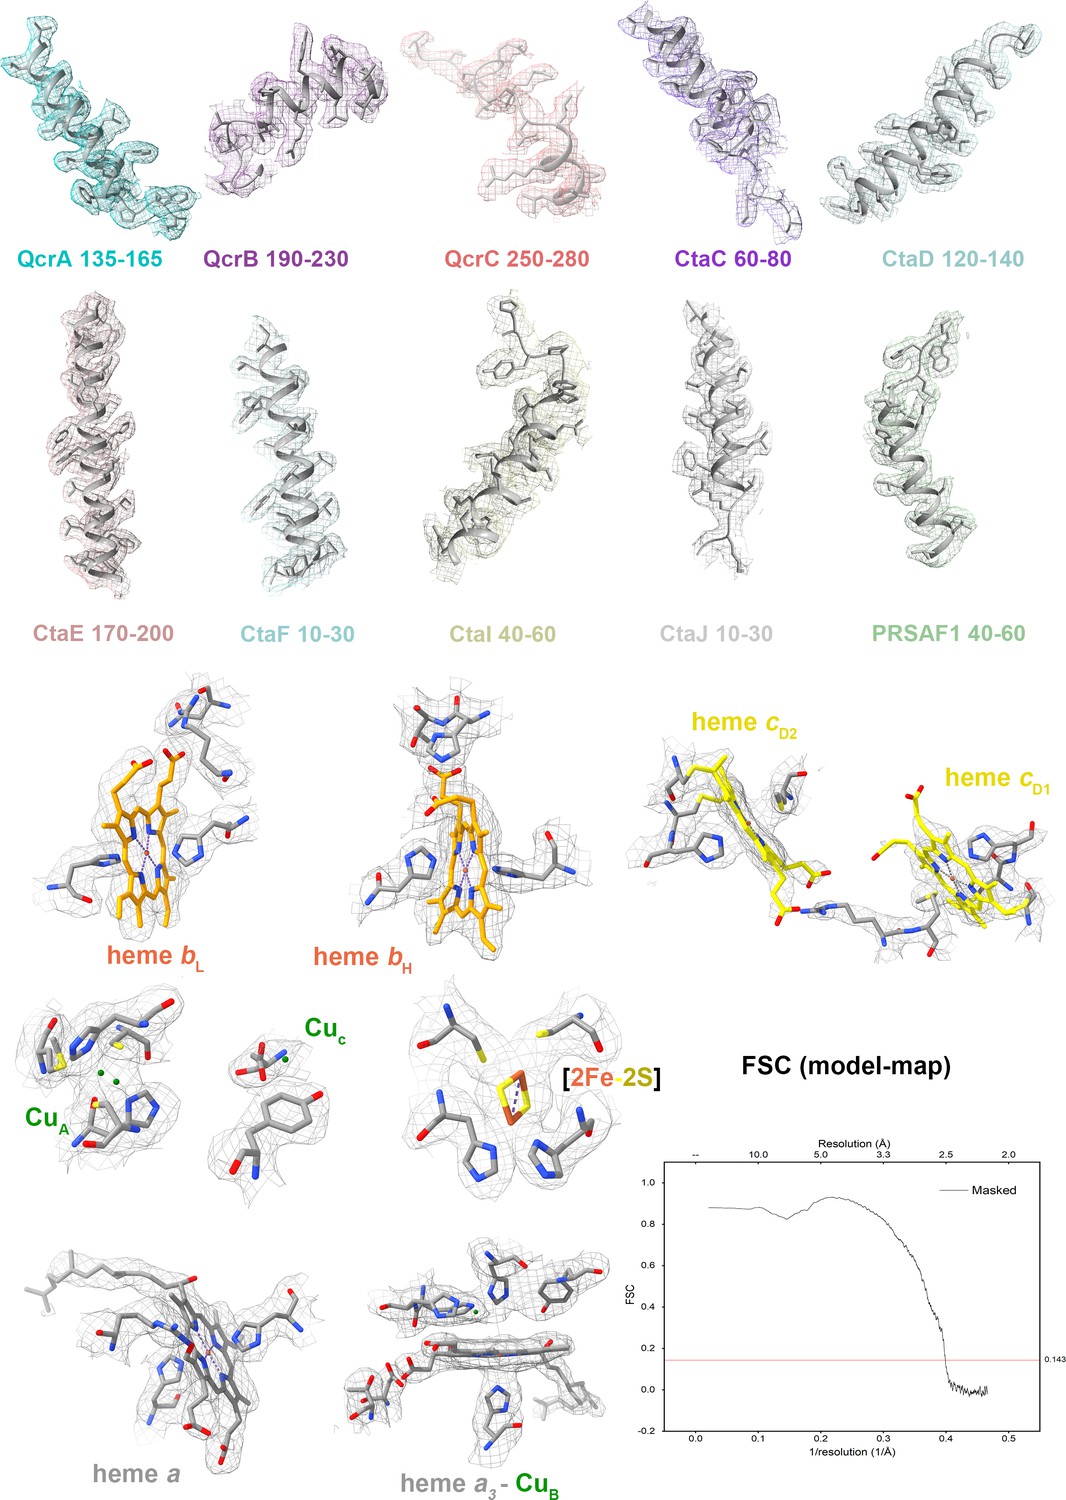
Cryo-electron microscopy (cryo-EM) map quality assessment of the hybrid supercomplex.
Representative cryo-EM densities of regions within individual subunits and prosthetic groups. Corresponding subunits with residues and prosthetic groups shown in cartoon representation or as stick models. Map-model Fourier shell correlation (FSC).
Figure 2—figure supplement 4
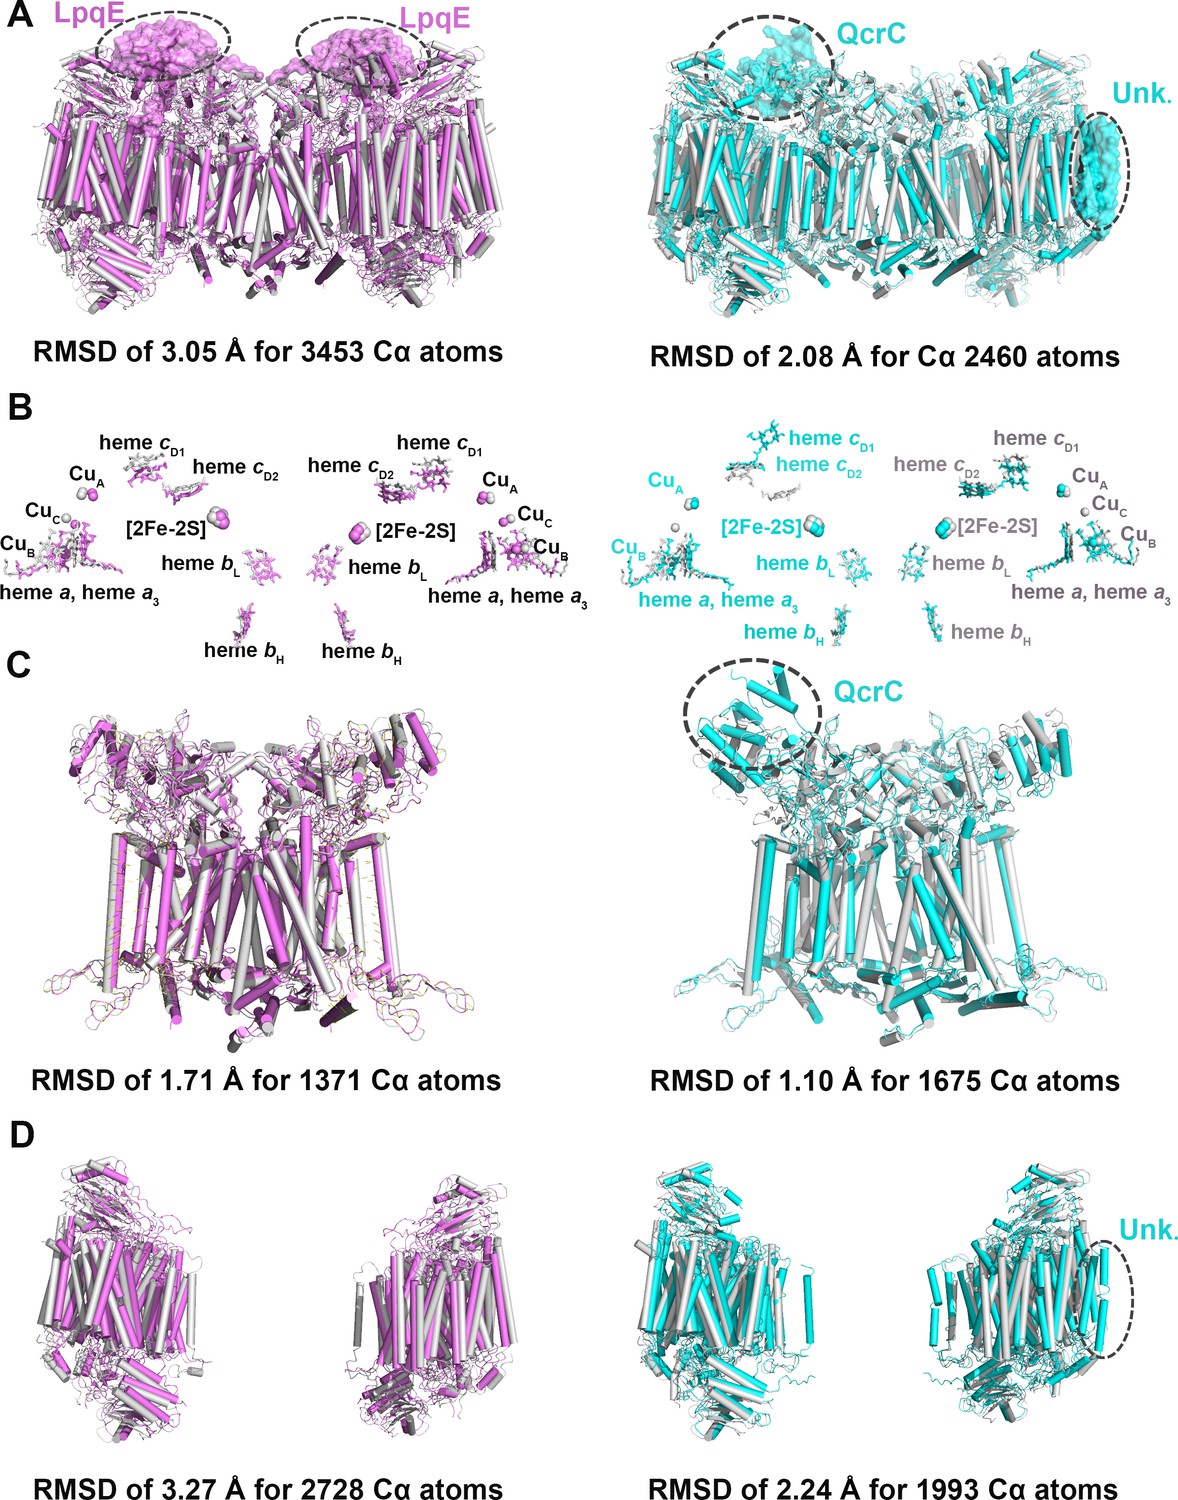
Structural comparison of the hybrid supercomplex III2IV2 and native CIII2CIV2 supercomplexes from M. smegmatis.
(A) Superimposition of the hybrid supercomplex III2IV2 (gray) and M. smegmatis CIII2CIV2 supercomplex shown in magenta (PDB 6ADQ) and cyan (PDB 6HWH), respectively. (B) Comparison of prosthetic groups after superimposition. (C) Comparison of CIII2, using the same color scheme as above. (D) Comparison of CIV, using the same color scheme as above.
Figure 2—figure supplement 5
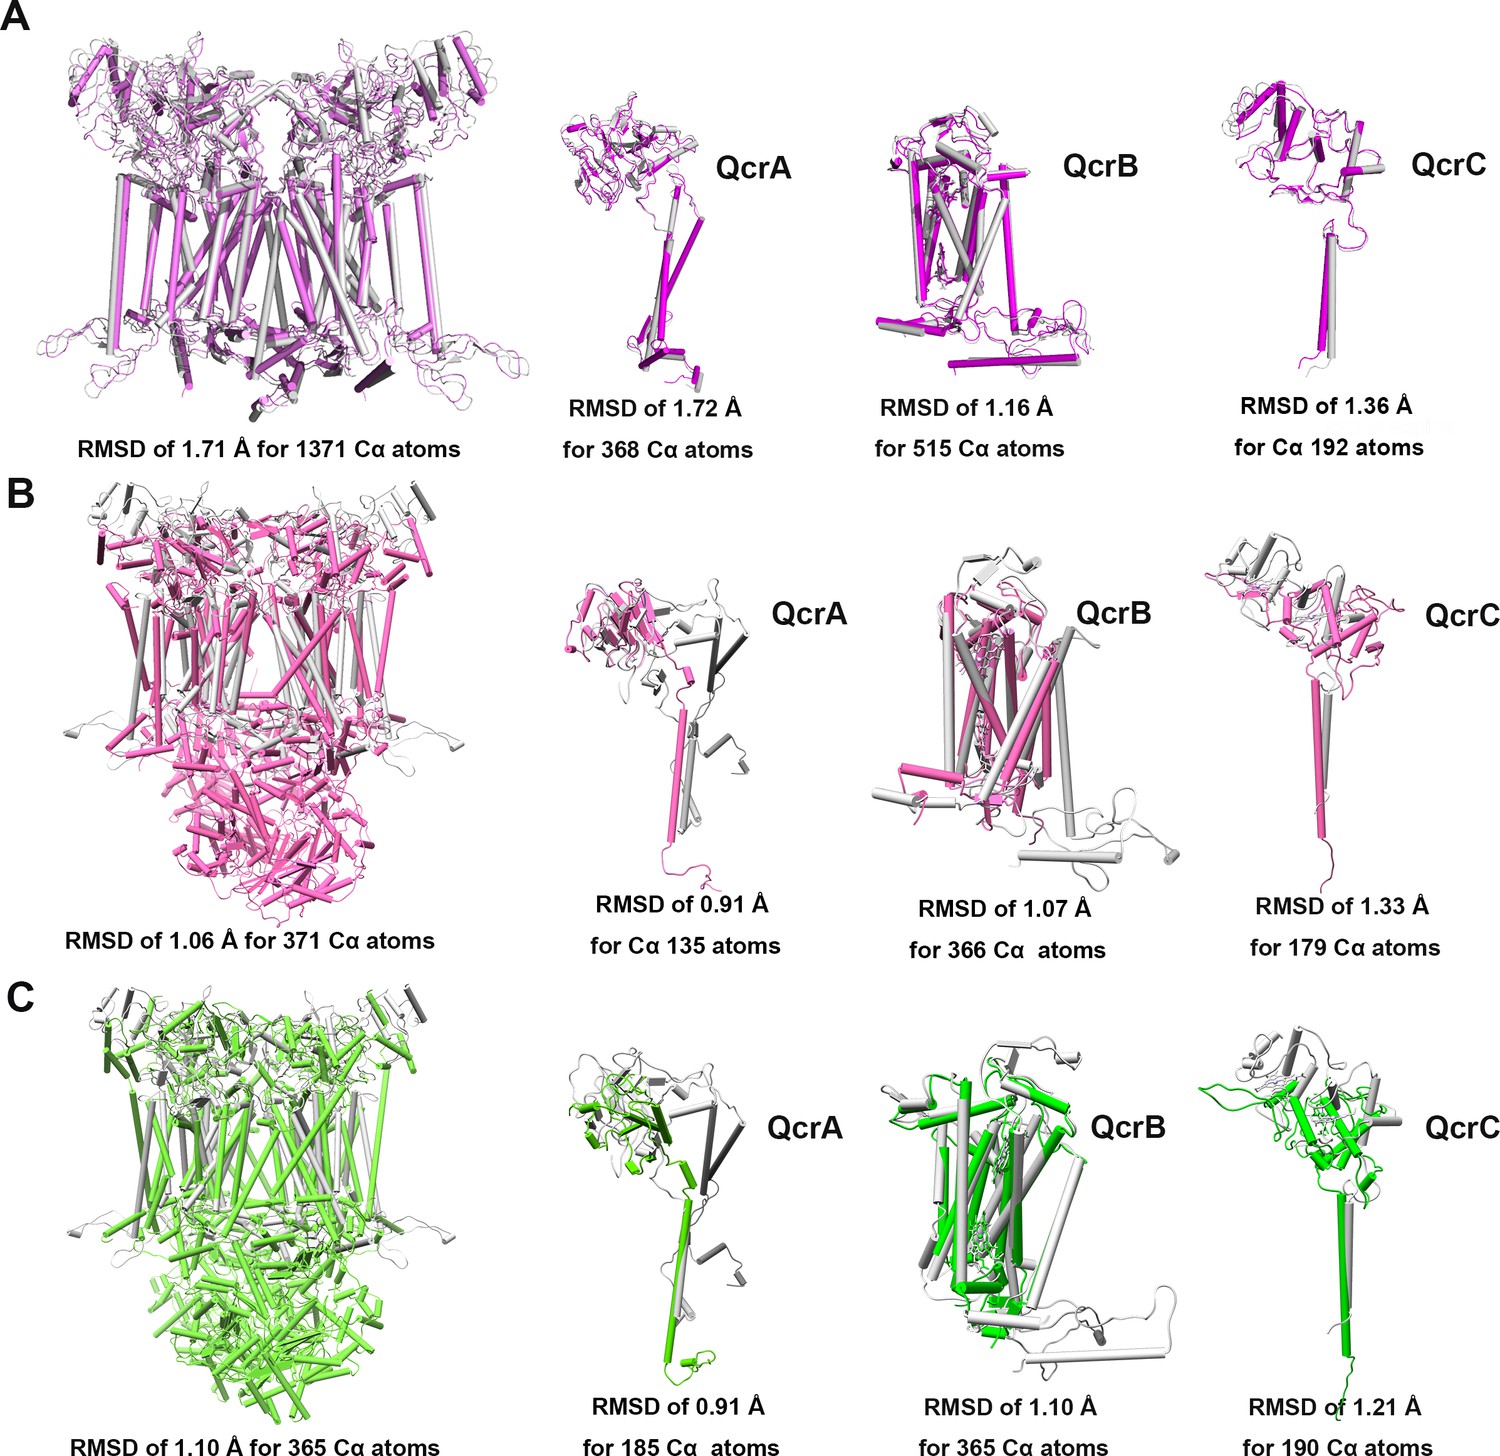
Structural alignment between M. tuberculosis CIII and equivalent CIIIs from other species.
These complexes are from M. tuberculosis (gray), M. smegmatis (violet, PDB: 6ADQ) (A), S. cerevisiae (pink, PDB: 1KYO) (B), and Homo sapiens (green; PDB: 5XTE) (C).
Figure 3 with 3 supplements

Structure of the M. tuberculosis cytochrome bcc subunits.
Cartoon representation of the monomers of (A) QcrA, (B) QcrB, and (C) QcrC, with prosthetic groups. (D) The QP-binding site and (E) QN-binding site. The residues potentially involved in the binding of MK/MKH2 are shown with side chains in stick model representation. MK/MKH2 have their carbon atoms in green and are represented as stick models. The [2Fe-2S] and heme groups are shown as spheres and labeled.
Figure 3—figure supplement 1
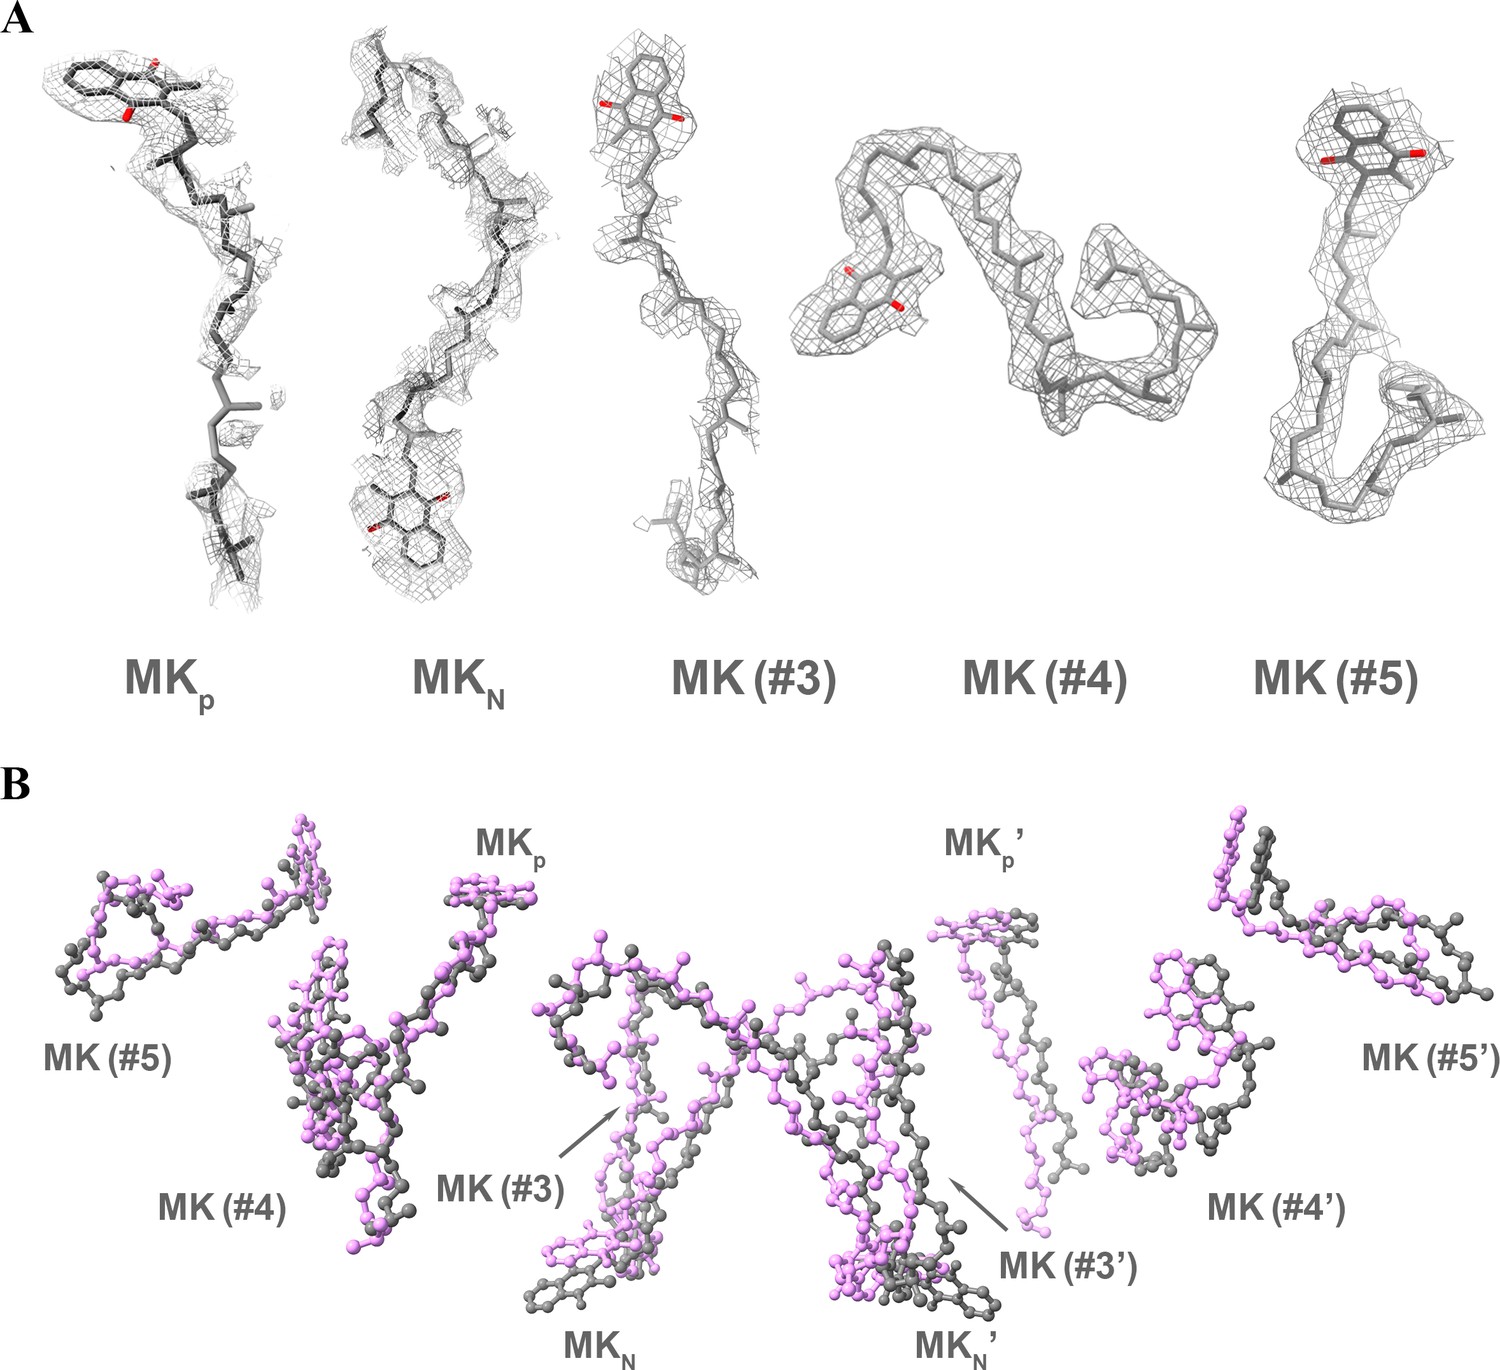
Identification and comparison of MK/MKH2 in the hybrid supercomplex.
Ten MK/MKH2 (gray) have been assigned according to the densities (A) and are in the same locations as observed in the M. smegmatis CIII2CIV2 supercomplex (magenta) (PDB 6ADQ) (B).
Figure 3—figure supplement 2
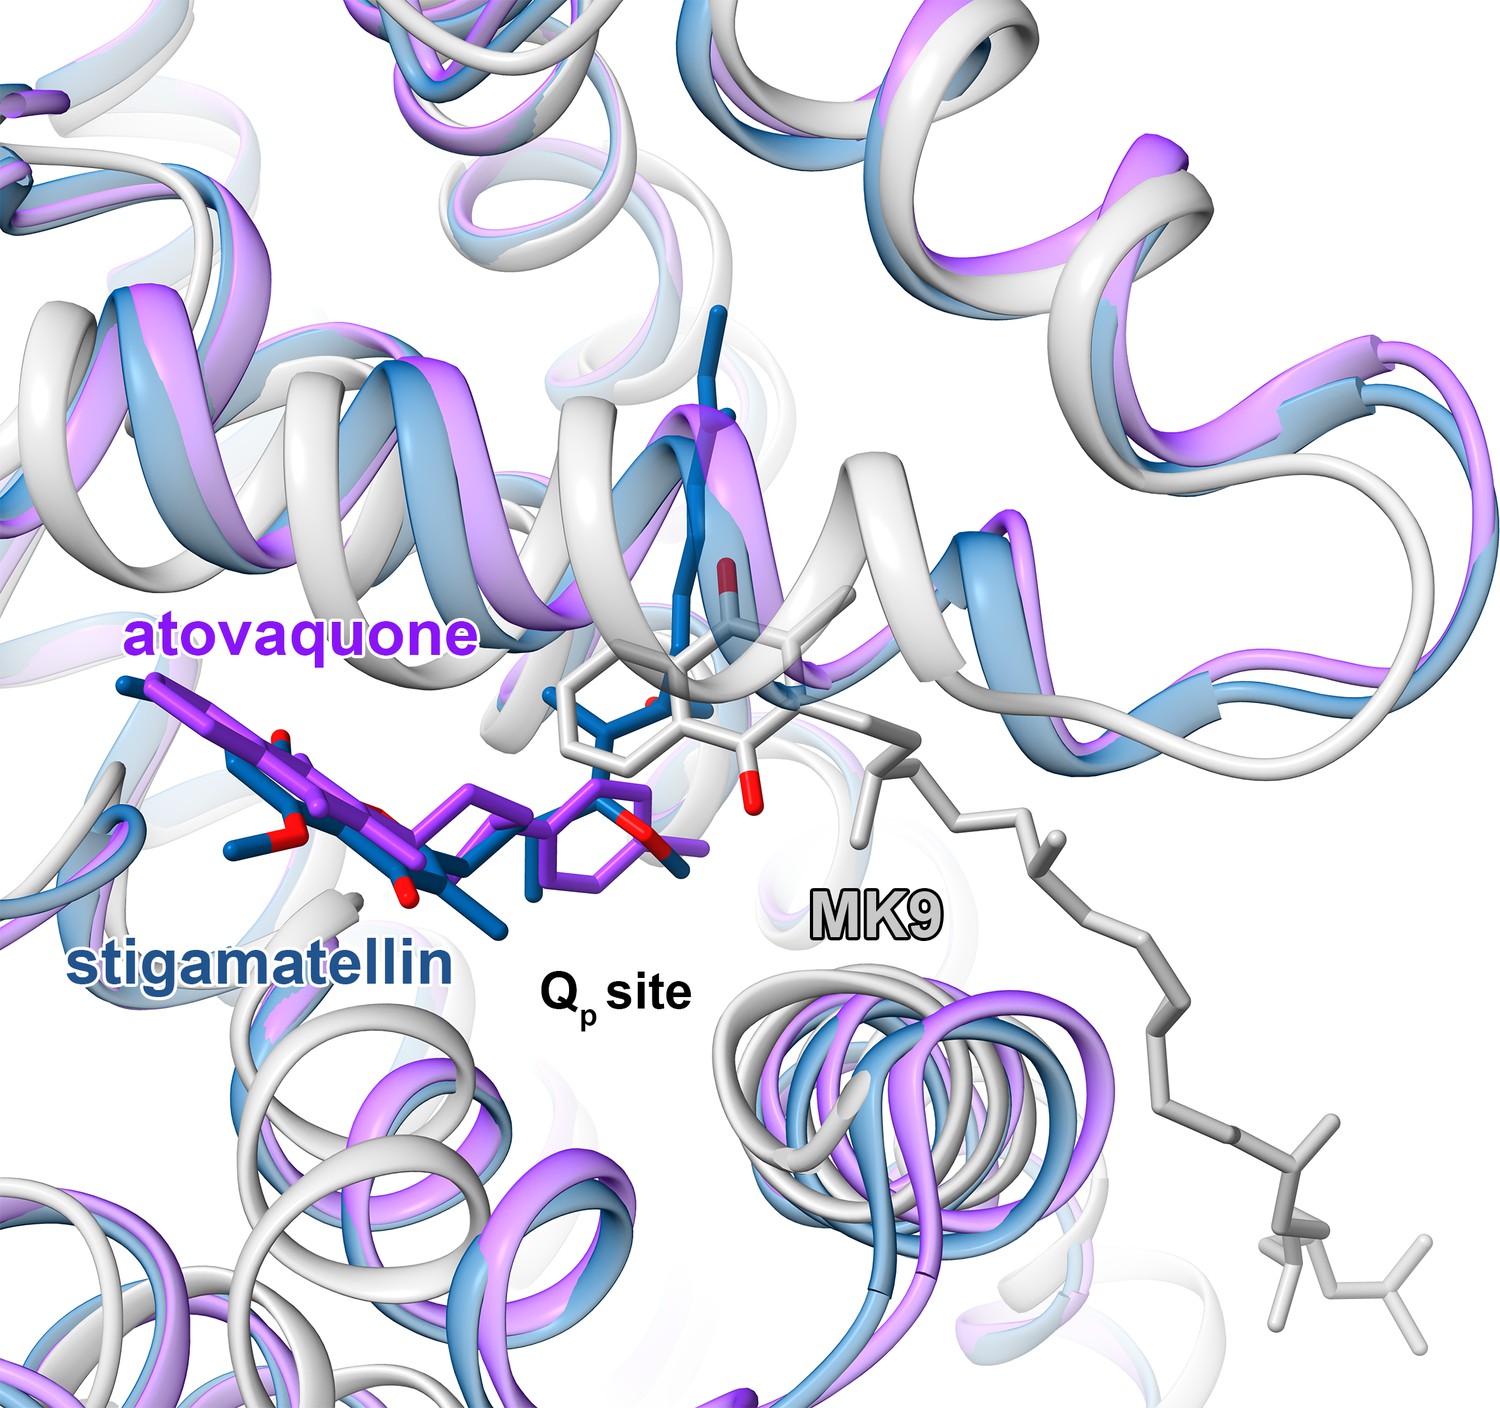
Comparison of M. tuberculosis CIII quinol-binding site (gray) with those from CIII from S. cerevisiae (PDB 3CX5) (blue) and (PDB 4PD4) (purple).
Figure 3—figure supplement 3
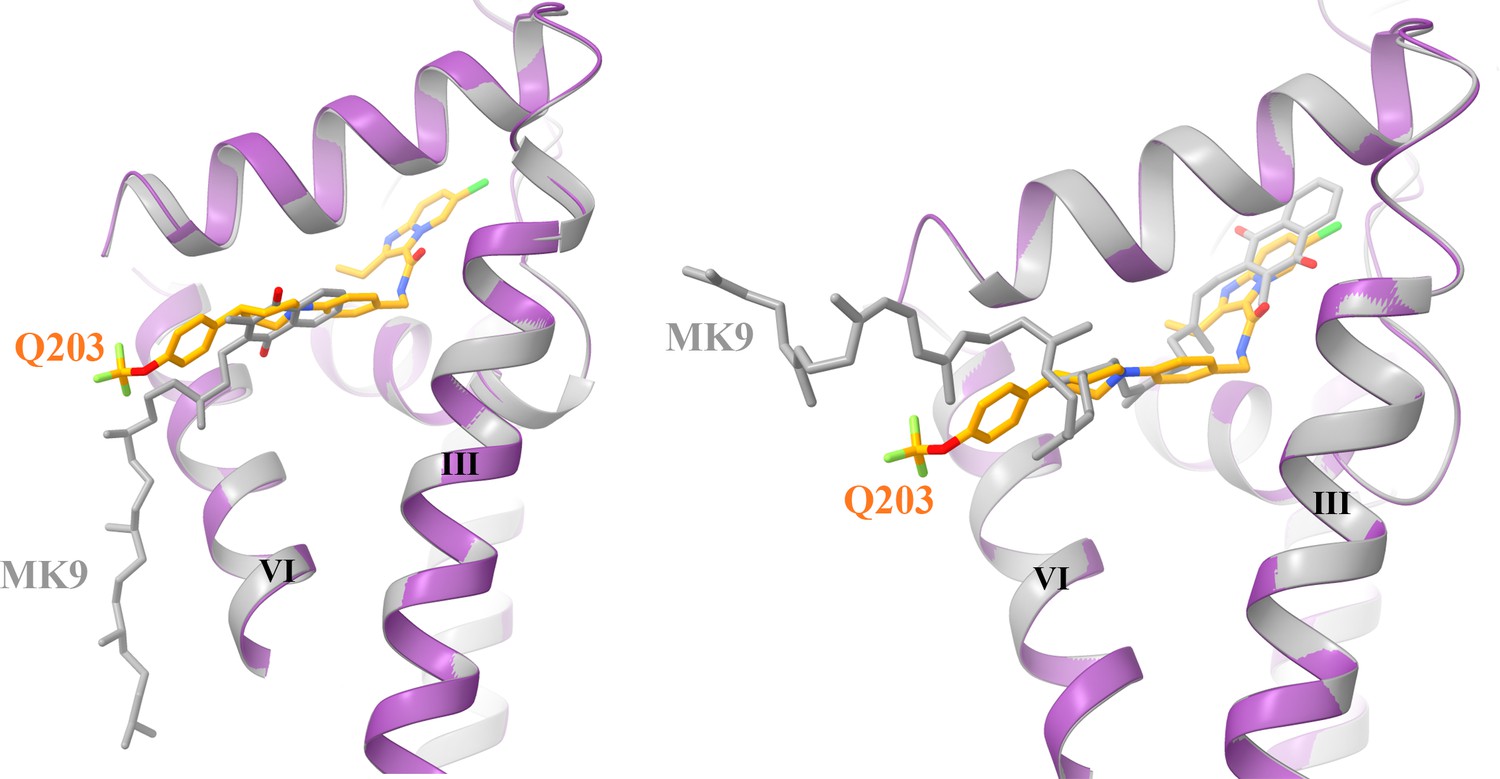
Structural superposition of native (left) and docked (right) MK9 with the Q203 in the Qp site.
The QcrB is extracted from the hybrid supercomplex with Q203 (purple) and MK9 (gray) bound is shown in cartoon representation.
Figure 4 with 5 supplements
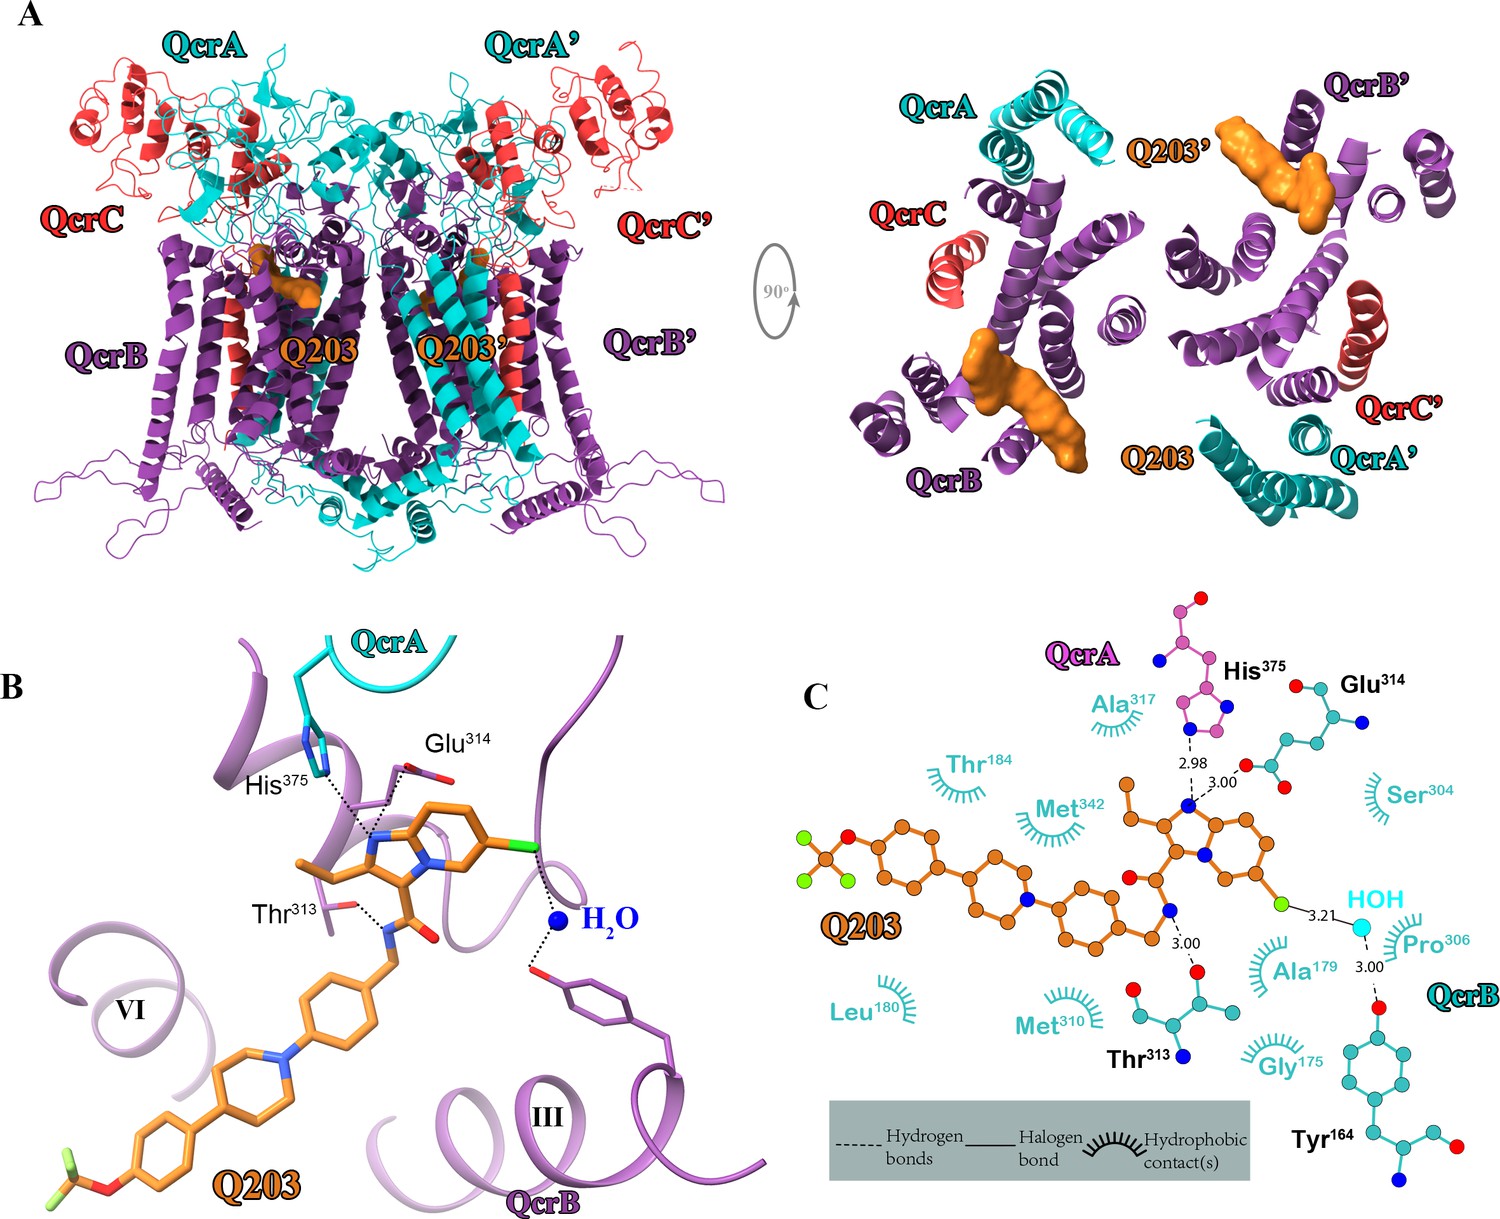
Cryo-electron microscopy (cryo-EM) structure of the hybrid supercomplex in the presence of Q203.
(A) Side (left) and top (right) views of the cryo-EM structure of the M. tuberculosis cytochrome bcc complex presented as a cartoon representation. Q203 (orange) is bound to the Qp site. (B) Visualization of densities for Q203. Hydrogen bonds are shown as dotted lines. (C) Plot of distances of various parts of Q203 to residues in the Qp site as determined using LIGPLOT (https://www.ebi.ac.uk/thornton-srv/software/LIGPLOT/).
Figure 4—figure supplement 1
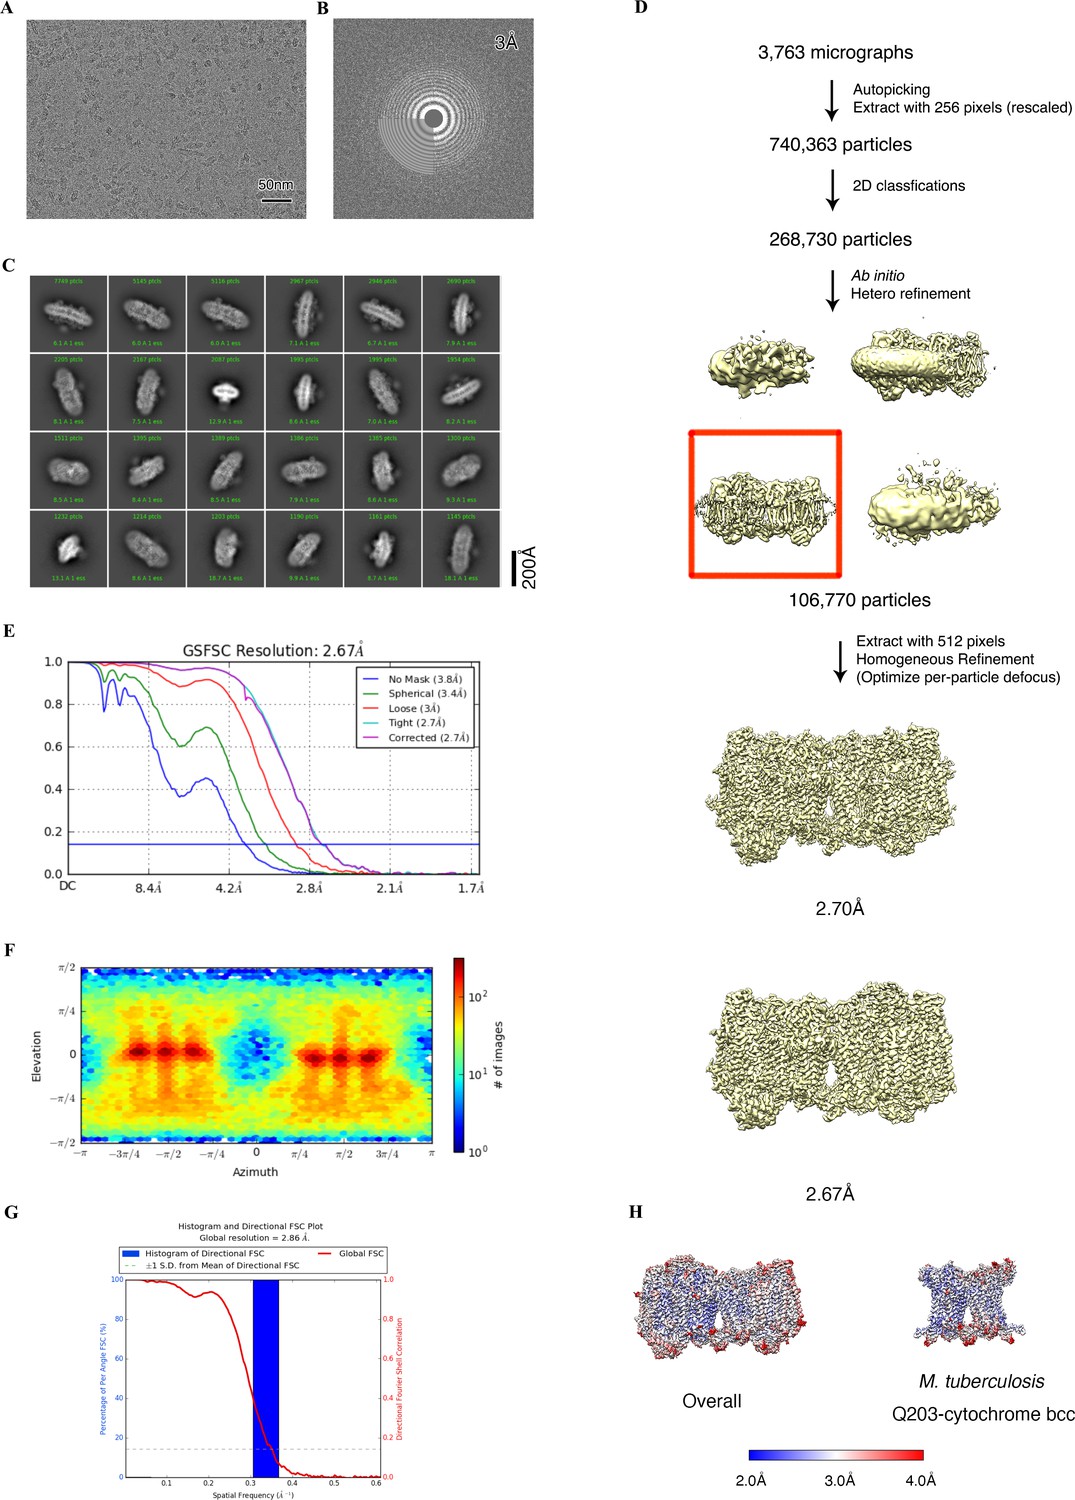
Cryo-electron microscopy (cryo-EM) data processing of the hybrid supercomplex consisting of M. tuberculosis CIII and M. smegmatis CIV in the presence of Q203.
(A) Representative electron micrograph of the cryo-EM sample. (B) CTF fit of motion-corrected micrographs (C) Representative 2D classification averages calculated from selected particles. (D) Workflow of data processing for the Q203-bound hybrid supercomplex. (E) Fourier shell correlation (FSC) curves of 3D reconstructions. (F) Viewing direction of all particles used in the final 3D reconstruction. (G) 3D FSC histogram of final map. (H) The overall and Mtb cytochrome bcc maps, colored according to the local resolution.
Figure 4—figure supplement 2
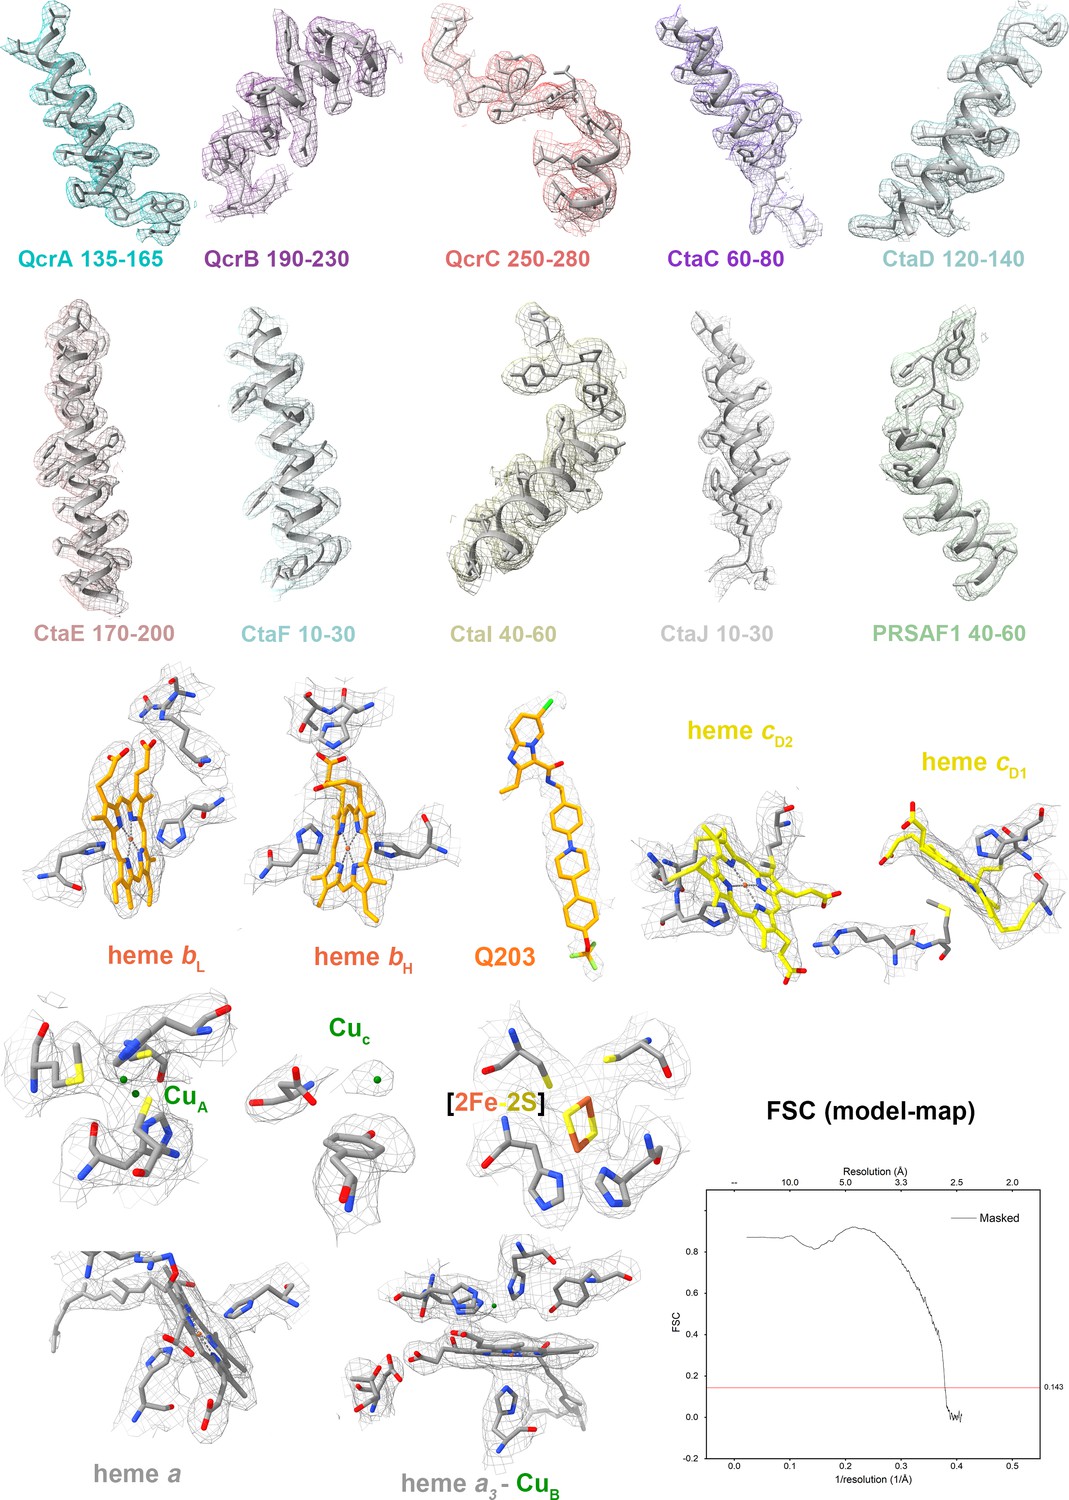
Cryo-electron microscopy (cryo-EM) map quality assessment of M. tuberculosis cytochrome bcc complex.
Representative cryo-EM densities and structures of individual subunits, prosthetic groups, and inhibitors. Map-model Fourier shell correlation (FSC).
Figure 4—figure supplement 3
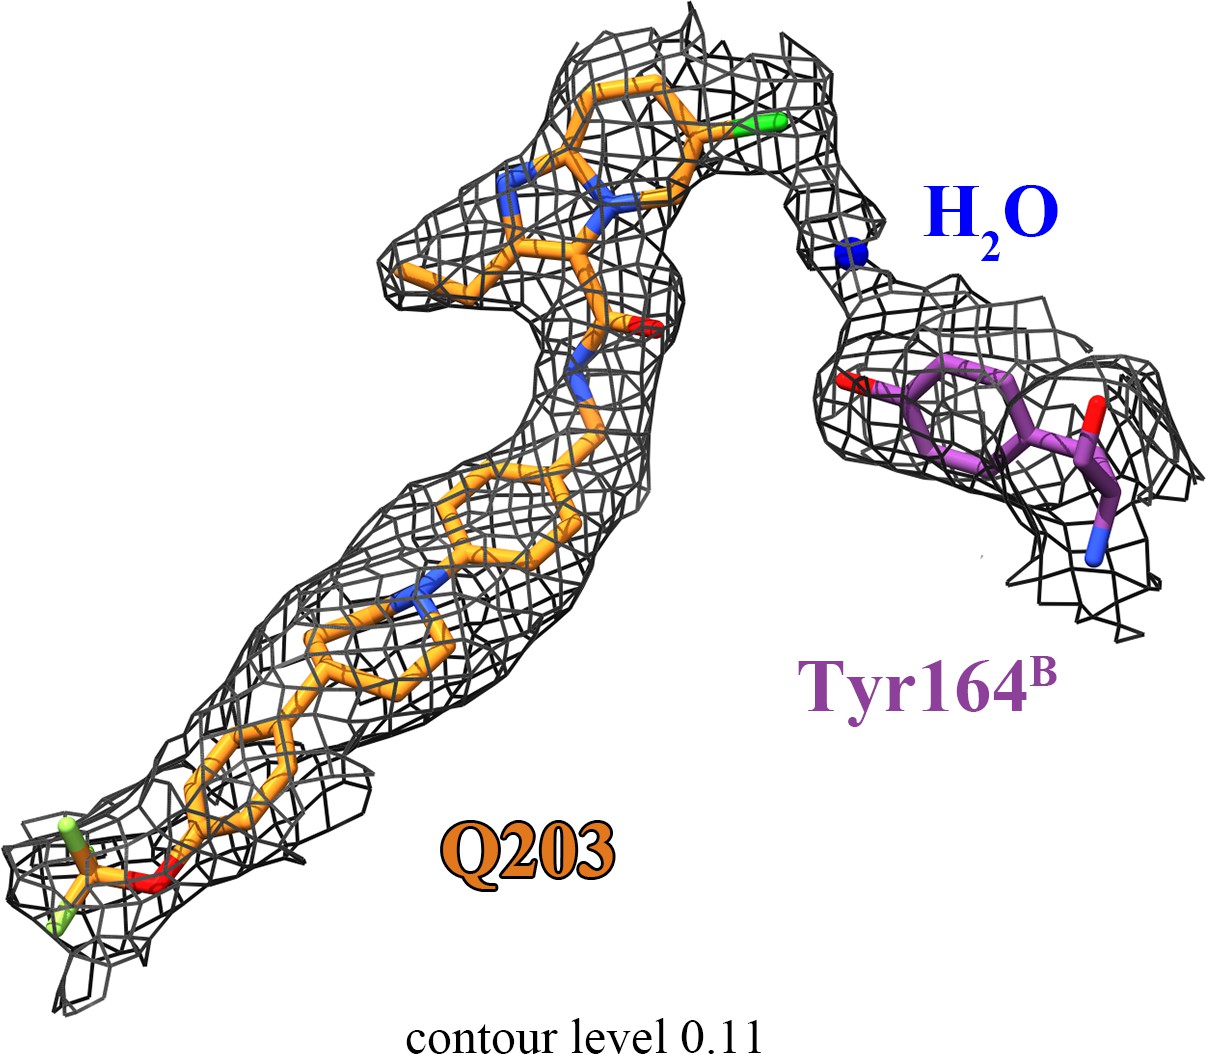
The densities for Q203, H2O, and QcrBTyr164.
Continuous density is observed between the head of Q203, a likely bridging water molecule, and the side chain of QcrBTyr164.
Figure 4—figure supplement 4
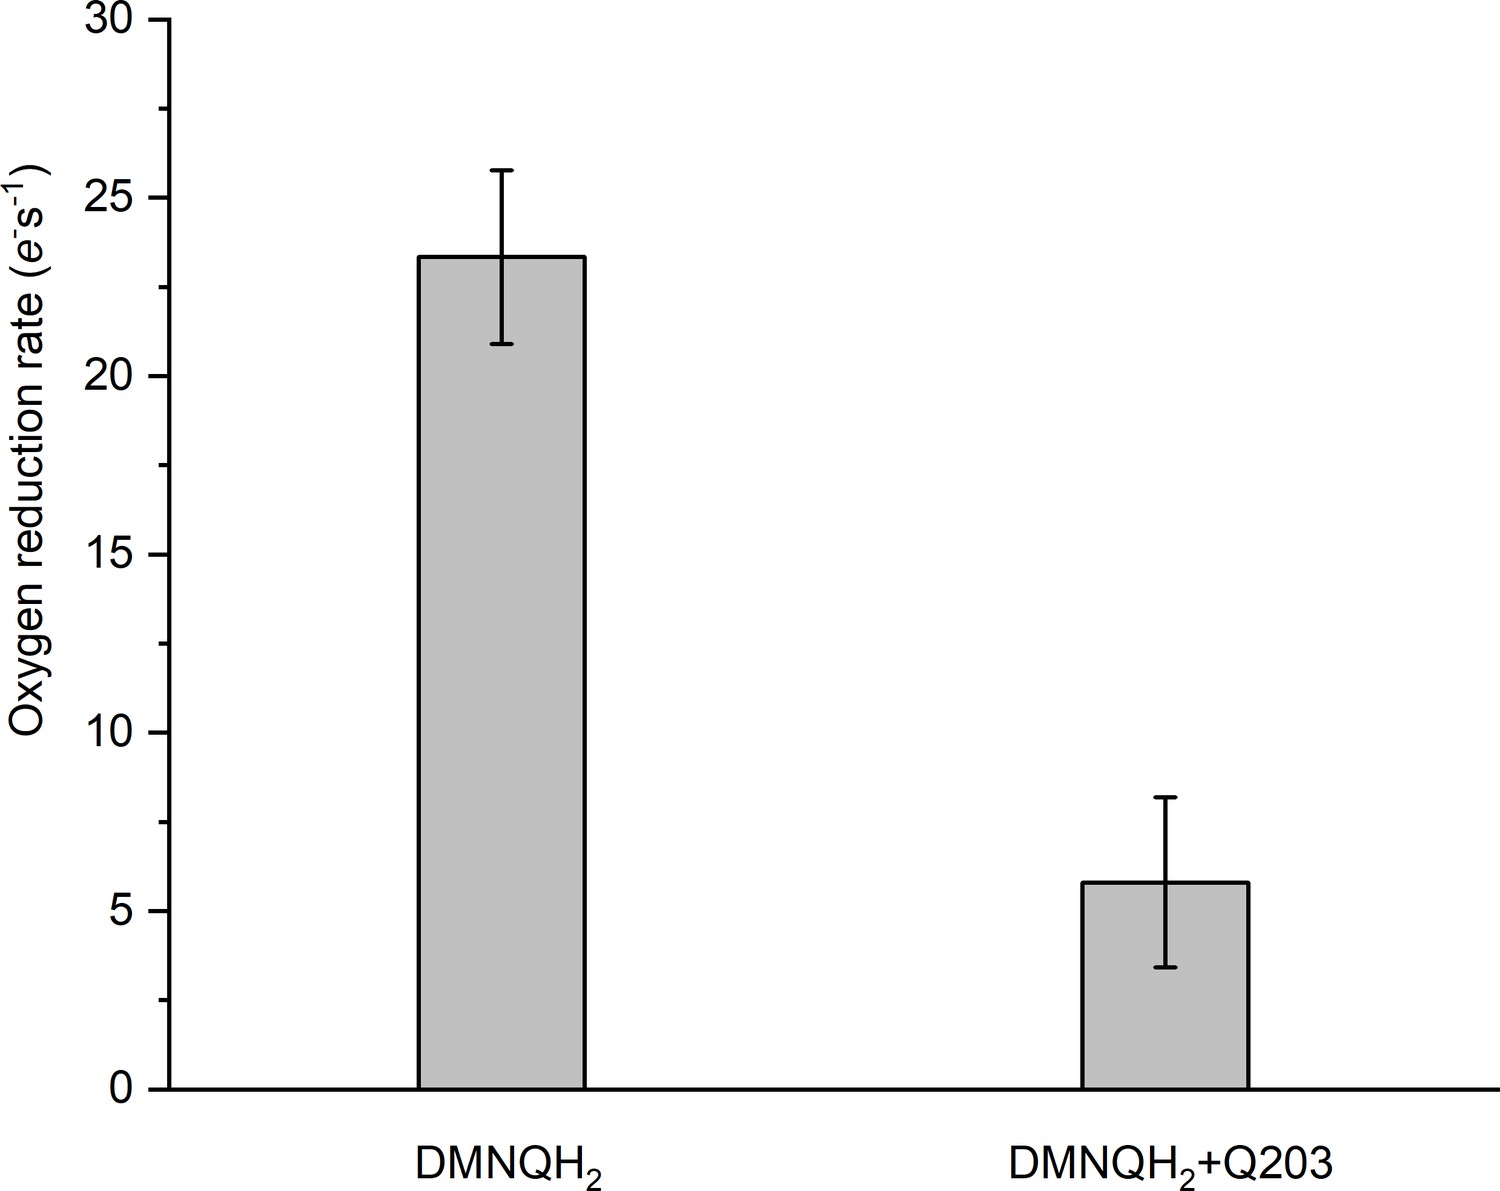
Rate of O2 reduction by the hybrid supercomplex before and after addition of Q203.
Data shown are mean ± SD; n = 4 measurements.
-
Figure 4—figure supplement 4—source data 1
Oxygen consumption of the hybrid supercomplex after addition of Q203 measures using Clark-type oxygen electrode.
- https://cdn.elifesciences.org/articles/69418/elife-69418-fig4-figsupp4-data1-v1.xlsx
Figure 4—figure supplement 5
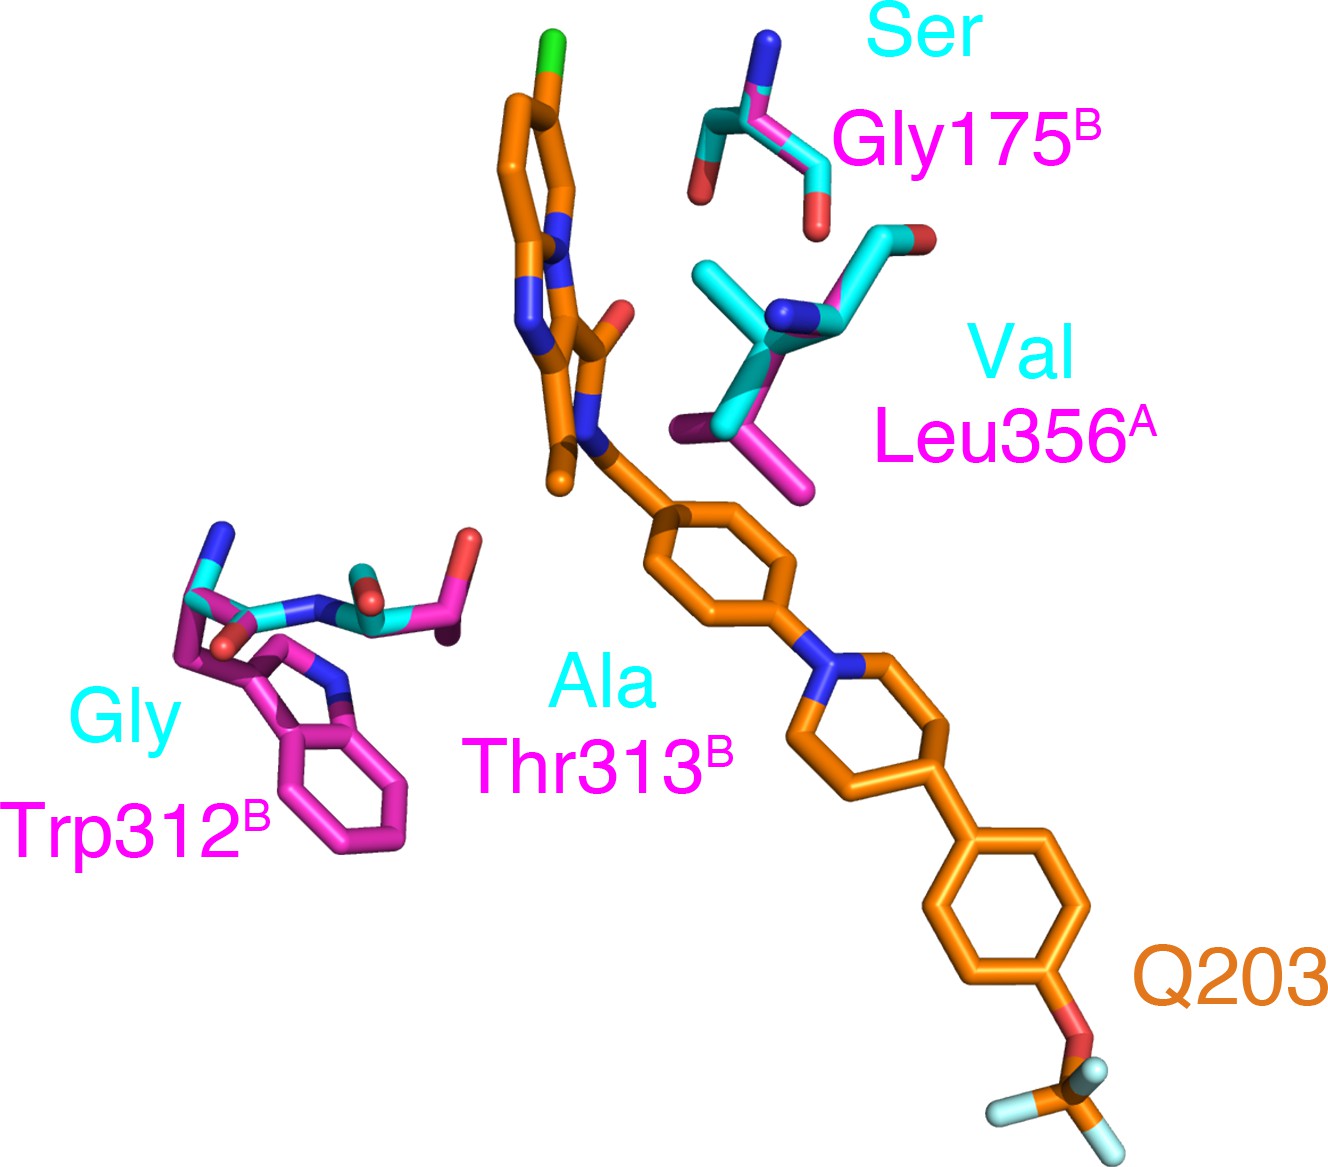
Reported mutations in Q203-resistant M. tuberculosis.
The native and mutant residues are colored magenta and cyan, respectively.
Figure 5 with 5 supplements

Cryo-electron microscopy (cryo-EM) structure of the hybrid supercomplex in the presence of TB47.
(A) Side (left) and top (right) views of the cryo-EM structure of the M. tuberculosis cytochrome bcc complex presented as a cartoon representation. TB47 (green) and Q203 (orange) are bound to the Qp site. (B) Visualization of the density for TB47. Hydrogen bonds are shown as dotted lines. (C) Plot of distances of various parts of TB47 to residues in the Qp site were determined using LIGPLOT (https://www.ebi.ac.uk/thornton-srv/software/LIGPLOT/).
Figure 5—figure supplement 1
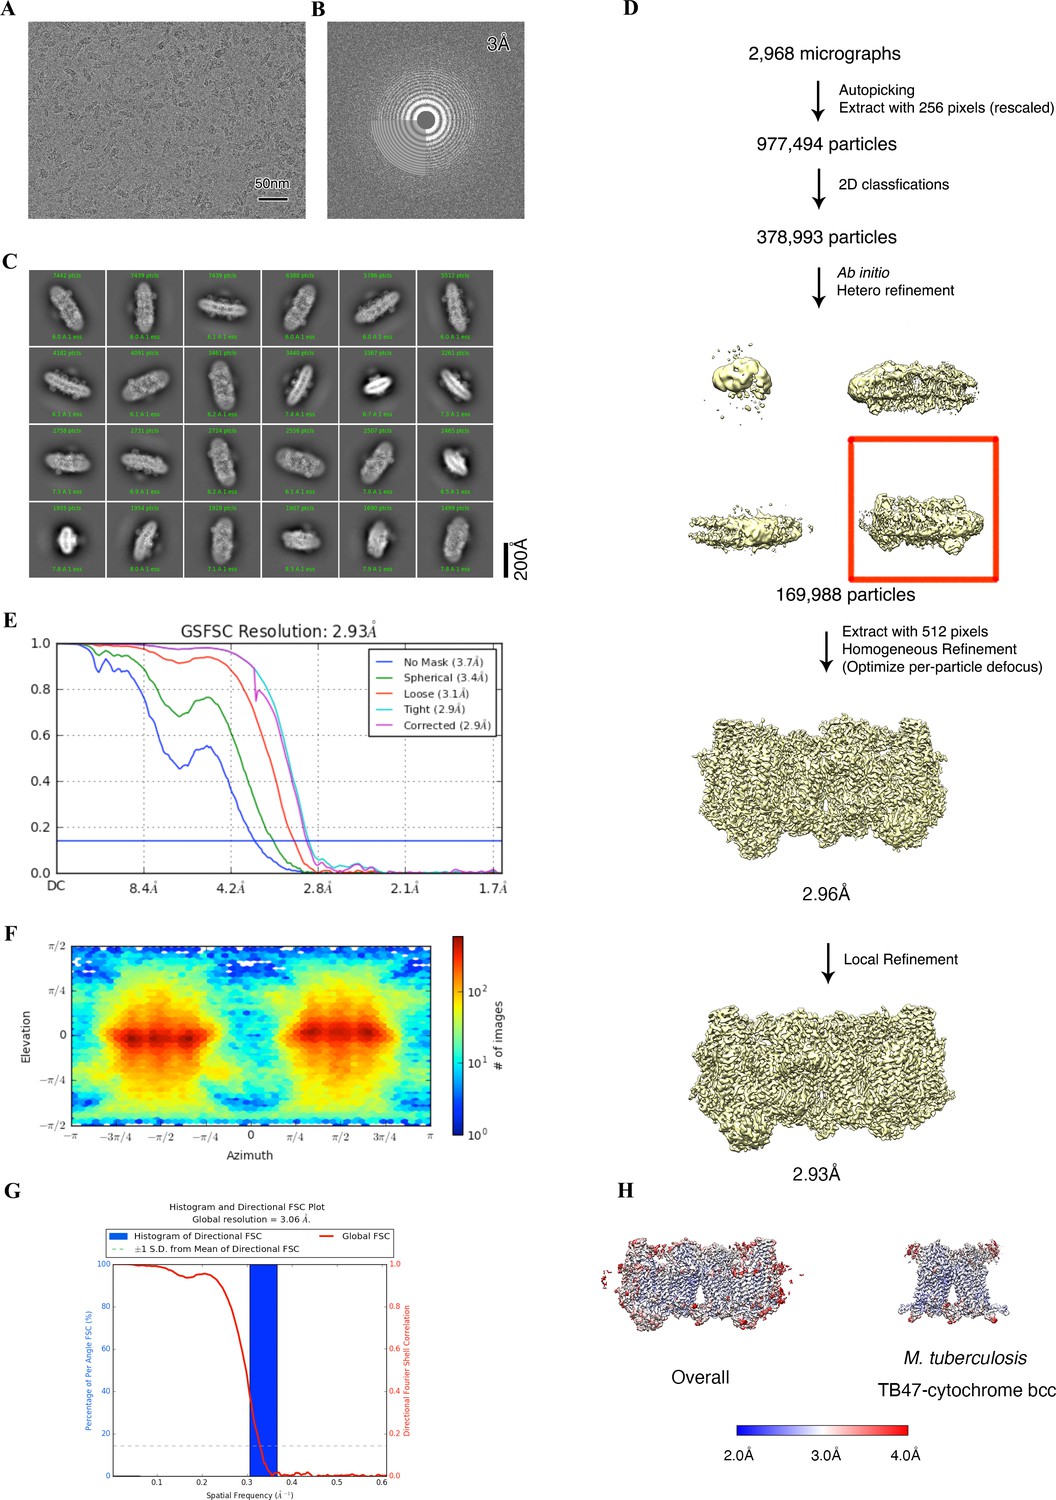
Cryo-electron microscopy (cryo-EM) data processing of the hybrid supercomplex consisting of M. tuberculosis CIII and M. smegmatis CIV in the presence of TB47.
(A) Representative electron micrograph of the cryo-EM sample. (B) CTF fit of motion-corrected micrographs (C) Representative 2D classification averages calculated from selected particles. (D) Workflow of the data processing for the TB47-bound hybrid supercomplex. (E) Fourier shell correlation (FSC) curves of 3D reconstructions. (F) Viewing direction of all particles used in the final 3D reconstruction. (G) 3D FSC histogram of final map. (H) The overall and M. tuberculosis cytochrome bcc maps, colored according to the local resolution.
Figure 5—figure supplement 2
Cryo-electron microscopy (cryo-EM) map quality assessment for the hybrid M. tuberculosis cytochrome bcc complex.
Representative cryo-EM densities and structures of individual subunits, prosthetic groups, and inhibitors. Map-model Fourier shell correlation (FSC).
Figure 5—figure supplement 3
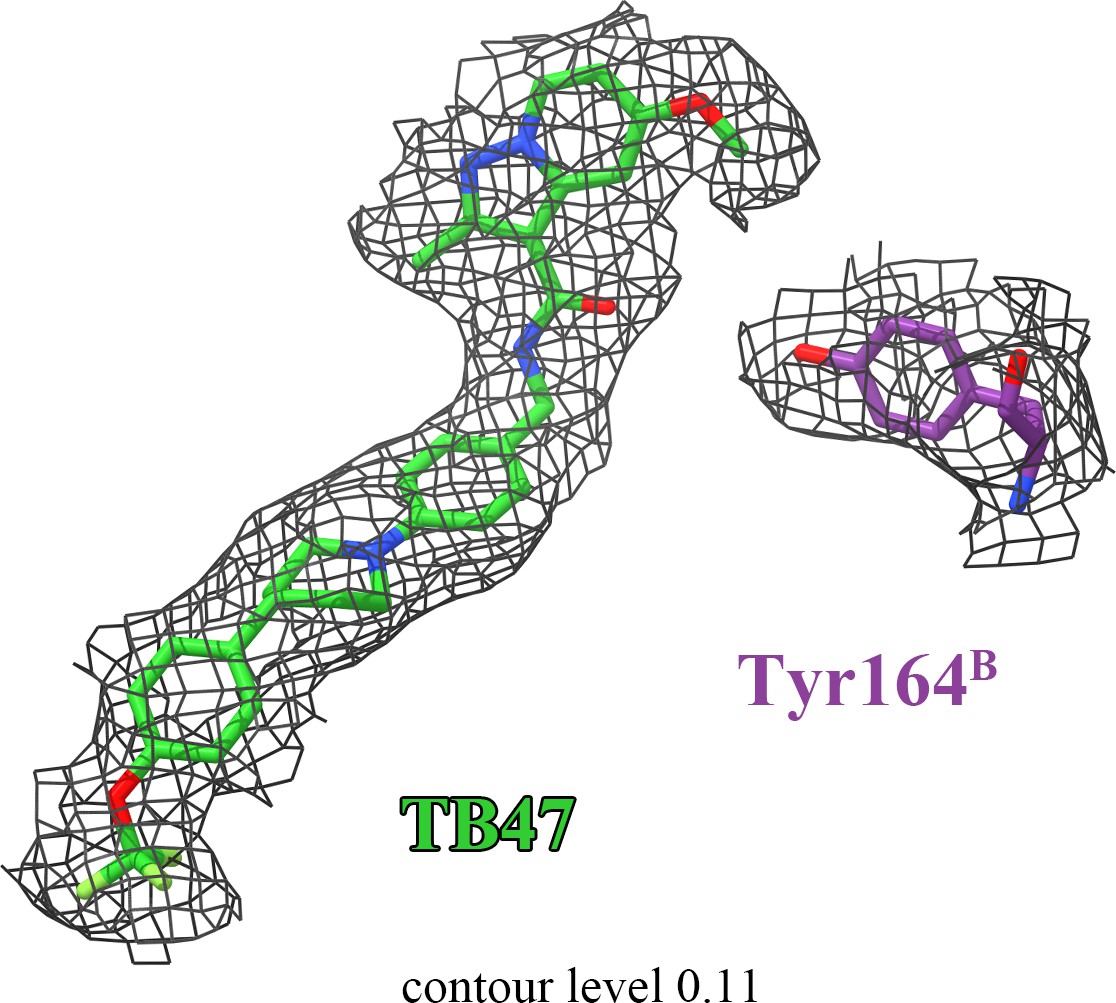
The densities for TB47 and QcrBTyr164.
There is no density linking TB47 and QcrBTyr164.
Figure 5—figure supplement 4
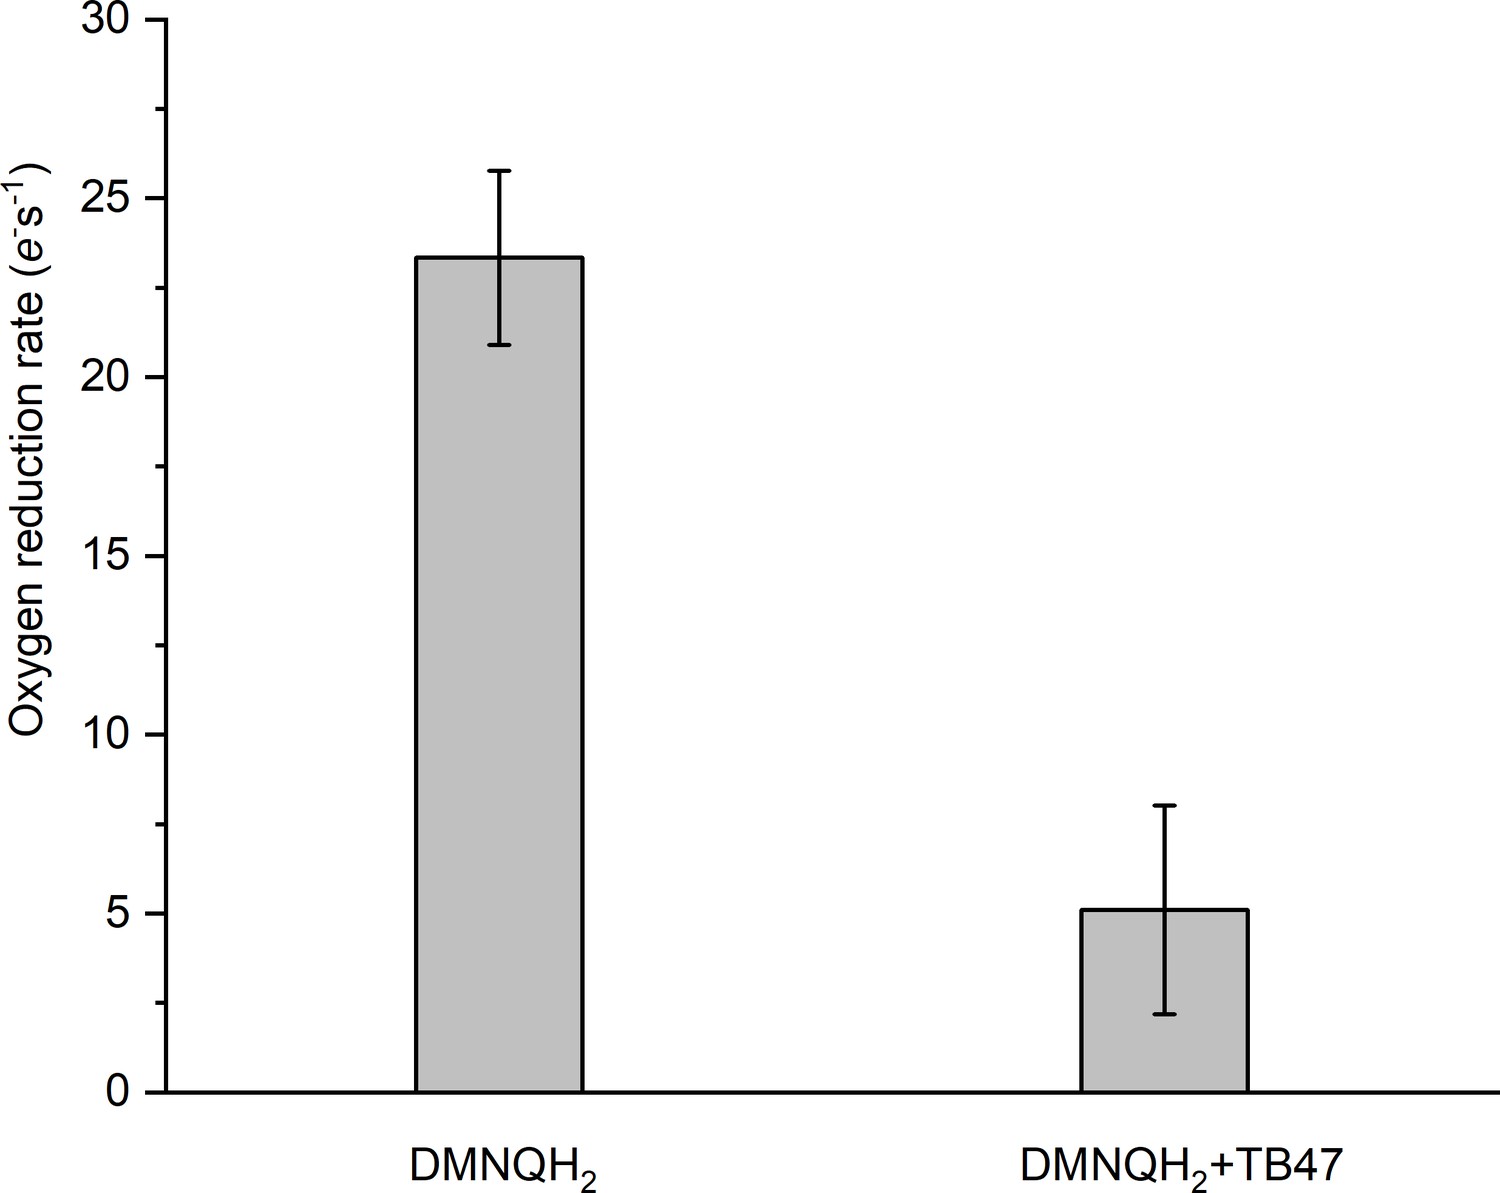
Rate of O2 reduction by the hybrid supercomplex before and after addition of TB47.
Data shown are mean ± SD; n = 4 measurements.
-
Figure 5—figure supplement 4—source data 1
Oxygen consumption of the hybrid supercomplex after addition of TB47 measures using Clark-type oxygen electrode.
- https://cdn.elifesciences.org/articles/69418/elife-69418-fig5-figsupp4-data1-v1.xlsx
Figure 5—figure supplement 5
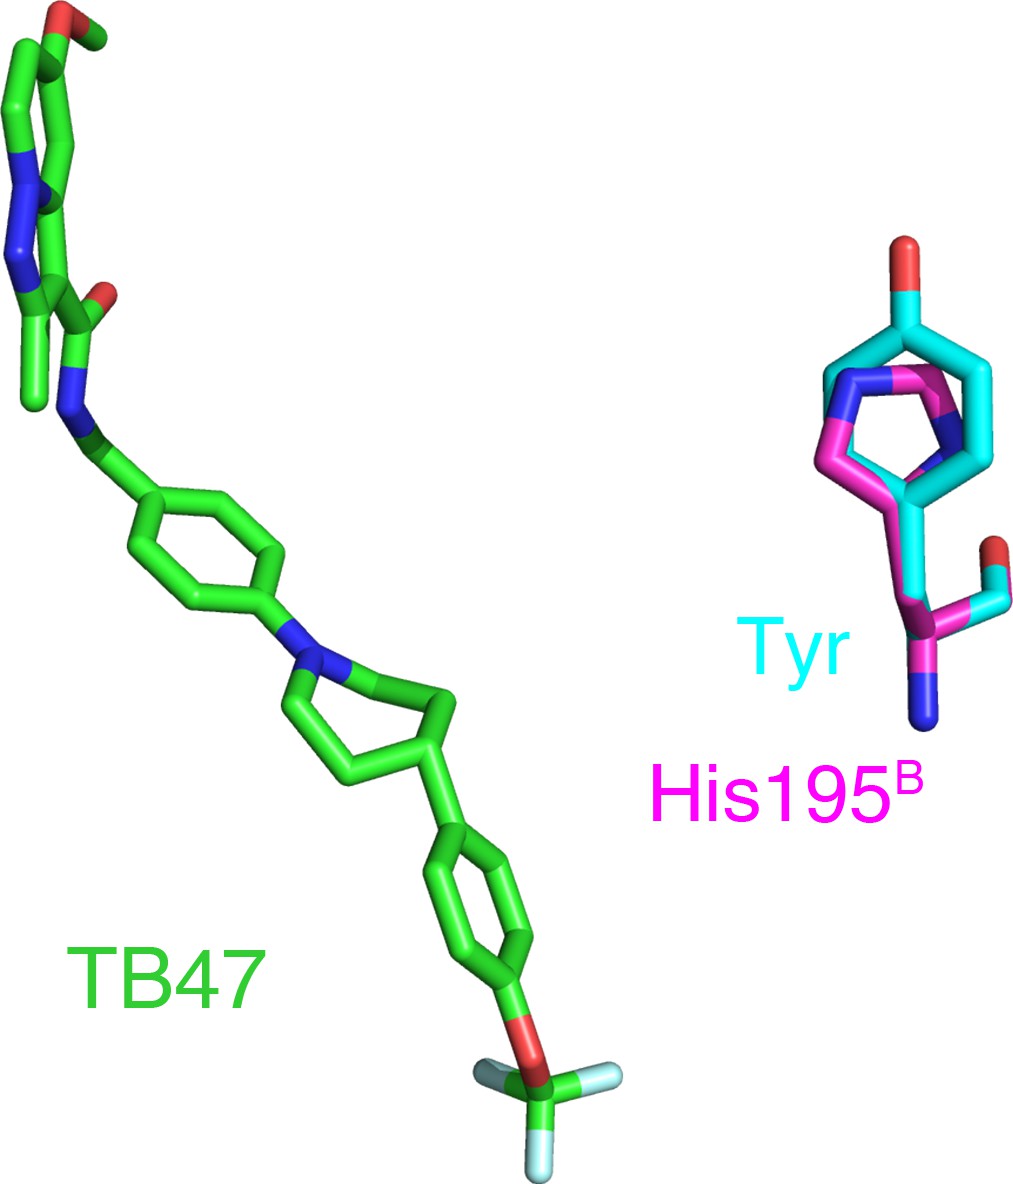
Reported mutations in TB47-resistant M. tuberculosis.
The native and mutant residues are colored magenta and cyan, respectively.
Figure 6 with 2 supplements
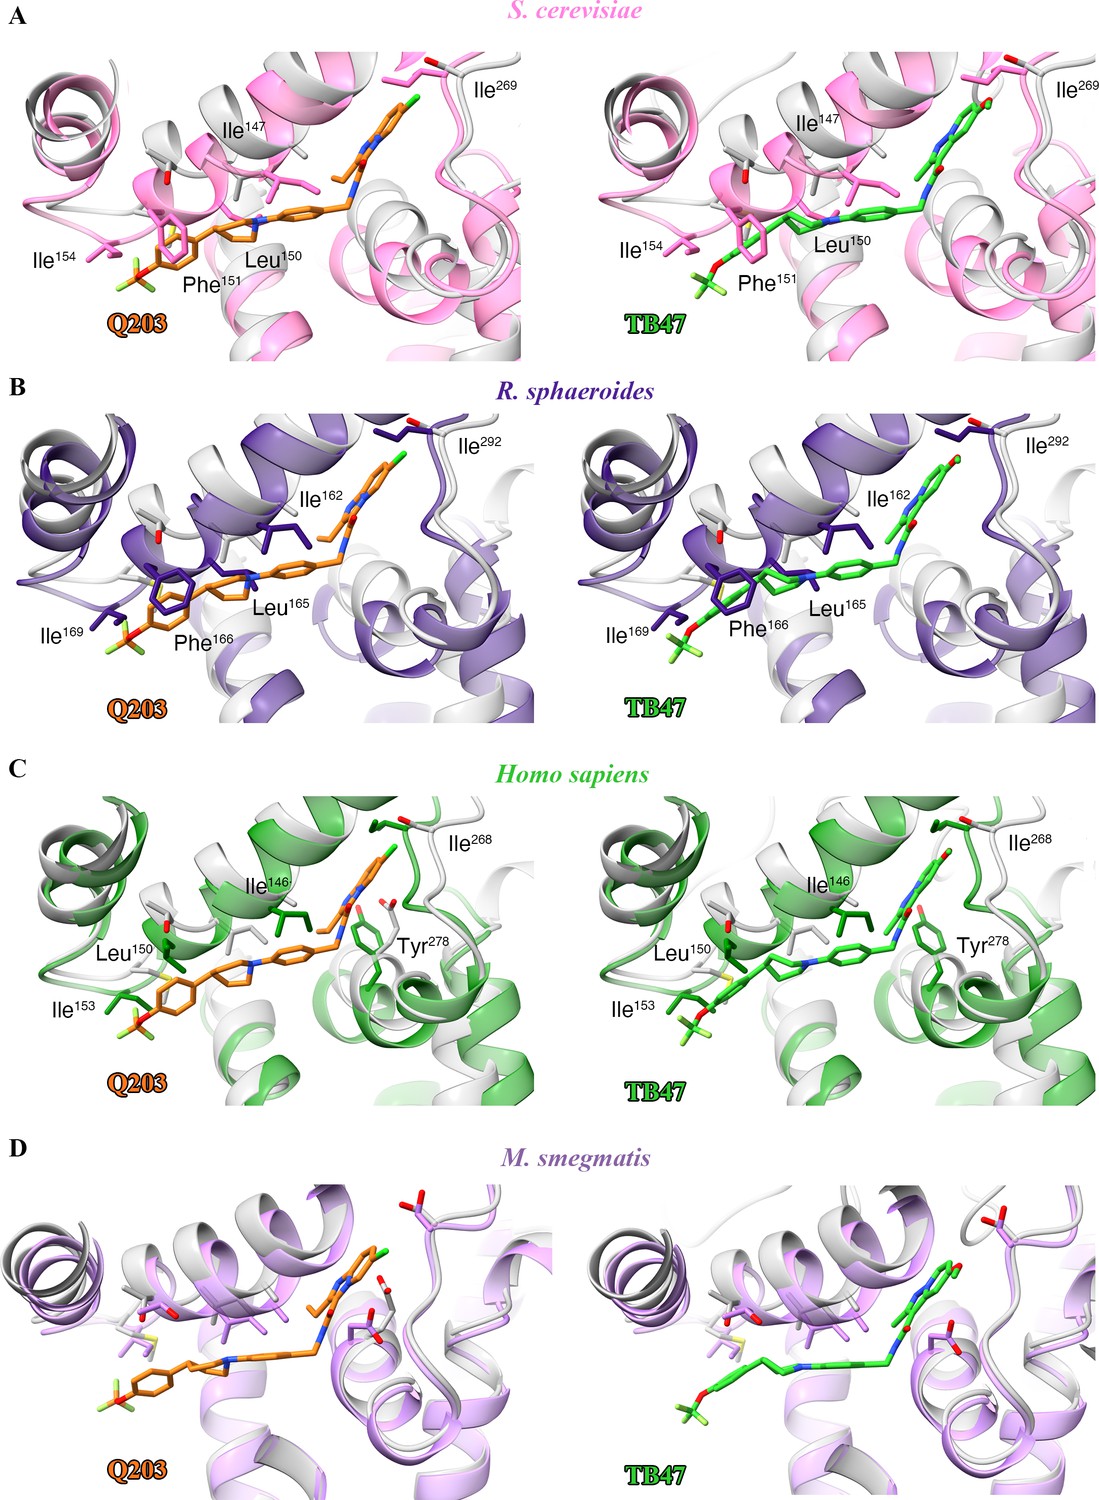
Structural alignment between the M. tuberculosis Qp-binding pocket where Q203 or TB47 binds with homologous subunits from four other species.
These subunits are from (A) S. cerevisiae (pink, PDB: 1KYO), (B) R. sphaeroides (blue, PDB: 2QJP), (C) Homo sapiens (green; PDB: 5XTE), and (D) M. smegmatis (violet, PDB: 6ADQ). Residues causing steric clashes in the homologous subunits are labeled.
Figure 6—figure supplement 1
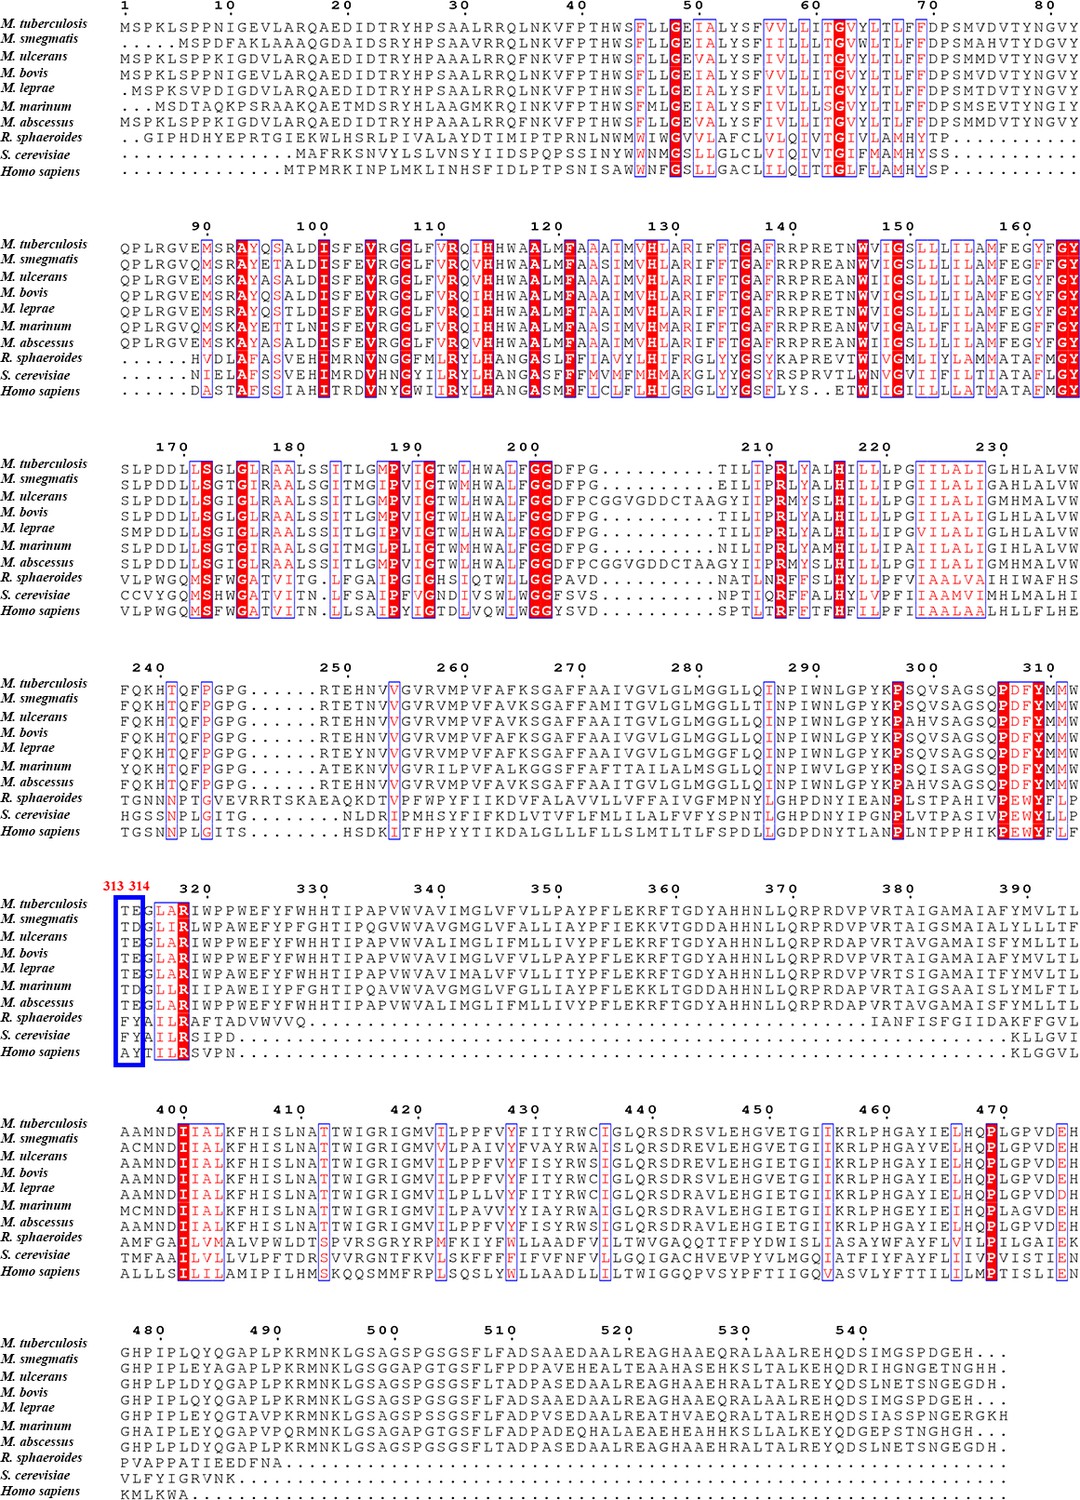
Sequence alignment of M. tuberculosis QcrB with their counterparts in other species including Homo sapiens.
Red residues are conserved, and blue indicates those less well conserved.
Figure 6—figure supplement 2
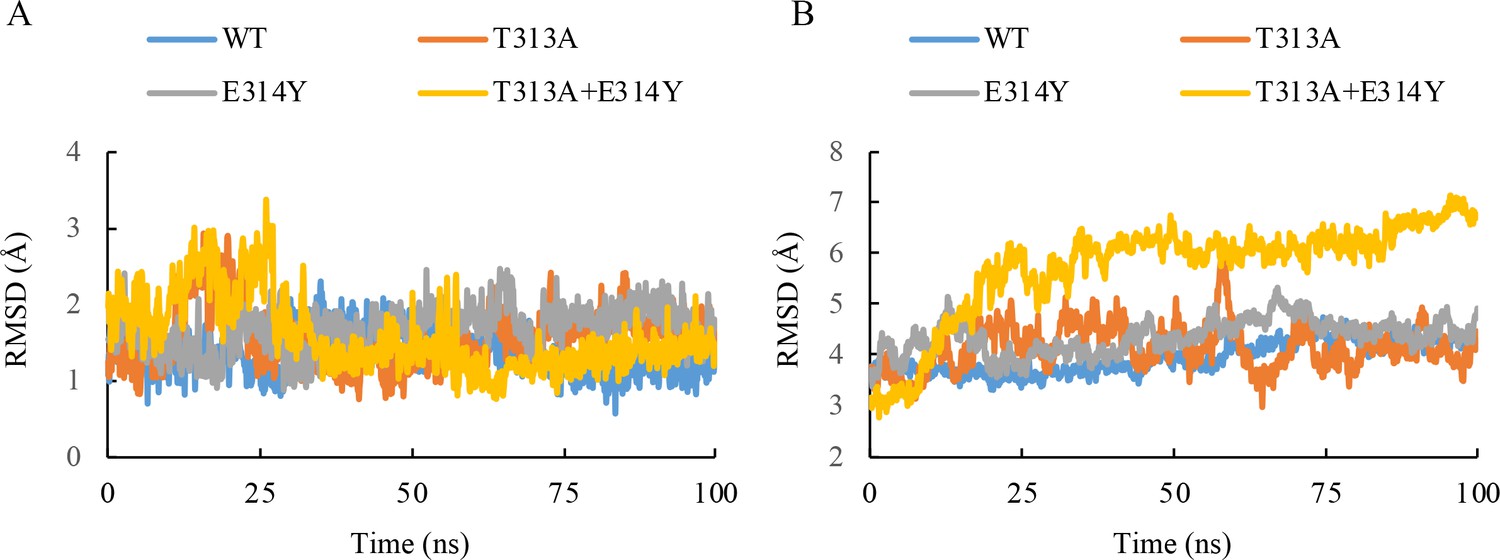
Molecular dynamics simulation plot for the root mean squared deviation (RMSD) of the heavy atoms in the inhibitor (A) and main chain atoms of QcrB (B).
100 ns NPT simulations for the wild-type and three mutant systems of the Q203-bound QcrB complex (T313A, E314Y, T313A + E314Y) are recorded. The frames were extracted from the 100 ns simulation every 100 ps, generating 1000 frames. The RMSD values of each frame were calculated based on the structural conformation of the reference structures, namely the initial wild-type and mutant Q203-bound QcrB complexes, respectively.
-
Figure 6—figure supplement 2—source data 1
Root mean squared deviation of the inhibitor and protein of Q203-bound QcrB complex.
- https://cdn.elifesciences.org/articles/69418/elife-69418-fig6-figsupp2-data1-v1.xlsx
Figure 7 with 2 supplements
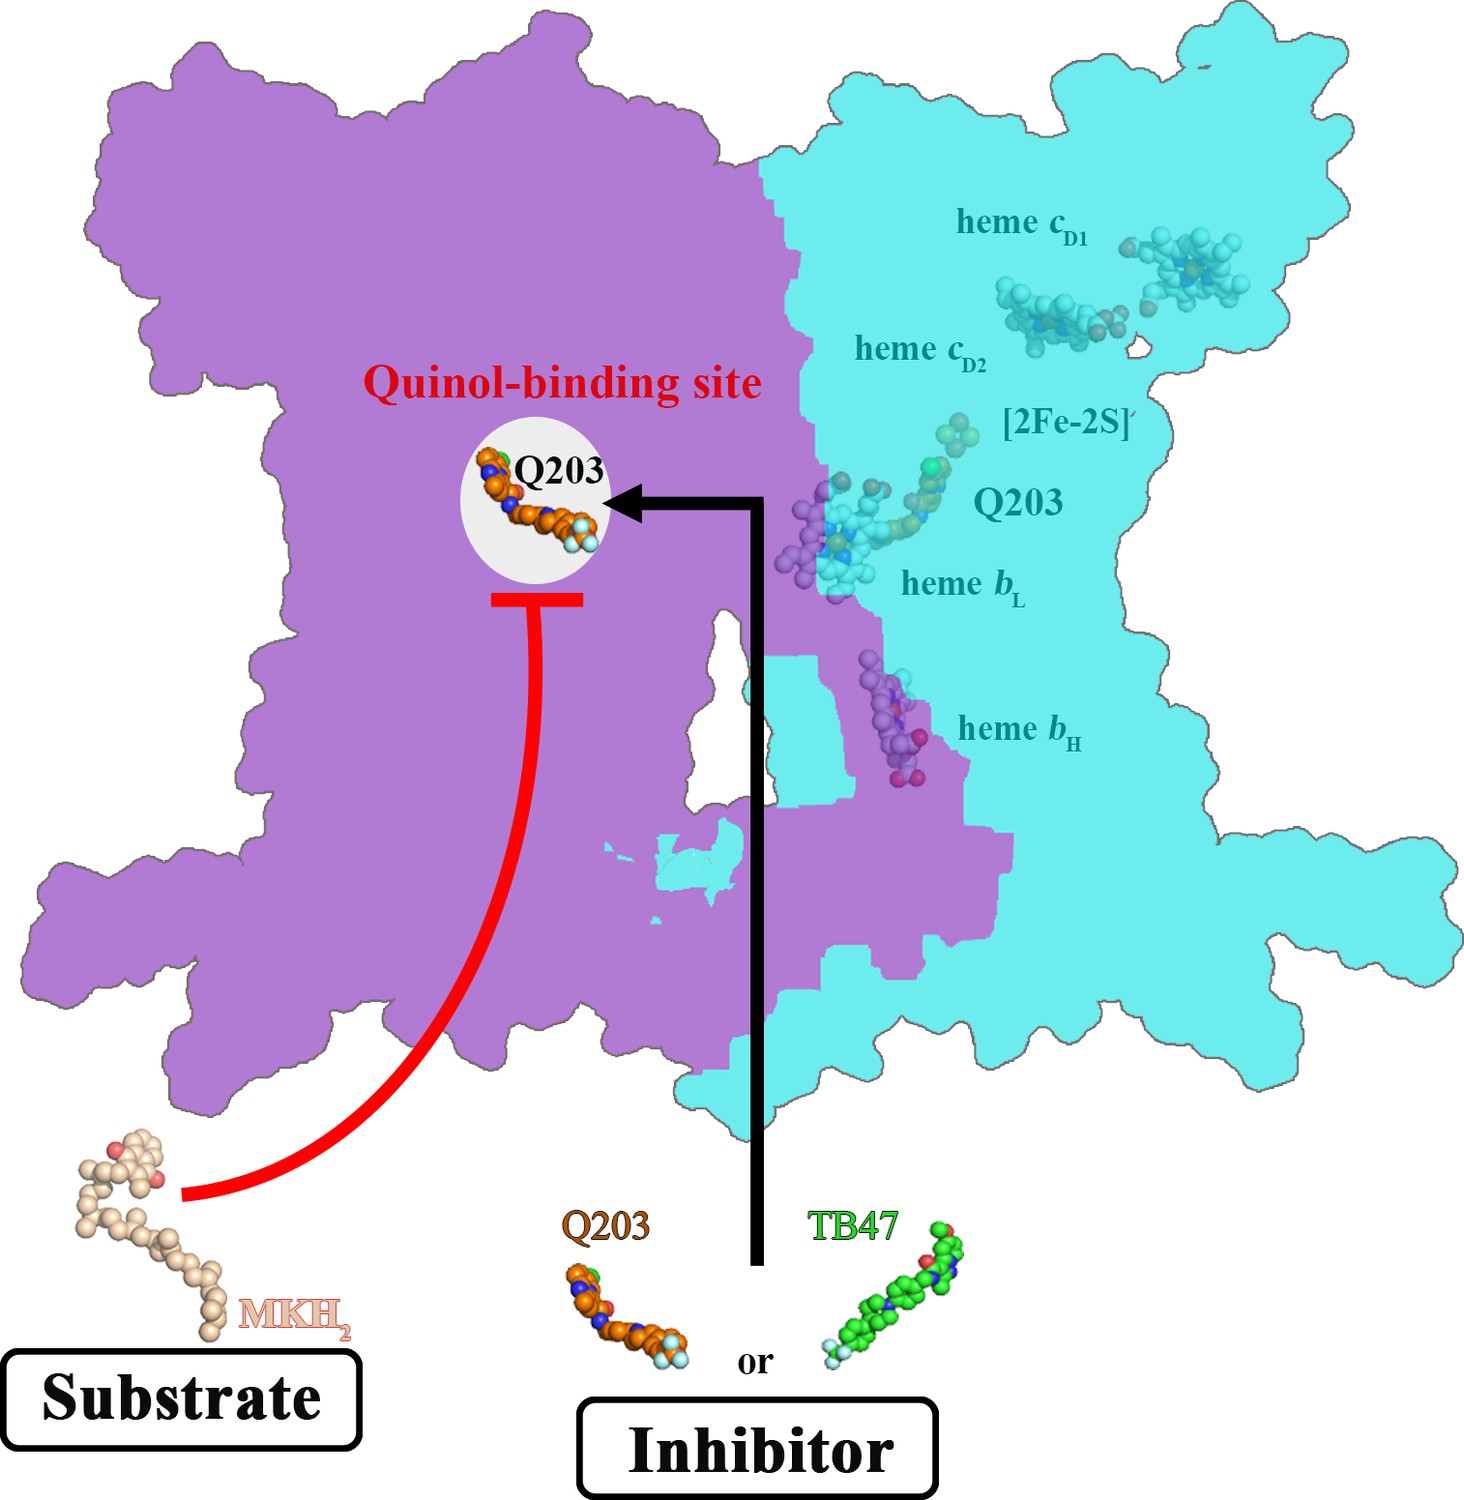
Schematic of M. tuberculosis cytochrome bcc inhibition by Q203 and TB47.
The two monomers of M. tuberculosis cytochrome bcc are colored magenta and cyan, respectively. The binding of Q203 (orange spheres) or TB47 (green spheres) prevents substrate access (gray spheres).
Figure 7—figure supplement 1
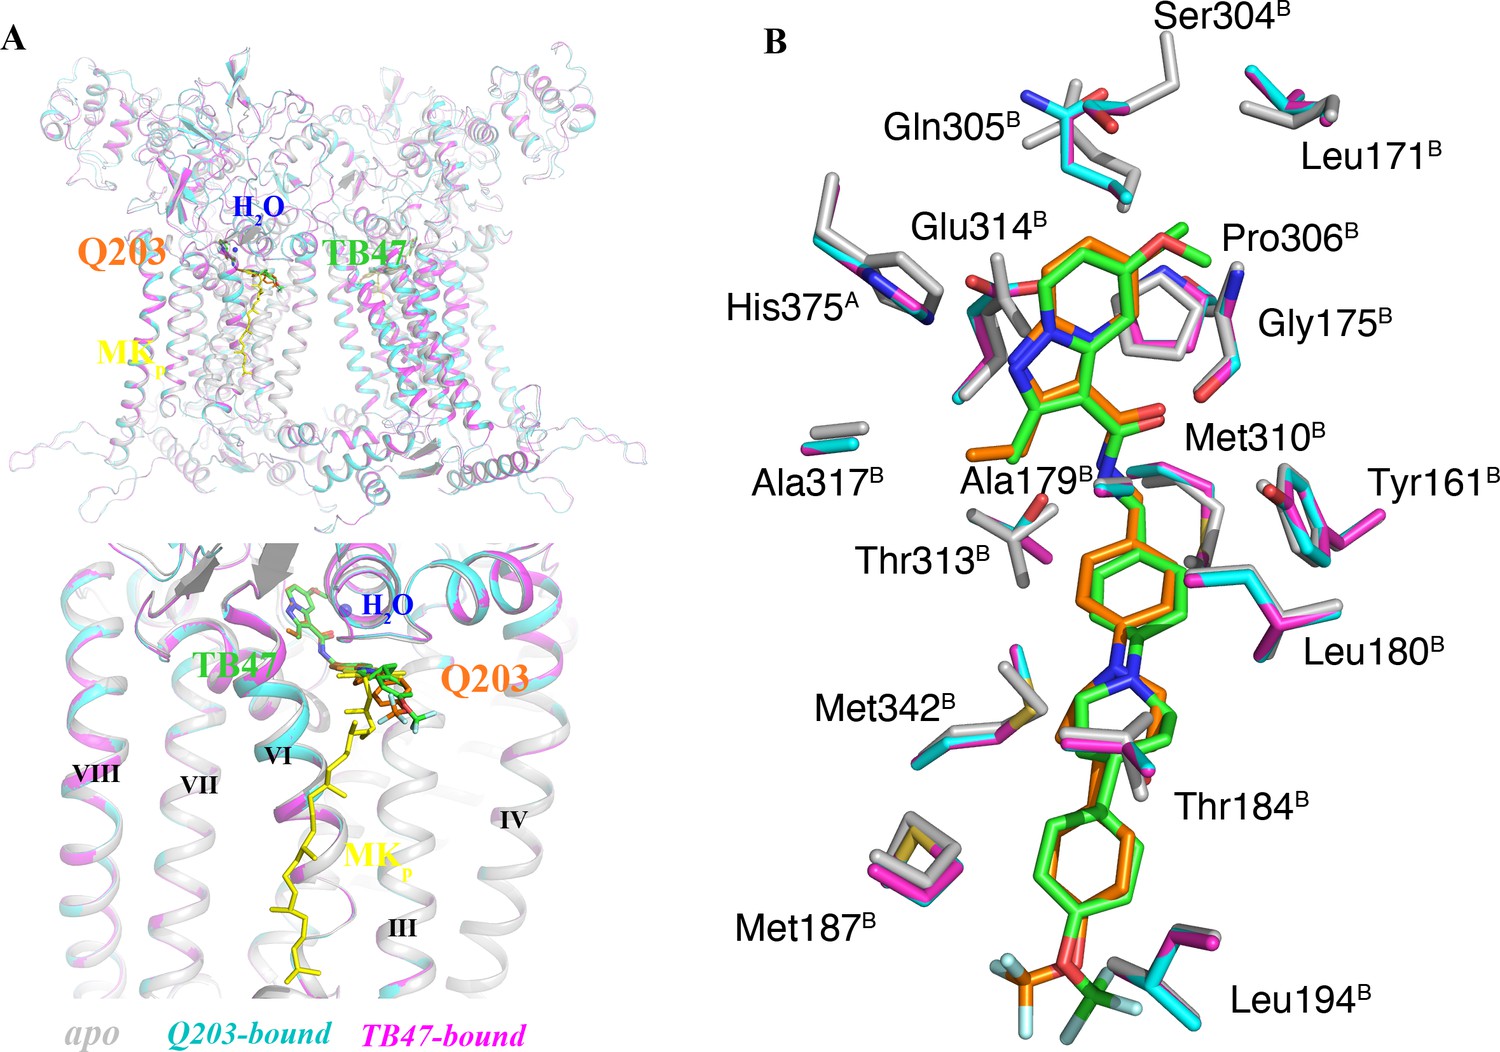
Comparison of apo and Q203/TB47-bound structures of M. tuberculosis cytochromes bcc.
(A) Superposition of apo (gray), Q203-bound (cyan), and TB47-bound (magenta) structures of M. tuberculosis cytochromes bcc. The Q203 (orange), TB47 (green), and MK (yellow) molecules are shown as stick models, respectively. Water molecules are shown as spheres. (B) Comparison of residues surrounding Q203 (cyan sticks) and TB47 (magenta stick models) with those in apo form (gray sticks). The residues from subunits A and B are labeled with superscript A and B, respectively.
Figure 7—figure supplement 2
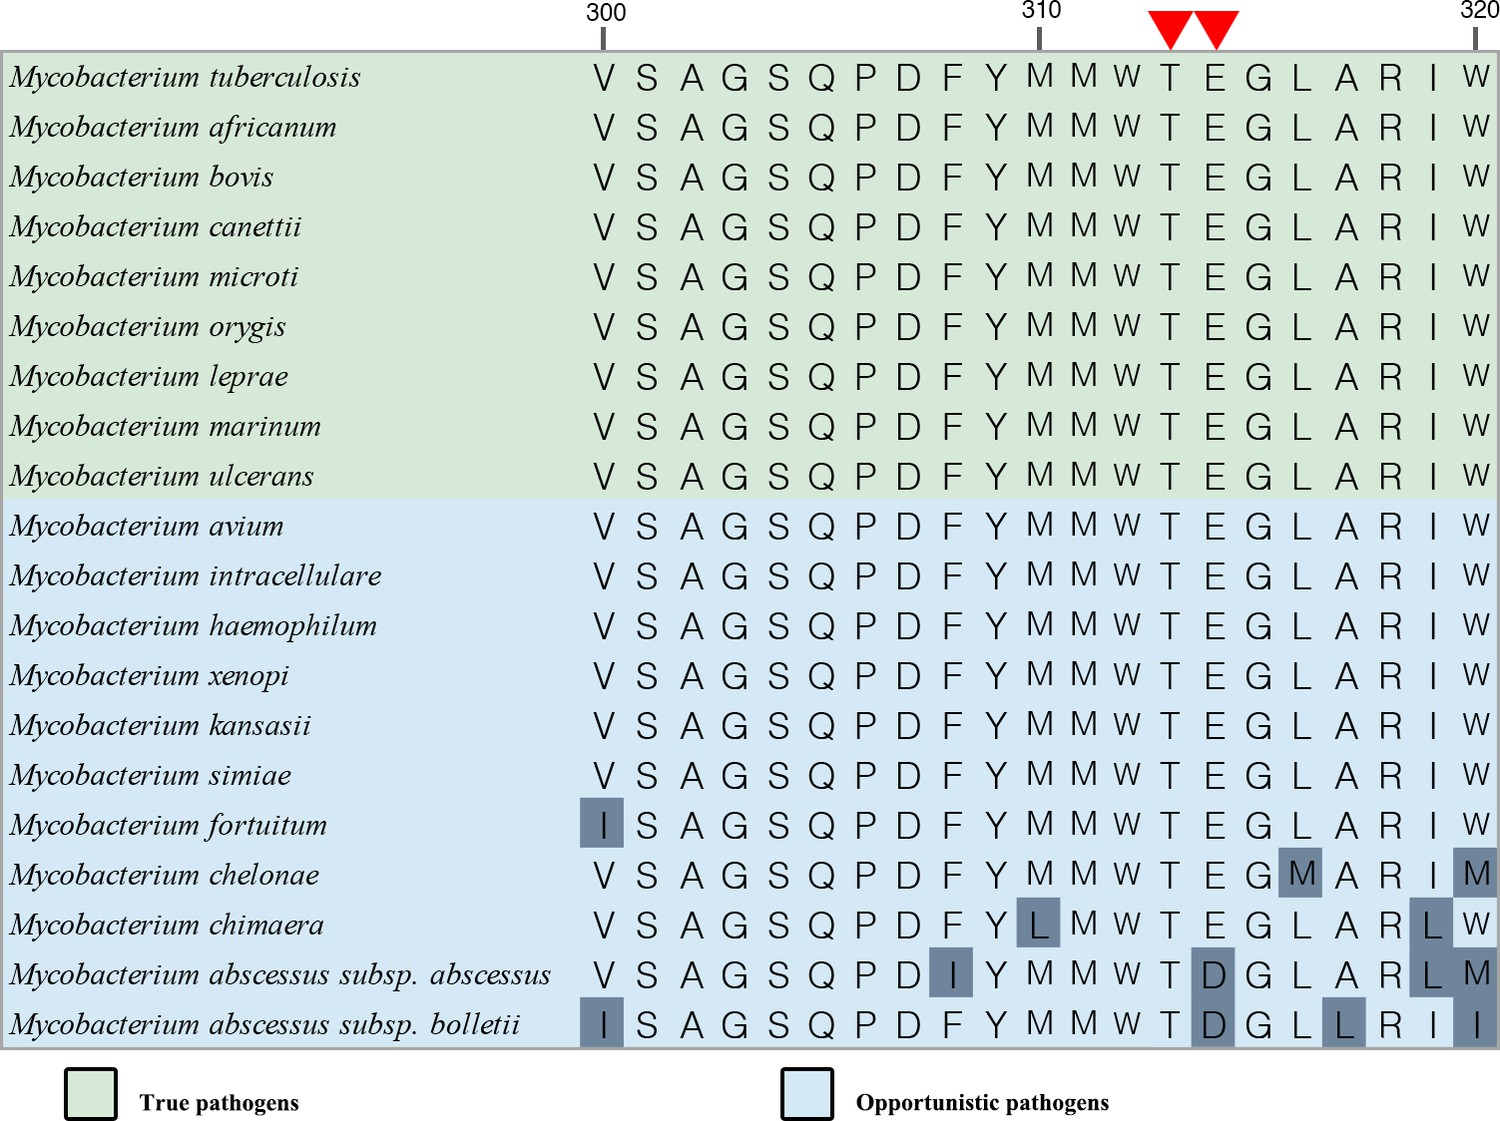
Sequence alignment for the QP site within pathogenic mycobacteria.
Partial sequence alignment at the Qp site. The red triangles indicate the conservative residues involved with the hydrogen-bond formation between Q203 and TB47.
Tables
Table 1
Cryo-electron microscopy data collection, refinement, and validation statistics of hybrid supercomplex.
| State | apo |
|---|---|
| Data collection | |
| Microscope | Titan Krios |
| Voltage (kV) | 300 |
| Magnification | 29,000× |
| Detector | Gatan K3 |
| Data collection software | SerialEM |
| Electron exposure (e–/Å2) | 60 |
| Defocus range (μm) | –1.2 to –1.8 |
| Pixel size (Å) | 0.82 |
| Data processing | |
| Number of micrographs | 4141 |
| Final particle images | 112,804 |
| Symmetry imposed | C1 |
| Map resolution (Å)Fourier shell correlation 0.143 threshold | |
| 2.68 | |
| Refinement | |
| Initial model used (PDB code) | 6ADQ |
| Map sharpening B factor (Å2)d FSC model (0.143) masked | –65.32.5 |
| Map correlation coefficient | 0.89 |
| Mean CC for ligands | 0.78 |
| Model composition | |
| Non-hydrogen atoms | 42,279 |
| Protein residues | 5122 |
| Ligands | |
| 9Y0: 2 | |
| CDL: 17 | |
| 9YF: 4 | |
| HEA: 4 | |
| HEC: 4 | |
| MQ9: 10 | |
| HEM: 4 | |
| PLM: 4 | |
| CU: 8 | |
| FES: 2 | |
| Root mean squared deviations | |
| Bond lengths (Å) | 0.005 |
| Bond angles (°) | 1.057 |
| Validation | |
| MolProbity score | 1.86 |
| Clashscore | 7.26 |
| Poor rotamers (%) | 0.05 |
| Ramachandran plot | |
| Favored (%) | 92.76 |
| Allowed (%) | 6.97 |
| Outliers (%) | 0.28 |
| Cβ outliers (%) | 0.00 |
Table 2
Cryo-electron microscopy data collection, refinement, and validation statistics for the Q203-bound hybrid supercomplex.
| State | Q203 |
|---|---|
| Data collection | |
| Microscope | Titan Krios |
| Voltage (kV) | 300 |
| Magnification | 29,000× |
| Detector | Gatan K3 |
| Data collection software | SerialEM |
| Electron exposure (e–/Å2) | 60 |
| Defocus range (μm) | –1.2 to –1.8 |
| Pixel size (Å) | 0.82 |
| Data processing | |
| Number of micrographs | 3763 |
| Final particle images | 106,770 |
| Symmetry imposed | C1 |
| Map resolution (Å)Fourier shell correlation (FSC) 0.143 threshold | |
| 2.67 | |
| Refinement | |
| Initial model used (PDB code) | 6ADQ |
| Map sharpening B factor (Å2)d FSC model (0.143) masked | –70.02.6 |
| Map correlation coefficient | 0.88 |
| Mean CC for ligands | 0.76 |
| Model composition | |
| Non-hydrogen atoms | 42,695 |
| Protein residues | 5132 |
| Ligands | |
| 9Y0: 2 | |
| CDL: 17 | |
| 9YF: 4 | |
| HEA: 4 | |
| HEC: 4 | |
| MQ9: 8 | |
| HEM: 4 | |
| PLM: 4 | |
| CU: 8 | |
| FES: 2 | |
| HUU (Q203): 2 | |
| Root mean squared deviations | |
| Bond lengths (Å) | 0.003 |
| Bond angles (°) | 0.659 |
| Validation | |
| MolProbity score | 1.84 |
| Clashscore | 7.97 |
| Poor rotamers (%) | 6.23 |
| Ramachandran plot | |
| Favored (%) | 93.07 |
| Allowed (%) | 6.61 |
| Outliers (%) | 0.31 |
| Cβ outliers (%) | 0.00 |
Table 3
Cryo-electron microscopy data collection, refinement, and validation statistics for the TB47-bound hybrid supercomplex.
| State | TB47 |
|---|---|
| Data collection | |
| Microscope | Titan Krios |
| Voltage (kV) | 300 |
| Magnification | 29,000× |
| Detector | Gatan K3 |
| Data collection software | SerialEM |
| Electron exposure (e–/Å2) | 60 |
| Defocus range (μm) | –1.2 to –1.8 |
| Pixel size (Å) | 0.82 |
| Data processing | |
| Number of micrographs | 2698 |
| Final particle images | 169,988 |
| Symmetry imposed | C1 |
| Map resolution (Å)Fourier shell correlation (FSC) 0.143 threshold | |
| 2.93 | |
| Refinement | |
| Initial model used (PDB code) | 6ADQ |
| Map sharpening B factor (Å2)d FSC model (0.143) masked | –97.52.9 |
| Map correlation coefficient | 0.90 |
| Mean CC for ligands | 0.79 |
| Model composition | |
| Non-hydrogen atoms | 42,679 |
| Protein residues | 5119 |
| Ligands | |
| 9Y0: 2 | |
| CDL: 17 | |
| 9YF: 4 | |
| HEA: 4 | |
| HEC: 4 | |
| MQ9: 8 | |
| HEM: 4 | |
| PLM: 4 | |
| CU: 8 | |
| FES: 2 | |
| HV0 (TB47): 2 | |
| Root mean squared deviations | |
| Bond lengths (Å) | 0.005 |
| Bond angles (°) | 0.739 |
| Validation | |
| MolProbity score | 1.87 |
| Clashscore | 8.75 |
| Poor rotamers (%) | 6.23 |
| Ramachandran plot | |
| Favored (%) | 92.39 |
| Allowed (%) | 7.25 |
| Outliers (%) | 0.36 |
| Cβ outliers (%) | 0.00 |
Table 4
Relative binding free energy (kcal/mol) for Q203 in three mutants of QcrB compared to the wild-type (WT).
| Mutant | 25–50 ns | 50–75 ns | 75–100 ns | Average | Standard deviation |
|---|---|---|---|---|---|
| T313A | 6.32 | 11.01 | 8.11 | 8.48 | 2.37 |
| T314Y | 4.54 | 6.00 | 8.07 | 6.20 | 1.77 |
| T313A + E314Y | 10.28 | 16.30 | 13.64 | 13.41 | 3.02 |
Key resources table
| Reagent type (species) or resource | Designation | Source or reference | Identifiers | Additional information |
|---|---|---|---|---|
| Gene (Mycobacterium tuberculosis) | qcrC | Mycobrowser | Rv2194 | https://mycobrowser.epfl.ch/genes/Rv2194 |
| Gene (M. tuberculosis) | qcrA | Mycobrowser | Rv2195 | https://mycobrowser.epfl.ch/genes/Rv2195 |
| Gene (M. tuberculosis) | qcrB | Mycobrowser | Rv2196 | https://mycobrowser.epfl.ch/genes/Rv2196 |
| Strain, strain background (Mycobacterium smegmatis) | mc2 51 | Li et al., 2014 | ||
| Genetic reagent (include species here) | pVV16-QcrCAB-His10 | This paper | Construct contains the qcrCAB operon encoding three subunits | |
| Commercial assay or kit | ClonExpress II One Step Cloning Kit | Vazyme | C112-01 | |
| Chemical compound, drug | Q203 | MCE | HY-101040 | Prepare stock solution in DMSO |
| Chemical compound, drug | TB47 | Lu et al., 2019 | Prepare stock solution in DMSO | |
| Chemical compound, drug | LMNG | Anatrace | NG310 | |
| Chemical compound, drug | Digitonin | BIOSYNTH | D-3200 | |
| Software, algorithm | SerialEM | Mastronarde, 2003 | Version 3.6 | |
| Software, algorithm | MotionCor2 | Zheng et al., 2017 | Version 1.2.1 | |
| Software, algorithm | RELION | Zivanov et al., 2019 | Version 3.03 | |
| Software, algorithm | cryoSPARC | Punjani et al., 2017 | Version 3.2.0 | |
| Software, algorithm | Phyre2 | Kelley et al., 2015 | Version 2.0 | |
| Software, algorithm | UCSF Chimera | Pettersen et al., 2004 | Version 1.12 | |
| Software, algorithm | COOT | Emsley et al., 2010 | Version 0.8.9 | |
| Software, algorithm | PHENIX | Adams et al., 2010 | Version 1.16 | |
| Software, algorithm | PyMOL | Schrödinger LLC, 2017 | Version 2.0 | |
| Software, algorithm | ChemDraw | Li et al., 2004 | Version 19.0 |
Additional files
Download links
A two-part list of links to download the article, or parts of the article, in various formats.
Downloads (link to download the article as PDF)
Open citations (links to open the citations from this article in various online reference manager services)
Cite this article (links to download the citations from this article in formats compatible with various reference manager tools)
Structure of Mycobacterium tuberculosis cytochrome bcc in complex with Q203 and TB47, two anti-TB drug candidates
eLife 10:e69418.
https://doi.org/10.7554/eLife.69418


