A novel bivalent chromatin associates with rapid induction of camalexin biosynthesis genes in response to a pathogen signal in Arabidopsis
- Carnegie Institution for Science, Department of Plant Biology, United States
- Department of Bioengineering, Stanford University, United States
- Chan Zuckerberg Biohub, United States
Figures
Figure 1 with 2 supplements
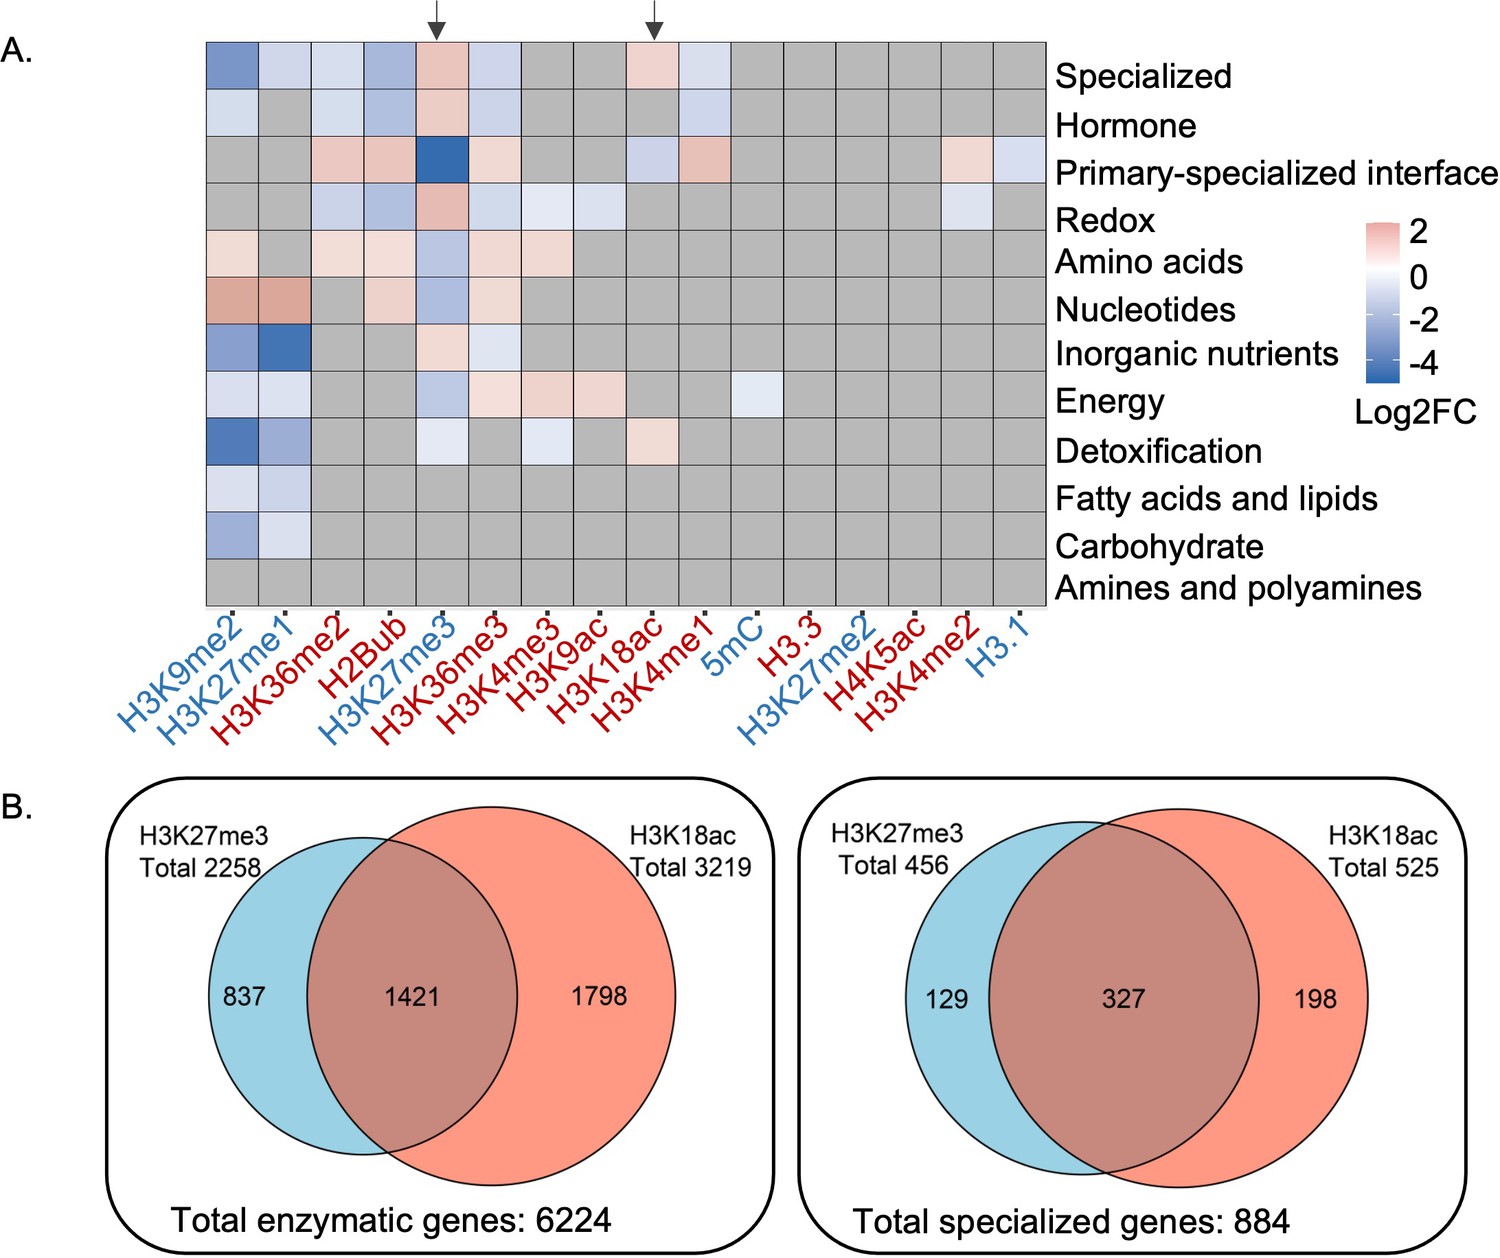
Patterns of epigenetic modification across metabolism in Arabidopsis.
(A) Enrichment analysis shows different epigenetic modification patterns across metabolic domains. The heatmap represents log2 fold change (Log2FC) of enrichment or depletion of an epigenetic mark associated with each domain relative to total metabolic genes. Epigenetic modifications are color-coded based on their effect on gene expression; red represents activating mark and blue represents repressive mark. Genes only mapped to unique metabolic domains were included in this analysis. Significant enrichment or depletion is based on Fisher’s exact test, p-value < 0.05 and fold change >1.5. Gray cells represent no significant change. Black arrows indicate the patterns for trimethylation of lysine 27 of histone 3 (H3K27me3) and H3K18ac. (B) The co-occurrence of H3K27me3 and H3K18ac on total enzymatic genes in the genome and specialized metabolic genes.
-
Figure 1—source data 1
Source data used to generate Figure 1A, B.
- https://cdn.elifesciences.org/articles/69508/elife-69508-fig1-data1-v2.xlsx
Figure 1—figure supplement 1
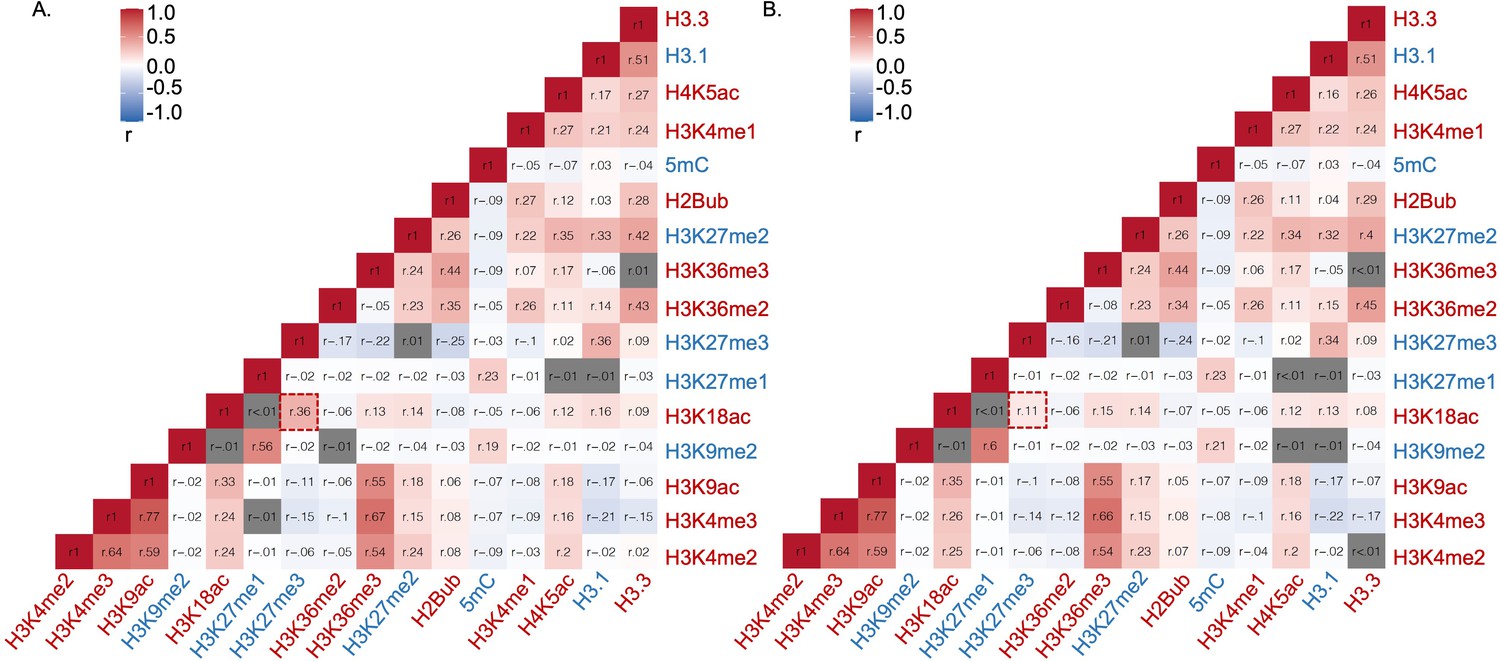
Correlation analysis of epigenetic marks based on their relative abundance on (A) total Arabidopsis metabolic genes, (B) non-specialized metabolic genes.
Epigenetic modifications are color-coded based on their effect on gene expression; red represents activating mark and blue represents repressing mark. r represents Pearson’s correlation coefficient. The box highlighted by red represents Pearson’s correlation coefficient between H3K18ac and H3K27me3 . Gray cells represent insignificant correlation determined by the R package Hmisc.
Figure 1—figure supplement 2
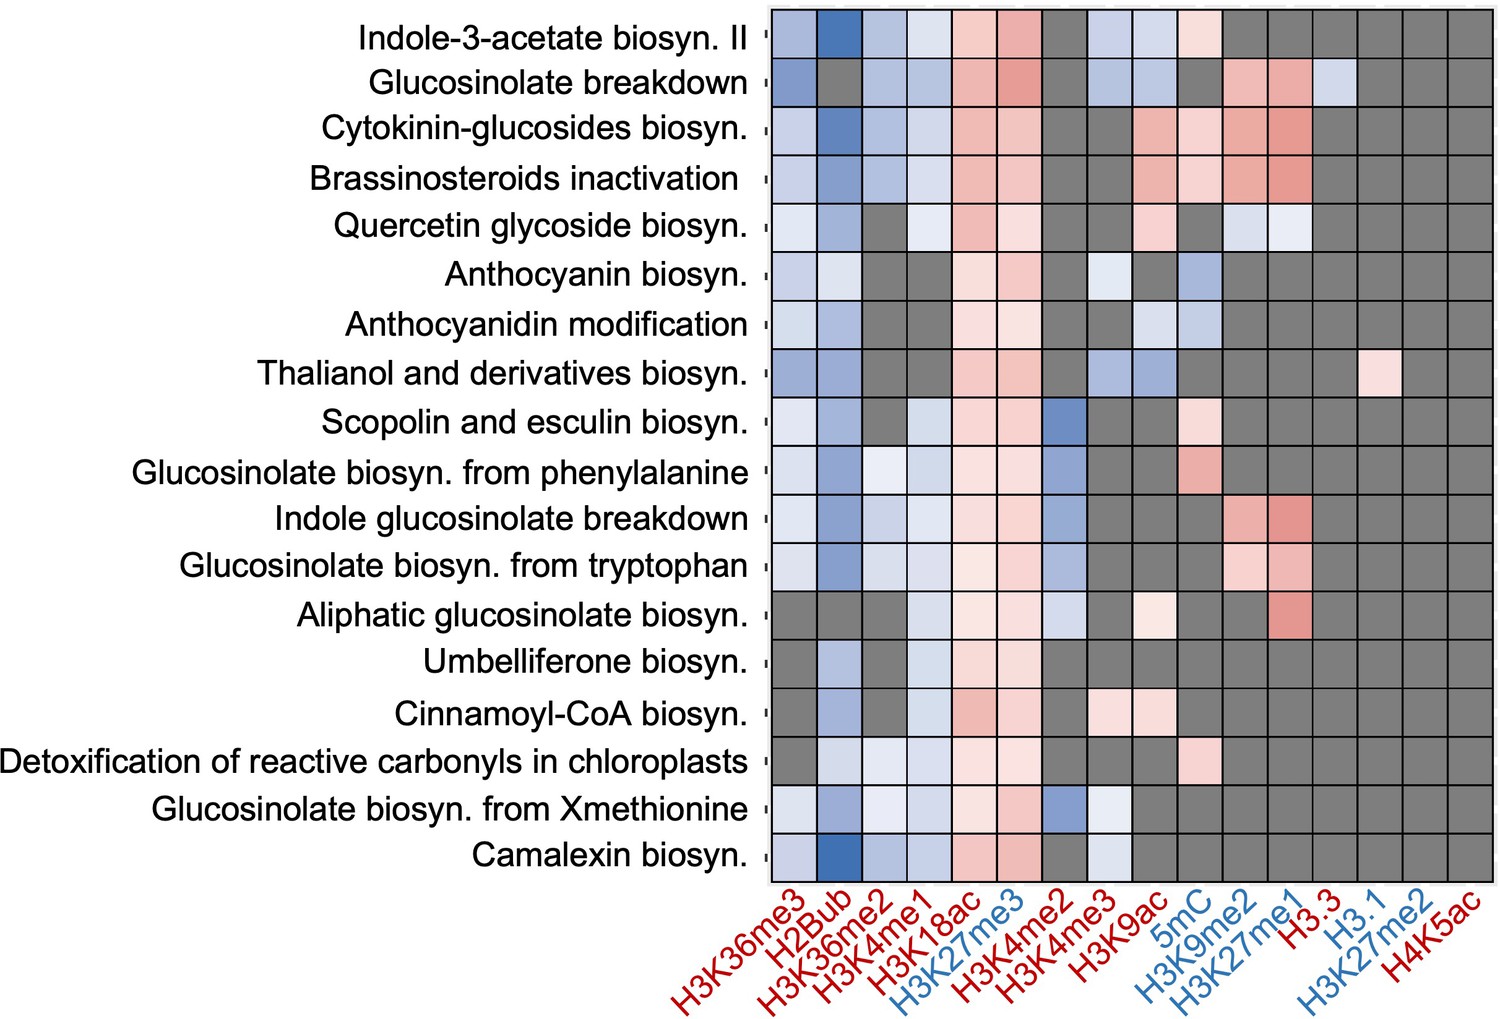
Epigenetic marks associated with pathways involved in specialized metabolism including camalexin biosynthesis.
The heatmap represents log2 fold change (Log2FC) of enrichment or depletion of a mark associated with each pathway relative to total metabolic genes based on Fisher’s exact test followed by a post hoc adjustment using false discovery rate (FDR). Gray cells represent no-significant enrichment or depletion at FDR of 0.01 and fold change of 1.5. The heatmap was generated using hierarchical clustering using the ggplot2 package version 3.1 in RStudio. Epigenetic modifications are color-coded based on their effect on gene expression; red represents activating marks and blue represents repressive marks.
Figure 2

H3K27me3 and H3K18ac are co-localized on camalexin biosynthesis genes in planta to form a bivalent chromatin.
(A) Camalexin biosynthesis pathway map and the essential genes that can produce camalexin. (B-C) Sequential chromatin immunoprecipitation (ChIP)-qPCR confirms the co-localization of H3K27me3 and H3K18ac. Altering the order of antibodies against H3K27me3 or H3K18ac in two rounds of pull-downs shows similar results in sequential ChIP-qPCR. Negative control represents a genomic region that has low abundance of both H3K27me3 and H3K18ac. H3K27me3_only represents a genomic region that has high abundance of H3K27me3 and low abundance of H3K18ac. H3K18ac_only represents a genomic region that has high abundance of H3K18ac and low abundance of H3K27me3. NoAb represents no antibody in the second pull-down. Error bars represent standard deviation of data from six biological replicates. The experiments were performed twice with different plant samples and data were combined in this analysis.
-
Figure 2—source data 1
Source data used to generate Figure 2B,C.
- https://cdn.elifesciences.org/articles/69508/elife-69508-fig2-data1-v2.xlsx
Figure 3 with 4 supplements
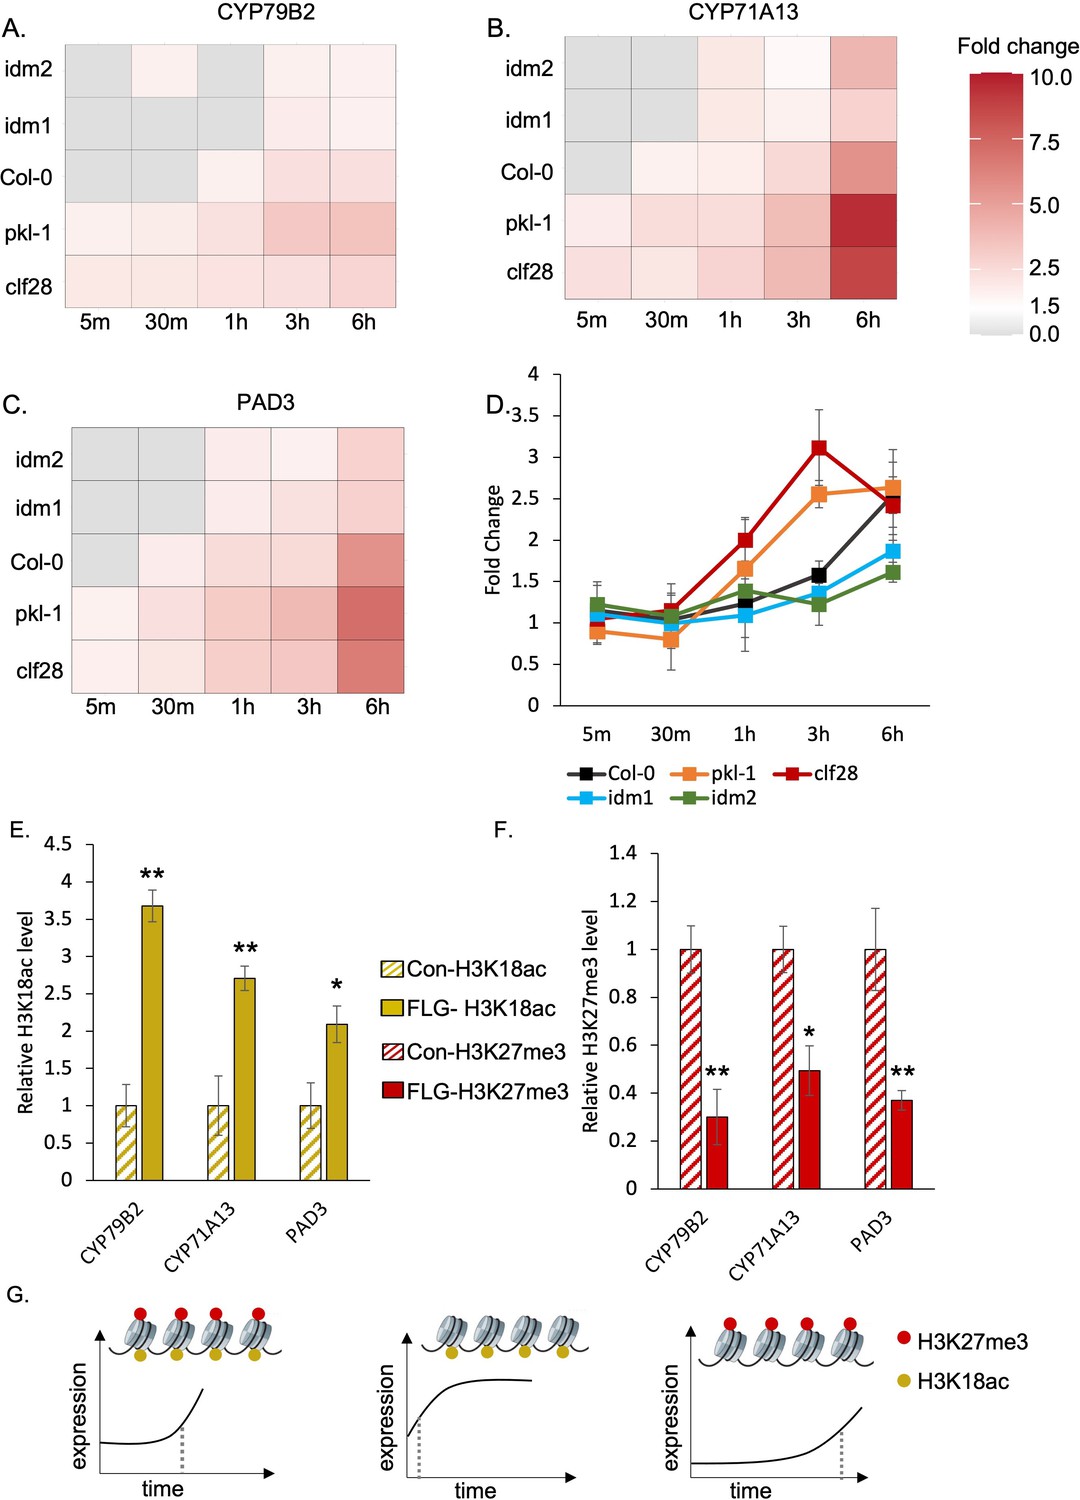
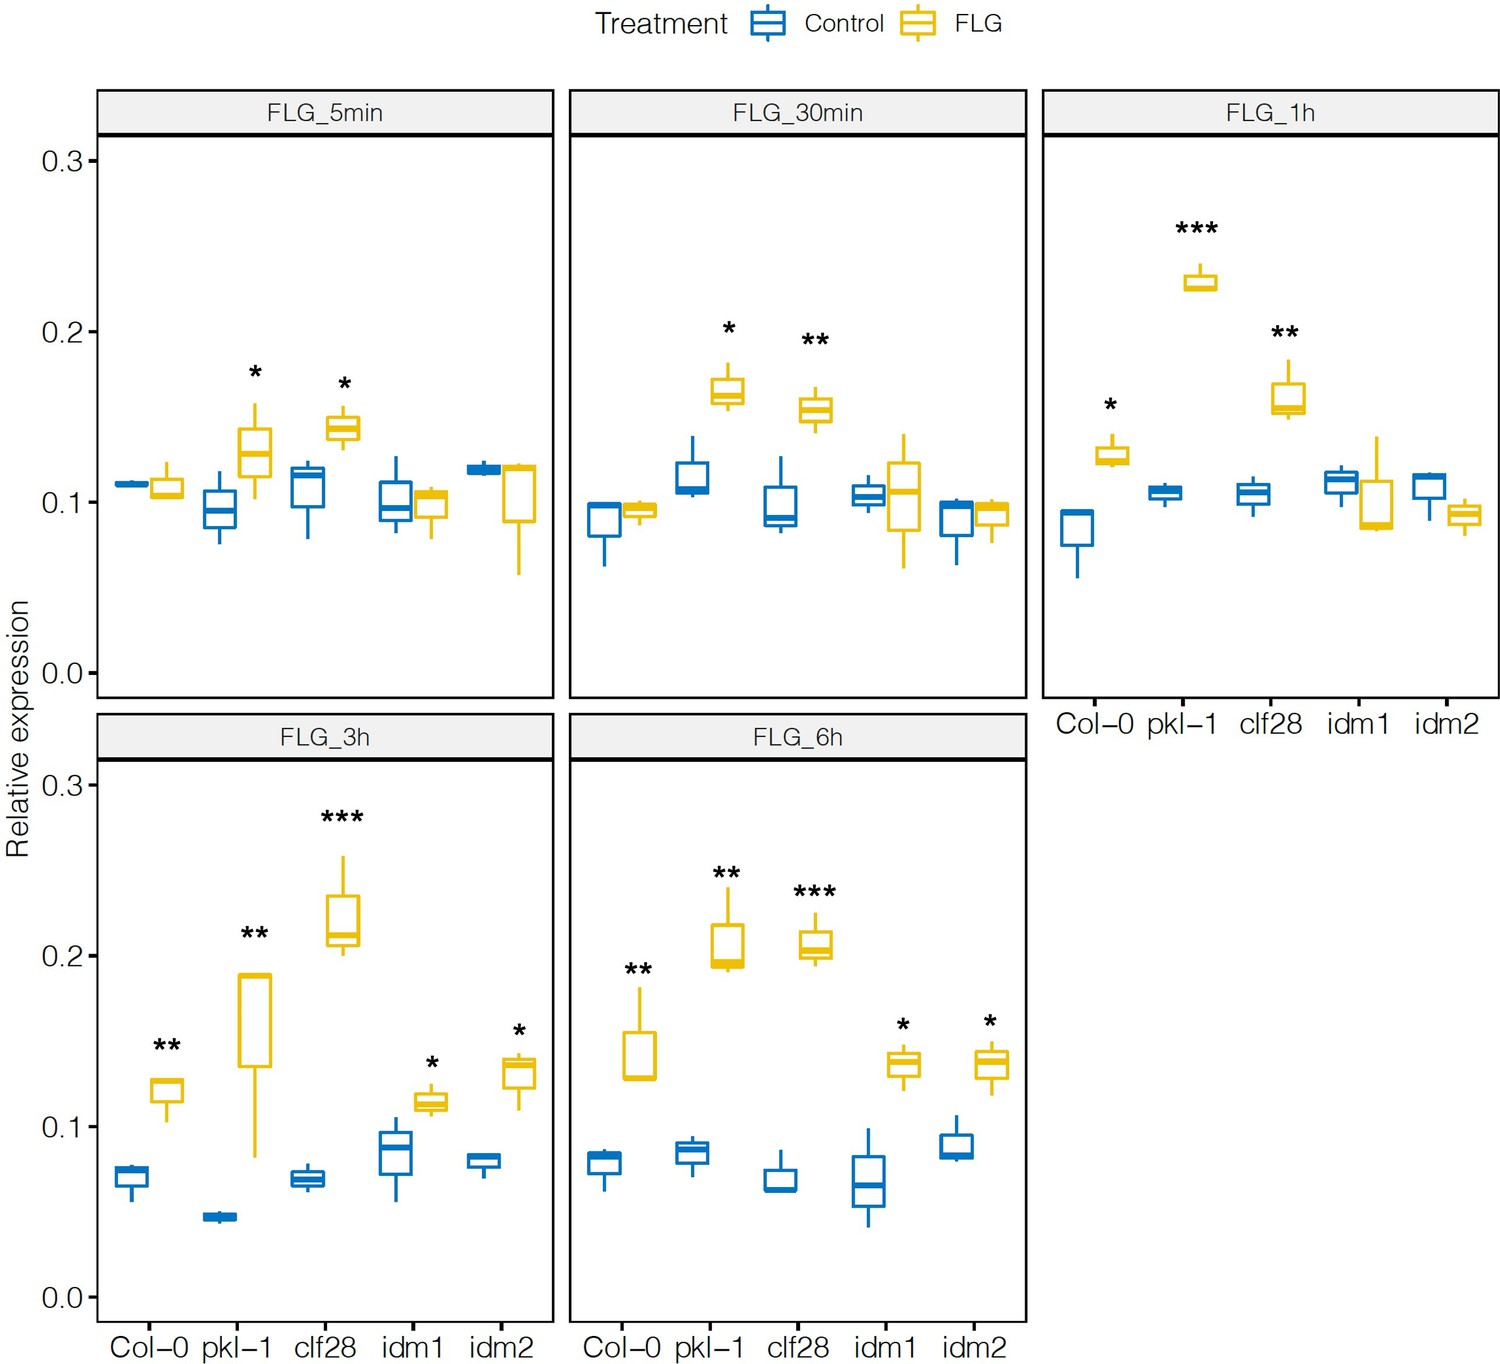
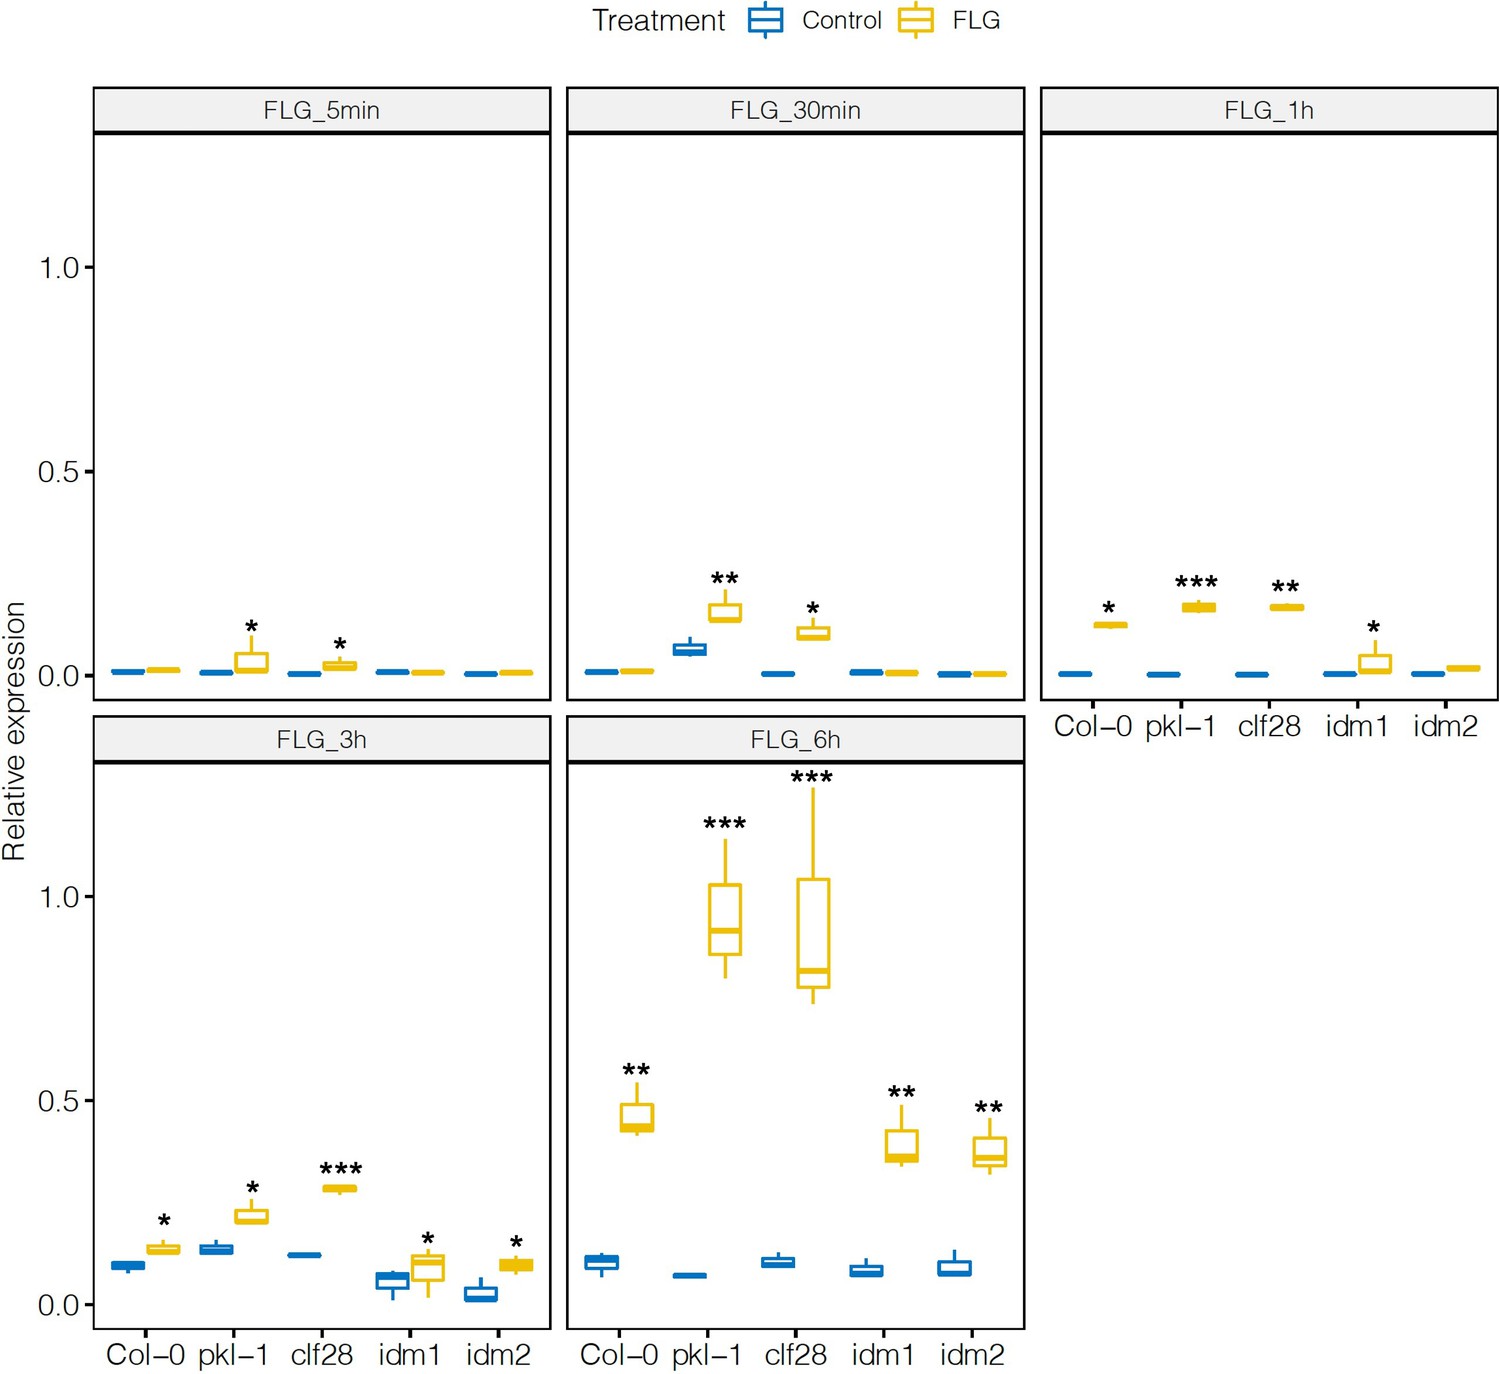
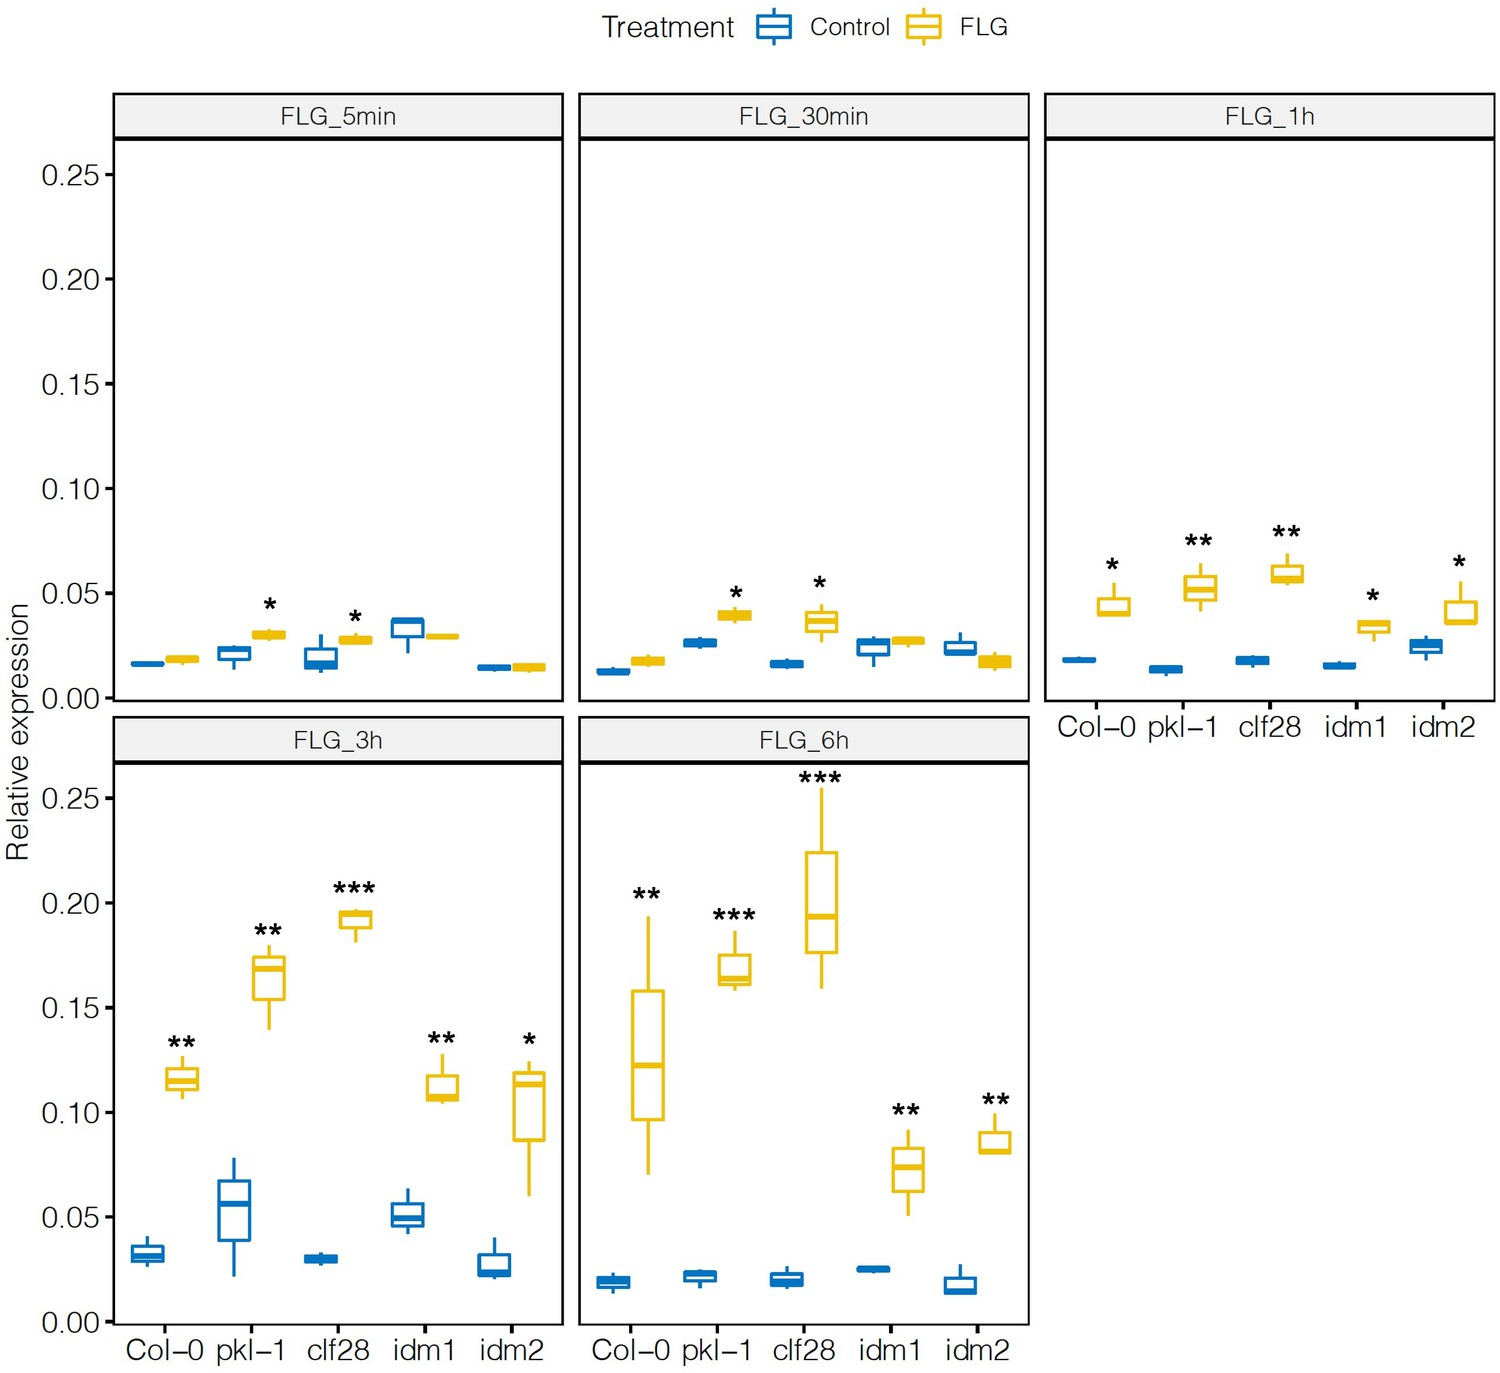
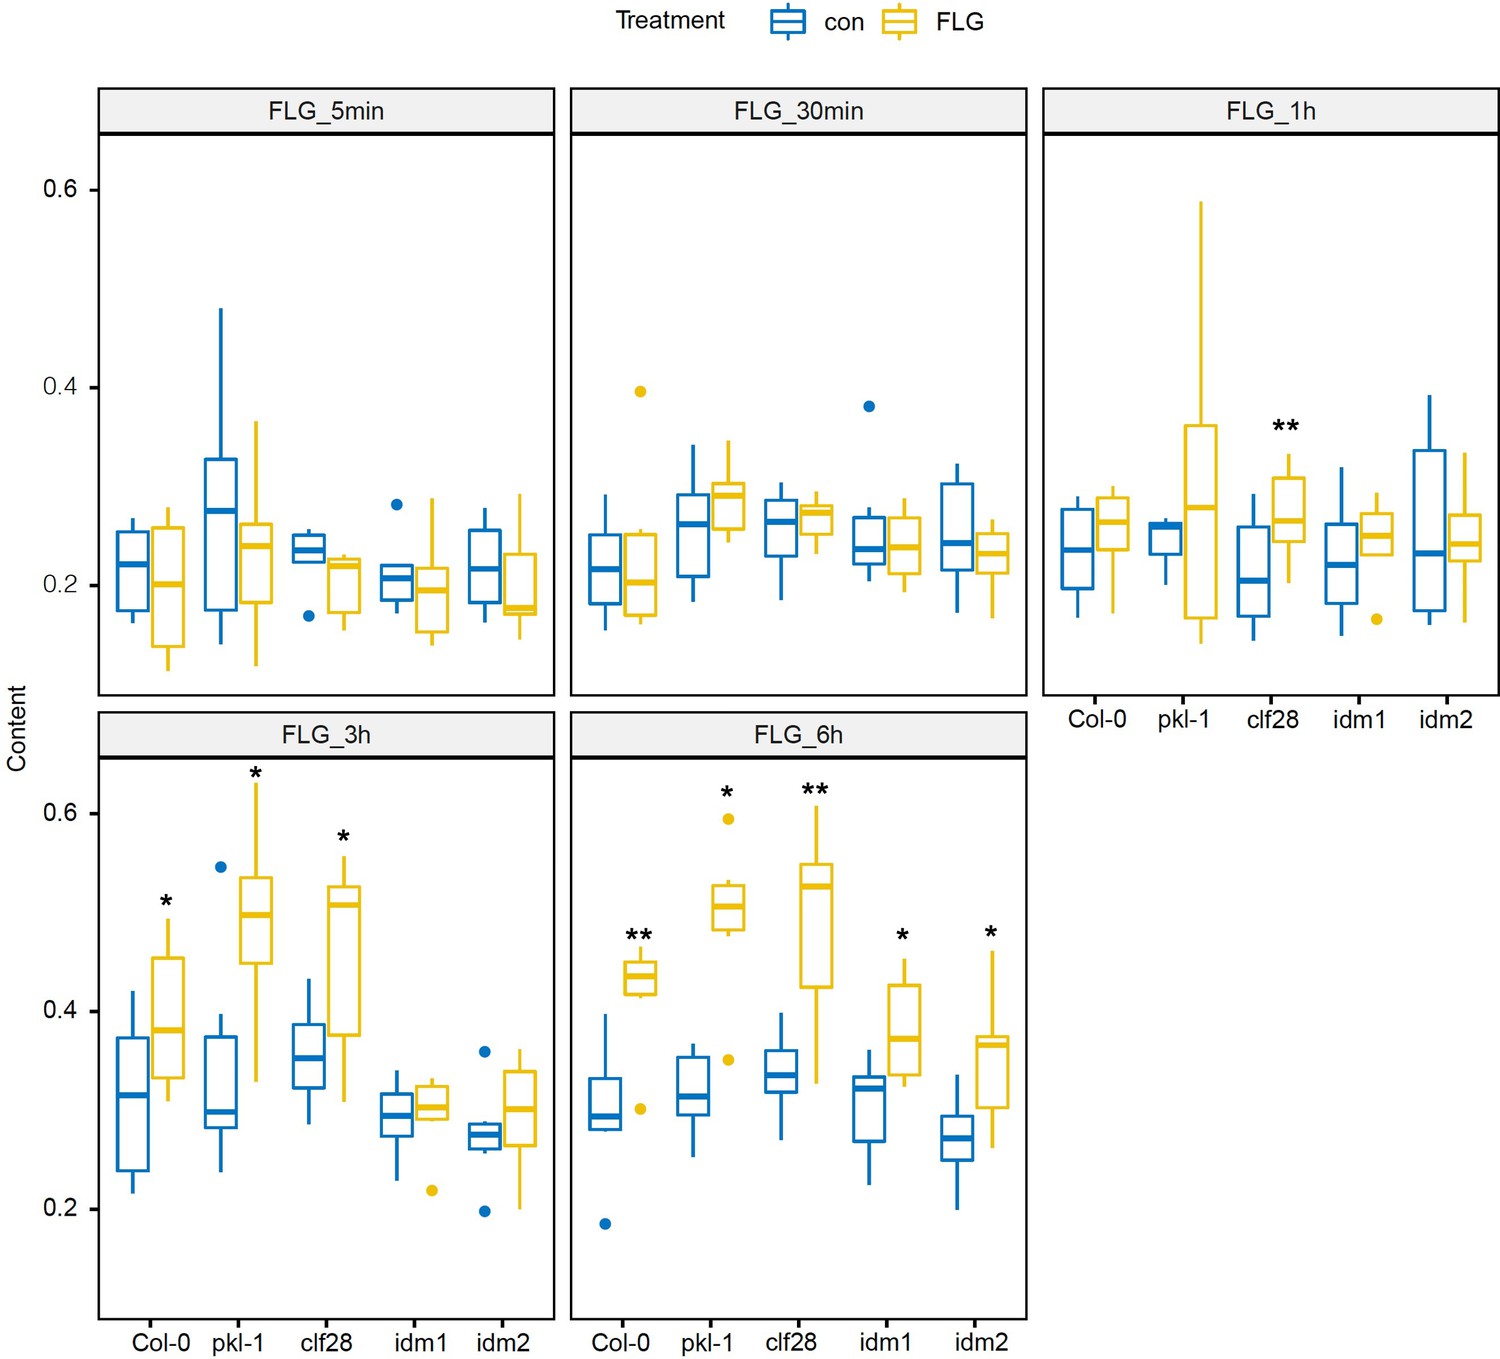
H3K27me3-H3K18ac bivalent chromatin controls the timing of gene induction and camalexin accumulation upon a pathogen signal.
(A-C) Expression of the three essential genes in camalexin biosynthesis in response to flagellin 22 (FLG22) in the wild type (Col-0), H3K27me3-defective mutants clf28 and pkl-1, and H3K18ac-defective mutants idm1 and idm2. ACT2 was used as a reference gene. Relative gene expression at each time point was reported in Supplementary file 3 to 5. Fold change represents the induction level of camalexin biosynthesis genes in each genotype under FLG22 treatment relative to their corresponding untreated controls at each time point. (D) Camalexin accumulation in the wild type and mutants in response to FLG22. Camalexin content at each time point was reported in Supplementary file 6. Error bars represent standard deviation of data from six biological replicates of two experiments. (E-F) Abundance of epigenetic modifications at the genomic regions of camalexin biosynthesis genes with or without FLG22 treatment. Con-H3K18ac = chromatin was extracted from water-treated samples (Col-0) and pulled down by the antibody against H3K18ac. FLG-H3K18ac = chromatin was extracted from FLG22-treated samples (Col-0) and pulled down by the antibody against H3K18ac. Con-H3K27me3 = chromatin was extracted from water-treated samples (Col-0) and pulled down by the antibody against H3K27me3. FLG-H3K27me3 = chromatin was extracted from FLG22-treated samples (Col-0) and pulled down by the antibody against H3K27me3. Relative abundance of each modification was calculated by normalizing first to input, then to control plants with mock treatment. Two-week-old Arabidopsis seedlings of Col-0 were treated with 1 µM FLG22 or deionized water in these experiments. Stressed and control samples were collected 30 min after the treatment. Error bars represent standard deviation of data from six biological replicates of two experiments. * and ** represent p-values < 0.05 and 0.01, respectively, from Student’s two-tailed t-test. (G) A model of the H3K27me3-H3K18ac bivalent chromatin that acts as a kairostat to regulate the temporal pattern of gene expression in response to external stimuli. Upon a pathogen signal, bivalent chromatin controls the timing of induction for camalexin biosynthetic genes, with H3K18ac expediting and H3K27me3 attenuating expression to hit the presumed temporal ‘sweet spot’. Dashed lines represent the time of significant gene induction.
-
Figure 3—source data 1
Source data used to generate Figure 3A-F.
- https://cdn.elifesciences.org/articles/69508/elife-69508-fig3-data1-v2.xlsx
Figure 3—figure supplement 1
Expression of CYP79B2 in the wild type and mutants in response to flagellin 22 (FLG22).
Significance was tested via two-way ANOVA followed by post hoc Dunnett’s test (*p < 0.05, **p < 0.01, ***p < 0.0001) relative to mock-treated plants at each time point. Results represent the mean of two independent experiments with three technical replicates per sample per experiment.
Figure 3—figure supplement 2
Expression of CYP71A13 in the wild type and mutants in response to flagellin 22 (FLG22).
Significance was tested via two-way ANOVA followed by post hoc Dunnett’s test (*p < 0.05, **p < 0.01, ***p < 0.0001) relative to mock-treated plants at each time point. Results represent the mean of two independent experiments with three technical replicates per sample per experiment.
Figure 3—figure supplement 3
Expression of PHYTOALEXIN DEFICIENT 3 (PAD3) in the wild type and mutants in response to flagellin 22 (FLG22).
Significance was tested via two-way ANOVA followed by post hoc Dunnett’s test (*p < 0.05, **p < 0.01, ***p < 0.0001) relative to mock-treated plants at each time point. Results represent the mean of two independent experiments with three technical replicates per sample per experiment.
Figure 3—figure supplement 4
Camalexin accumulation in the wild type and mutants in response to flagellin 22 (FLG22).
Significance was tested via two-way ANOVA by post hoc Dunnett’s test (*p < 0.05, **p < 0.01, ***p < 0.0001) relative to mock-treated plants at each time point. Results represent the mean of two independent experiments with three technical replicates per sample per experiment.
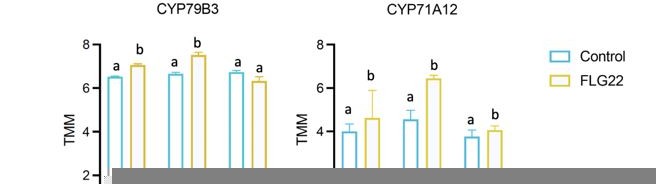
Author response image 1
Additional files
-
Supplementary file 1
Log2 fold change in the enrichment analysis to identify specialized metabolic pathways associated with both trimethylation of lysine 27 of histone 3 (H3K27me3) and H3K18ac.
- https://cdn.elifesciences.org/articles/69508/elife-69508-supp1-v2.xlsx
-
Supplementary file 2
Primers used to quantify the abundance of trimethylation of lysine 27 of histone 3 (H3K27me3) and H3K18ac in the genomic regions of camalexin biosynthesis genes using chromatin immunoprecipitation (ChIP)-qPCR in wild-type and mutant plants with or without flagellin 22 (FLG22) treatment.
- https://cdn.elifesciences.org/articles/69508/elife-69508-supp2-v2.docx
-
Supplementary file 3
Primers used in the sequential chromatin immunoprecipitation (ChIP)-qPCR experiment to examine the co-localization of trimethylation of lysine 27 of histone 3 (H3K27me3) and H3K18ac within camalexin biosynthesis genes.
- https://cdn.elifesciences.org/articles/69508/elife-69508-supp3-v2.docx
-
Supplementary file 4
Primers used to examine the expression of camalexin biosynthesis genes under flagellin 22 (FLG22) induction using qPCR.
- https://cdn.elifesciences.org/articles/69508/elife-69508-supp4-v2.docx
-
Supplementary file 5
The effect of genotype, flagellin 22 (FLG22) treatment, and time point on the expression change of camalexin genes.
- https://cdn.elifesciences.org/articles/69508/elife-69508-supp5-v2.docx
-
Supplementary file 6
The effect of genotype, flagellin 22 (FLG22) treatment, and time on camalexin accumulation.
- https://cdn.elifesciences.org/articles/69508/elife-69508-supp6-v2.docx
-
Transparent reporting form
- https://cdn.elifesciences.org/articles/69508/elife-69508-transrepform1-v2.docx
Download links
A two-part list of links to download the article, or parts of the article, in various formats.
Downloads (link to download the article as PDF)
Open citations (links to open the citations from this article in various online reference manager services)
Cite this article (links to download the citations from this article in formats compatible with various reference manager tools)
A novel bivalent chromatin associates with rapid induction of camalexin biosynthesis genes in response to a pathogen signal in Arabidopsis
eLife 10:e69508.
https://doi.org/10.7554/eLife.69508


