Evolutionary transcriptomics implicates new genes and pathways in human pregnancy and adverse pregnancy outcomes
- Department of Human Genetics, University of Chicago, United States
- Department of Organismal Biology and Anatomy, University of Chicago, United States
- Department of Molecular Biology and Genetics, Cornell University, United States
- Tommy’s National Centre for Miscarriage Research, University Hospitals Coventry & Warwickshire, United Kingdom
- Division of Biomedical Sciences, Clinical Sciences Research Laboratories, Warwic Medical School, University of Warwick, United States
- Department of Biological Sciences, University at Buffalo, United States
Figures
Figure 1 with 1 supplement
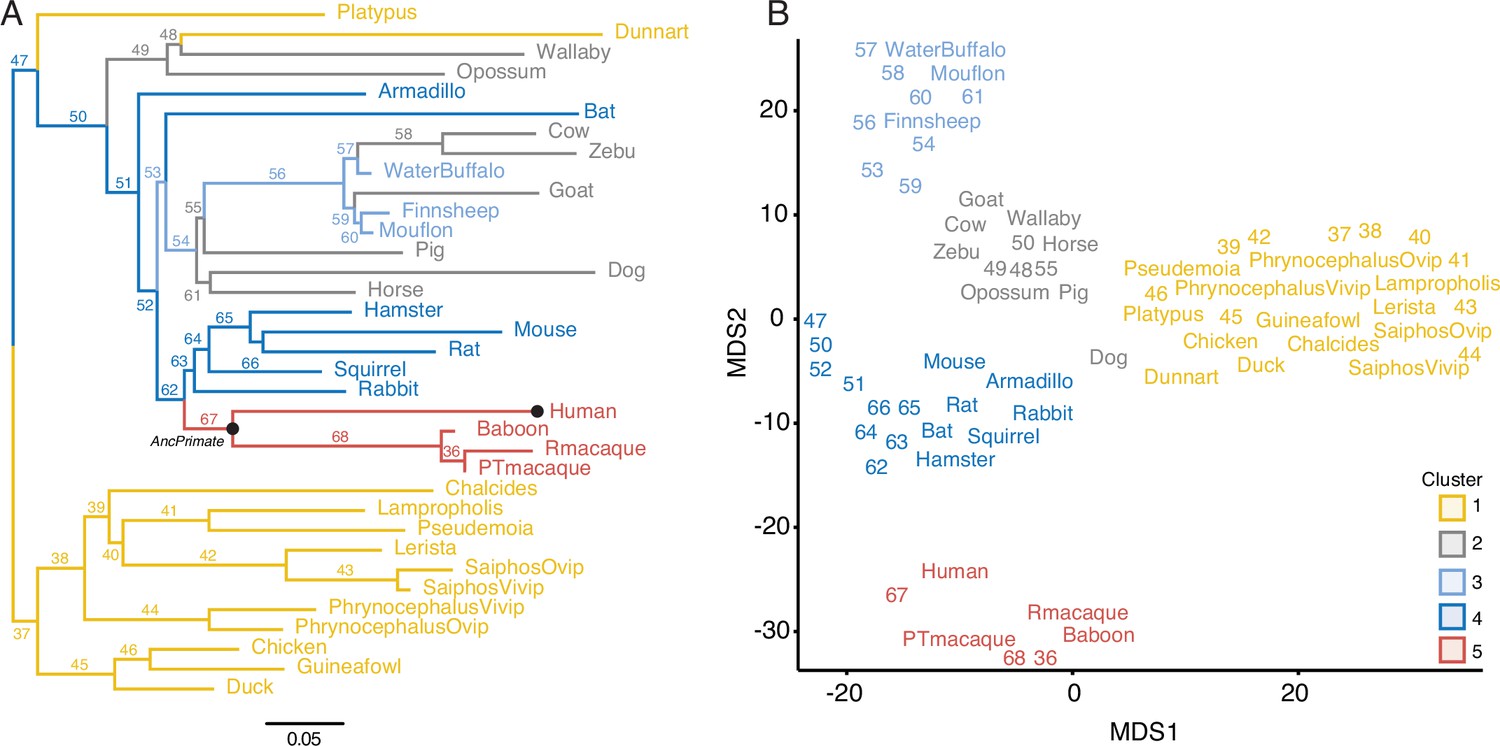
Gene expression profiling at the amniote maternal–fetal interface.
(A) Amniote phylogeny with branch lengths drawn proportional to the rate of gene expression gains and losses (per gene). The ancestral primate (AncPrimate) and human nodes are indicated with black circles. Internal branches are numbered. (B) Multidimensional scaling (MDS) plot of binary encoded endometrial gene expression data for extant and ancestral reconstructed transcriptomes. Transcriptomes are colored by their group membership inferred from K-means clustering with K = 5. Numbers indicate internal branches from panel A.
-
Figure 1—source data 1
Species names (common and binomial), genome annotations used for RNA-Seq analysis, and parity mode.
- https://cdn.elifesciences.org/articles/69584/elife-69584-fig1-data1-v2.xlsx
-
Figure 1—source data 2
Gene expression matrix and ancestral reconstruction results.
- https://cdn.elifesciences.org/articles/69584/elife-69584-fig1-data2-v2.zip
-
Figure 1—source data 3
Binary encoded matrix of gene expression from extant and ancestral reconstructions used to generate Figure 1B.
- https://cdn.elifesciences.org/articles/69584/elife-69584-fig1-data3-v2.csv
Figure 1—figure supplement 1
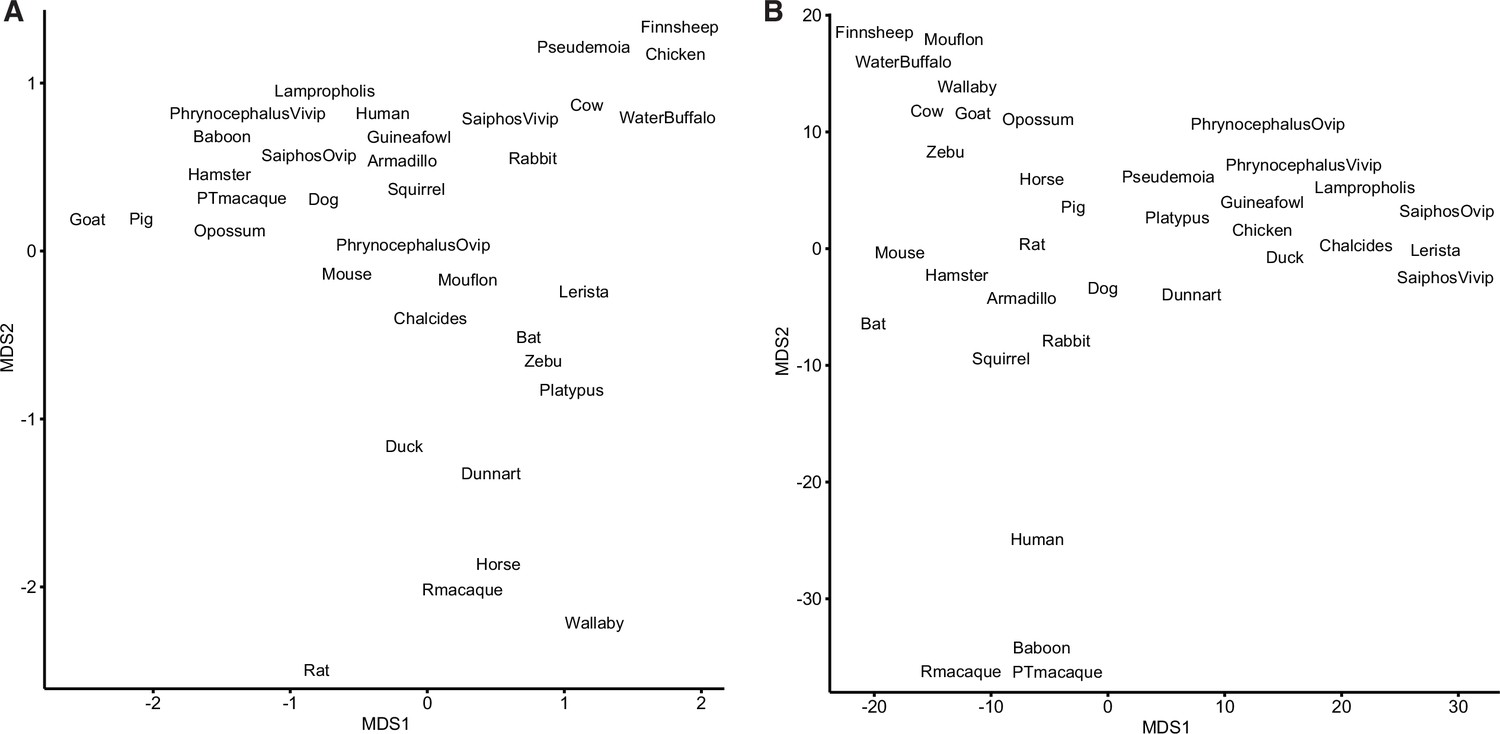
Binary encoding of gene expression data reduces noise.
(A) Multidimensional scaling (MDS) plot of transcriptomes from extant species based on gene expression levels (transcripts per millions [TPMs]). (B) MDS plot of transcriptomes from extant species based on the binary encoded endometrial gene expression dataset.
Box 1—figure 1

Gene expression and functional genomics data suggest that genes with transcripts per million (TPM) ≥2 are actively expressed.
(A) Distribution of gene expression levels from human decidual stromal cell (DSC) RNA-Seq data. Gray, kernel density estimates of gene expression levels as transcripts per million (TPM) for human RefSeq genes (genes with TPM = 0 are not shown). Expectation‐maximization‐based Gaussian mixture curve fits of expression data are shown in green and magenta. Empirical cumulative distribution fit (ECDF) to the Gaussian mixture model is shown in blue. Regions of the kernel density plot corresponding to TPM = 0, TPM = 0.01-1, and TPM ≥ 2 are indicated below the plot as black, green, and magenta pink bars, respectively. The point of the ECDF corresponding to a 50% probability of expression is indicated with a blue circle.(B) Correlation of gene expression categories (TPM = 0, TPM = 0.01-1, and TPM ≥ 2) with histone marks that characterize active promoters (H3K4me3), enhancers (H3K27ac), regions of open chromatin (DNaseI and FAIRE), and active transcription (RNAP binding to gene bodies). TSS, transcription start site. TES, transcription end site.(C) Correlation of gene expression categories (TPM = 0, TPM = 0.01-1, and TPM ≥ 2) with progesterone receptor (PGR) and the PGR co-factor GATA2 binding sites. TSS, transcription start site.
Figure 2
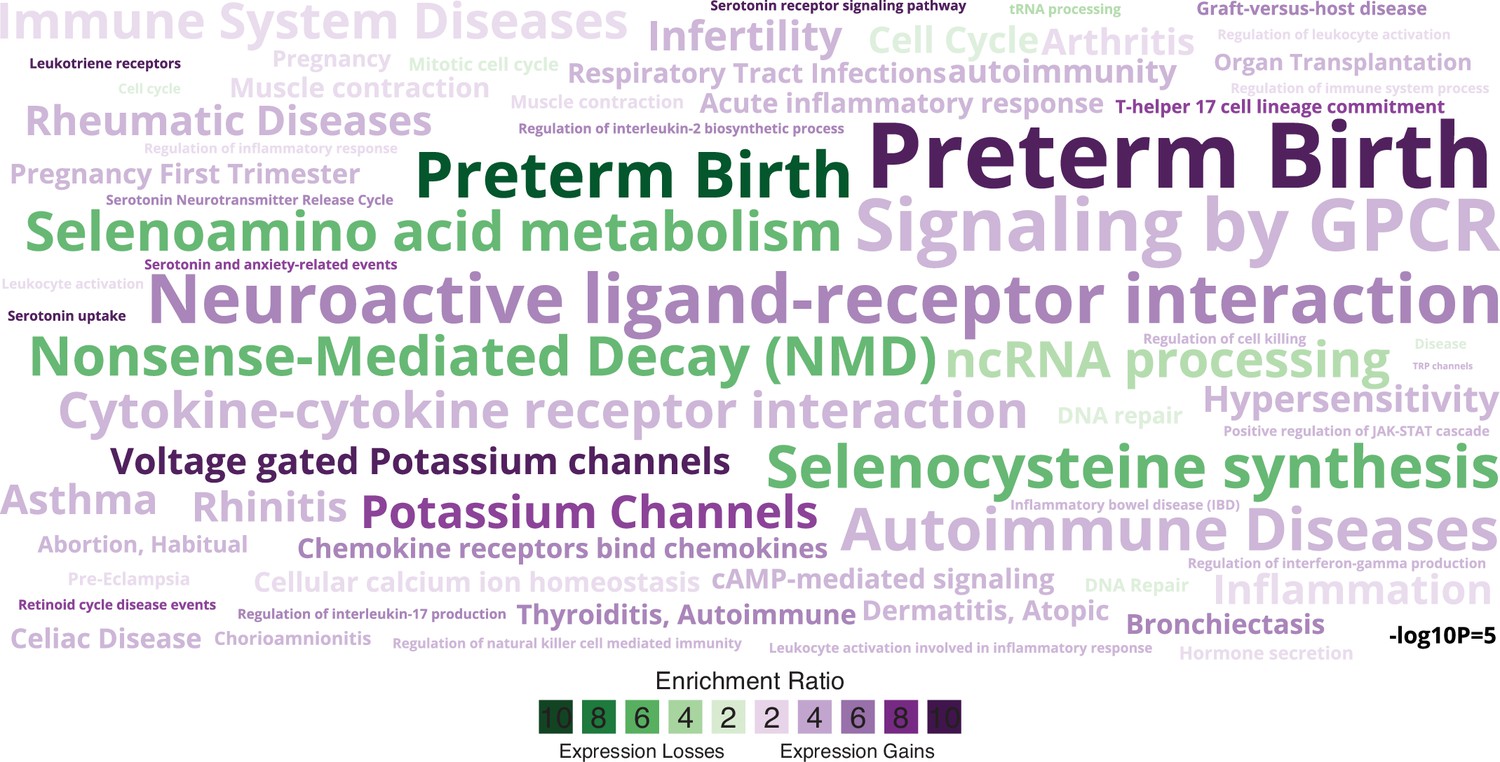
Enriched pathways, gene ontologies, and disease ontologies among genes that gained or lost endometrial expression in the Hominoid (human) lineage.
Data shown as a WordCloud, with term size proportional to −log10 hypergeometric p value (see inset scale) and colored according to enrichment ratio for genes that gained (purple) or lost (green) endometrial expression.
-
Figure 2—source data 1
Custom gmt file used for enrichment tests related to preterm birth.
- https://cdn.elifesciences.org/articles/69584/elife-69584-fig2-data1-v2.gmt
-
Figure 2—source data 2
Genes that gained expression (Bayesian posterior probability [BPP] ≥0.80) in the Hominoid (human) lineage.
- https://cdn.elifesciences.org/articles/69584/elife-69584-fig2-data2-v2.txt
-
Figure 2—source data 3
Genes that lost expression (Bayesian posterior probability [BPP] ≥0.80) in the Hominoid (human) lineage.
- https://cdn.elifesciences.org/articles/69584/elife-69584-fig2-data3-v2.txt
Box 2—figure 1

Genomic features of human recruited genes.
(A) Anatogram heatmap showing organs in which the expression of human recruited genes is enriched (the top 15 organs FDR < 0.05).(B) Distribution of human recruited gene expression levels from human gestation week 9-22 decidua RNA-Seq data. Light pink, kernel density estimates of gene expression levels as transcripts per million (TPM) for human RefSeq genes (genes with TPM < 2 are classified as “not expressed” and are not shown). Expectation‐maximization‐based Gaussian mixture curve fits of expression data are shown in purple (low expressed genes) and magenta (high expressed genes), the TPM 4.2 cutoff for defining low and high expressed genes is shown as a black circle. Empirical cumulative distribution fit (ECDF) to the gene expression data is shown in blue, the point of the ECDF at which 50% of genes are binned into either the high or low expression sets is indicated with a blue circle.(C) Correlation of gene expression categories (random genomic locations, TPM = 0, TPM < 4.2, and ≥ 4.2) with histone marks that characterize active promoters (H3K4me3), enhancers (H3K27ac), regions of open chromatin (DNaseI and FAIRE), PGR and GATA2 binding sites, and RNAP binding to gene bodies (active transcription). TSS, transcription start site. TES, transcription end site.(D) Correlation of gene expression categories (random genomic locations, TPM = 0, human recruited genes with (+) and without (–) TEs in their promoters) with H3K4me3, H3K27ac, DNaseI, FAIRE, PGR, GATA2, RNAP signal intensities. TSS, transcription start site. TES, transcription end site.(E) Number of transposable element families within the promoters and 5’-UTRs of human recruited genes. Transposable elements are colored by their lineage specificity.
Figure 3 with 2 supplements
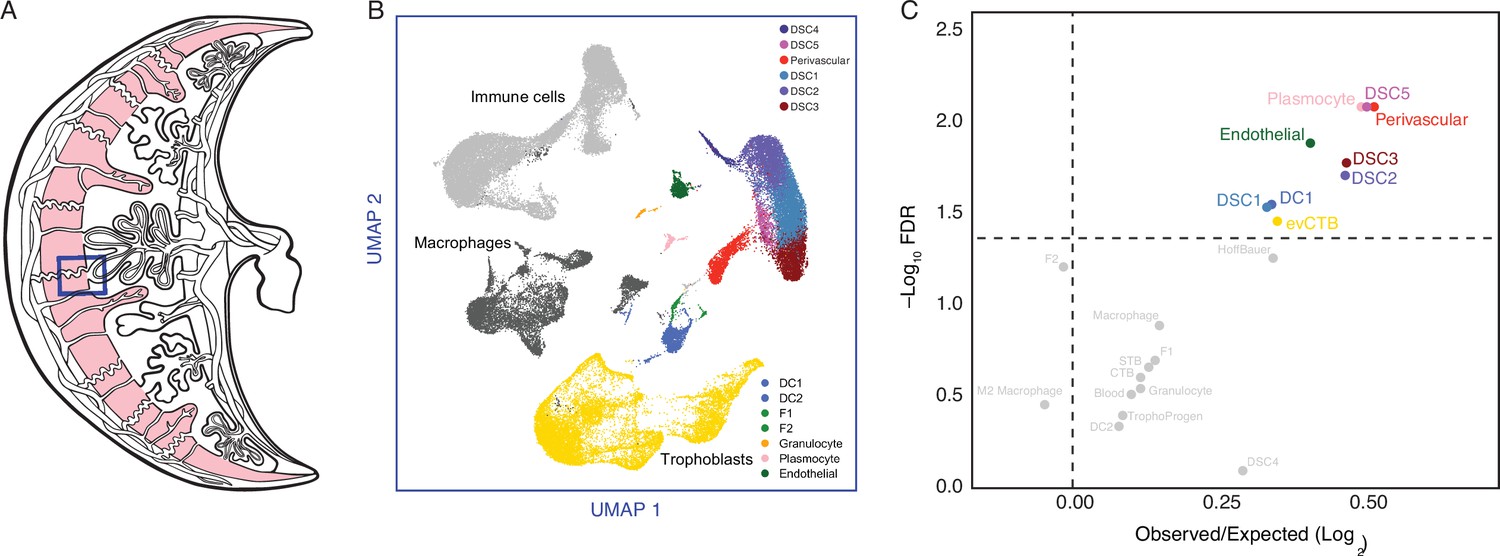
The expression of Hominoid (human) recruited genes enriched in endometrial stromal lineage cells.
(A) Anatogram of the human maternal–fetal interface. The decidua is shown in light pink, single-cell RNA-Seq (scRNA-Seq) data (Vento-Tormo et al., 2018) were generated from the region boxed in blue. (B) Uniform Manifold Approximation and Projection (UMAP) clustering of cells from the first trimester maternal–fetal interface. Major cell types and lineages are colored. (C) Volcano plot showing cell types at the maternal–fetal interface in which Hominoid (human) recruited genes are significantly (false discovery rate [FDR] corrected two-way Fisher’s exact test) enriched (Log2 Observed/Expected). Cell types in which recruited genes are significantly enriched (FDR ≤0.05) are labeled and colored as in panel A.
Figure 3—figure supplement 1
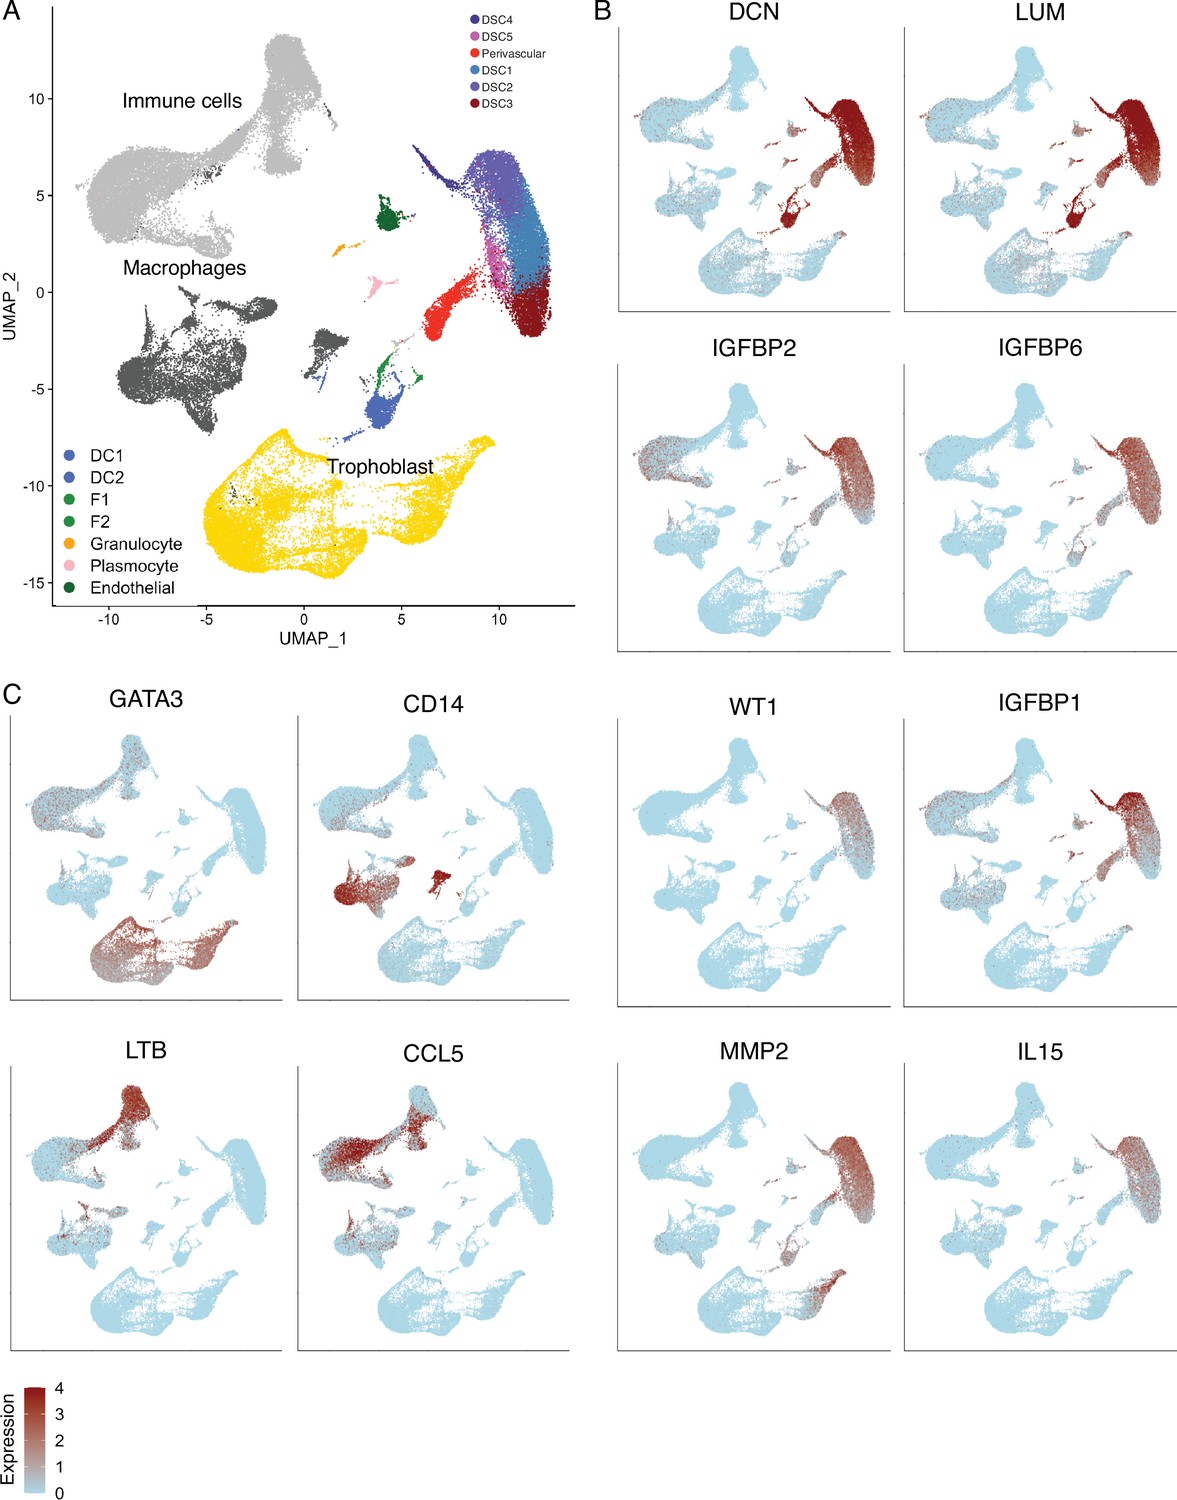
Identification of cell-type populations are the first trimester human maternal-fetal interface.
(A) UMAP clustering of cells from the first trimester maternal–fetal interface, major cell types and lineages are colored. (B) Feature plots based on the UMAP plot showing the single-cell expression of eight marker genes for the endometrial stromal cell lineage. (C) Feature plots based on the UMAP plot showing the single-cell expression of marker genes for immune cells (LTB, CCL5), macrophage (CD14), and trophoblasts (GATA3).
Figure 3—figure supplement 2
Expression of recruited genes in cell-type populations are the first trimester human maternal-fetal interface.
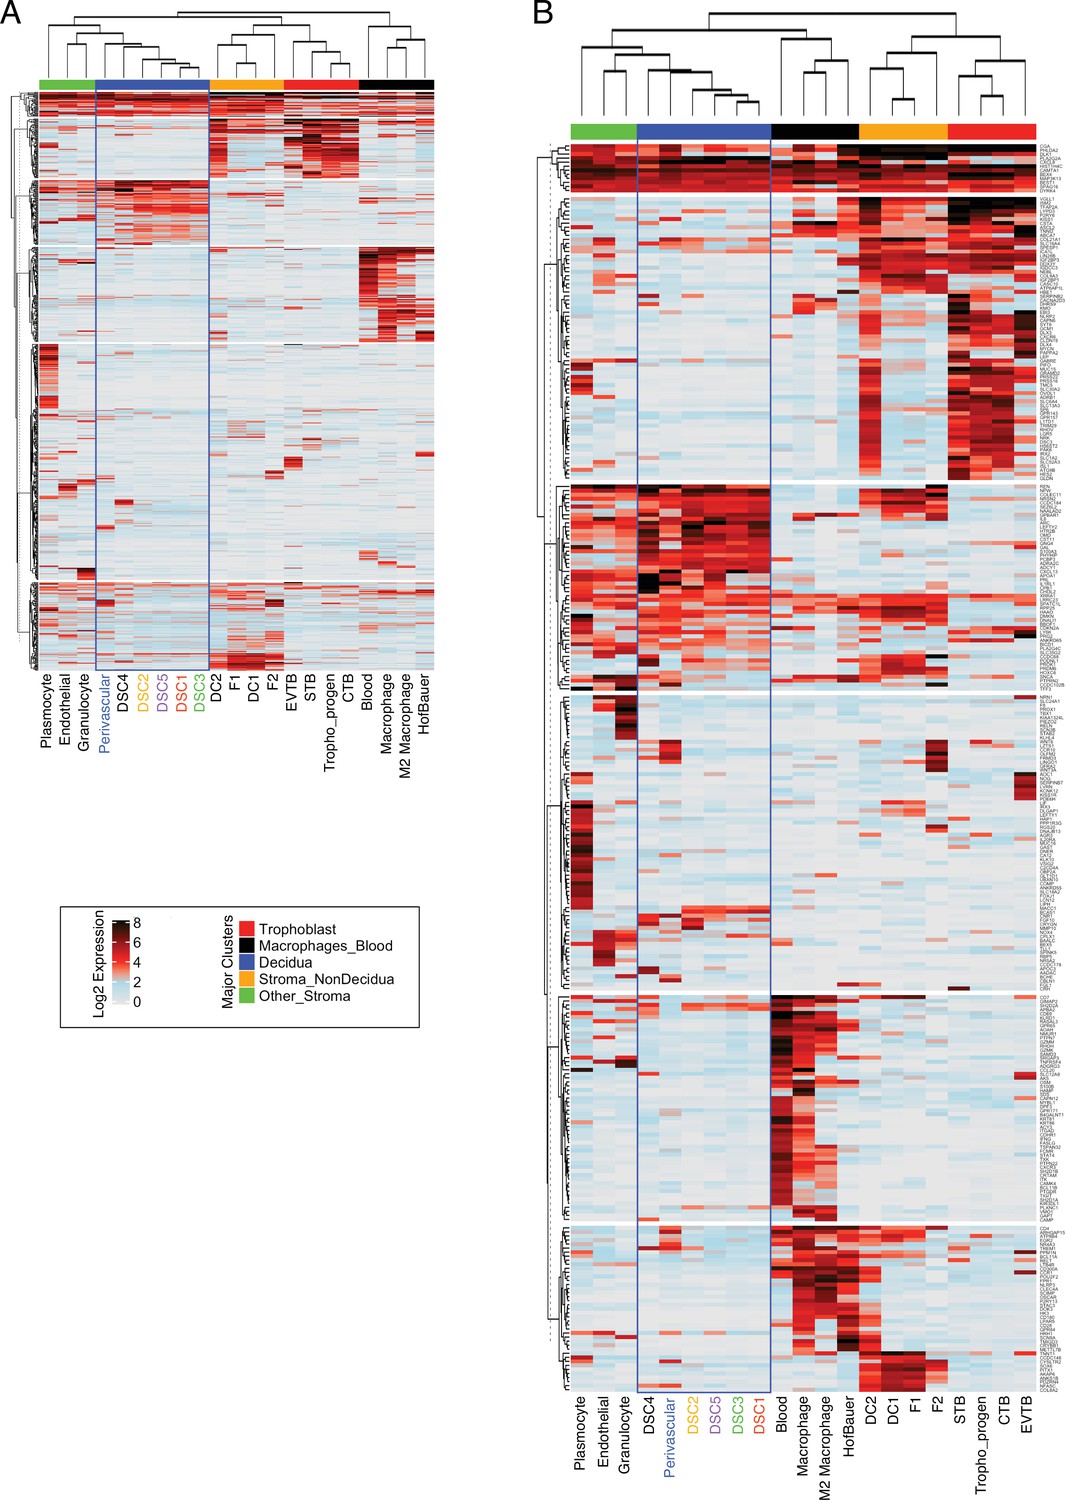
(A) Heatmap showing the expression of 840 human-gain genes in distinct cell types identified as expressed at the maternal–fetus interface. Each row represents a gene that is expressed (Log2 average scaled expression >0) in at least one cell type denoted as individual columns. Prior to analysis, the single cellular expression of envelopes was averaged for each cell type. The upper bars are manually annotated as clusters that denote the primary tissue where the cell types are raised on the top of the heatmap. Rows are clustered using the K-means algorithm, and columns are hierarchically clustered using Euclidean distance and Spearman’s correlation. Endometrial stromal lineage cells are boxed in blue. (B) Heatmap similar to the one in A, except the analysis was performed on highly expressed 442 genes (Log2 scaled average expression >0.5). Endometrial stromal lineage cells are boxed in blue.
Figure 4
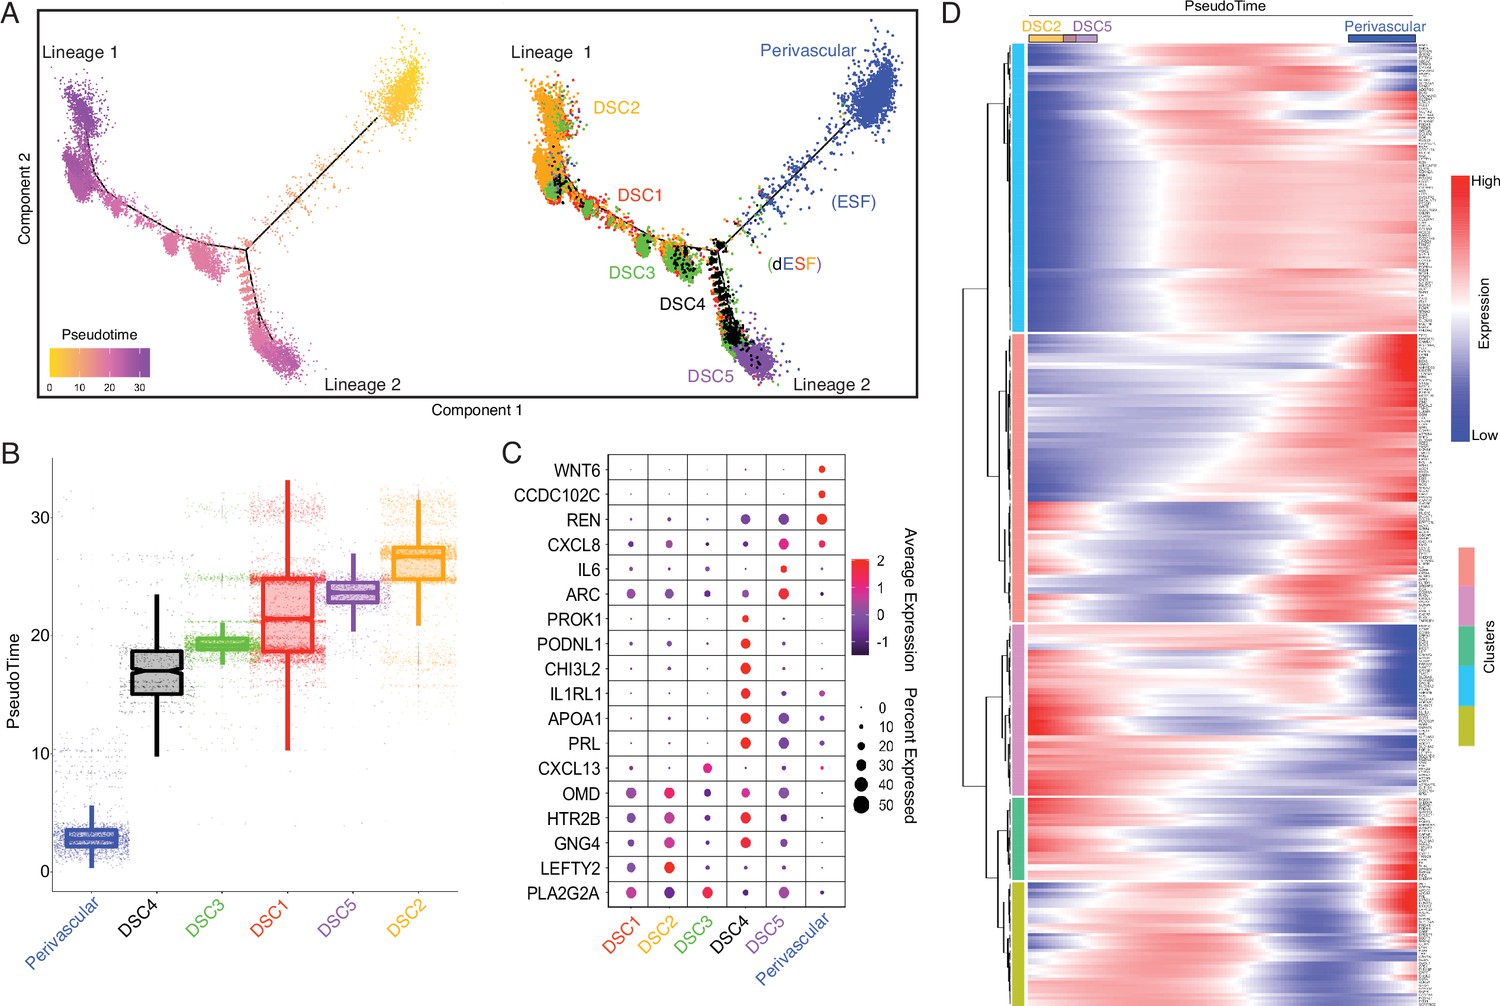
Human-gain genes' dynamic expression marks the distinct lineages of decidual cells in the spatiotemporal niche.
(A) Pseudotime trajectory of endometrial stromal lineages, colored from low (gold) to high (purple) pseudotime (left). Endometrial stromal lineage cell types clustered using the top 2000 differentially expressed genes and projected into a two-dimensional space (right). (B) Jittered boxplot illustrating the pseudotime of each cell from A. (C) DotPlot illustrating the intensity and abundance of selected human-gain transcript expression between endometrial stromal lineage cell types. Colors represent an average Log2 expression level scaled to the number of unique molecular identification (UMI) values in single cells. The color scale is from blue to red, corresponding to lower to higher expression, respectively. Dot size is proportional to the percent of cells expressing that gene. Genes were selected based on their differential expression on the pseudotime trajectory shown in the previous figure (Benjamini and Hochberg adjusted p value <2.2e−16, Wald test). (D) Heatmap showing the kinetics of highly expressed (Log2 scaled average expression >0.5) human-gain genes changing gradually over the trajectory of endometrial stromal lineage cell types shown in panel A. Genes (row) are clustered, and cells (column) are ordered according to the pseudotime progression.
Figure 5 with 2 supplements
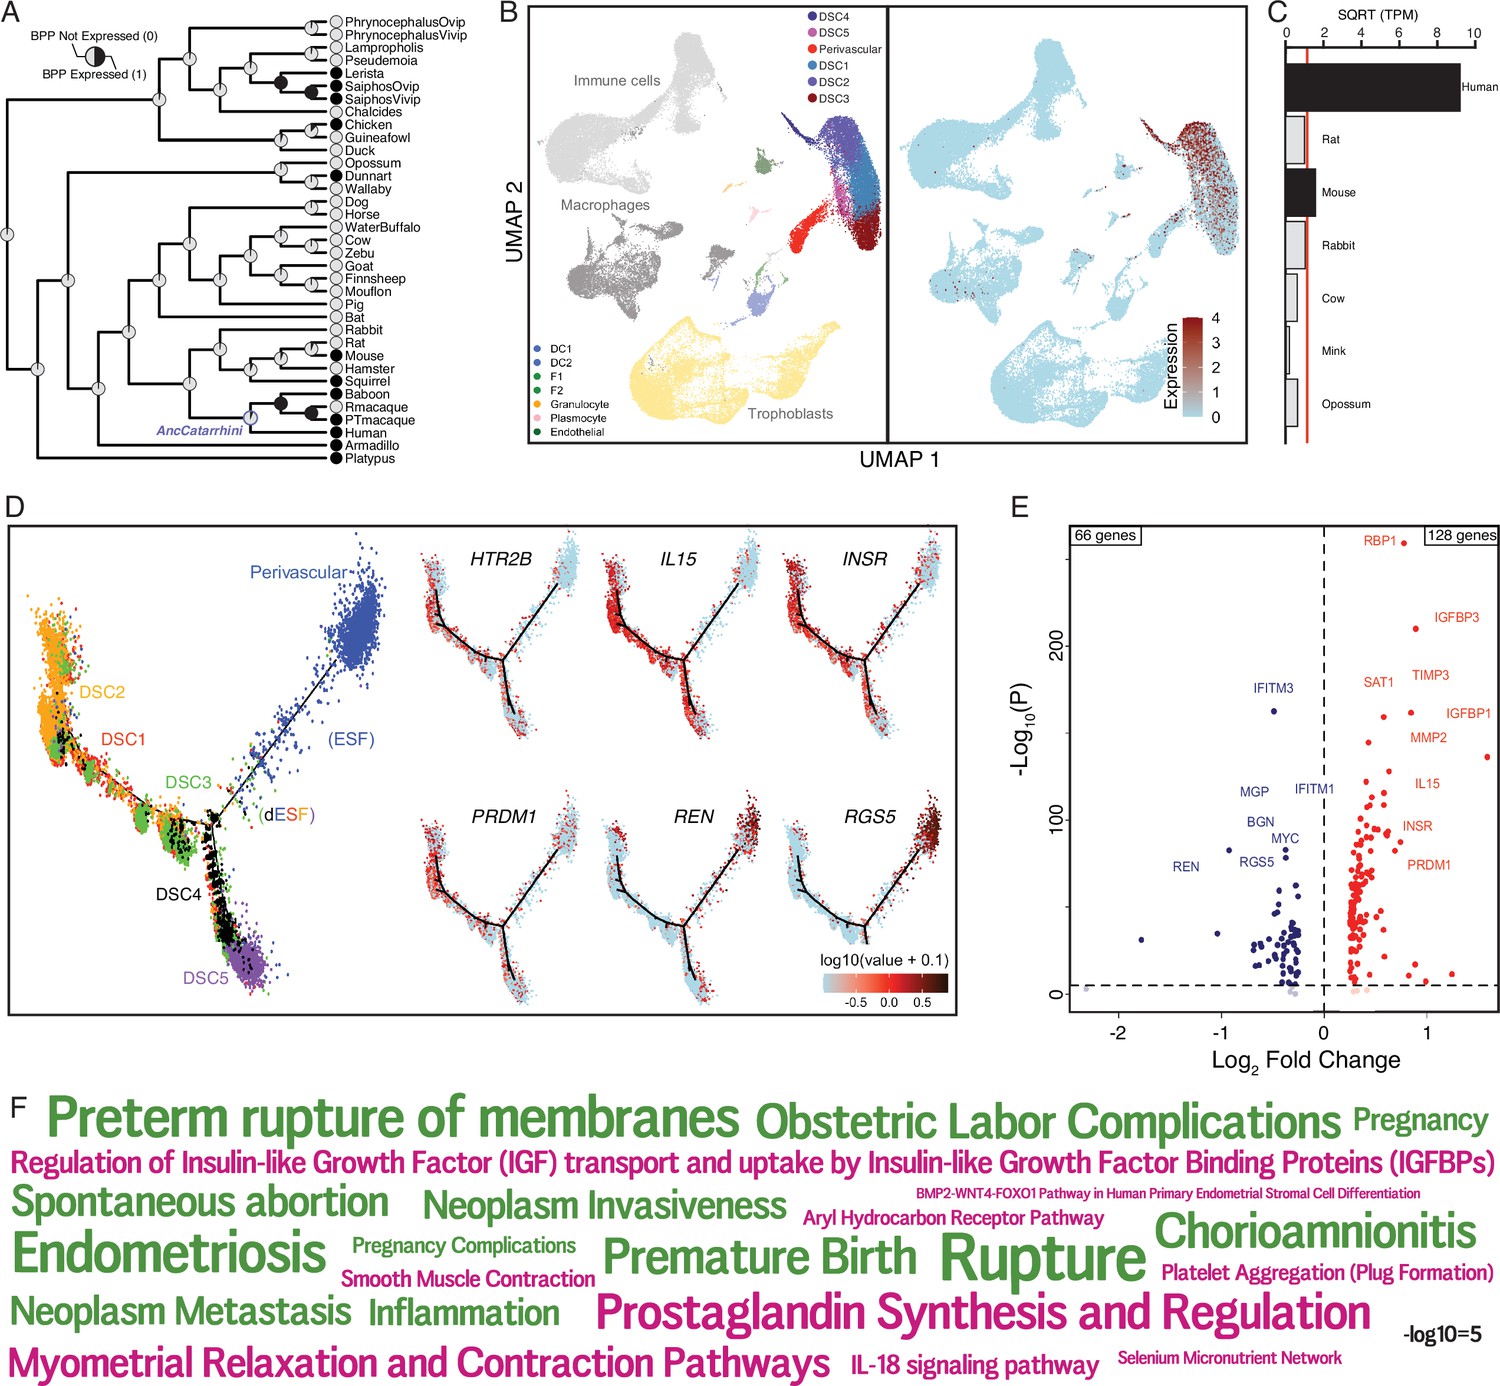
The serotonin receptor HTR2B evolved to be expressed in decidual stromal cells at the maternal–fetal interface.
(A) Ancestral construction of HTR2B expression in gravid/pregnant endometrium. Pie charts indicate the Bayesian posterior probability (BPP) that HTR2B is expressed (state 1) or not expressed (state 0). (B) UMAP clustering of cells from the first trimester maternal–fetal interface, decidual stromal cell (DSC) clusters are labeled and highlighted (left). Feature plot based on the UMAP plot showing the single-cell expression of HTR2B in the endometrial stromal lineage cells. (C) Average expression of HTR2B in RNA-Seq data from human, rat, mouse, rabbit, cow, mink, and opossum endometrial stromal fibroblasts (ESFs). Data are shown as square root (SQRT) transformed transcripts per million (TPM), n = 2. (D) Pseudotime trajectory of endometrial stromal fibroblast lineage cells. Monocle2 visualization of five distinct clusters of DSCs and perivascular trajectories using the top 2000 differentially expressed genes projected into a two-dimensional space. HTR2B, IL15, INSR, PRDM1, REN, and RGS5 expression (log-transformed counts) in individual cells are shown in red along the pseudotime trajectory. IL15, INSR, and PRDM1 mark DSCs, REN and RGS5 mark perivascular and decidualizing ESFs (dESFs). (E) Volcano plot showing genes that are differentially expressed between HTR2B+ and HTRB− decidual stromal cells. Horizontal dashed line indicates −Log10+ = 2 (FDR corrected two-way Fisher’s exact test). (F) Word Cloud showing enriched pathways (pink) and disease ontologies (green) in which genes that are differentially expressed between HTR2B+ and HTR2B− cells are enriched.
-
Figure 5—source data 1
Genes that are differentially expressed between HTR2B+ and HTR2B− cells, and the pathways/disease ontologies in which they are enriched.
- https://cdn.elifesciences.org/articles/69584/elife-69584-fig5-data1-v2.xls
Figure 5—figure supplement 1
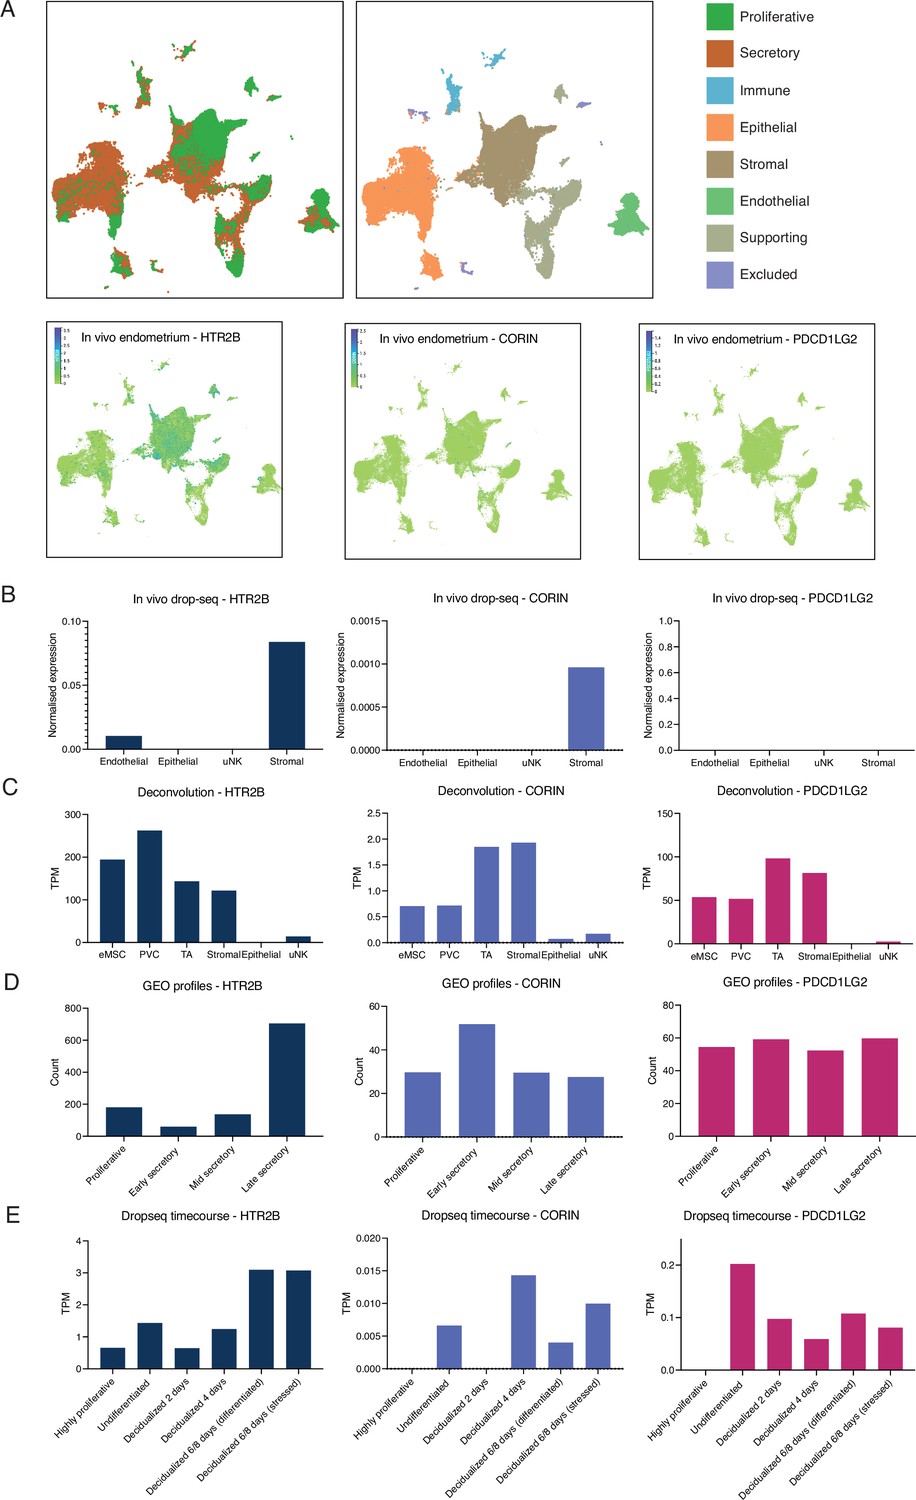
Additional single-cell RNA-Seq [scRNA-Seq] analyses of HTR2B, PDCD1LG2, and CORIN across multiple endometrial datasets.
(A) Temporal dynamics of human endometrium in vivo. Single-cell profiling of the human endometrium in nonpregnant proliferative and secretory phase biopsies (n = 15). Data Garcia-Alonso et al., 2021 available on https://www.reproductivecellatlas.org/. (B) Single-cell analysis of peri-implantation endometrium. Freshly isolated endometrial cells (Luteinizing Hormone (LH) +8; n = 3, LH +10; n = 3) were subjected to scRNA-Seq. t-Distributed stochastic neighbour embedding (t-SNE) analysis assigned 2847 cells to 5 clusters (four shown). Clusters designated based on canonical marker genes. Data from Lucas et al., 2020. (C) Deconvolution of in vitro cell types from endometrium. Total RNA isolated from six different in vitro cell types subjected to RNA-Seq analysis from three midluteal biopsies. Endometrial mesenchymal stem cell (eMSC) – colony-forming W5C5+ cells, perivascular cell (PVC) – noncolony-forming W5C5+ cells, transit amplifying cell (TA) – colony-forming W5C5− cells, stromal – noncolony-forming W5C5− cells, epithelial – uterine gland organoids, and uterine natural killer cell (uNK) – CD56-positive cells. Data from Diniz-da-Costa et al., 2021. (D) Endometrium throughout the menstrual cycle. Publicly available dataset from Gene Expression Omnibus (GEO profiles). Analysis of normal endometrium in distinct phases of the menstrual cycle using Affymetrix Human Genome U133 Plus 2.0 Array (GDS2052). (E) Single-cell analysis of the decidual pathway in vitro. Primary endometrial stromal fibroblasts (ESFs) were decidualized in decidual stromal cells (DSCs) with medroxyprogesterone 17-acetate (MPA) and cyclic adenosine monophosphate (cAMP) for 8 days. Cells were collected every 48 hr and subjected to single-cell analysis. Four thousand five hundred and eighty cells were assigned to seven transcriptional states (six shown). Results are presented as transcripts per million (TPM). Data from Lucas et al., 2020.
Figure 5—figure supplement 2
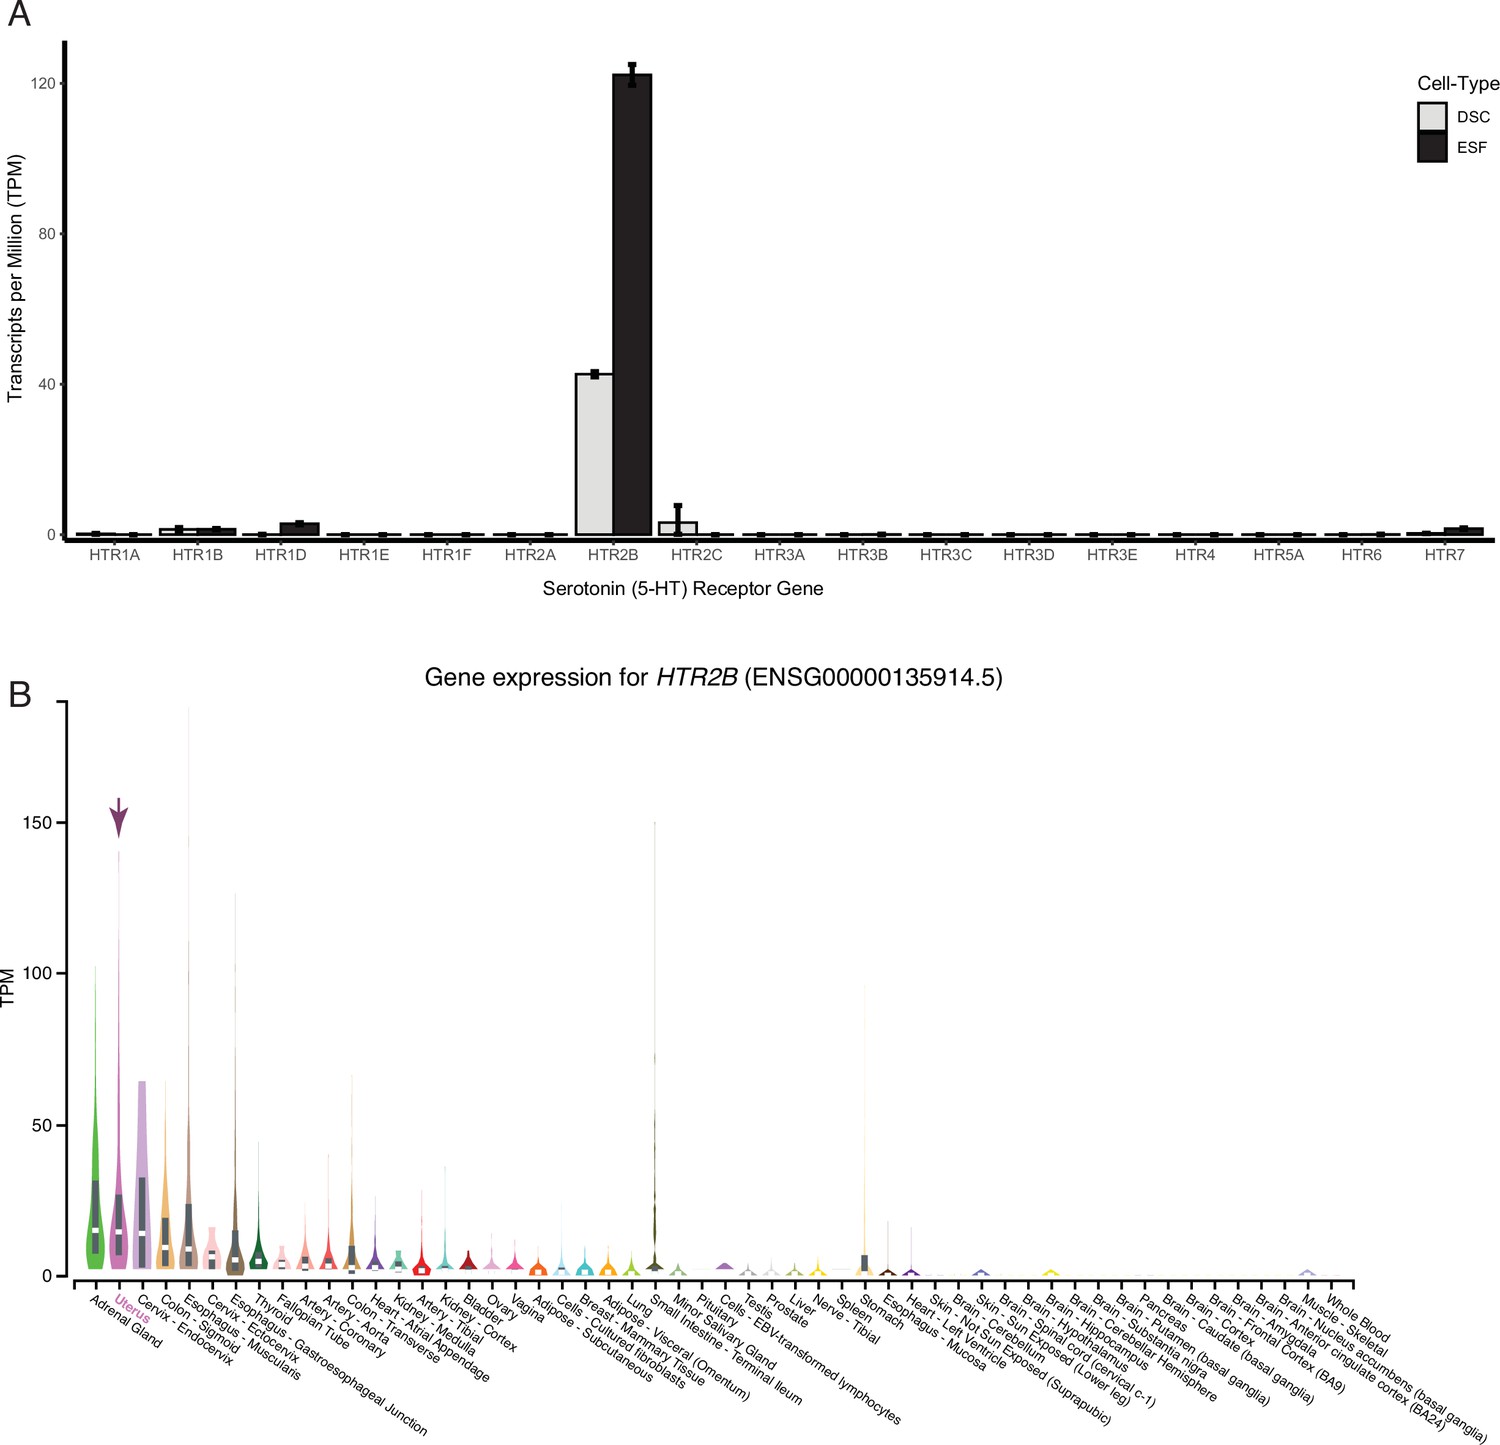
HTR2B is the only serotonin receptor expressed endometrial cells.
(A) HTR2B is the only serotonin (5-HT) receptor robustly expressed in human ESFs and DSCs. Expression of serotonin receptors in bulk RNA-Seq data (n = 2) from human endometrial stromal fibroblasts (ESF) and ESFs induced into decidual stromal cells (DSC) by cAMP/progesterone treatment for 48 hours. (B) Expression of HTR2B in GTEx tissues. Violin plots are colored by anatomical system; the uterus is indicated by an arrow.
Figure 6 with 3 supplements
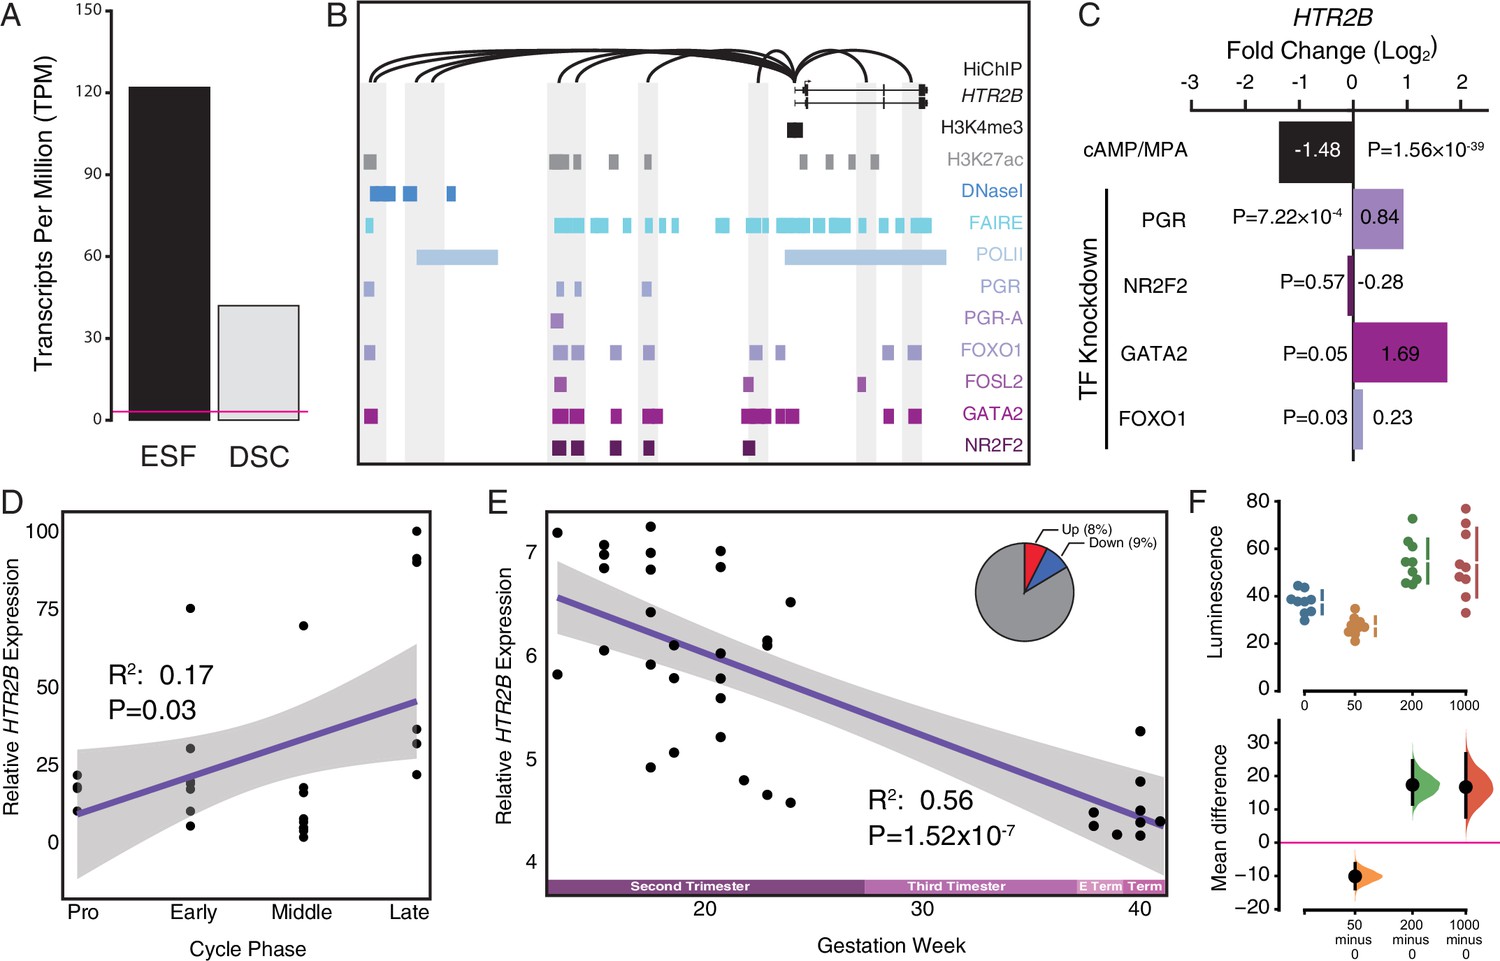
Co-option of serotonin signaling in the endometrium.
(A) HTR2B expression in human endometrial stromal fibroblasts (ESFs) is downregulated by cyclic adenosine monophosphate (cAMP)/progesterone treatment for 48 hr (decidualization into decidual stromal cells [DSCs]). Transcript abundance in RNA-Seq data is shown as transcripts per million (TPM). (B) Regulatory elements in human DSCs at the HTR2B locus. ChIP-Seq peaks shown for H3K4me3, H3K27ac, polymerase II (POLII), progesterone receptor (PGR) and the PGR-A isoform, FOXO1, FOSL2, GATA2, and NR2F2 (COUP-TFII). Regions of open chromatin are shown from DNaseI- and FAIRE-Seq. Chromatin loops inferred from H3K27ac HiChIP are shown as black arcs connecting the HTR2B promoter to other locations in the genome shown in gray. (C) HTR2B expression is downregulated by in vitro decidualization of ESFs into DSC by cAMP/progesterone treatment, and upregulated by small interfering RNA (siRNA)-mediated knockdown of PGR, GATA2, and FOXO1, but not NR2F2. n = 3 per transcription factor knockdown. (D) Relative expression of HTR2B in the proliferative (n = 6), early (n = 4), middle (n = 9), and late (n = 8) secretory phases of the menstrual cycle. Note that outliers are excluded from the figure but not the regression; 95% CI is shown in gray. Gene expression data from Talbi et al., 2006. (E) Relative expression of HTR2B in the basal plate from midgestation to term (14–40 weeks, n = 36); 95% confidence interval (CI) is shown in gray. Inset, percent of up- and downregulated genes between weeks 14–19 and 37–40 of pregnancy (false discovery rate [FDR] ≤0.10). Gene expression data from Winn et al., 2007. (F) Cumming estimation plot showing mean difference in luminescence for the serotonin dose response. Upper axis shows relative luminescence of human decidual stromal cells (hDSCs) transiently transfected with a luciferase expression vector that drives the transcription of the luciferase reporter gene from a cAMP/PKA response element (pGL4.29[luc2P/CRE/Hygro]) 6 hr after treatment with serotonin (50, 200, and 1000 μM) or vehicle control (water). Lower axes, mean differences are plotted as bootstrap sampling distributions (n = 5000; the confidence interval is bias-corrected and accelerated). Each mean difference is depicted as a dot. Each 95 % confidence interval is indicated by the vertical error bars. p values indicate the likelihoods of observing the effect sizes, if the null hypothesis of zero difference is true.
Figure 6—figure supplement 1
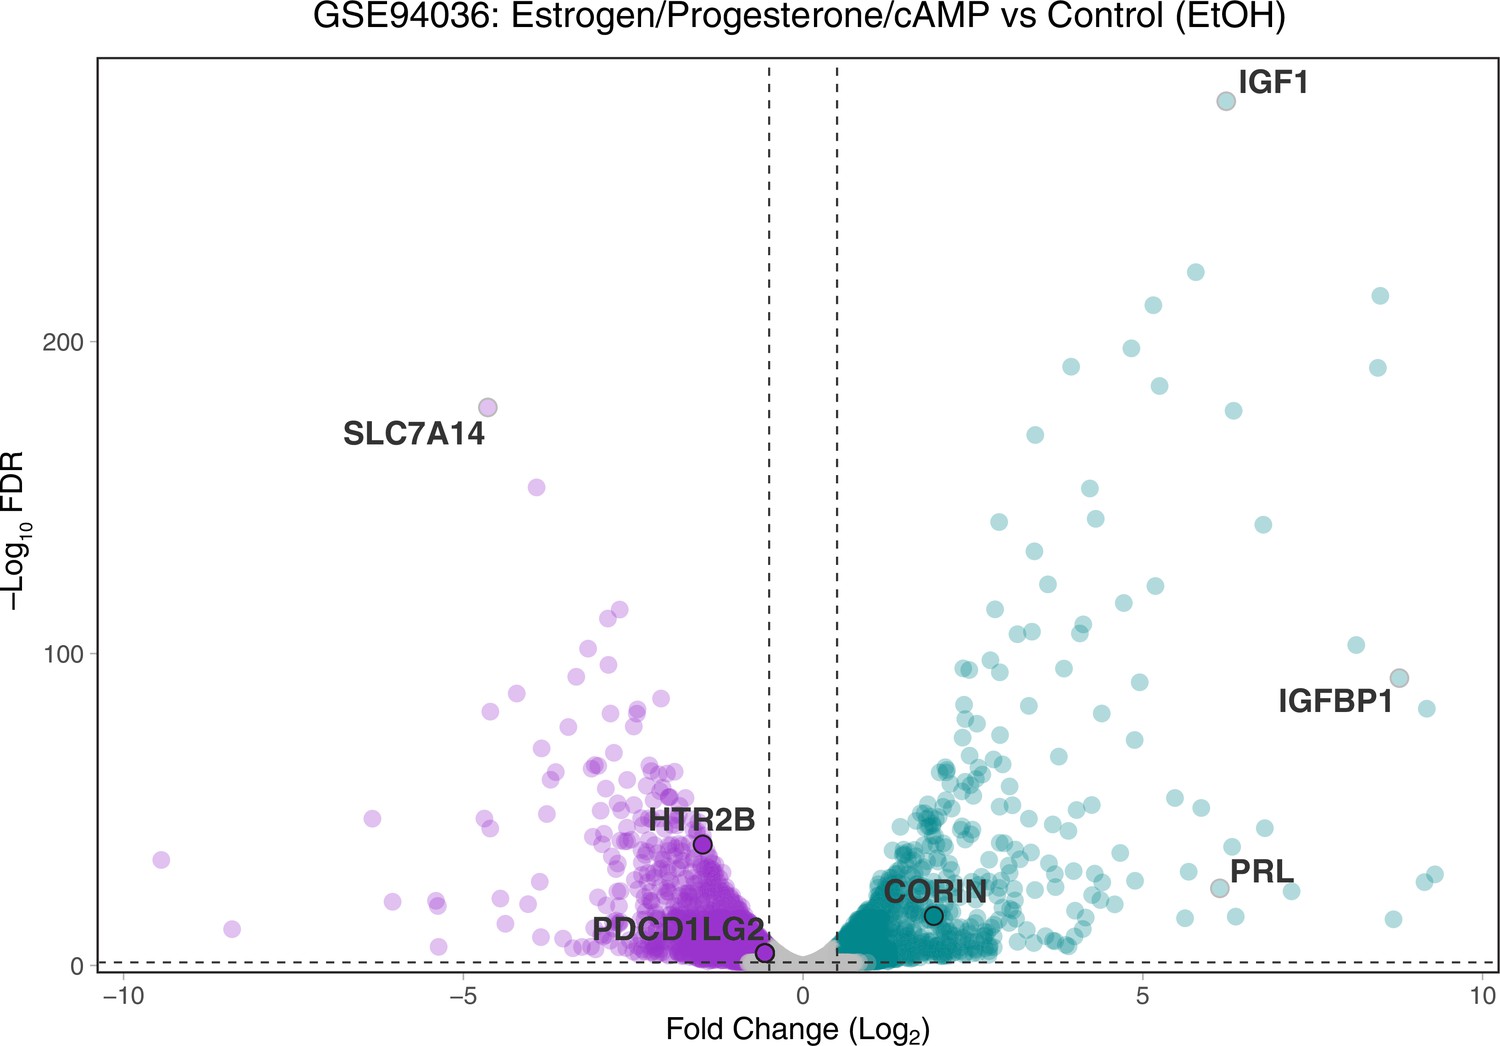
Volcano plot of gene expression changes between endometrial stromal fibroblasts (ESFs) and decidual stromal cells (DSCs).
Differentially expressed genes at −Log10 false discovery rate (FDR) ≤2 and Log2 Fold-Change ≥0.5/−0.5 are colored purple (downregulated) and green (upregulated). HTR2B, PDCD1LG2, and CORIN are shown, as are classic marker genes of decidualization (IGF1, IGFBP1, and PRL).
Figure 6—figure supplement 2
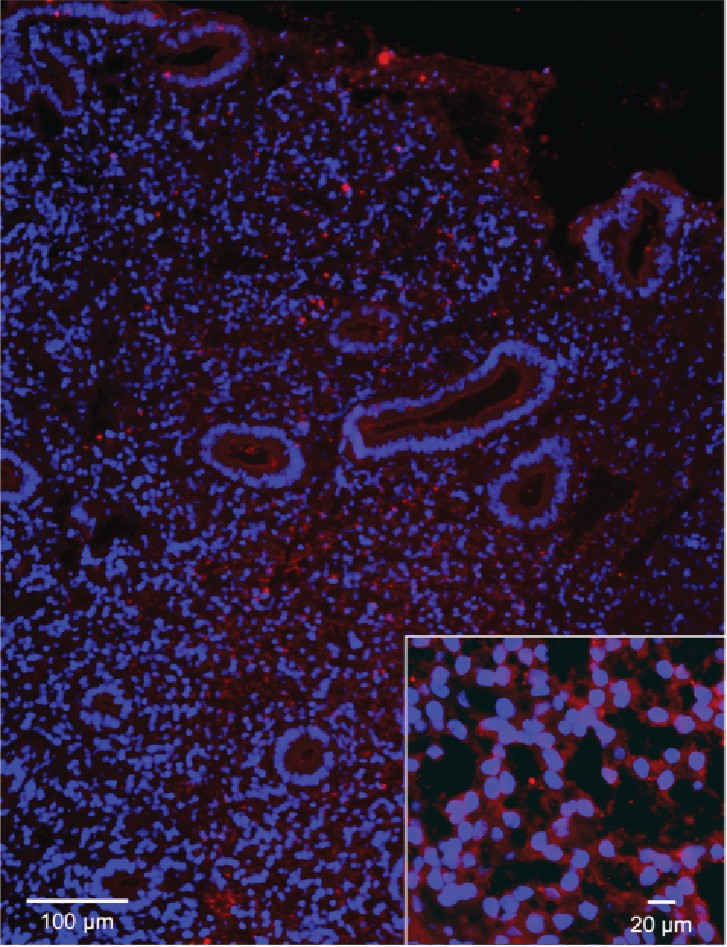
Immunofluorescent staining of HTR2B in human endometria.
Immunofluorescent staining of HTR2B in human endometria postluteinizing hormone surge day 7. Nuclei stained blue, secondary HTR2B antibody red.
Figure 6—figure supplement 3
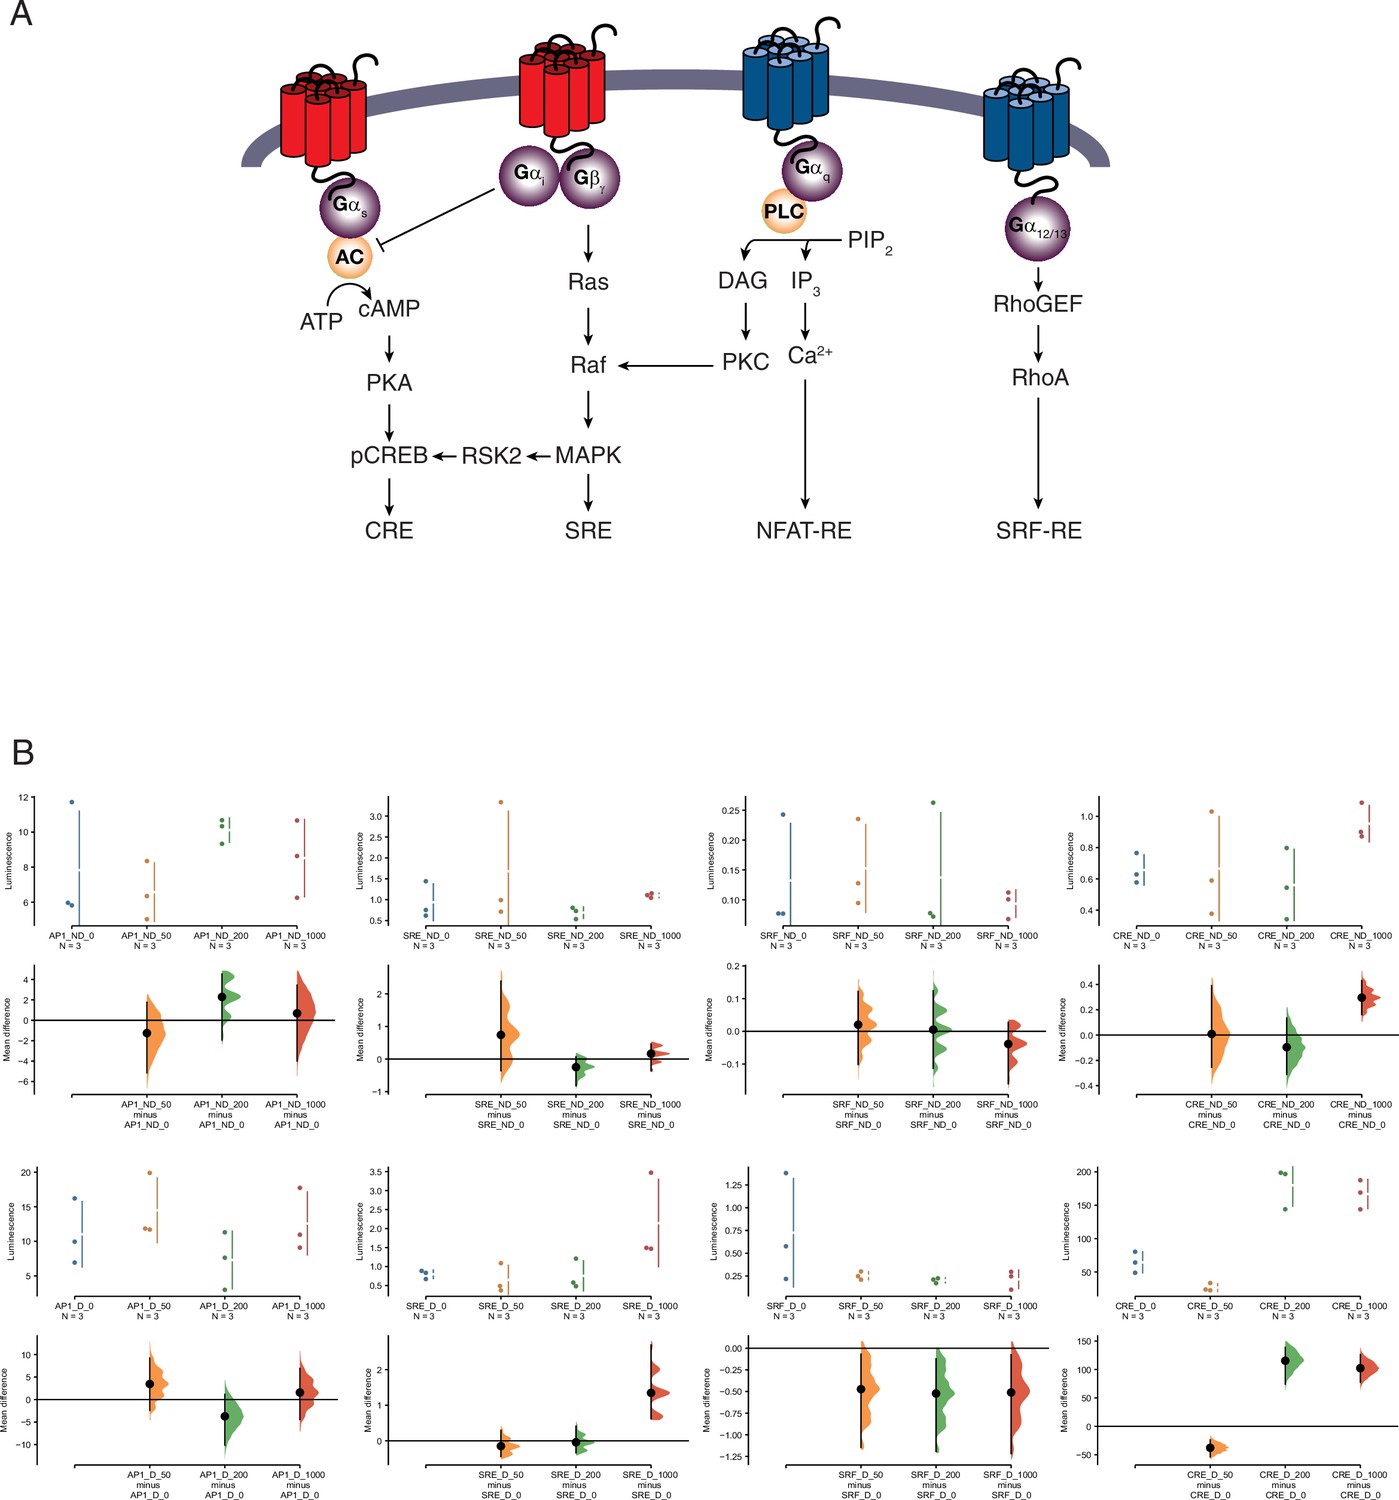
Pathway activation screen.
(A) Schematic of the luciferase-based pathway reporter system. Pathways leading to luciferase expression from the cAMP/PKA (pGL4.29[luc2P/CRE/Hygro]), AP1 (pGL4.44[luc2P/AP1-RE/Hygro]), MAPK/ERK (pGL4.33[luc2P/SRE/Hygro]), and Serum Response Factor Response Element (pGL4.34[luc2P/SRF-RE/Hygro]) reporter vectors upon serotonin treatment are shown. (B) Cumming estimation plots showing mean difference in luminescence for the serotonin dose response from pathway reporter vectors. Upper plots show relative luminescence of human endometrial stromal fibroblasts (ESFs; ND for nondecidualized) or decidual stromal cells (DSCs; D for decidualized) transiently transfected with a luciferase expression vector that drives the transcription of the indicated luciferase reporter gene 6 hr after treatment with serotonin (50, 200, and 1000 μM) or vehicle control (0). Lower plots, mean differences are plotted as bootstrap sampling distributions (n = 5000; the confidence interval is bias-corrected and accelerated). Each mean difference is depicted as a dot. Each 95 % confidence interval is indicated by the vertical error bars. p values indicate the likelihoods of observing the effect sizes, if the null hypothesis of zero difference is true. AP1 ESF results. The unpaired mean difference between AP1_ND_0 and AP1_ND_50 is −1.26 [95.0% confidence interval, CI −5.14, 1.77]. The p value of the two-sided permutation t-test is 0.652. The unpaired mean difference between AP1_ND_0 and AP1_ND_200 is 2.28 [95.0% CI −1.93, 4.54]. The p value of the two-sided permutation t-test is 0.292. The unpaired mean difference between AP1_ND_0 and AP1_ND_1000 is 0.684 [95.0% CI −3.99, 3.44]. The p value of the two-sided permutation t-test is 0.693. AP1 DSC results. The unpaired mean difference between AP1_D_0 and AP1_D_50 is 3.45 [95.0% CI −2.37, 9.23]. The p value of the two-sided permutation t-test is 0.31. The unpaired mean difference between AP1_D_0 and AP1_D_200 is −3.72 [95.0% CI −10.1, 1.14]. The p value of the two-sided permutation t-test is 0.392. The unpaired mean difference between AP1_D_0 and AP1_D_1000 is 1.56 [95.0% CI −4.41, 6.91]. The p value of the two-sided permutation t-test is 0.528. Serum response element (SRE) ESF results. The unpaired mean difference between SRE_ND_0 and SRE_ND_50 is 0.74 [95.0% CI −0.361, 2.39]. The p value of the two-sided permutation t-test is 0.494. The unpaired mean difference between SRE_ND_0 and SRE_ND_200 is −0.248 [95.0% CI −0.816, 0.0713]. The p value of the two-sided permutation t-test is 0.403. The unpaired mean difference between SRE_ND_0 and SRE_ND_1000 is 0.164 [95.0% CI −0.361, 0.459]. The p value of the two-sided permutation t-test is 0.405. SRE DSC results. The unpaired mean difference between SRE_D_0 and SRE_D_50 is −0.147 [95.0% CI −0.44, 0.293]. The p value of the two-sided permutation t-test is 0.501. The unpaired mean difference between SRE_D_0 and SRE_D_200 is −0.0399 [95.0% CI −0.336, 0.412]. The p value of the two-sided permutation t-test is 0.793. The unpaired mean difference between SRE_D_0 and SRE_D_1000 is 1.35 [95.0% CI 0.624, 2.69]. The p value of the two-sided permutation t-test is 0.0. SRF ESF results. The unpaired mean difference between SRF_ND_0 and SRF_ND_50 is 0.0203 [95.0% CI −0.101, 0.122]. The p value of the two-sided permutation t-test is 0.516. The unpaired mean difference between SRF_ND_0 and SRF_ND_200 is 0.00516 [95.0% CI −0.114, 0.124]. The p value of the two-sided permutation t-test is 0.727. The unpaired mean difference between SRF_ND_0 and SRF_ND_1000 is −0.0387 [95.0% CI −0.16, 0.0276]. The p value of the two-sided permutation t-test is 0.693. SRF DSC results. The unpaired mean difference between SRF_D_0 and SRF_D_50 is −0.473 [95.0% CI −1.15, −0.0678]. The p value of the two-sided permutation t-test is 0.2. The unpaired mean difference between SRF_D_0 and SRF_D_200 is −0.523 [95.0% CI −1.19, −0.122]. The p value of the two-sided permutation t-test is 0.104. The unpaired mean difference between SRF_D_0 and SRF_D_1000 is −0.511 [95.0% CI −1.22, −0.0742]. The p value of the two-sided permutation t-test is 0.199. CRE ESF results. The unpaired mean difference between CRE_ND_0 and CRE_ND_50 is 0.00845 [95.0% CI −0.255, 0.39]. The p value of the two-sided permutation t-test is 0.798. The unpaired mean difference between CRE_ND_0 and CRE_ND_200 is −0.096 [95.0% CI −0.31, 0.135]. The p value of the two-sided permutation t-test is 0.41. The unpaired mean difference between CRE_ND_0 and CRE_ND_1000 is 0.296 [95.0% CI 0.161, 0.43]. The p value of the two-sided permutation t-test is 0.0. CRE DSC results. The unpaired mean difference between CRE_D_0 and CRE_D_50 is −37.8 [95.0% CI −53.7, −24.1]. The p value of the two-sided permutation t-test is 0.0. The unpaired mean difference between CRE_D_0 and CRE_D_200 is 1.15e+02 [95.0% CI 74.2, 1.39e+02]. The p value of the two-sided permutation t-test is 0.0. The unpaired mean difference between CRE_D_0 and CRE_D_1000 is 1.02e+02 [95.0% CI 77.3, 1.26e+02]. The p value of the two-sided permutation t-test is 0.0.
Figure 7 with 1 supplement
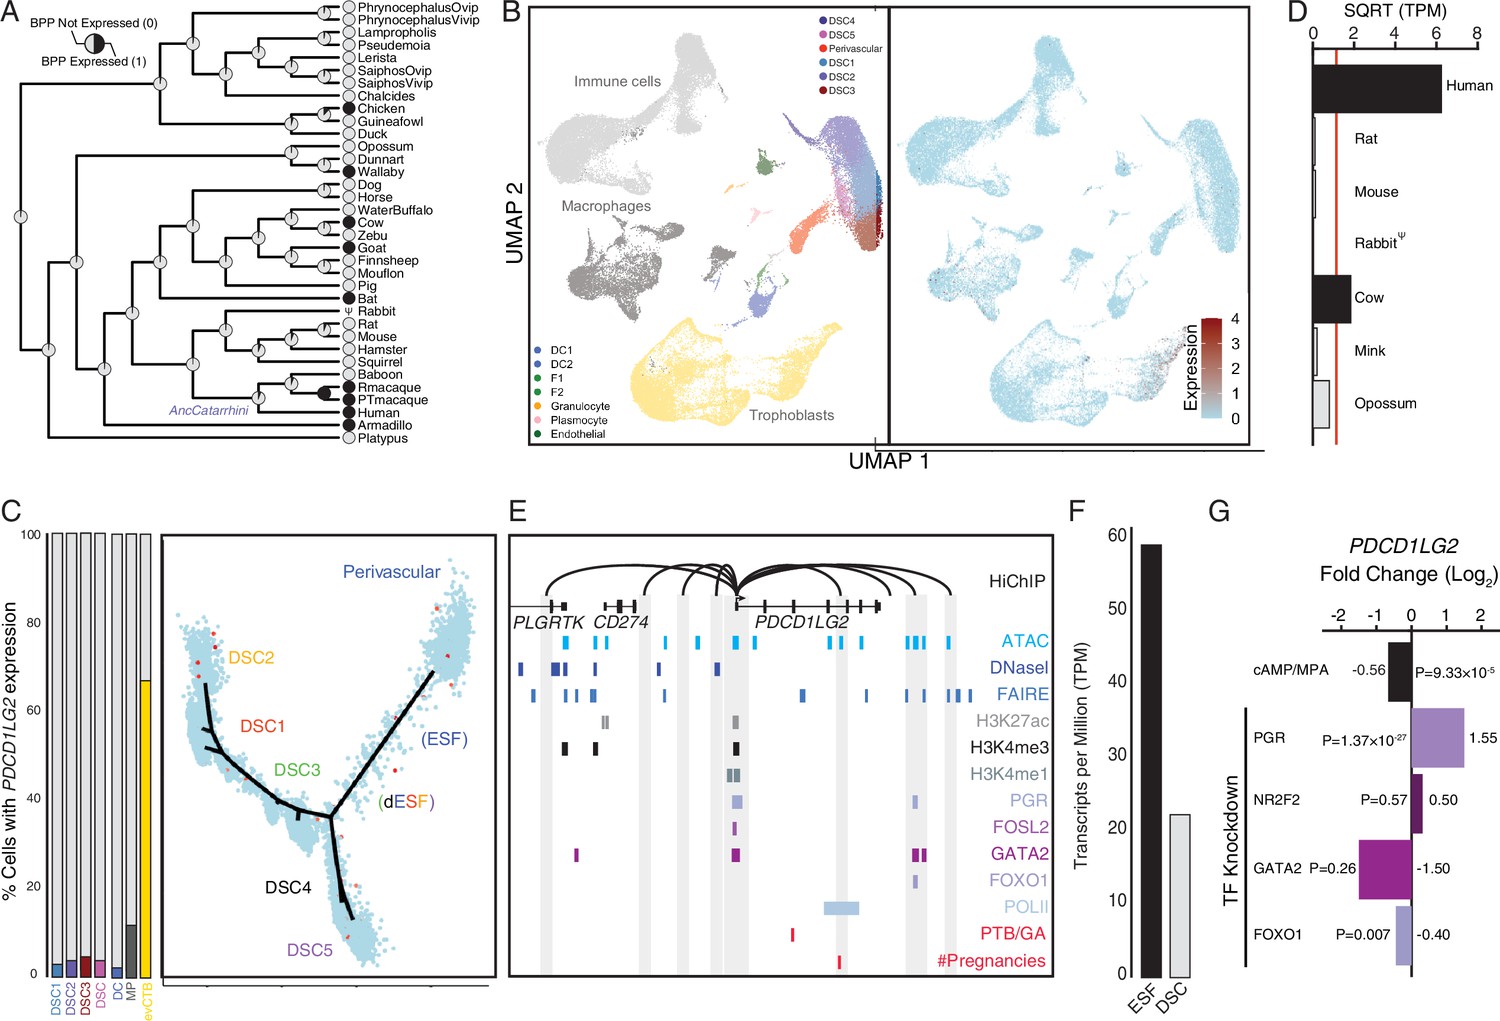
Co-option of PDCD1LG2 into endometrial cells.
(A) Ancestral construction of PDCD1LG2 expression in gravid/pregnant endometrium. Pie charts indicate the Bayesian posterior probability (BPP) that PDCD1LG2 is expressed (state 1) or not expressed (state 0). (B) UMAP clustering of cells from the first trimester maternal–fetal interface. PDCD1LG2 expression (log-transformed counts) in individual cells is shown in red. (C) Left: proportion of cell types at the maternal–fetal interface that express PDCD1LG2. Only cell types that express PDCD1LG2 are shown as a 100 % stacked bar chart: decidual stromal cell populations 1–3 (DSC1–3), average expression in DSC1–3, dendritic cells (DCs), macrophage (MP), and extravillus cytotrophoblasts (evCTB). Right: pseudotime trajectory of endometrial stromal fibroblast lineage cells. Monocle2 visualization of five distinct clusters of DSCs and perivascular trajectories projected into a two-dimensional space. PDCD1LG2 expression (log-transformed counts) in individual cells is shown in red along the pseudotime trajectory. (D) Average expression of PDCD1LG2 in RNA-Seq data from human, rat, mouse, rabbit, cow, mink, and opossum endometrial stromal fibroblasts (ESFs). Data are shown as square root (SQRT) transformed transcripts per million (TPM), n = 2. (E) Regulatory elements in human DSCs at the PDCD1LG2 locus. ChIP-Seq peaks shown for H3K4me1, H3K4me3, H3K27ac, polymerase II (POLII), progesterone receptor (PGR), FOXO1, FOSL2, GATA2, and NR2F2 (COUP-TFII). Regions of open chromatin are shown from DNaseI-, ATAC-, and FAIRE-Seq. Chromatin loops inferred from H3K27ac HiChIP are shown as black arcs connecting the PDCD1LG2 promoter to other locations in the genome shown in gray. The location of SNPs implicated by genome-wide association study (GWAS) in preterm birth is shown in red. (F) PDCD1LG2 expression in human ESFs is downregulated by cyclic adenosine monophosphate (cAMP)/progesterone treatment for 48 hr (decidualization into DSCs). Transcript abundance in RNA-Seq data is shown as TPM. (G) PDCD1LG2 expression is downregulated by in vitro decidualization of ESFs into DSC by cAMP/progesterone treatment and by siRNA-mediated knockdown of FOXO1. siRNA-mediated knockdown of PGR upregulated PDCD1LG2 expression, while there was no effect after siRNA-mediated knockdown of NR2F2 or GATA2. n = 3 per transcription factor knockdown.
Figure 7—figure supplement 1
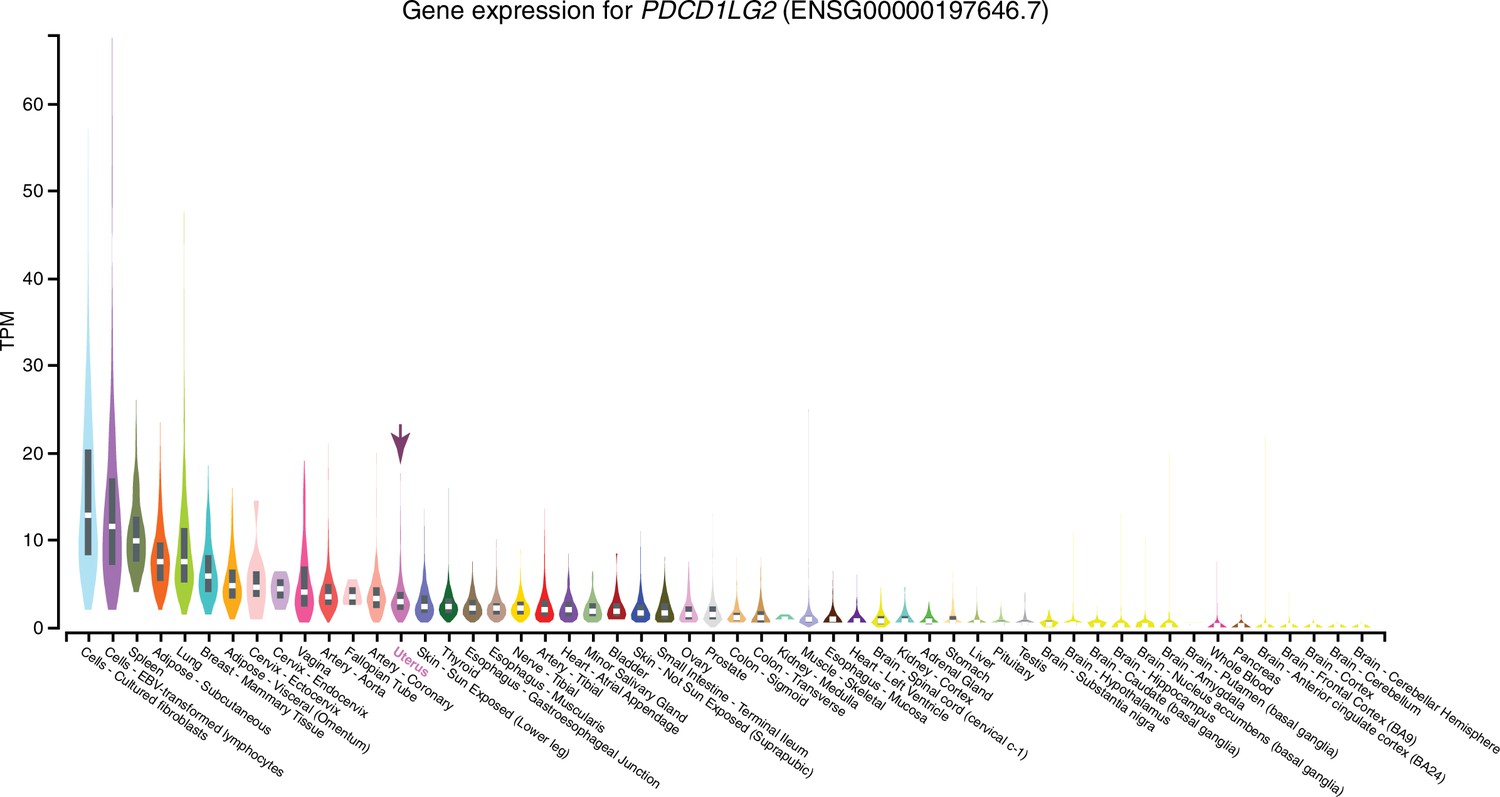
Expression of PDCD1LG2 in GTEx tissues.
Violin plots are colored by anatomical system; the uterus is indicated by an arrow.
Figure 8 with 1 supplement
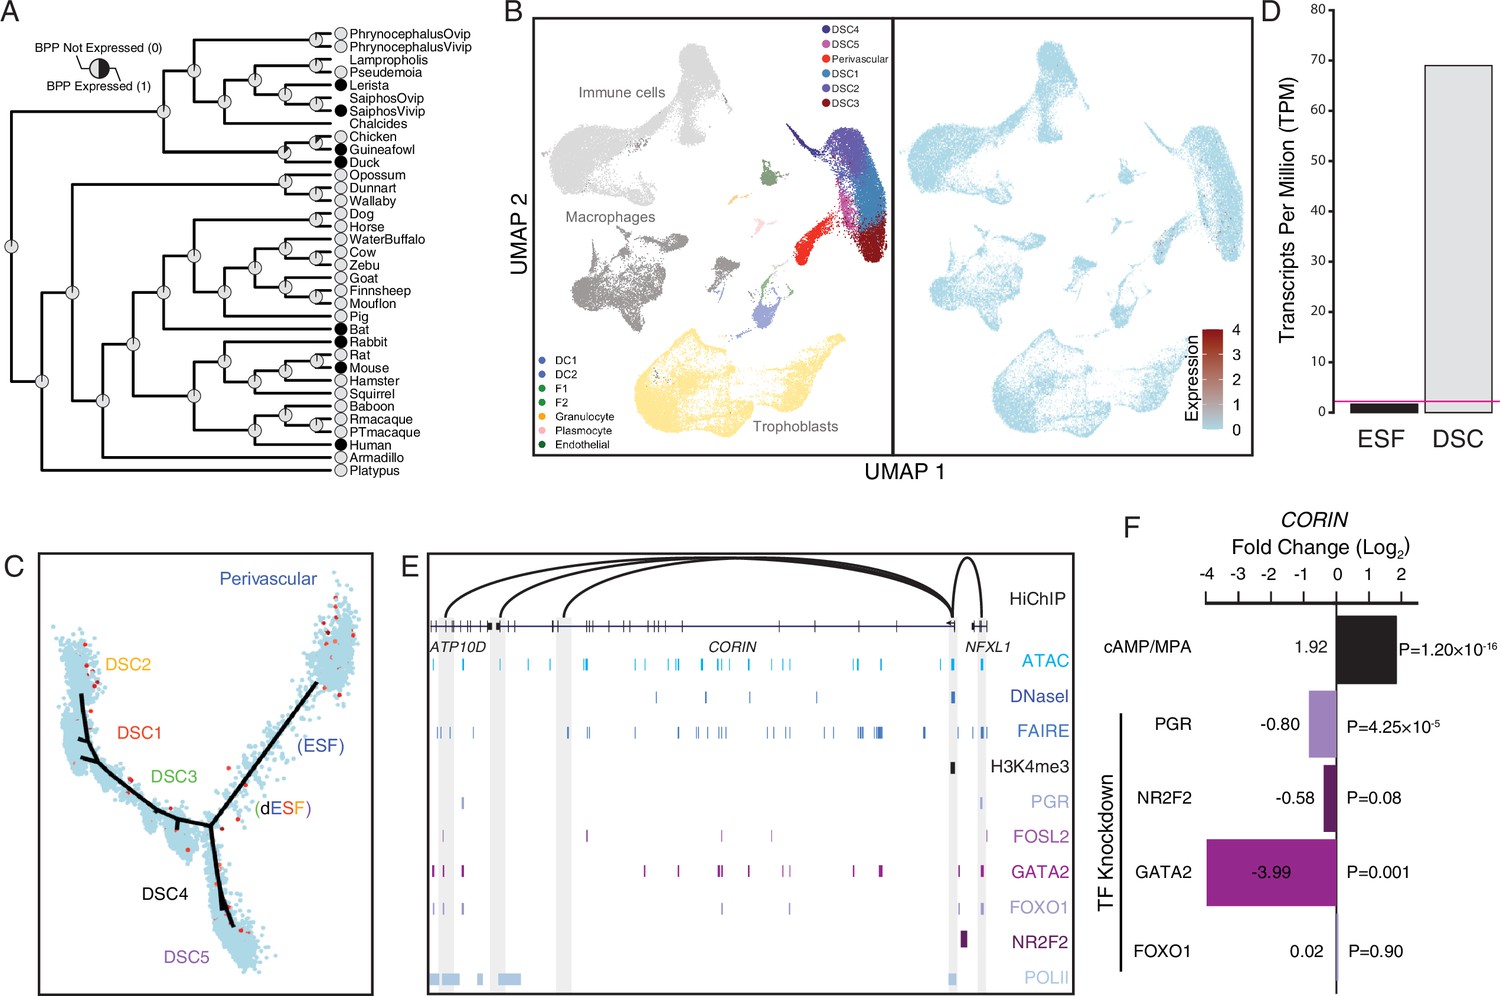
Co-option of CORIN into endometrial cells.
(A) Ancestral construction of CORIN expression in gravid/pregnant endometrium. Pie charts indicate the Bayesian posterior probability (BPP) that CORIN is expressed (state 1) or not expressed (state 0). (B) UMAP clustering of cells from the first trimester maternal–fetal interface. CORIN expression (log-transformed counts) in individual cells is shown in red. (C) Pseudotime trajectory of endometrial stromal fibroblast lineage cells. Monocle2 visualization of five distinct clusters of decidual stromal cells (DSCs) and perivascular trajectories projected into a two-dimensional space. CORIN expression (log-transformed counts) in individual cells is shown in red along the pseudotime trajectory. (D) CORIN expression in human endometrial stromal fibroblasts (ESFs) is upregulated by cAMP/progesterone treatment for 48 hr (decidualization into DSCs). Transcript abundance in RNA-Seq data is shown as transcripts per million (TPM). (E) Regulatory elements in human DSCs at the CORIN locus. ChIP-Seq peaks shown for H3K4me3, polymerase II (POLII), progesterone receptor (PGR), FOXO1, FOSL2, GATA2, and NR2F2 (COUP-TFII). Regions of open chromatin are shown from DNaseI-, ATAC-, and FAIRE-Seq. Chromatin loops inferred from H3K27ac HiChIP are shown as black arcs connecting the CORIN promoter to other locations in the genome shown in gray. (F) CORIN expression is upregulated by in vitro decidualization of ESFs into DSC by cyclic adenosine monophosphate (cAMP/progesterone treatment, and down)regulated by siRNA-mediated knockdown of PGR and GATA2, but not FOXO1 or NR2F2. n = 3 per transcription factor knockdown.
Figure 8—figure supplement 1
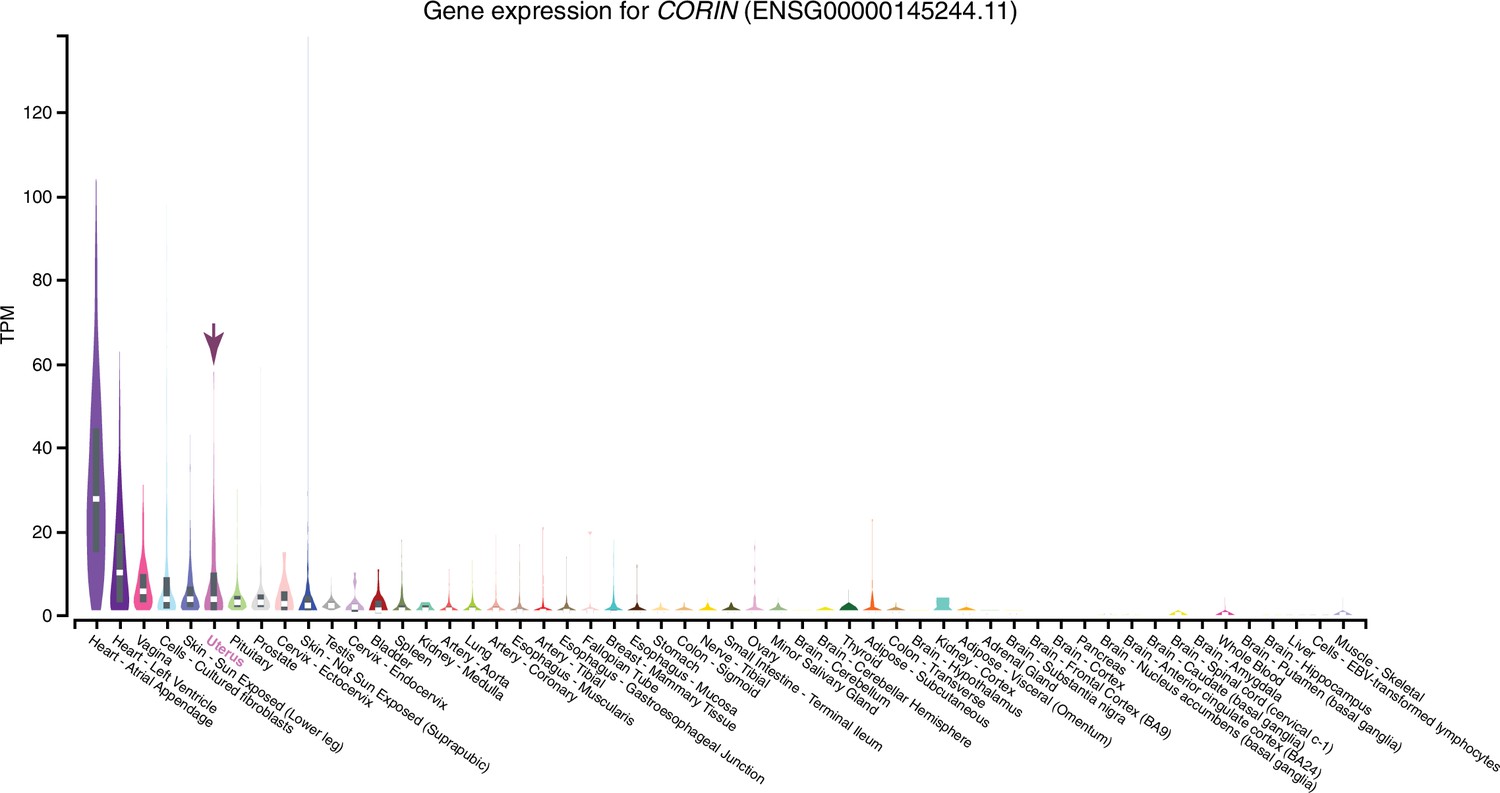
Expression of CORIN in GTEx tissues.
Violin plots are colored by anatomical system; the uterus is indicated by an arrow.
Tables
Key resources table
| Reagent type (species) or resource | Designation | Source or reference | Identifiers | Additional information |
|---|---|---|---|---|
| Software, algorithm | Kallisto | Bray et al., 2016 | Version 0.42.4, RRID:SCR_016582 | |
| Software, algorithm | IQ-TREE 2 | Minh et al., 2020; Nguyen et al., 2015 | RRID:SCR_017254 | |
| Software, algorithm | R | Version 3.6.1 | ||
| Software, algorithm | vegan | Oksanen et al., 2019 | Version 2.5-6, RRID:SCR_011950 | |
| Software, algorithm | Seurat | Butler et al., 2018 | Version 3.1.1, RRID:SCR_007322 | |
| Software, algorithm | Monocle2 | Qiu et al., 2017 | Version 2, RRID:SCR_016339 | |
| Software, algorithm | WebGestalt | Liao et al., 2019 | Version 2019, RRID:SCR_006786 | |
| Antibody | anti-HTR2B (Rabbit polyclonal) | Fisher Scientific | Catalog No. 72-025-6, RRID:AB_2633218 | (1:200) |
| Antibody | IgG (H + L) Cross-Adsorbed Goat anti-Rabbit, Alexa Fluor 594 | Fisher Scientific | Catalog No. A11012, RRID:AB_141359 | (1:1000) |
| Cell line (Human) | T-HESC | ATCC | CRL-4003, RRID:CVCL_C464 | |
| Recombinant DNA reagent | pGL4.29[luc2P/CRE/Hygro] (plasmid) | Promega | E847A | |
| Recombinant DNA reagent | pGL4.44[luc2P/AP1-RE/Hygro] | Promega | E4111 | |
| Recombinant DNA reagent | pGL4.33[luc2P/SRE/Hygro] | Promega | E1340 | |
| Recombinant DNA reagent | pGL4.34[luc2P/SRF-RE/Hygro] | Promega | E1350 | |
| Recombinant DNA reagent | pGL3-Basic[minP] | Promega | E1751; this paper |
Table 1
Expression of placental enriched genes in RNA-Seq data from human placenta, endometrial stromal fibroblasts (ESFs), decidual stromal cells (DSCs), and human first trimester decidua.
Expression levels are shown as transcripts per million (TPM) values, the Tissue Specificity (TS) score is calculated as the fold enrichment of each gene relative to the tissue with the second highest expression of that gene. Placental data are from https://www.proteinatlas.org/humanproteome/tissue/placenta.
| Gene | Description | TS | Placenta | ESF | DSC | Decidua |
|---|---|---|---|---|---|---|
| CSH1 | Chorionic somatomammotropin hormone 1 | 211 | 13,487 | 0 | 0 | 0 |
| CSH2 | Chorionic somatomammotropin hormone 2 | 193 | 3932 | 0 | 0 | 6.67 |
| CSHL1 | Chorionic somatomammotropin hormone like 1 | 352 | 217 | 0 | 0 | 0 |
| GH2 | Growth hormone 2 | 199 | 189 | 0 | 0 | 0.6 |
| HBG1 | Hemoglobin subunit gamma 1 | 147 | 18,254 | 0 | 0 | 0 |
| ISM2 | Isthmin 2 | 112 | 274 | 0 | 0.2 | 1.5 |
| PSG1 | Pregnancy-specific beta-1-glycoprotein 1 | 377 | 363 | 0.64 | 20.9 | 0 |
| PSG2 | Pregnancy-specific beta-1-glycoprotein 2 | 222 | 343 | 0.15 | 7.9 | 0.5 |
| PSG3 | Pregnancy-specific beta-1-glycoprotein 3 | 162 | 189 | 0 | 0.6 | 0.7 |
| PSG5 | Pregnancy-specific beta-1-glycoprotein 5 | 108 | 158 | 2.3 | 14.3 | 0 |
| PSG9 | Pregnancy-specific beta-1-glycoprotein 9 | 118 | 147 | 47.2 | 36.1 | 0.0 |
| XAGE3 | X antigen family member 3 | 167 | 575 | 0 | 0 | 0.05 |
Additional files
-
Transparent reporting form
- https://cdn.elifesciences.org/articles/69584/elife-69584-transrepform1-v2.docx
-
Source data 1
Enrichment result table for Box 2—figure 1.
- https://cdn.elifesciences.org/articles/69584/elife-69584-supp1-v2.tsv
Download links
A two-part list of links to download the article, or parts of the article, in various formats.
Downloads (link to download the article as PDF)
Open citations (links to open the citations from this article in various online reference manager services)
Cite this article (links to download the citations from this article in formats compatible with various reference manager tools)
Evolutionary transcriptomics implicates new genes and pathways in human pregnancy and adverse pregnancy outcomes
eLife 10:e69584.
https://doi.org/10.7554/eLife.69584


