Hsp40s play complementary roles in the prevention of tau amyloid formation
- Department of Chemical and Structural Biology, Weizmann Institute of Science, Israel
- Department of Chemical Research Support, Weizmann Institute of Science, Israel
Figures
Figure 1 with 1 supplement
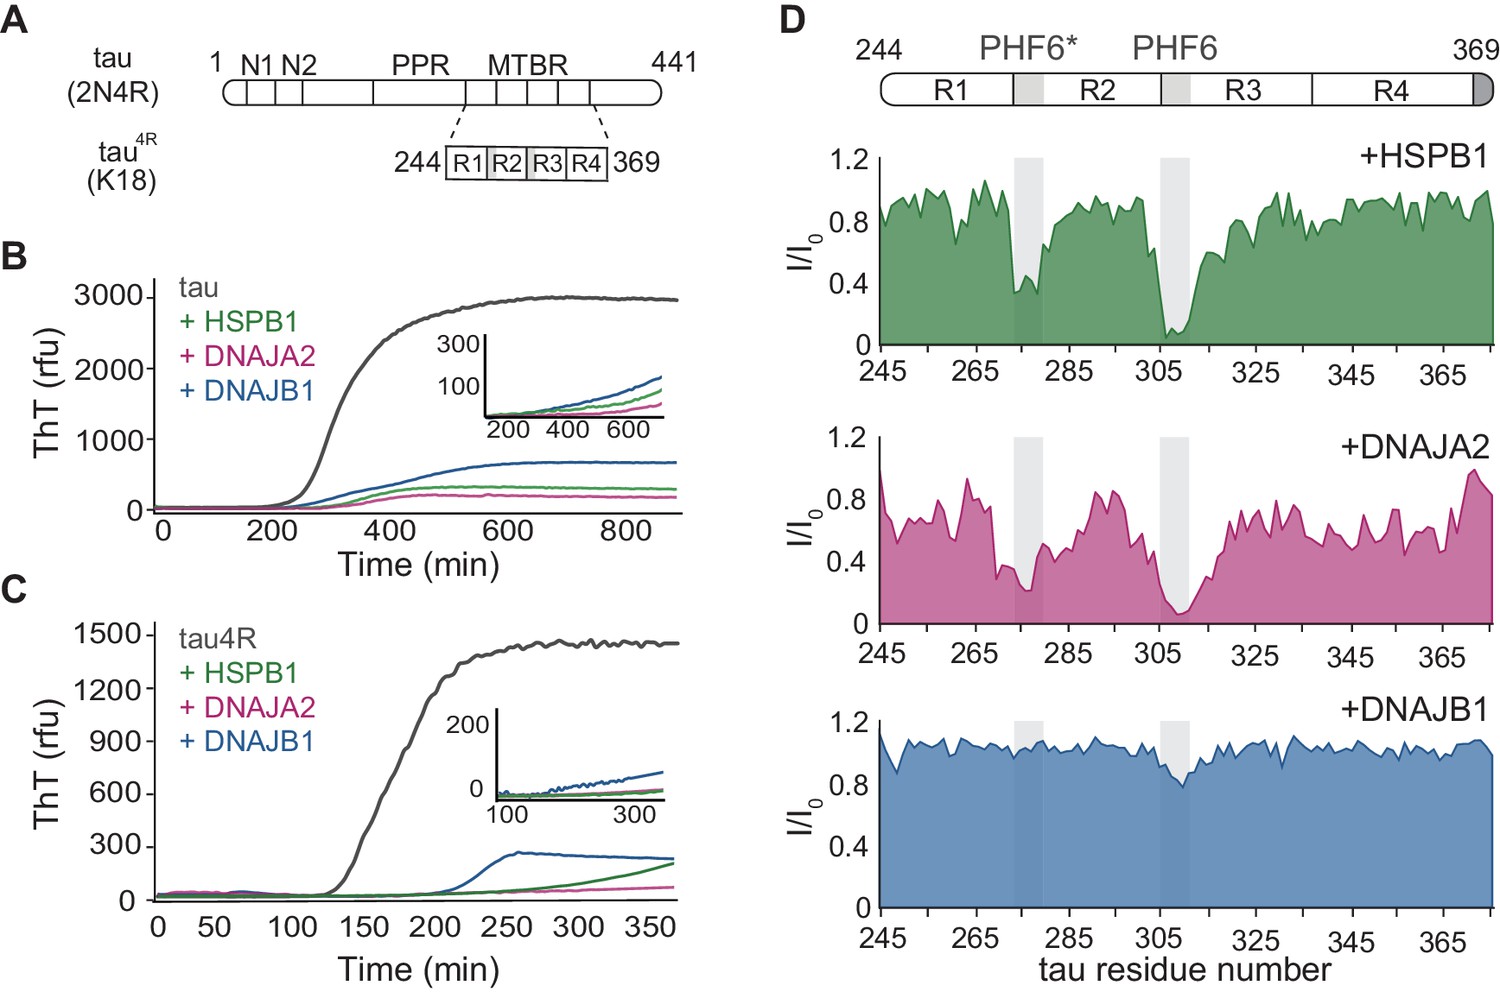
Interaction of chaperones with monomeric tau.
(A) Domain organization of the longest splice isoform of tau protein (2N4R) and the short variant (4R/K18) containing only the microtubule binding repeats (MBTRs). The location of the two N-terminal inserts (N1 and N2) and the polyproline region (PPR) is indicated. The MTBR region of tau consists of four partially repeated sequences, R1 to R4, with the PHF6* and PHF6 aggregation-driving hexapeptides highlighted in gray. (B, C) ThT-based aggregation assay of 2N4R (B) and 4R (C) tau variants (10 µM) in the presence of 5 µM HSPB1 (green), DNAJA2 (purple), or DNAJB1 (blue) chaperones. The inset shows tau aggregation profiles in the presence of twofold excess (20 µM) of the same chaperones, showing complete inhibition over the course of the experiment. Representative data from three independent experiments is shown. (D) Tau4R binding profiles to HSPB1 (green), DNAJA2 (purple), and DNAJB1 (blue) chaperones, probed by NMR. Changes in NMR intensity ratios (I/I0) upon addition of twofold excess of each chaperone are plotted as a function of tau4R residue number. The gray boxes represent the positions of the tau PHF6* and PHF6 aggregation-prone motifs. Values lower than 0.5 indicate intermolecular interactions.
-
Figure 1—source data 1
Aggregation assay of 2N4R and 4R tau variants.
- https://cdn.elifesciences.org/articles/69601/elife-69601-fig1-data1-v2.xlsx
-
Figure 1—source data 2
NMR binding experiments of tau4R to HSPB1, DNAJB1, and DNAJA2 chaperones.
- https://cdn.elifesciences.org/articles/69601/elife-69601-fig1-data2-v2.xlsx
Figure 1—figure supplement 1

Interaction of chaperones with monomeric tau.
1H-15N TROSY-HSQC spectra of full-length tau (2N4R, A) or tau4R (B) alone (black) and upon addition of twofold excess of HSPB1 (green), DNAJA2 (purple), or DNAJB1 (blue) chaperones. Residues from the PHF6 and PHF6* aggregation-prone regions, which interact with HSPB1 and DNAJA2 chaperones, are indicated on the tau spectra.
Figure 2

Interaction of chaperones with preformed tau fibrils.
(A) Co-sedimentation of preformed tau amyloid fibrils (10 μM) in the presence of 10 μM DNAJB1, DNAJA2, or HSPB1 chaperones. SDS-PAGE of the supernatant (S) and pellet (P) fractions following ultracentrifugation is shown. (B) Fluorescence anisotropy assays of tau fibers binding to DNAJB1 (blue) or DNAJA2 (purple). Data points represent the means of three independent measurements (with standard deviations), with the KDs for DNAJB1 and DNAJA2 being 1.7 ± 0.2 µM and 7.6 ± 0.6 µM, respectively. (C) Fluorescence anisotropy assays of monomeric tau binding to HSPB1 (green), DNAJB1 (blue), or DNAJA2 (purple). The KDs were calculated as 250 ± 26 µM for HSPB1 and 43 ± 8 µM for DNAJA2. No binding was observed for DNAJB1. Data are mean ± s.e.m. (n = 3). (D) Representative negative stain electron microscopy micrographs of preformed tau fibers alone or upon incubation with 1:1 molar ratio of HSPB1, DNAJA2, or DNAJB1 chaperones. The asterisks show the position of HSPB1 chaperone clusters. White bar is 200 nm.
-
Figure 2—source data 1
Interaction of chaperones with preformed tau fibrils.
- https://cdn.elifesciences.org/articles/69601/elife-69601-fig2-data1-v2.xlsx
Figure 3 with 2 supplements
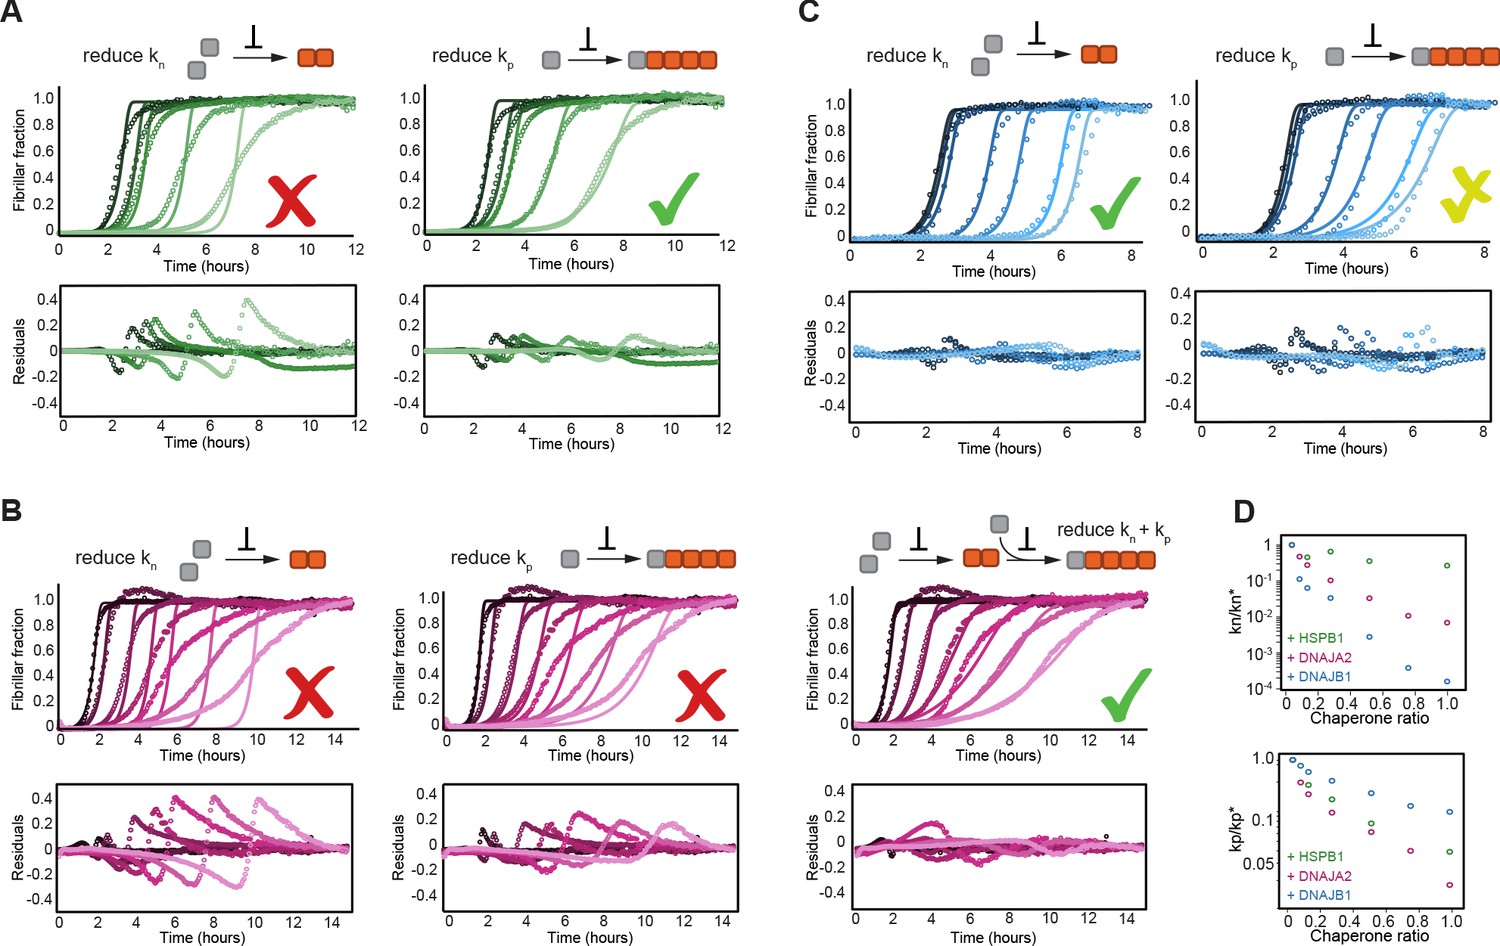
HSPB1, DNAJA2, and DNAJB1 chaperones affect different microscopic steps in the aggregation process.
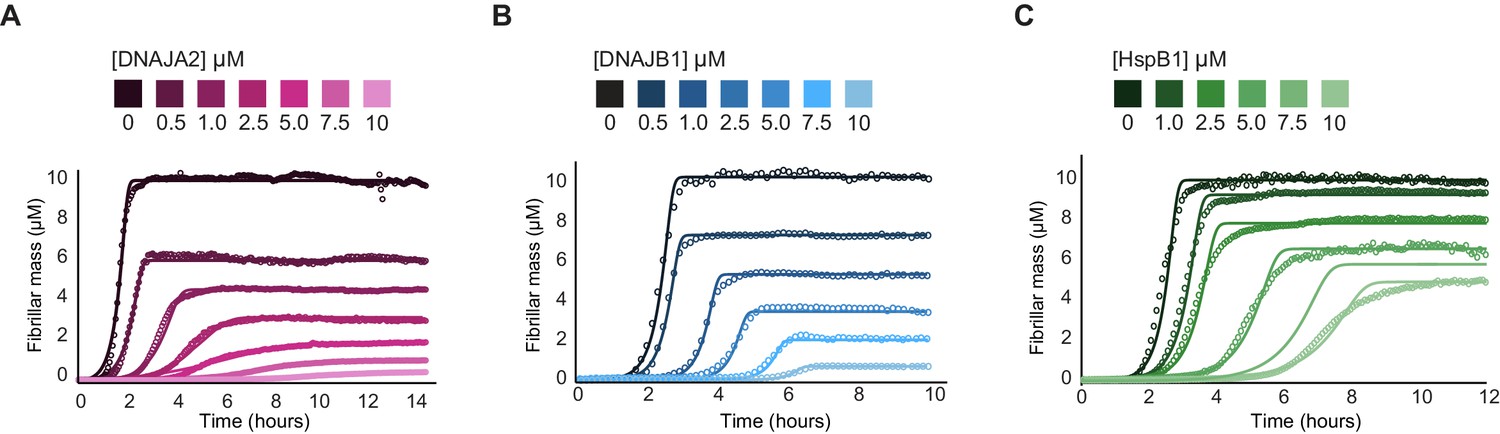
Kinetic profiles of the aggregation of 10 μM of tau in the absence (black) and presence of increasing concentrations of (A) HSPB1 chaperone (1, 2, 5, and 10 μM; dark to light green), (B) DNAJA2 (0.5, 1, 2.5, 5, 7.5, and 10 μM; dark to light purple), or (C) DNAJB1 (0.5, 1, 2.5, 5, 7.5, and 10 μM; dark to light blue). Open circles represent experimental data, and solid lines represent the fit of the kinetic profiles where only the primary nucleation (kn, left) or elongation (kp, right) pathways are inhibited. Residuals of the fits are shown under each panel. The changes in the aggregation kinetics caused by HSPB1 fit well with the elongation rate being primarily affected by the chaperone (A, right) whereas the changes in tau aggregation kinetics caused by DNAJB1 can be best described by the reduction of primary nucleation rates (C, left). In the case of DNAJA2, the changes in aggregation kinetics cannot be well described by the delay of only primary nucleation (B, left) or only elongation (B, middle) rates. There is good agreement, however, between the experimental data and fits to the integrated rate law of combined seeded and unseeded, in which primary nucleation, elongation, and fragmentation events have been considered simultaneously (B, right). Data points represent the means of 3–5 independent measurements. (D) The changes in microscopic nucleation (top) and elongation (bottom) rate constants as a function of the concentration of the molecular chaperones, relative to tau alone.
-
Figure 3—source data 1
Kinetic profiles of tau aggregation in the presence of molecular chaperones.
- https://cdn.elifesciences.org/articles/69601/elife-69601-fig3-data1-v2.xlsx
Figure 3—figure supplement 1
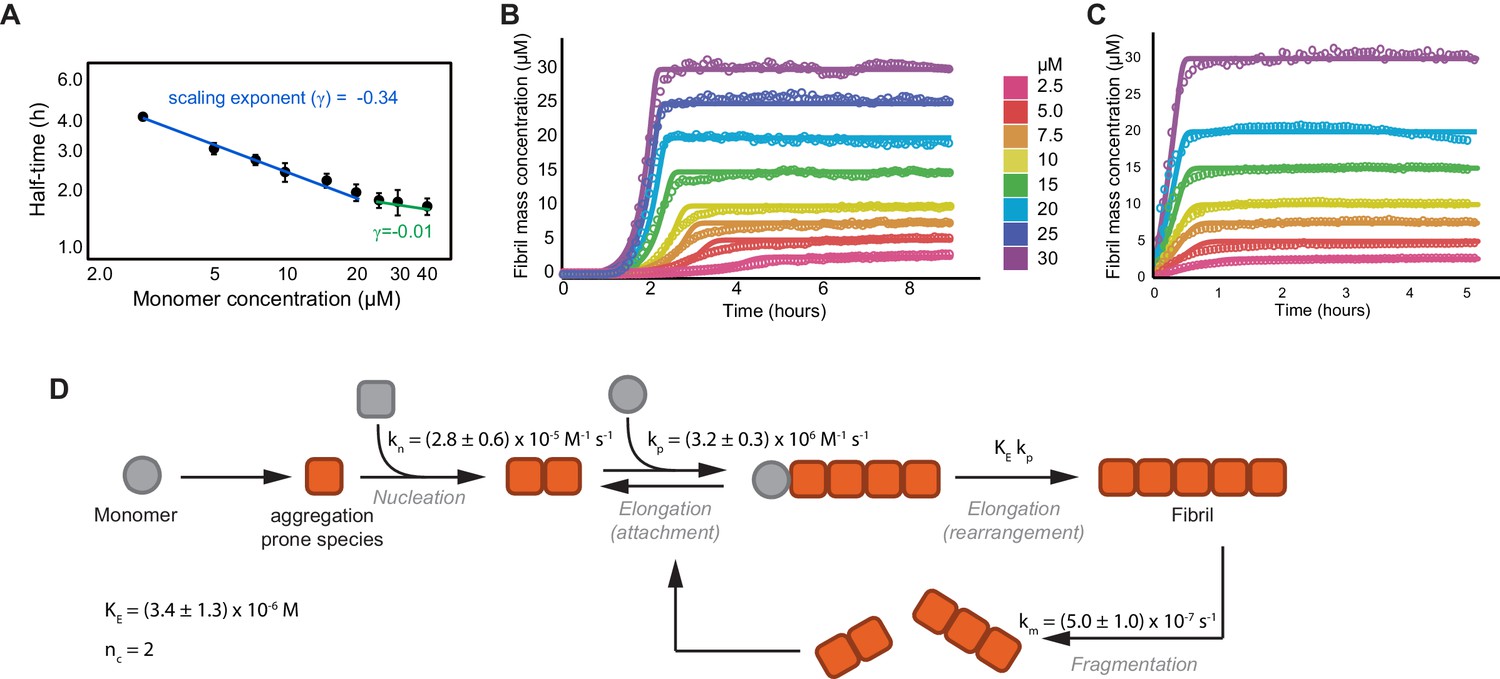
Global fitting of tau aggregation data.
(A) A plot of the aggregation reaction half-times versus the initial monomer concentration used to narrow down the aggregation mechanism of tau (Meisl et al., 2016). Half-times were calculated from three independent experiments of unseeded tau aggregation, as shown in (B). To extract the scaling factor (γ), the half-times (t1/2) of the aggregation reaction were plotted versus the tau monomer concentration on a double logarithmic plot with the slope of this plot providing the scaling exponent (log(t1/2) = γlog(m0) + constant). By using the rate laws for the time evolution of aggregate mass, γ can be related to the reaction orders for each of the models. The scaling factor for tau aggregation was calculated to be −0.34 ± 0.04, with −0.5 < γ < 0, indicating primary nucleation and fragmentation as the correct model. Furthermore, the deviation of the points from a straight line shows that γ is dependent on the monomer concentration, with positive curvature indicating the presence of saturating elongation (Meisl et al., 2016). (B, C) Kinetic profiles of the concentration-dependent aggregation of tau4R at concentrations of 2.5, 5, 7.5, 10, 15, 20, and 30 μM, initiated by the addition of 0.5 molar equivalents of heparin (B) or 1% seeds (C), and monitored by Thioflavin-T (ThT) fluorescence (open circles). Continuous lines represent the global fitting of the data to the integrated rate laws (see equations in the Materials and methods section). (D) Schematic of microscopic steps during tau aggregation and their corresponding rate constants as obtained from the fits (see Materials and methods for detail). kn is the rate of nucleation, kp is the rate of elongation, KE is the critical concentration for saturated elongation, and km is the rate of fibril fragmentation. Nucleus size was assumed to be 2 (nc = 2) (Yao et al., 2020; Shammas et al., 2015).
Figure 3—figure supplement 2
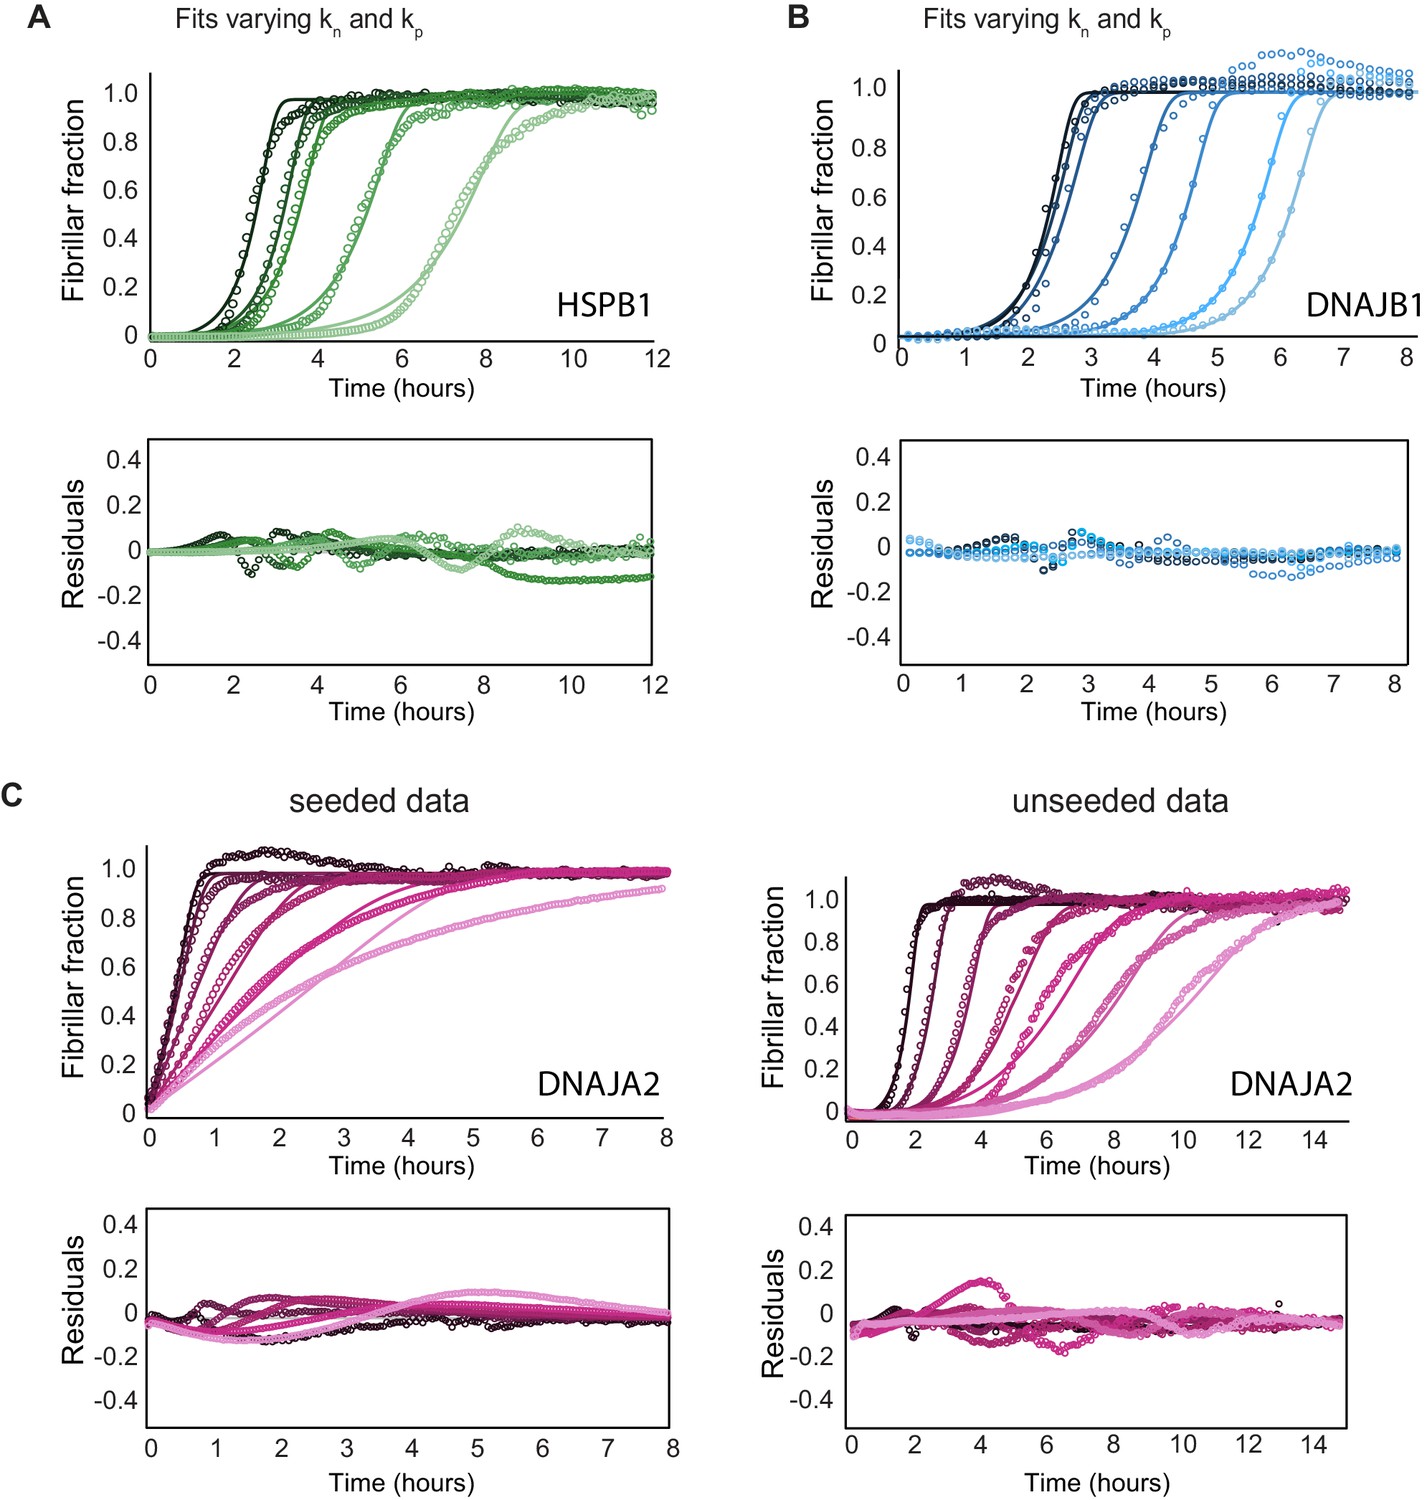
Effect of chaperones on tau aggregation kinetics.
(A) Global fit analysis of tau aggregation (black) in the presence of increasing concentrations of HSPB1 chaperone (1, 2, 5, and 10 μM; dark to light green), constrained such that both the nucleation and elongation rates (kn, kp) were free fit parameters. Open circles represent experimental data, and solid lines represent the fits. The residuals of the fits do not become significantly smaller compared to fits where only elongation rates (kp) were allowed to vary (Figure 3A). Thus, HSPB1 mainly affects the rate of elongation in tau aggregation kinetics and not the rate of nucleation. (B) Global fit analysis of tau aggregation (black) in the presence of increasing concentrations of DNAJB1 chaperone (0.5, 1, 2.5, 5, 7.5, and 10 μM; dark to light blue), constrained similarly as in (A). DNAJB1 mainly affects the rate of nucleation with a minor effect on the elongation rates. (C) Global fit analysis of tau aggregation alone and in the presence of increasing concentrations of DNAJA2 chaperone (0.5, 1, 2.5, 5, 7.5, and 10 μM; dark to light purple) for seeded (left) and unseeded (right) experiments. Seeded experiments were fit globally, only allowing variation in the elongation rates, as the nucleation rates are negligible under seeding conditions. Changes in elongation rates due to the presence of DNAJA2 chaperone (summarized in Figure 3D) were then used as constants in the global fit analysis of the unseeded experiments, while the nucleation rates were allowed to vary. This approach allowed us to derive the changes in both the nucleation and elongation rates.
Figure 4 with 4 supplements
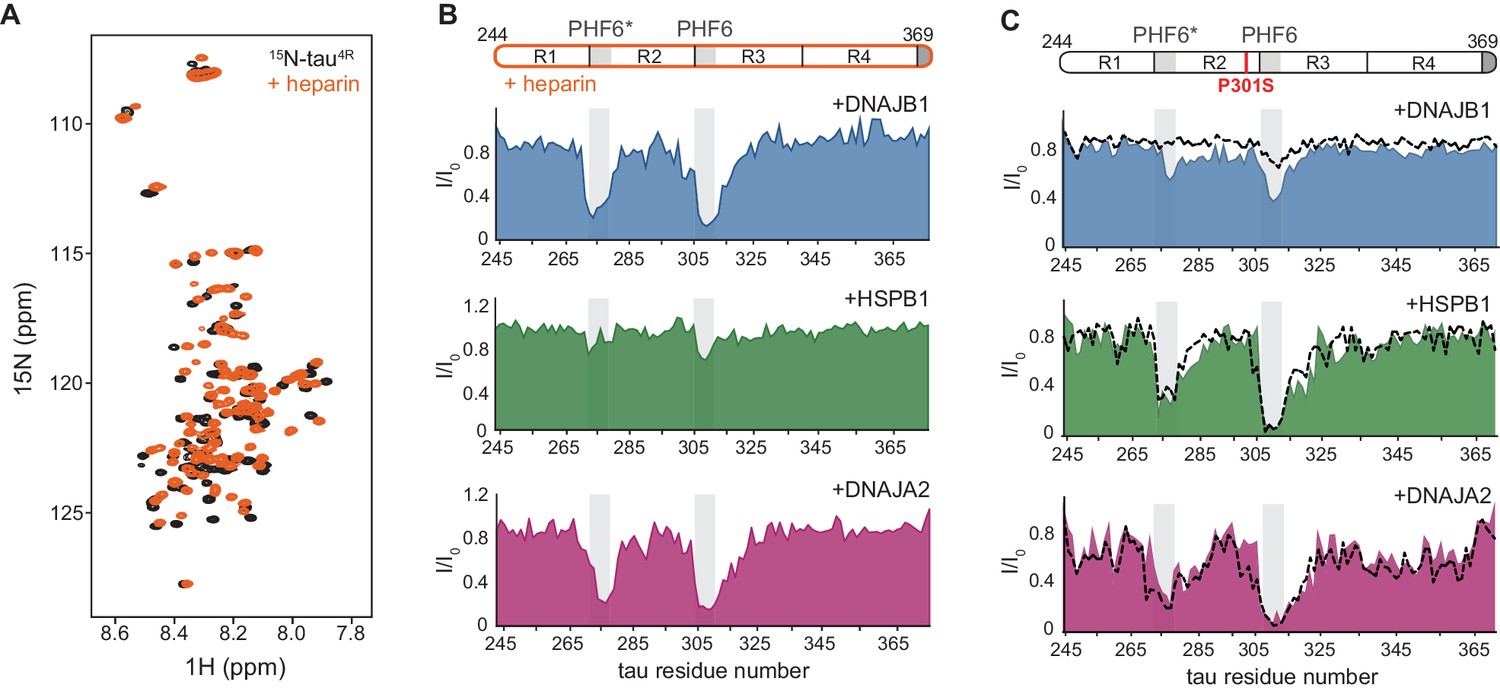
Interaction of chaperones with aggregation-prone tau species.
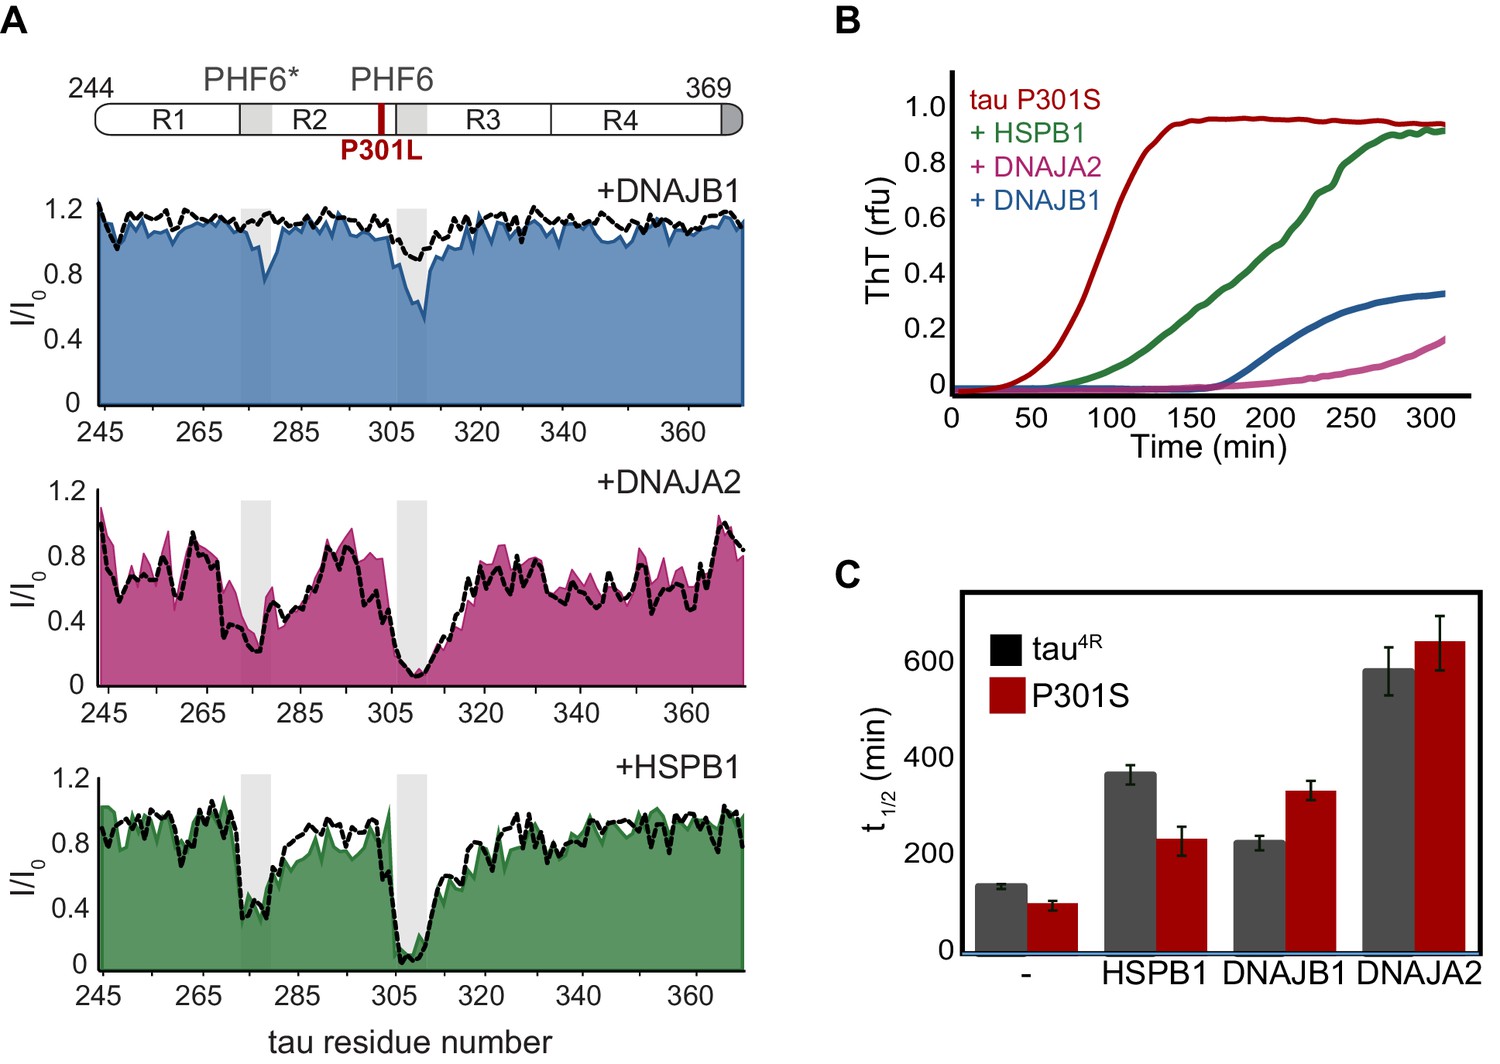
(A) Overlay of two-dimensional 1H-15N NMR spectra of tau in the absence (black) and presence of heparin (orange). Heparin binds mainly to the R1, R2, and PHF6* regions (see Figure 4—figure supplement 1B), with no changes observed to the overall dispersion of the spectra, indicating that heparin binding does not result in global folding of tau. (B) Residue-resolved NMR signal attenuation (I/I0) of tau in complex with heparin upon addition of one molar equivalent of DNAJB1 (blue), DNAJA2 (purple), or two molar equivalents of HSPB1 (green). Gray boxes represent the positions of tau PHF6* and PHF6 aggregation-prone motifs in tau. Unlike in the case of tau monomer, DNAJB1 interacts strongly with this aggregation-prone species, while HSPB1 chaperone does not. (C) Residue-resolved backbone amide NMR signal attenuation (I/I0) of tau P301S mutant upon addition of two molar equivalents of DNAJB1 (blue), HSPB1 (green), or DNAJA2 (purple) chaperones. Dashed lines represent the same intensity plots for wild-type tau (as in Figure 1D). Compared to the wild-type, P301S mutant shows increased interaction with DNAJB1.
-
Figure 4—source data 1
NMR binding experiments of tau P301L mutant to HSPB1, DNAJB1, and DNAJA2 chaperones.
- https://cdn.elifesciences.org/articles/69601/elife-69601-fig4-data1-v2.xlsx
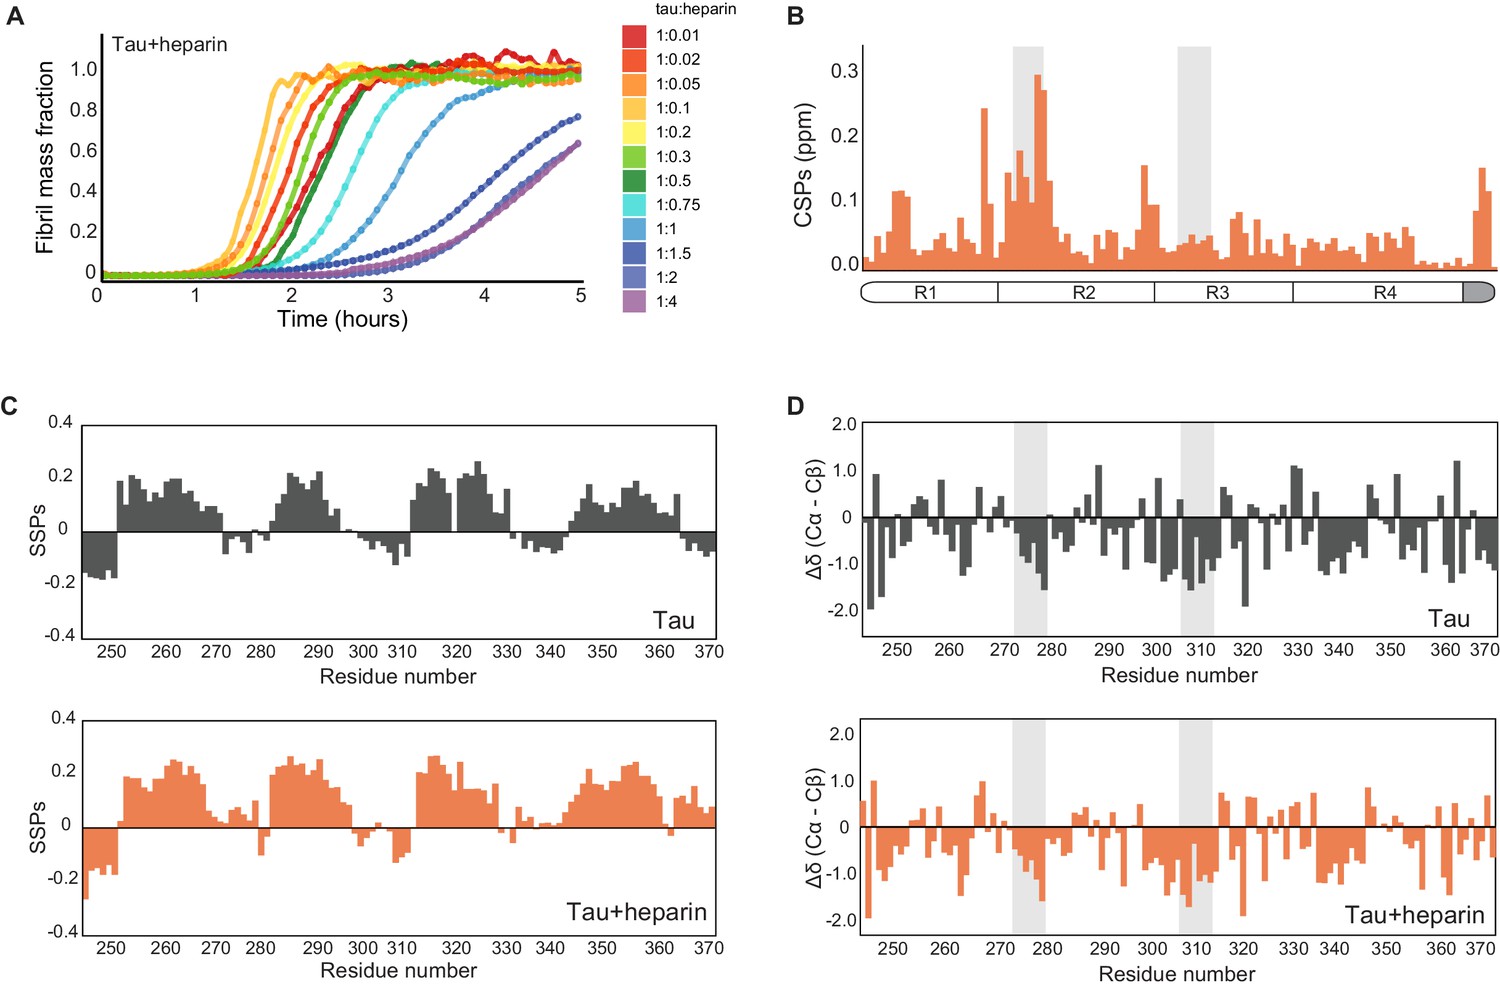
Figure 4—figure supplement 1
Characterization of heparin-bound tau.
(A) Tau aggregation profiles in the presence of increasing concentrations of heparin ranging from 0.1 to 40 μM. Initially, the rate of aggregation increases with the concentration of heparin. At 1 µM heparin, the reaction slows, with higher concentrations (20–40 μM) suppressing aggregation completely for over 2 hr (dark blue to purple curves). (B) Chemical shift perturbation plot of tau upon addition of twofold excess of heparin. Heparin binding occurs mainly in repeat 2 (R2) of tau. The gray boxes represent tau PHF6* and PHF6 aggregation-prone motifs. (C) Secondary structure propensity plot (Marsh et al., 2006) of monomeric tau (black, top) and tau-heparin complex (orange, bottom). (D) Differences between secondary chemical shifts of Cα and Cβ resonances relative to their random coil shift (Wishart and Sykes, 1994) as a function of residue number for tau (gray) or tau-heparin complex (orange).
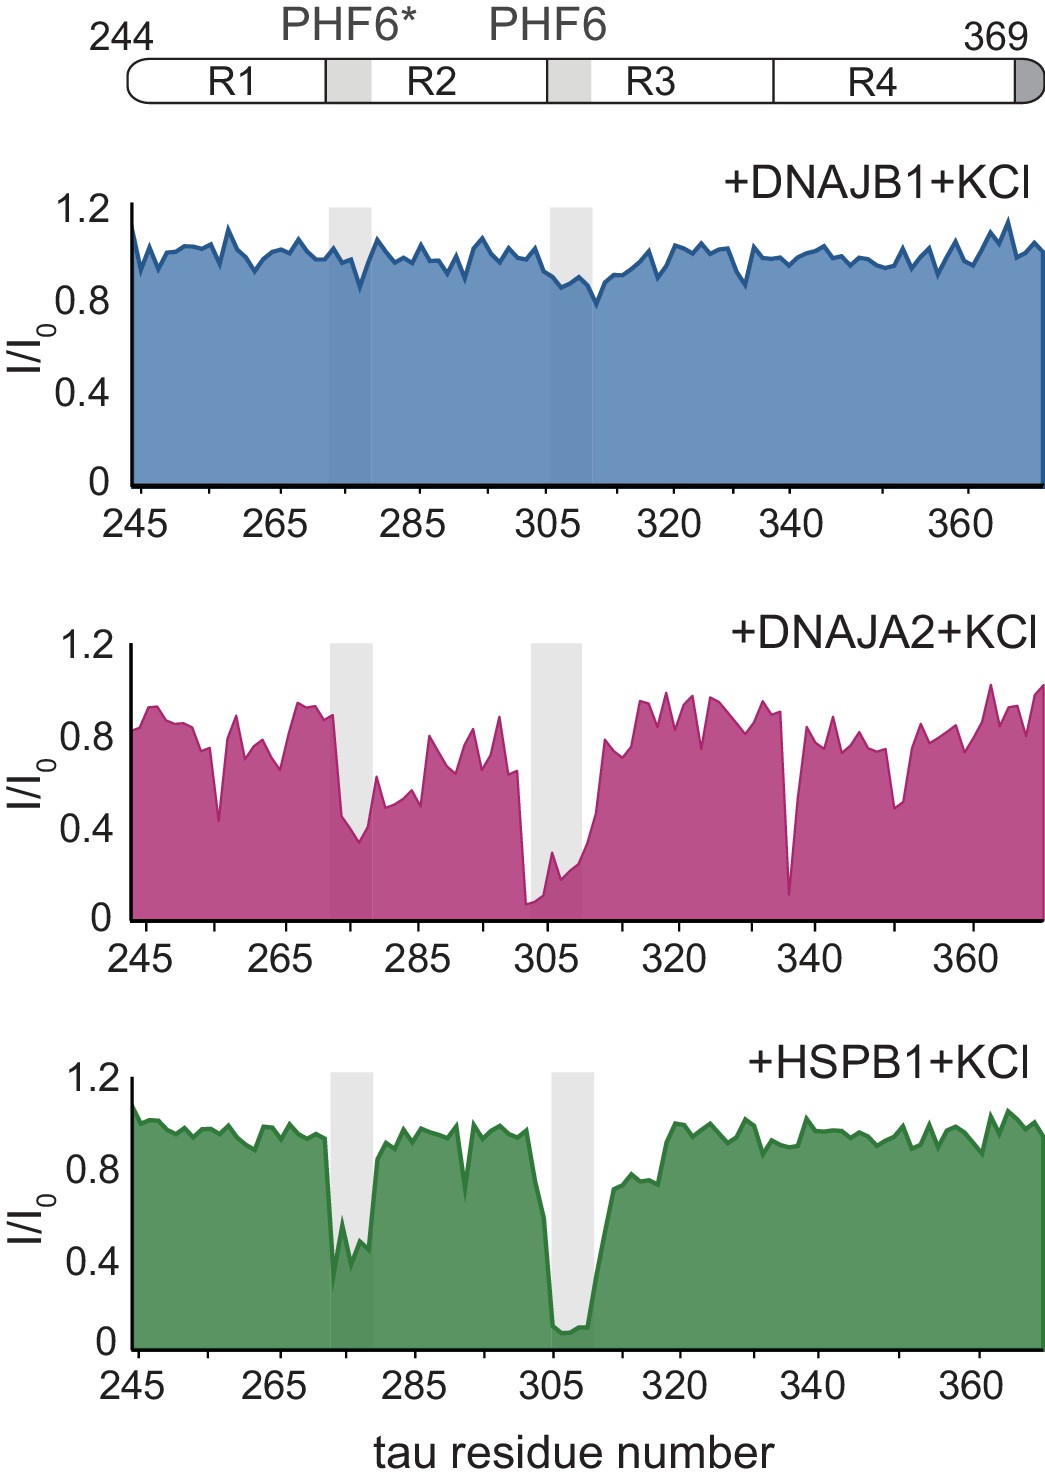
Figure 4—figure supplement 2
Chaperone binding to tau tested at high ionic strength.
Residue-resolved NMR signal attenuation plot (I/I0) of tau in buffer supplemented with 0.3 M KCl, upon addition of twofold molar excess of DNAJB1 (blue), DNAJA2 (purple), or HSPB1 (green) chaperones. Values lower than 0.5 indicate intermolecular interactions. The binding profiles are identical to those obtained at low salt conditions (Figure 1D).
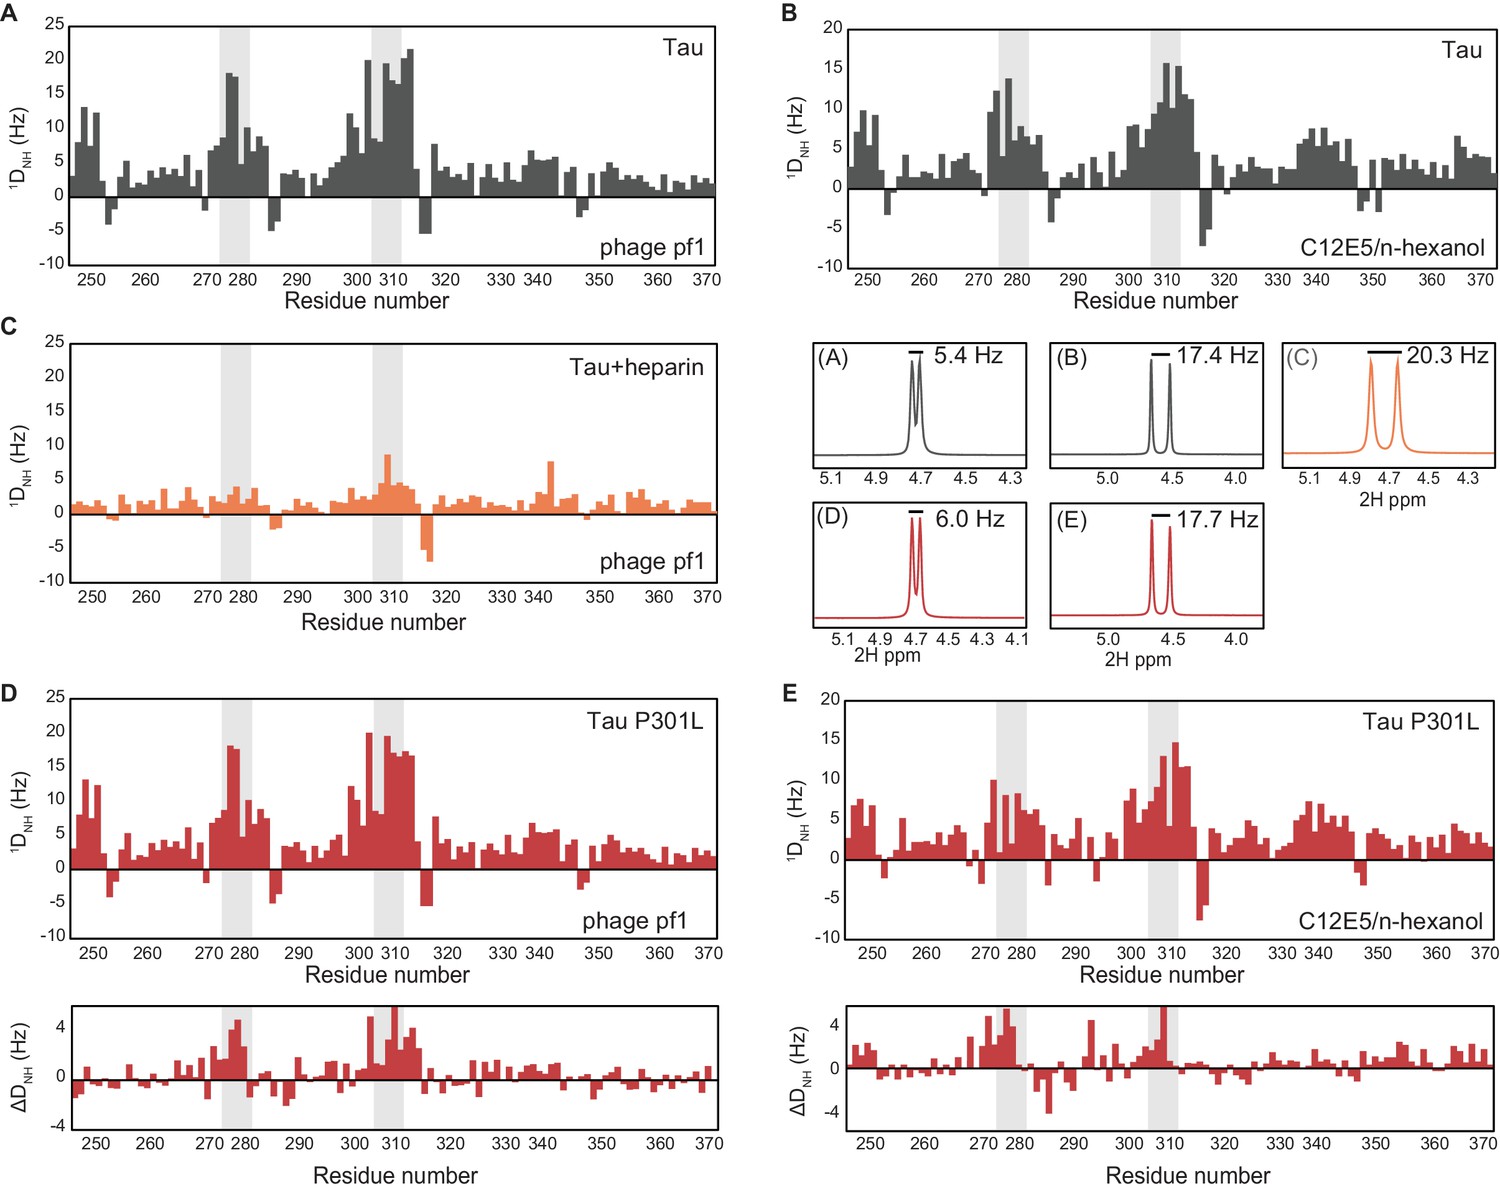
Figure 4—figure supplement 3
Conformations of the various tau species measured through residual dipolar couplings (RDCs).
(A, B) Backbone amide RDCs (1DNH), collected in 5 mg/mL phage pf1 (Hansen et al., 1998) (A) or 4.5% (vol/vol) C12E5/n-hexanol (Otting et al., 2000) (B) alignment media, showing a compaction in the PHF6* and PHF6 repeat regions (highlighted in gray). The 1D 2H spectra, recorded on the 1000 MHz spectrometer (middle, right), show splitting of 5.4 Hz (A) and 17.4 Hz (B), respectively. In both alignment media, large RDCs were observed for residues in the PHF6 aggregation-prone repeats, indicating the presence of a compaction of this region. (C) 1DNH RDCs measured for 1:1 tau:heparin complex aligned with 16 mg/mL phage pf1. The RDCs show highly decreased values in the PHF6* and PHF6 repeat regions compared to tau alone, indicating an expansion in this region. The 1D 2H spectra, recorded on the 1000 MHz spectrometer (middle, right, C), show splitting of 20.3 Hz, indicating a higher degree of alignment compared to tau alone. (D, E) 1DNH RDCs measured for tau4R P301L mutant collected in 5 mg/mL phage pf1 (D) or 4.5% (vov/vol) C12E5/n-hexanol (E) alignment media. Both conditions show lower RDC values in the PHF6* and PHF6 repeat regions compared to wild-type tau4R (differences in RDCs between WT tau and the P301L sample are shown underneath each plot), indicating a slightly increased tendency toward an extended structure in this tauopathy-associated mutant. The degree of alignment for the two samples was slightly higher than that of tau4R, as indicated by the 2H splitting (middle, right) of 6.0 Hz (D) and 17.7 Hz (E).
Figure 4—figure supplement 4
Interaction of chaperones with tauopathy associated tau mutants.
(A) Residue-resolved NMR signal attenuation (I/I0) of tau P301L mutant upon addition of two equivalents of DNAJB1 (blue), DNAJA2 (purple), or HSPB1 (green) chaperones. The position of the mutation between repeats 1 and 2 is indicated in red on the domain organization (top). Gray boxes represent the positions of the tau PHF6* and PHF6 aggregation-prone motifs. Dashed lines show the intensity changes for wild-type tau upon interaction with same chaperones. (B) Thioflavin-T (ThT)-based aggregation assay of 10 µM tau P301S variant alone (dark red), and in the presence of 5 µM HSPB1 (green), DNAJA2 (purple), or DNAJB1 (blue) chaperones. (C) Comparison of aggregation reaction half-times of tau4R (gray bars) and P301S tau (dark red bars) variants alone, and in the presence of chaperones. HSPB1 chaperone shows a significant reduction in its aggregation-prevention activity toward the P301S mutant tau compared to wild-type protein. In contrast, DNAJB1 is more efficient in preventing tau P301S aggregation than that of wild-type tau4R.
Figure 5 with 1 supplement

The chaperones change the morphology of tau amyloids.
(A–C) Representative negative stain electron micrographs of end products of the tau aggregation-prevention assays preformed in the presence of indicated concentrations of DNAJA2 (A), DNAJB1 (B), and HSPB1 (C). White bar is 500 nm. Tau4R forms long fibrils in the absence of chaperones and is still able to form long, fully developed fibrils in the presence of HSPB1 dimer. It forms smaller oligomeric species in the presence of both DNAJA2 and DNAJB1, indicating that these chaperones maintain much of the protein in a non-fibrillary state. (D) Overview of the variety of diverse microscopic mechanisms through which HSPB1, DNAJB1, and DNAJA2 molecular chaperones can suppress tau amyloid formation, as revealed by the binding and kinetic assays in this paper. These results demonstrate that the chaperones have evolved to exploit the different opportunities to modulate tau aggregation by binding to different tau species along the aggregation pathway.
Figure 5—figure supplement 1
Effect of chaperones on tau fibril mass.
(A–C) Unnormalized tau aggregation kinetics showing the reduction of tau fibril mass by addition of increasing concentrations of DNAJA2 (A), DNAJB1 (B), and HSPB1 (C) chaperones. All three chaperones cause a decrease in overall fibril mass, which can result from a reduction in the number of fibers or in total fibril length. DNAJA2 and DNAJB1 chaperones, which reduce the rates of tau nucleation and elongation, showed significantly higher degree of fibril mass reduction at 1:1 chaperone:tau ratio (96 and 94%, respectively) compared to HSPB1, which only reduced fibril mass by 47%.
Figure 6 with 1 supplement
Mapping DNAJA2 and DNAJB1 chaperone binding to tau species.
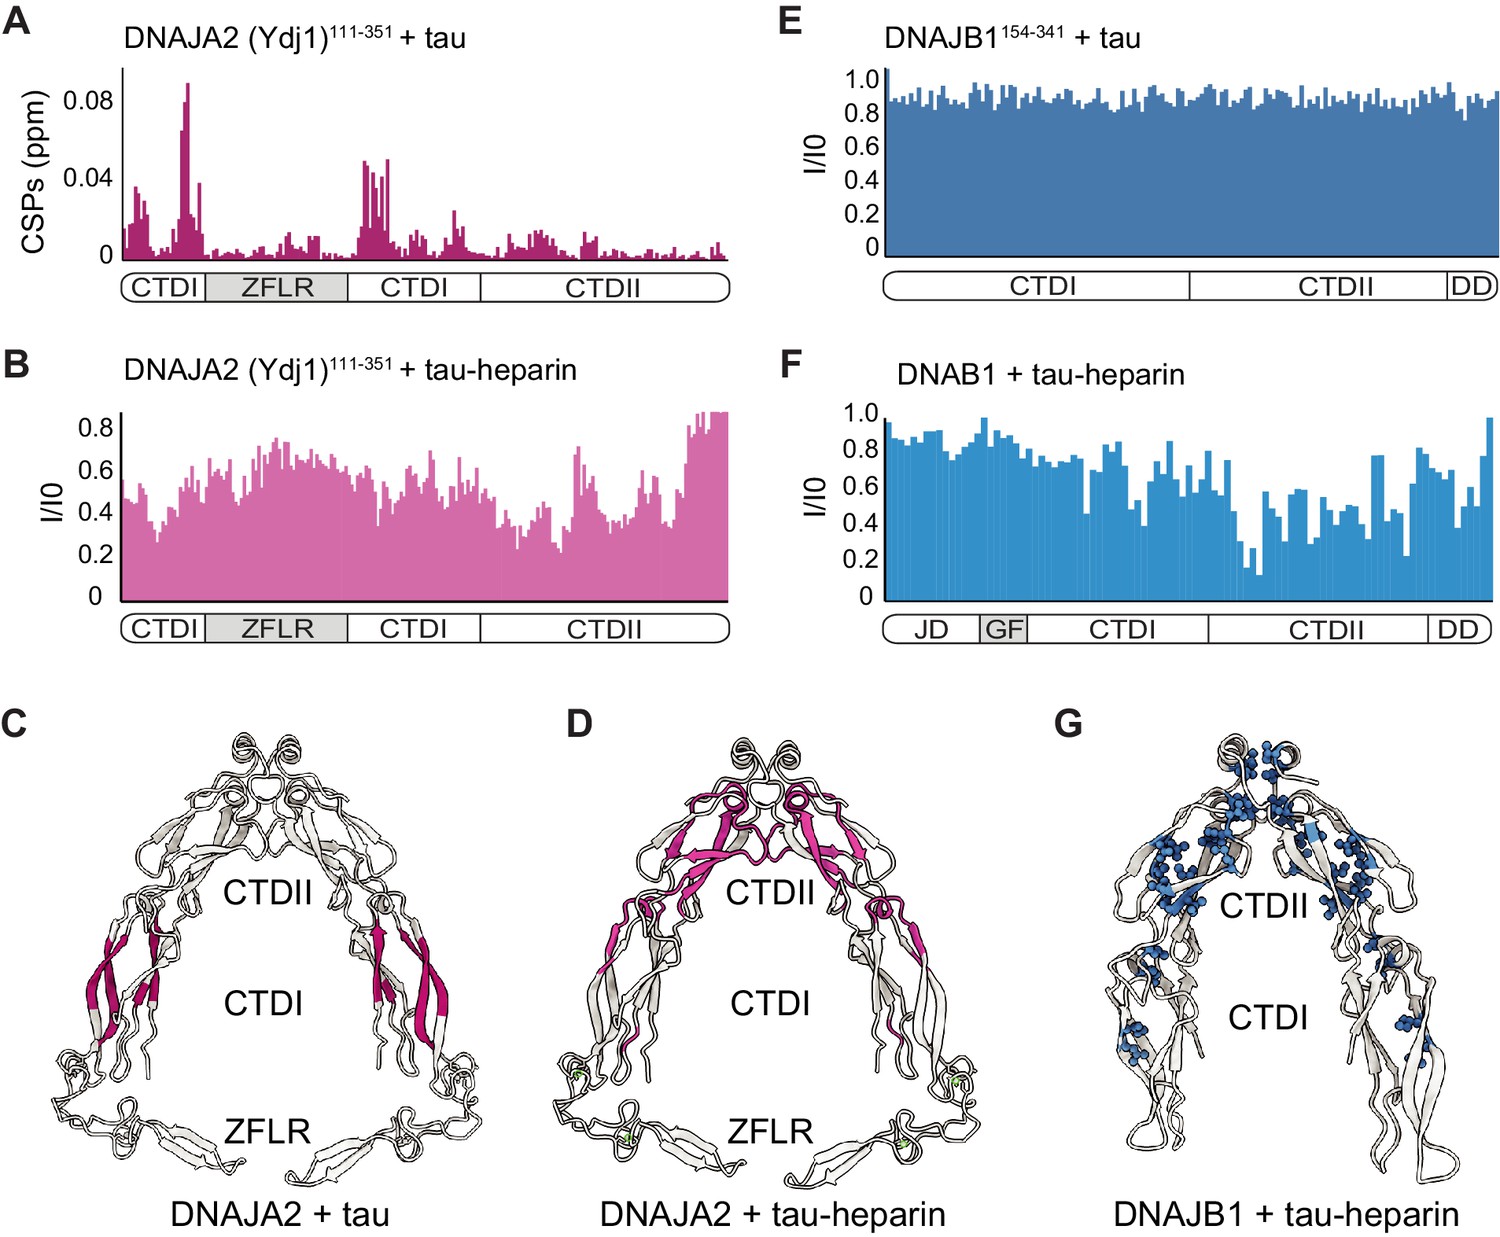
(A) Combined amide chemical shift perturbations between free DNAJA2(Ydj1)111-351 and DNAJA2(Ydj1)111-351 bound to unlabeled tau. The domain organization of DNAJA2 is indicated at the bottom. Monomeric tau binds to the C-terminal domain I (CTDI) of DNAJA2, but not to the zinc-finger-like region (ZFLR) insertion. (B) Residue-resolved backbone amide NMR signal-attenuation (I/I0) plot for DNAJA2(Ydj1)111-351 in complex with aggregation-prone tau species, generated by addition of twofold excess heparin. The binding is primarily to the C-terminal domain II (CTDII) of DNAJA2. (C, D) Structural representation of DNAJA2 chaperone, with residues showing significant chemical shift perturbations (CSPs) upon binding to monomeric tau (from panel A) highlighted in purple (C), and residues displaying significant decreases in peak intensities upon binding to aggregation-prone tau species colored pink (D). (E) No changes in signal intensity are detected in the CTDs of DNAJB1 (residues 154–341) upon addition of twofold excess of monomeric tau protein, indicating a lack of interaction. (F) Combined methyl group chemical shift perturbations between free full-length DNAJB1 and DNAJB1 bound to aggregation-prone tau species generated by addition of twofold excess heparin. Binding is observed in the CTDII of DNAJB1. (G) Structural representation of DNAJB1 chaperone, with methyl residues showing significant changes upon binding to aggregation-prone tau species highlighted in blue.
Figure 6—figure supplement 1
Mapping DNAJA2 and DNAJB1 chaperone binding to tau species.
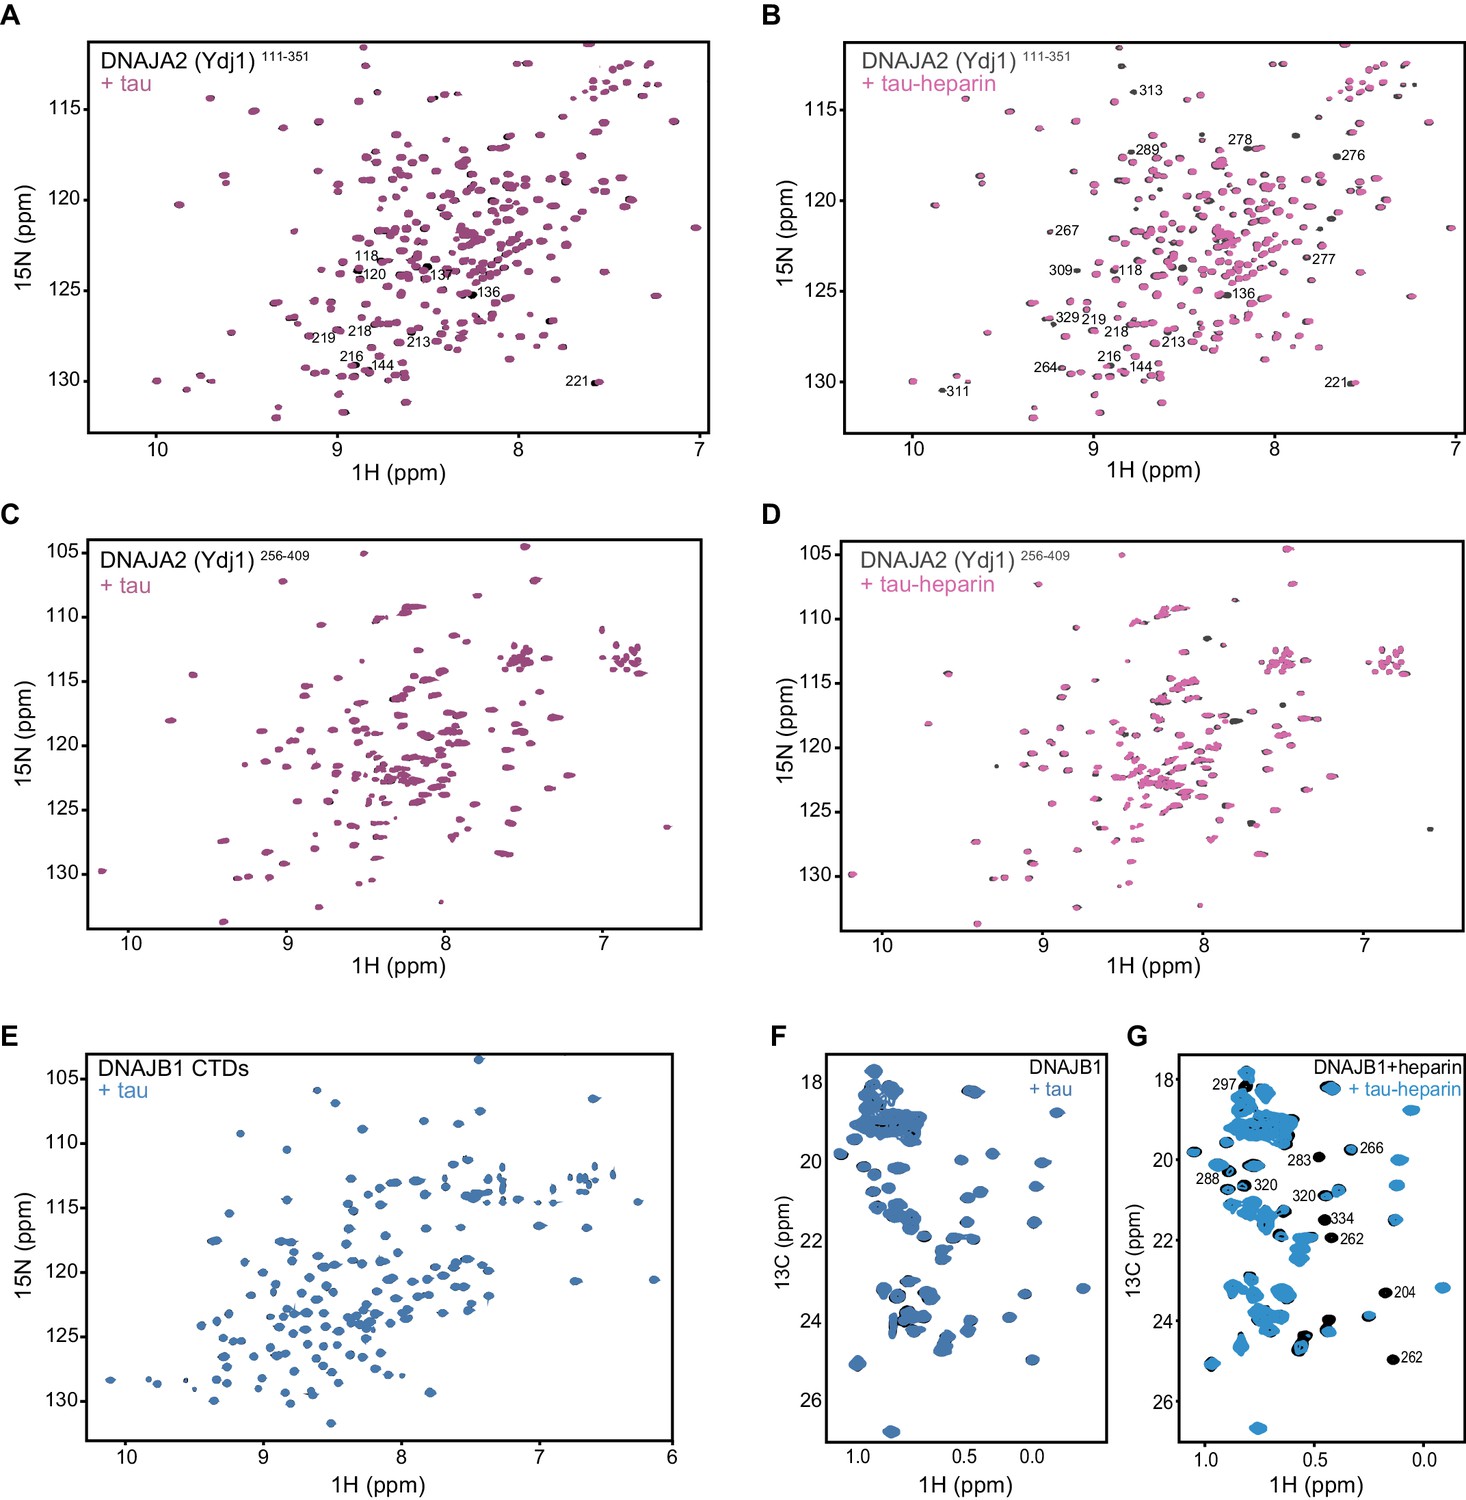
(A) 1H-15N TROSY-HSQC of class A J-domain protein Ydj1 (DNAJA2 homolog) residues 111–351 alone (black), and in complex with two molar equivalents of monomeric tau (purple). Residues displaying chemical shift perturbation upon tau binding are indicated. (B) 1H-15N TROSY-HSQC of Ydj1111-351 alone (black), and in complex with two molar equivalents of the aggregation-prone tau species (purple). These tau species were generated by addition of twofold molar excess of heparin to tau. The same amount of heparin was also added to Ydj1111-351 alone (black). Residues displaying broadening upon interaction with tau are indicated. (C) 1H-15N TROSY-HSQC of DNAJA2256-409 alone (black), and in complex with two molar equivalents of monomeric tau (purple). No changes in the spectrum are observed, indicating that DNAJA2 CTDII and dimerization domains do not interact with the monomeric tau species. (D) 1H-15N TROSY-HSQC of DNAJA2256-409 alone (black), and in complex with two molar equivalents of the aggregation-prone tau species (purple). These tau species were generated by addition of twofold molar excess of heparin to tau. The same amount of heparin was also added to DNAJA2256-409 alone (black). The presence of chemical shift perturbations confirms that the aggregation-prone tau-heparin species also bind to the CTDII in the presence of the dimerization domain. (E) 1H-15N TROSY-HSQC of DNAJB1 CTDs (residues 154–341) alone (black), and upon addition of twofold excess of monomeric tau protein (blue). No changes in chemical shift positions or intensities were detected, indicating lack of binding. (F) 1H-13C HMQC spectra of full-length DNAJB1 alone (black), and upon addition of twofold excess of monomeric tau protein (blue). No interaction is visible between the two proteins. (G) Same experiment as in (F) performed with aggregation-prone (heparin-bound) tau species. Residues displaying significant reduction in intensity upon binding to heparin-tau are indicated.
Figure 7
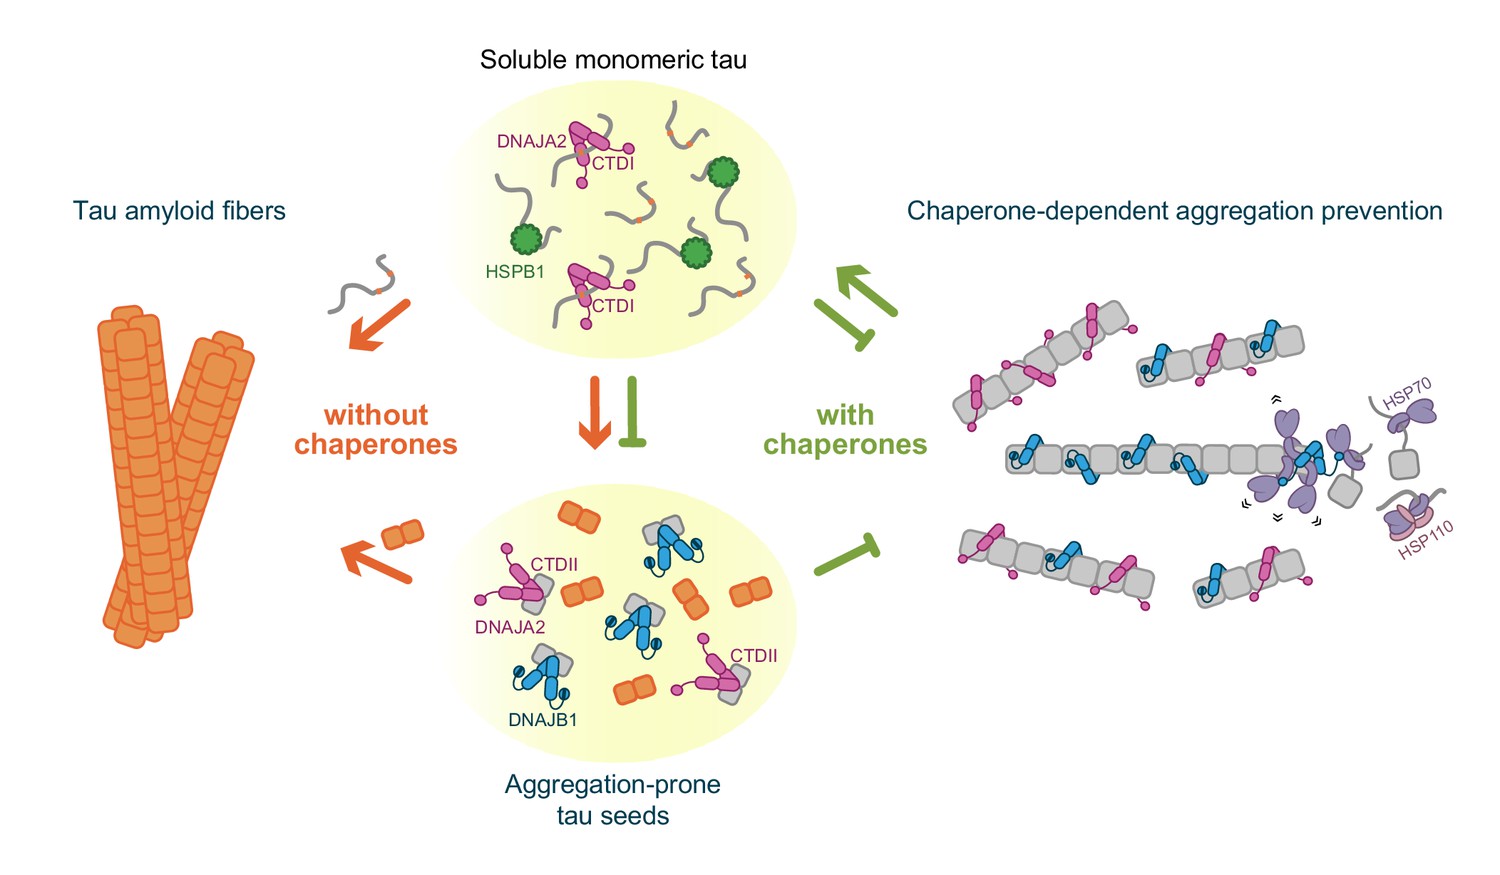
Schematic representation of chaperone-dependent aggregation prevention of tau.
HSPB1, DNAJA2, and DNAJB1 chaperones play complementary roles in tau aggregation prevention, each affecting different microscopic steps along the tau aggregation pathway and interacting with distinct tau species. HSPB1 chaperone (green) interacts solely with monomeric tau (gray squiggles), preventing its incorporation into the growing fibers. DNAJB1 chaperone (blue) shows a completely distinct tau binding profile – binding only to aggregation-prone tau and to the mature tau fibers, thus inhibiting the formation of nuclei (orange squares), as well as the elongation of existing fibers. Furthermore, DNAJB1, together with the Hsp70 chaperone system, can disaggregate tau fibers, returning the proteins to their soluble monomeric state (Nachman et al., 2020; Ferrari et al., 2018). DNAJA2 (purple) binds to all tau species (monomer, nuclei, and fibers), thus serving as an extremely potent suppressor of tau aggregation. While nuclei and mature fibers selectively interact with a site in the C-terminal domain II (CTDII) of both Hsp40 chaperones, DNAJA2 possesses a second, distinct site in CTDI through which it recognizes the monomeric tau species.
Additional files
Download links
A two-part list of links to download the article, or parts of the article, in various formats.
Downloads (link to download the article as PDF)
Open citations (links to open the citations from this article in various online reference manager services)
Cite this article (links to download the citations from this article in formats compatible with various reference manager tools)
Hsp40s play complementary roles in the prevention of tau amyloid formation
eLife 10:e69601.
https://doi.org/10.7554/eLife.69601


