Unraveling the influences of sequence and position on yeast uORF activity using massively parallel reporter systems and machine learning
- Department of Biological Sciences, Carnegie Mellon University, United States
- Computational Biology Department, Carnegie Mellon University, United States
Figures
Figure 1 with 4 supplements
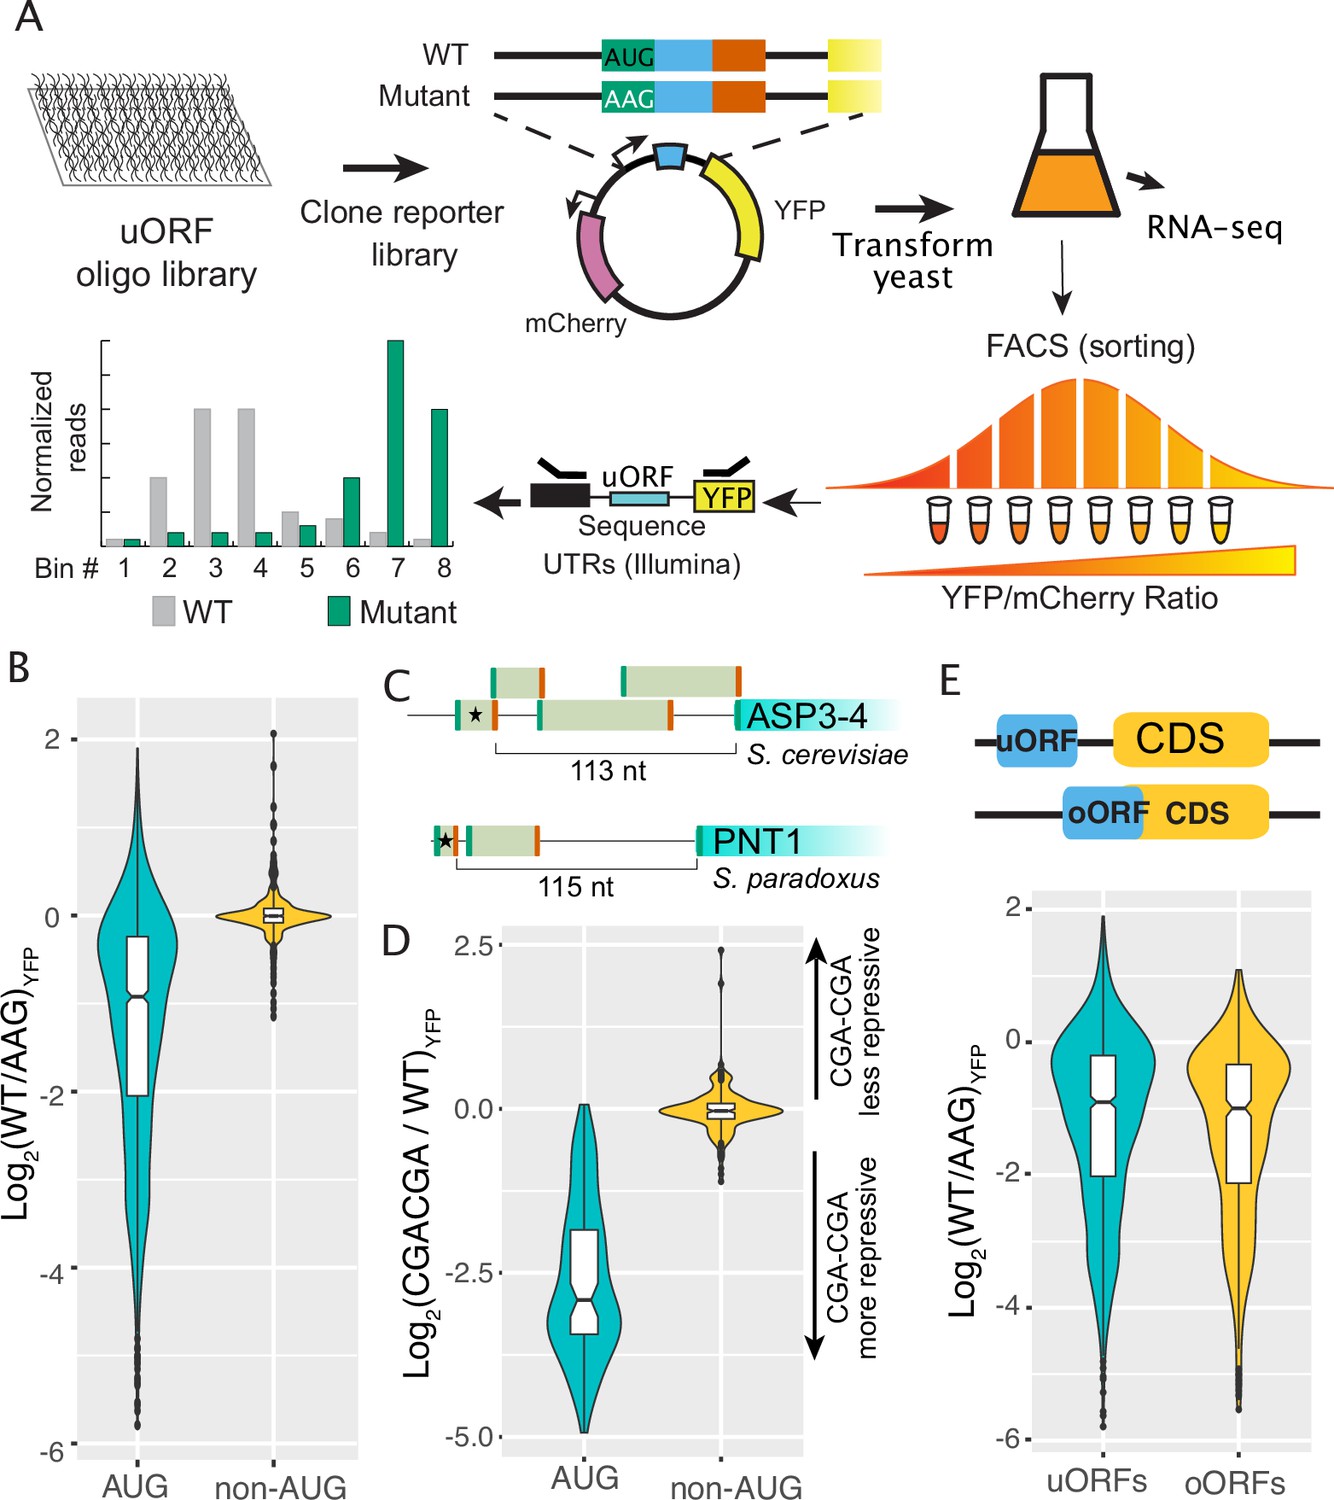
Regulatory impacts of 2038 yeast uORFs.
(A) A custom library of pairs of uORF-containing and uORF-mutant transcript leaders was cloned into reporter plasmids. Yeast were transformed with the reporter library and FACS sorted on the YFP / mCherry ratio. Plasmids extracted from the resulting FACS bins were sequenced to measure the expression levels of each reporter. (B) Comparison of AUG- and non-AUG-uORF activities. The log-fold change resulting from mutating uORF start codons is plotted. AUG uORFs are much more repressive than NCC-uORFs, though some AUG uORFs enhance expression. (C) Examples of complex transcript leaders with two enhancer uORFs (stars). (D) Insertion of CGACGA stalling dicodons increases repression from all AUG-uORFs and most non-AUG-uORFs, supporting their translation. (E) Overlapping AUG-uORFs (oORFs) are slightly more repressive than discrete uORFs.
Figure 1—figure supplement 1
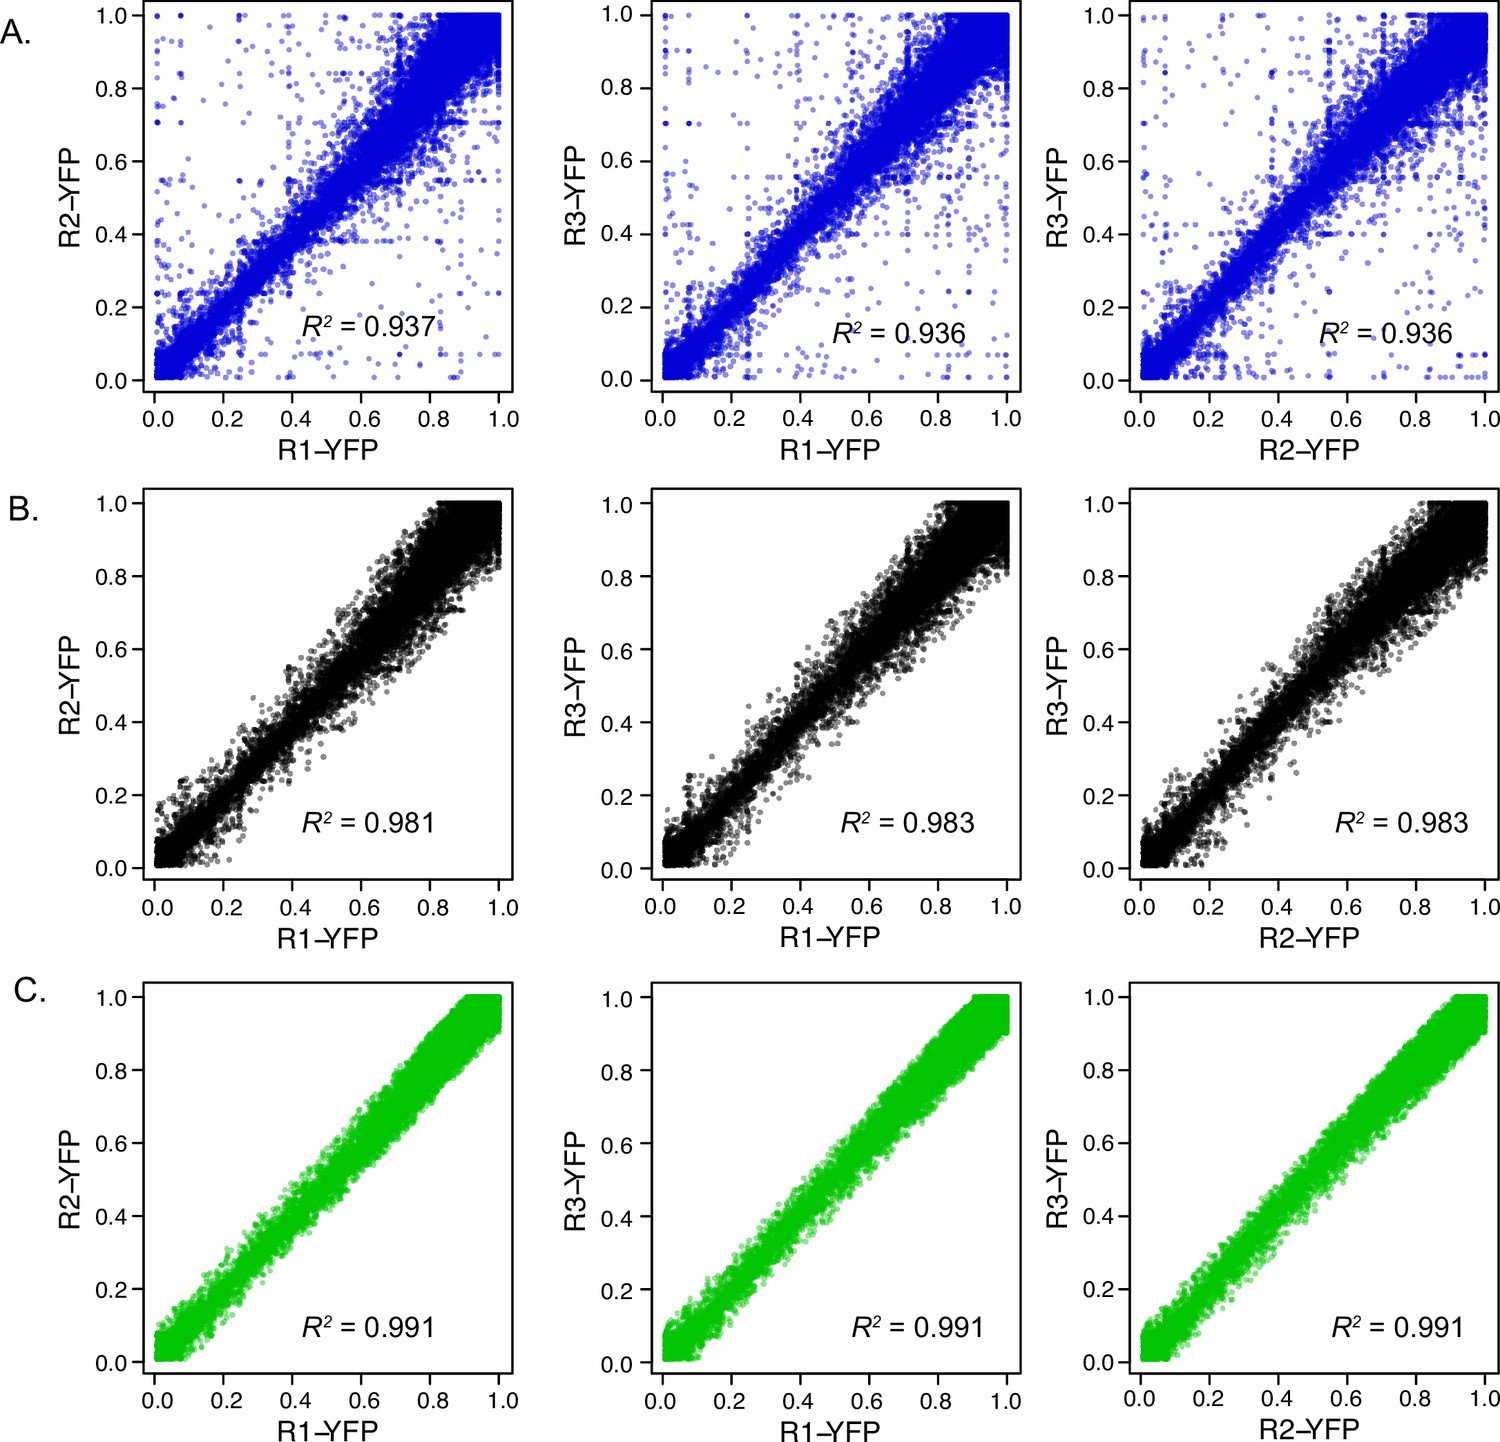
Comparison of UTR expression measurements using FACS.
(A) Raw data from three replicates are plotted against each other, with squared Pearson’s R values shown. The standard deviation across the three replicates was used to filter the data to remove UTRs with noisy measurements. Results after filtering are shown with standard deviation threshold <0.1 (B) and <0.06 (C) shown above. The 0.05 threshold was used to select UTRs with consistent YFP measurements for subsequent analysis of uORF activity using FACS-uORF (WT / AAG).
Figure 1—figure supplement 2
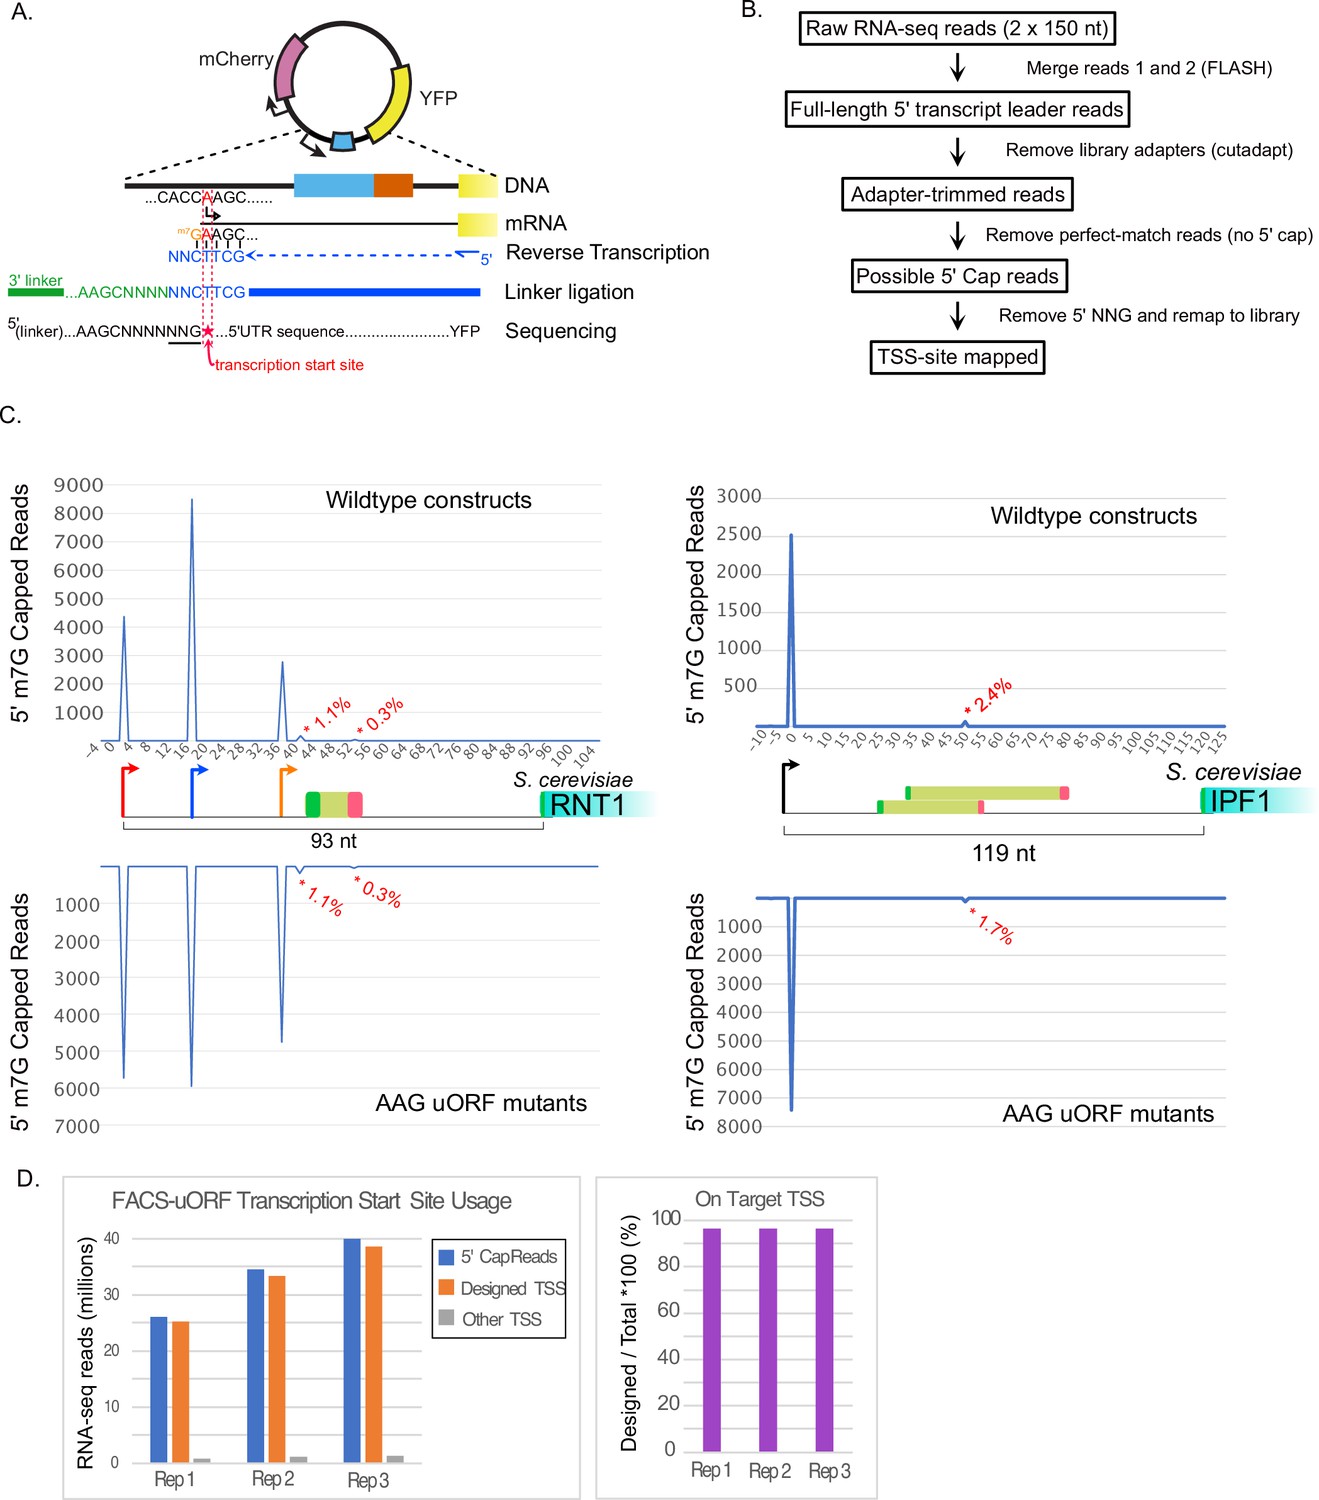
Fidelity of transcription initiation in FACS-uORF reporter constructs.
(A) The reverse transcriptase used for YFP-targeted RNA-seq Incorporates "CNN" at 5' m7G capped RNA ends (Wulf et al., JBC 2019). This allows computational identification of capped 5' ends transcription start sites from reads that start with untemplated ‘NNG’. (B) Flow-chart showing analysis of RNA-seq reads to identify transcription start sites. Raw reads were merged, adapter sequences were removed, and the resulting reads were aligned to the designed reporter library sequences. Reads that aligned perfectly (without 5' mismatches), were considered uncapped and removed. Remaining reads containing 5' NNG were trimmed and remapped to the reporter library. Reads that perfectly matched the library design after removing the 5' NNG were considered TSS-site reads. (C) Examples of TSS-site read locations for RNT1 (left) and IPF1 (right) uORF reporters. The total number of 5' cap reads mapping to each nucleotide in each transcript leader region are plotted above (wildtype plasmids) and below (AAG mutant plasmids), respectively. Asterices indicate 5' cap reads from off-target (non-designed) sites, labeled with the percentage of 5' cap reads mapped to each off-target location. (D). Bar graphs show the number of 5' cap reads mapped to designed and off-target TSSs for each RNA-seq replicate.
Figure 1—figure supplement 3

Fluorescent protein identity has minor impacts on measurement of uORF functions.
To evaluate how the reporter protein sequence affects uORF activity, we constructed plasmids carrying six wildtype and corresponding mutant uORF reporters upstream of YFP (X-axis) and mCherry (Y-axis), with mCherry and YFP serving as controls, respectively. uORF activity was measured in triplicate using a fluorometer. The magnitude of uORF repressiveness was highly consistent, regardless of the fluorescent proteins used, resulting in an R2 of 0.662 for all constructs and 0.869 excluding the YHR022C uORF reporter, which had high variance in measurement from the mCherry reporter.
Figure 1—figure supplement 4

Examples of false-positive uORF enhancers.
(A) RSB1 has two upstream AUGs. The first encodes a highly conserved N-terminal protein extension that may be the true gene start codon (annotation error). The second uAUG encodes an overlapping uORF (oORF) close to the annotated gene start codon. Mutation of the oORF start codon (AUG ->AAG) creates a UAA stop codon in the unannotated N-terminal extension, converting it to a uORF. This likely explains why the oORF appears to be an enhancer, as the oORF start codon mutation decreases expression. (B) IRC19 also has two uAUGs. The first encodes a uORF and the second encodes an oORF. Mutation of the first uORF AUG start codon to AAG places an A in the –3 position of the oORF start codon, which strengthens the Kozak motif for the oORF. This is another common source of likely false-positive enhancer uORFs. Such cases are listed in Supplementary file 1b and were removed from all further analyses. Images created using the UCSC genome browser.
Figure 2 with 2 supplements

Massively parallel analysis of ribosome loading by Polysome Library Sequencing (PoLib-seq) supports FACS-uORF estimates of uORF function.
(A) The PoLib-seq assay system was developed to determine the impact of uORFs on ribosome loading. Polysome extracts were prepared from wildtype (BY4741) yeast strains expressing FACS-uORF library 2 and separated on a 7–47% sucrose gradient by untracentrifugation. RNA was extracted from polysomal (2+ribosome) and non-polysomal (40 S, 60 S, and monosome) fractions, and reporter constructs were quantified by targeted RNA-seq. The percent of polysomal reads was compared for each wildtype / AAG mutant uORF pair to determine the impact of each uORF on ribosome loading. (B) Comparison of FACS-uORF (x axis) and PoLib-seq (y axis) estimates of uORF function, both given as the log-transformed difference between wildtype and AAG mutant uORF. uORF impacts on ribosome loading are positively correlated with impacts on protein expression in wildtype yeast (left), and the correlation is stronger in the upf1Δ strain (right).
Figure 2—figure supplement 1
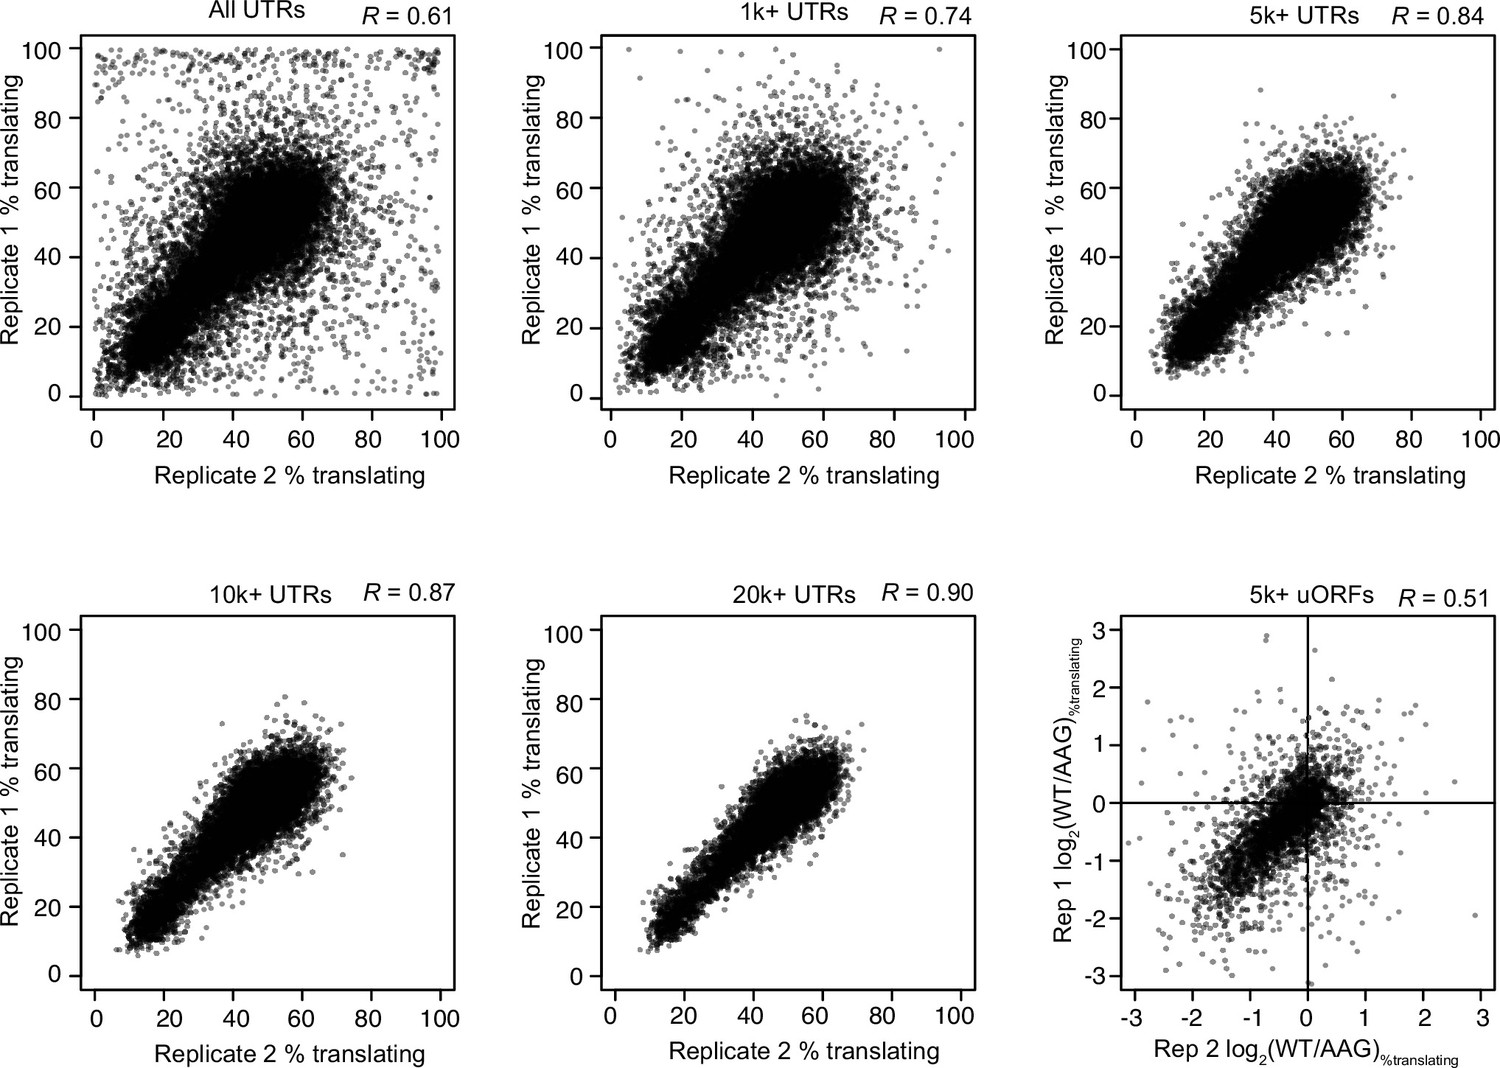
Reproducibility of PoLib-seq estimates of translation efficiency and uORF activity.
Scatter plots show a comparison of two replicates of PoLib-seq data for all UTRs tested (top, left) and UTRs that exceeded read-count thresholds (1000, 5000, 10,000, and 20,000 total reads). Pearson’s R correlation constants are shown above each plot. The 5000 read threshold was chosen for uORF analyses. Lower right plot shows a comparison of uORF activities as measured in the two replicates.
Figure 2—figure supplement 2
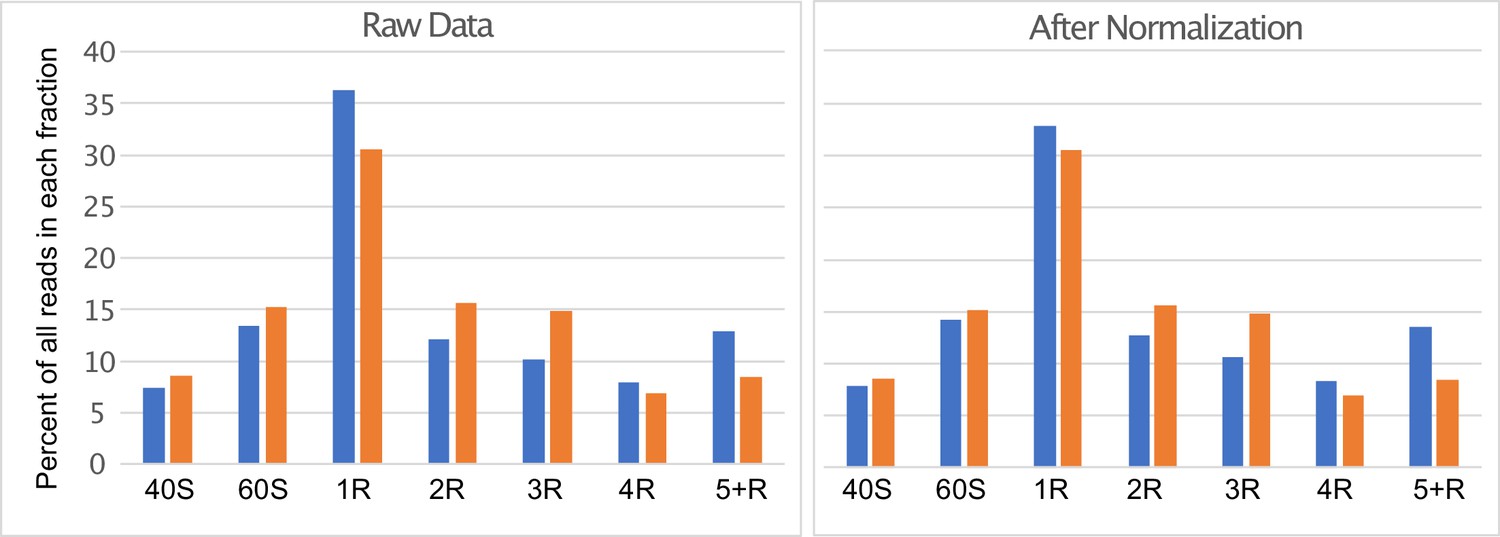
Distribution of PoLib-seq reads.
Libraries were pooled based on the relative amounts of total RNA recovered from each fraction of the sucrose gradients (40 S, 60 S, Monosome (1 R), Disome (2 R), etc.). The bar graph on the left shows the raw data from replicates 1 (blue) and two (orange). For analysis of uORF functions, reads were grouped into translating (2 R, 3 R, 4 R, 5+R) and non-translating (40 S, 60 S, and 1 R) fractions. Replicate 1 was normalized by downsampling the monosome fraction by a factor of 0.8626 (see methods) so that the total fraction of translating reads in each replicate was 45%, as depicted in the bar graph on the right.
Figure 3
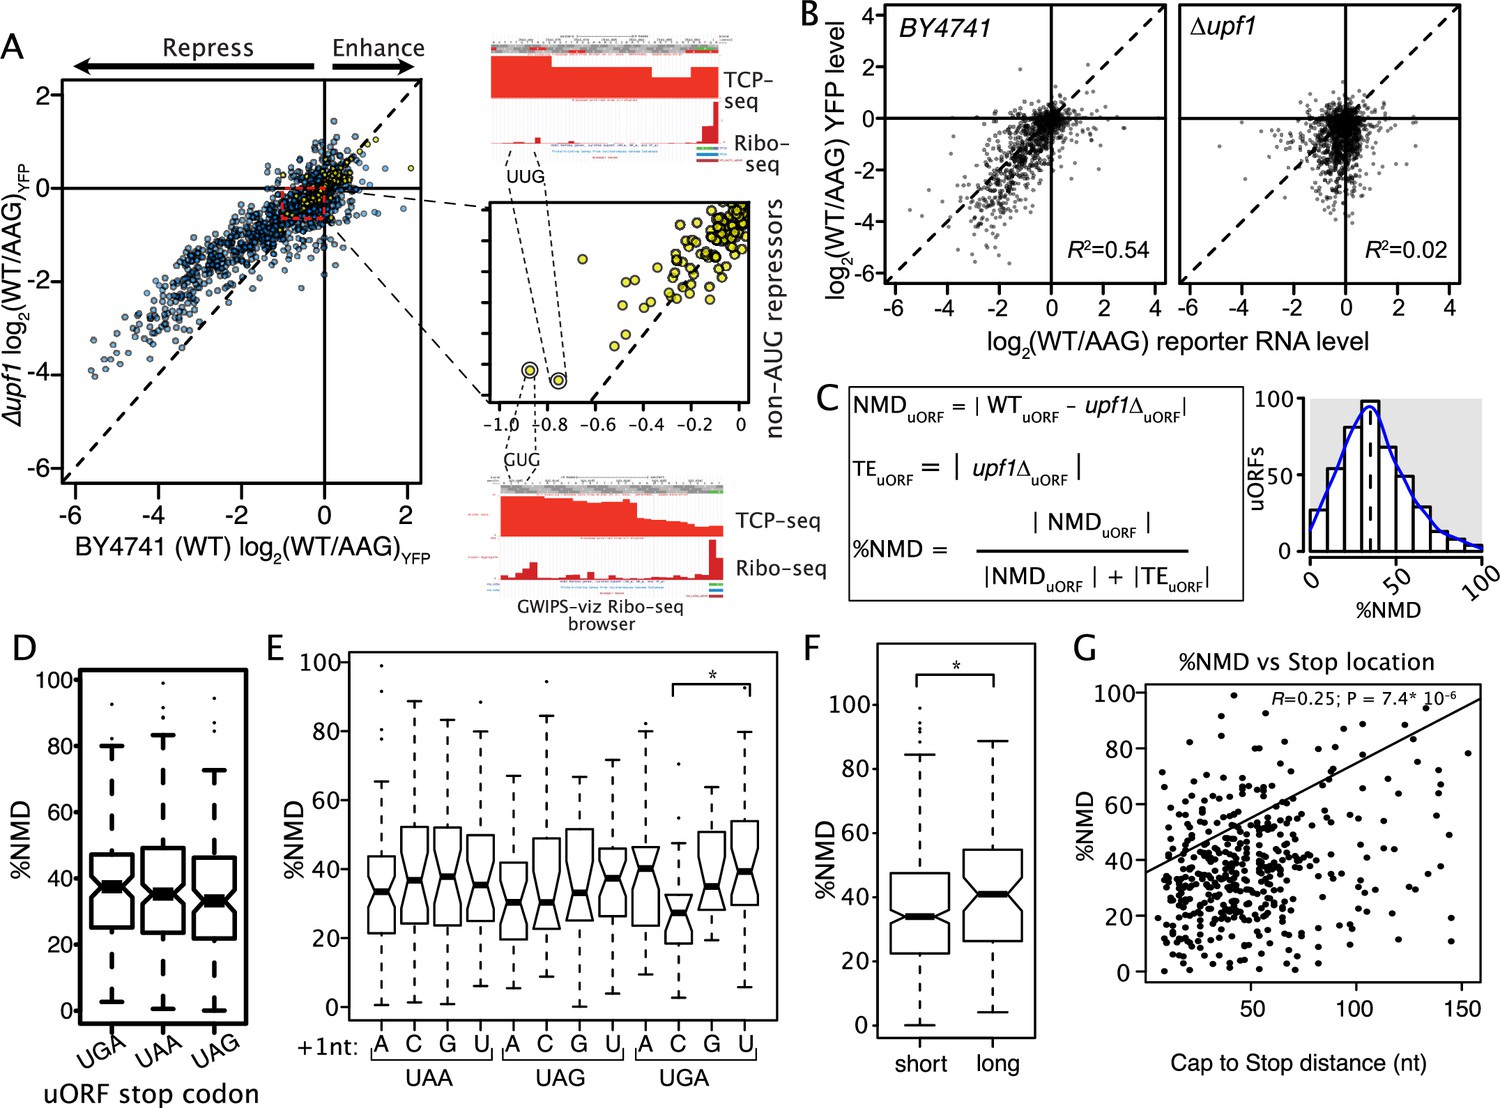
The role of nonsense-mediated decay in uORF activity.
(A) Scatter plot compares the regulatory impact of mutating uORF start codons in wildtype (x-axis) and ∆upf1 mutant yeast defective for nonsense mediated decay (left). Most AUG (blue), and some non-AUG uORFs (yellow) were less repressive in a ∆upf1 strain, compared to wildtype. A zoomed view of non-AUG uORF NMD effects is shown, highlighting two relatively strong non-AUG-repressor uORFs. Composite Ribo-seq and TCP-seq profiles from the GWIPS-viz browser supporting translation of these uORFs are shown (right). (B) Comparison of uORF impacts on mRNA and protein expression levels are shown for wildtype (left) and ∆upf1 (right) yeast strains. ∆upf1 decouples uORF impacts on transcription and translation. (C) Calculating the percent of each AUG uORF’s regulation due to NMD. WTuORF and upf1ΔuORF are the log2(WT/AAG) in wildtype and upf1Δ yeast strains, respectively. The magnitude of uORF regulation through NMD (NMDuORF) is calculated as WT minus upf1Δ, upf1ΔuORF is the magnitude of the uORF effect solely on translation efficiency (TEuORF), in the absence of NMD. The relative contributions of NMD to uORF activity (%NMD) is calculated as the fraction of the total regulation attributable to NMD. %NMD is plotted for all assayed uORFs, showing a wide range of NMD induction. (D through G) Association of uORF features with %NMD. Termination at UGA stop codons induces more NMD than other stop codons (D), however UGAC stop codons, which are known to allow read-through, have lower %NMD (*; P = 0.061). Long uORFs induce more NMD than shorter uORFs, and uORFs that terminate far from transcript leader caps induce more NMD than those that terminate close to 5' caps (*; P = 0.011).
Figure 4 with 2 supplements

Elastic Net Regression modeling of uORF activities in wildtype and UPF1-delta strains.
(A) Weblogo consensus sequences in the Kozak region surrounding uORF start codons, separated by regulatory effect. (B) Boxplot of regulatory effects for uORFs binned on distance between the 5' cap and the uORF start codon. uORFs starting before 6 nucleotides were removed to avoid the A-rich region immediately after the reporter transcription start site. (C) Boxplot of regulatory effects for uORFs binned by distance between the stop codon and the YFP start codon. (D) Scatterplot comparing uORF activities predicted by the elastic net regression model (x-axis) with those observed from FACS-uORF (y-axis) in wildtype yeast. The model explains roughly 1/3 the variance in uORF activity. (E) The bar graph shows feature weights in the ENR model. Notably, uORF start and stop codon location features are together more predictive than Kozak sequence strength. Similar results for ENR modeling of uORF activity in a upf1-deletion strain. In the absence of NMD, the sequence downstream of the stop codon is no longer significant, while the uORF codon Adaptation Index (uORF CAI) becomes significant. * indicates P < 0.05; ** shows P < 0.0005; and *** depicts (P < 5 x 10^-8).
Figure 4—figure supplement 1
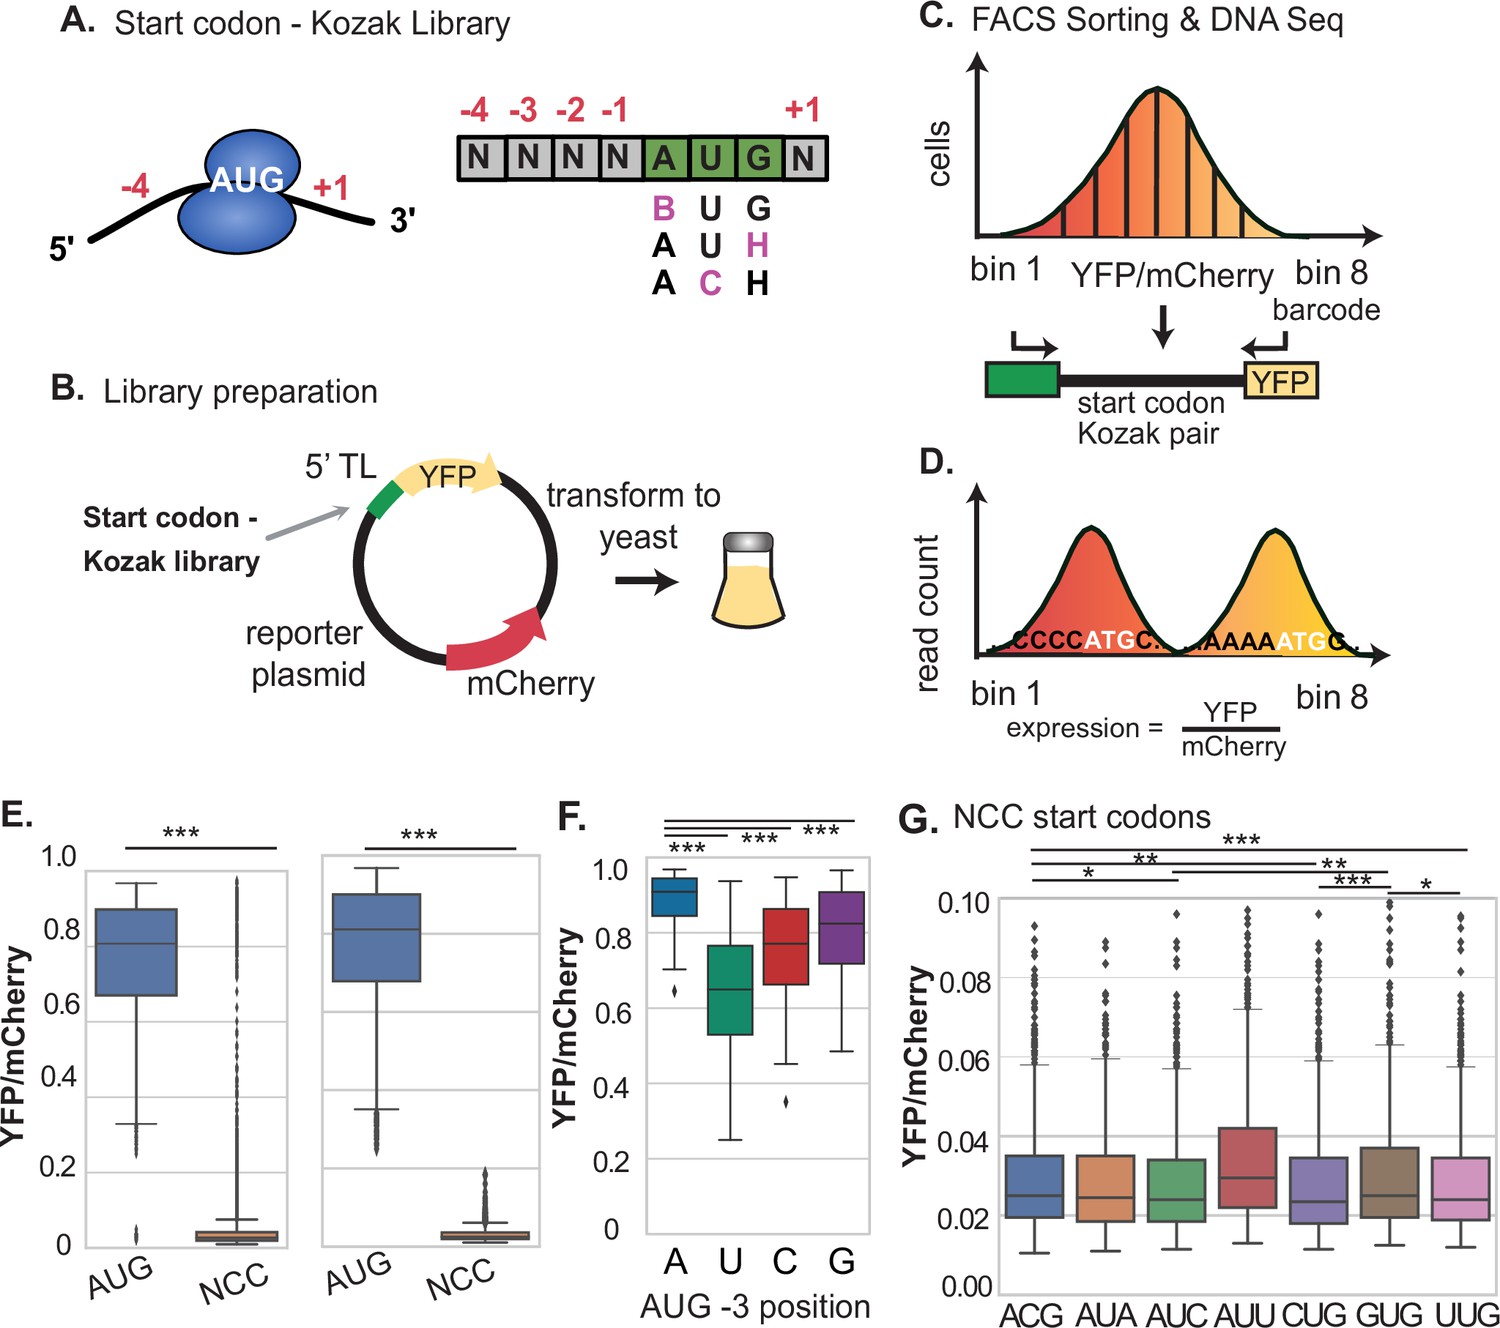
Determination of relative Kozak context strength for AUG and NCC codons using FACS-seq.
(A–B) A library of AUG and NCC codon reporters was cloned at the YFP start codon of the dual fluorescent reporter using oligos with degenerate bases and transformed into yeast. (C) The yeast library was sorted by FACS and plasmids were sequenced from each bin. (D) The median expression value of each Kozak motif variant was determined based on the frequency of each variant across bins. (E) Comparison of the distribution of Kozak context expression values from AUG and near-AUG codons. The left boxplot shows all data, while the right boxplot shows data after removing noisy expression measurements, as described in Figure 1—figure supplement 1. AUG codons are much more highly expressed, while near-AUG codons have very low expression. (F) Expression from AUG Kozak contexts with different sequences at the –3 position. –3 A is signficantly stronger than all other nucleotides. (G) Comparison of expression levels for all near-AUG codons. Most near-AUG Kozak contexts provide less than 3% of the expression of the strongest AUG codon. * P < 0.05, ** P < 0.01, and *** P < 0.001.
Figure 4—figure supplement 2
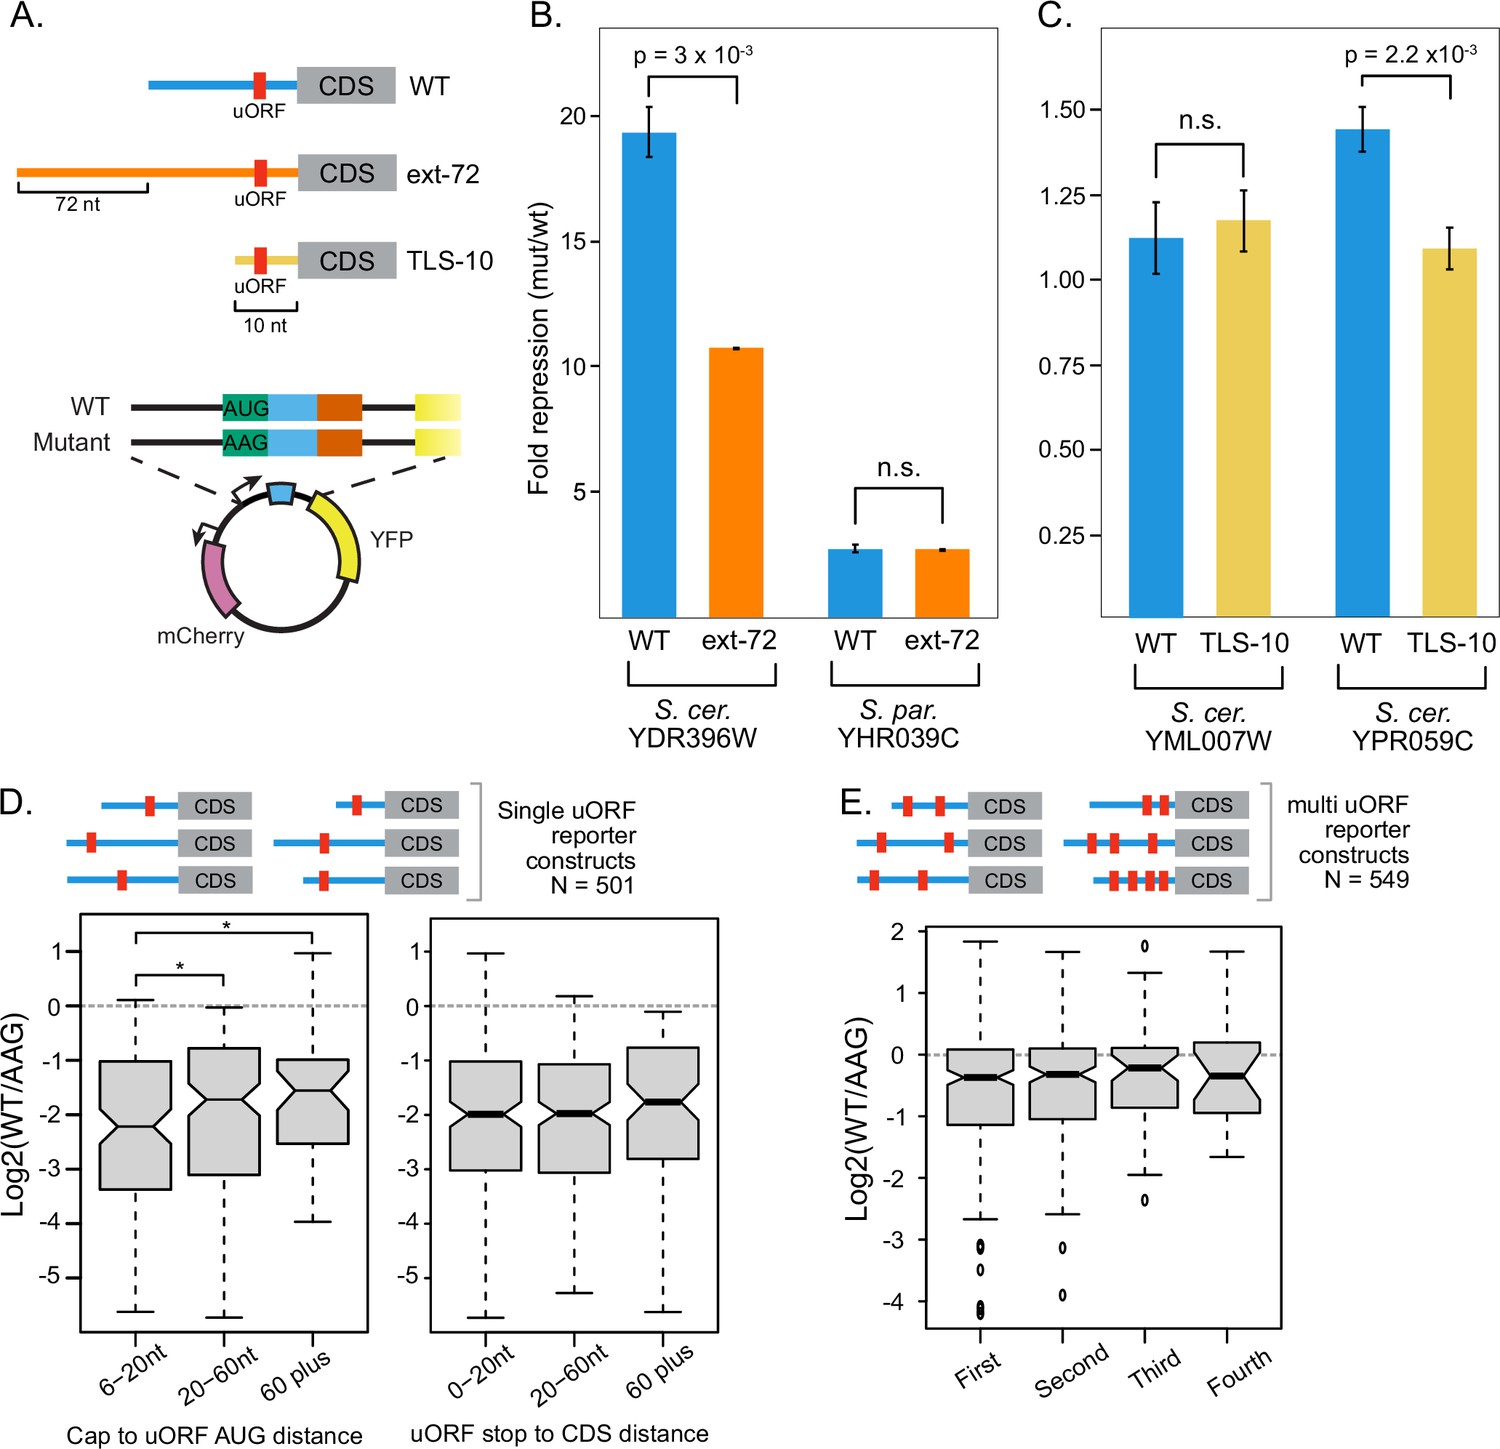
Effects of uORF location on represion.
(A) Four transcript leaders harboring uORFs were mutated to alter the location of the uORF relative to the transcription start site. A 72 nucleotide long extension, designed to be absent of strong RNA structure (Lai et al., 2018) was added to each of two 5' end proximal uORFs (YDR396W and YHR039C) to make them 5' end distal. Reciprocally, transcript leaders from two 5' end distal uORFs (YML007W and YPR059C) were truncated to 10 nucleotides, resulting in 5' end proximal uORFs. Wildtype and AAG-start codon mutant reporter plasmids were cloned for each uORF and the extent of repression was assayed by comparing YFP / mCherry levels using a TECAN fluorometer. (B) Extension of the transcript leader reduced the YDR396W uORF repression approximately twofold, as predicted from the ENR model of uORF activity, but had no effect on the YHR039C uORF. (C) Transcript leader truncation had no significant effect on the YML007W uORF and, contrary to the ENR model, reduced the repression of the YPR059C~25%. * denotes P < 0.05.
Figure 5

uORF activity depends on transcription start site usage.
(A) Scatter plot comparing the activities of individual uORFs when located in longer (x axis) or shorter (y axis) transcript leaders resulting from alternative transcription start sites. Significant changes in uORF activity are indicated as red points in the plot (t-test adjusted p<0.05). Red lines mark twofold difference in activity. In most cases, uORFs are more repressive in shorter transcript leaders, when located closer to the transcription start site and 5' m7G cap. (B) Examples of uORFs with TSS location dependent activity. Arrows denote alternative transcription start sites. Blue arrows signify transcript leaders in which uORFs are more repressive, with dark blue indicating greater significance than light blue. Gray arrows indicate transcription start sites that were not significant. The asterisk shows the uORF whose repression varies with alternative transcription start site usage for DAL7. The bargraphs (right) show average YFP / mCherry levels for wild-type (WT) and uORF mutant (AAG) reporters for the transcript leaders indicated in the diagram.
Figure 6 with 1 supplement

Evolutionary differences in uORF activities.
(A) Scatter plot compares the activities of homologous uORFS from S. cerevisiae (x axis) and S. paradoxus (y axis) all assayed in S. cerevisiae. uORF activities are moderately well correlated, suggesting relaxed selection on the magnitude of repression. (B) Boxplot depicts the magnitudes of uORF activities for de novo uORFs (mutation of NCC-uORFs to AUG-uORFs), conserved uORFs (Start codon PhastCons ≥ 0.5) and not-conserved uORFs (PhastCons <0.5). Natural uORFs are much less repressive than de novo uORFs, suggesting strong selective pressure to remove novel uORFs. Conserved uORFs are also significantly less repressive than non-conserved uORFs. (C) Conserved uORF start codons are farther from transcription start sites than non-conserved uORF starts. (D) Kozak context expression scores from de novo, non-conserved, and conserved uORFs. Natural uORFs have a lower Kozak score than de novo uORFs, and conserved uORFs have a lower score than non-conserved, which likely contributes to their different magnitudes of repression. * indicates P < 0.05, and *** indicates P < 1 x 10^-10.
Figure 6—figure supplement 1

6Contribution of Kozak context differences to divergence in the AIM22 uORF repression.
Wildtype and AAG-uORF mutant transcript leaders were cloned upstream of YFP in the dual fluorescent reporter plasmid and assayed for YFP expression using a fluorometer to estimate the magnitude of uORF repression from S. cerevisiae (yellow) and S. paradoxus (blue). The S. paradoxus ortholog has a stronger Kozak context (ATTAATGT) than the S. cerevisiae ortholog (TTTGATGT). Switching these Kozak contexts increased repression from the S. cerevisiae uORF (green, left) and decreased repression from the S. paradoxus uORF (green, right), as expected. The Kozak swap uORFs had much more similar magnitudes of repression.
Additional files
-
Supplementary file 1
Data tables.
This file contains data tables that have (a) expression differences between 2,033 wildtype uORF transcript leader reporters and corresponding AAG start codon mutations in the longest 5' UTR assayed for each uORF, (b) a list of uORFs and host UTRs that whose mutation decreases expression but are likely false-positives, (c) Expression differences between 417 wildtype uORF transcript leader reporters and corresponding CGACGA insert mutations, (d) expression differences between 2,209 wildtype uORF transcript leader reporters and corresponding AAG start codon mutations using PoLib-seq (minimum 5000 reads), (e) expression differences between 1,360 wildtype uORF transcript leader reporters and corresponding AAG start codon mutations in the longest 5' UTR assayed for each uORF, (f) expression levels (YFP / mCherry) for 8,096 Kozak variants of AUG and NCC start codons, (g) uORF activities in alternative transcript leaders, (h) Activities of homologous uORFs from S. cerevisiae and S. paradoxus, (i) expression differences between 285 wildtype uORF transcript leader reporters and corresponding AUG start codon mutations, (j) features used for elastic net regression modeling of uORF activities in the wildtype strain, and (k) features used for elastic net regression modeling of uORF activities in the UPF1 deletion strain.
- https://cdn.elifesciences.org/articles/69611/elife-69611-supp1-v2.xlsx
-
Transparent reporting form
- https://cdn.elifesciences.org/articles/69611/elife-69611-transrepform1-v2.pdf
Download links
A two-part list of links to download the article, or parts of the article, in various formats.
Downloads (link to download the article as PDF)
Open citations (links to open the citations from this article in various online reference manager services)
Cite this article (links to download the citations from this article in formats compatible with various reference manager tools)
Unraveling the influences of sequence and position on yeast uORF activity using massively parallel reporter systems and machine learning
eLife 12:e69611.
https://doi.org/10.7554/eLife.69611


