How will mosquitoes adapt to climate warming?
- Department of Biology, Stanford University, United States
- Department of Biology, University of Hawaii at Manoa, United States
- Emmett Interdisciplinary Program in Environment and Resources, Stanford University, United States
- Department of Zoology, University of Toronto, Canada
- Department of Ecology and Evolutionary Biology, University of California Los Angeles, United States
- Environmental Futures Research Institute, Griffith University, Australia
- Department of Integrative Biology, University of California, Berkeley, United States
- Department of Plant Biology, Carnegie Institution for Science, United States
Figures
Figure 1

Framework for investigating climate adaptive potential.
Several mechanisms may enable in situ population persistence (evolutionary adaptations in physiology, phenotypic plasticity, phenological shifts, and life history adjustments; panels A and B). Investigating the potential for evolutionary climate adaptation requires first identifying the climate factors and traits limiting population persistence (panel C), then comparing the rate of projected climatic change to potential evolutionary rates (panel D). Evolutionary rates can be estimated based on evolutionary potential (strength of selection, and heritability and variation in the trait of interest), population demographic characteristics (maximum growth rate and generation time), and trait – environment relationships (phenotypic plasticity and environmental sensitivity of selection) (panel E). In the strength of selection image (top left, panel E), the dashed and solid lines indicate the population before and after natural selection, respectively. In the heritability panel (bottom left), P1 and F1 denote the parental and offspring generations, respectively.
Figure 2
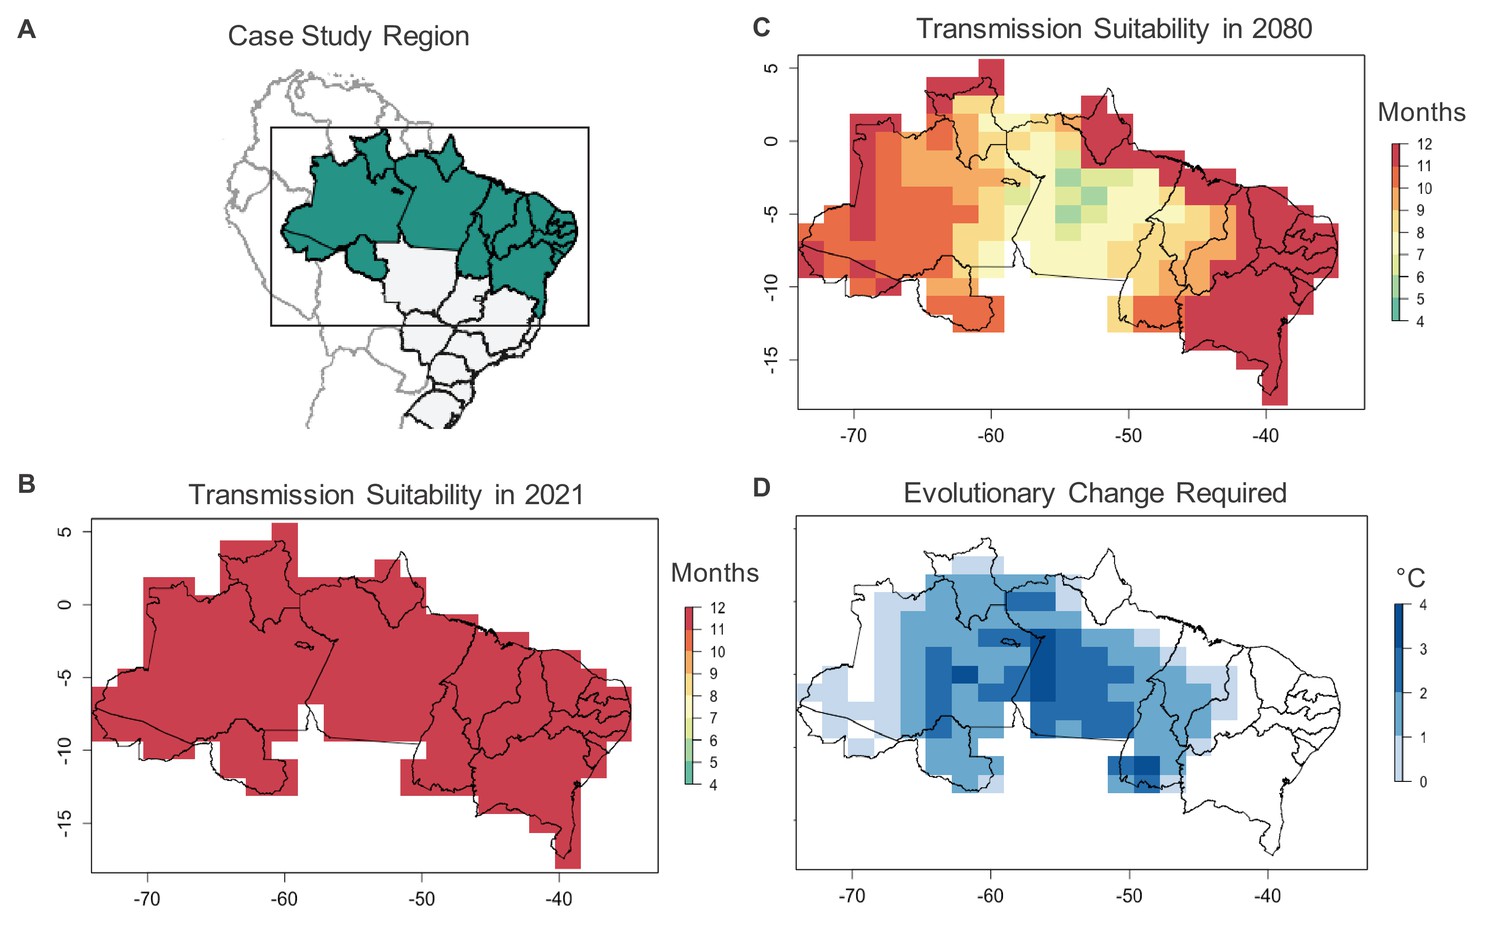
Case study on Ae. aegypti-transmitted dengue suitability.
Under current conditions, monthly dengue transmission suitability (i.e., > 0) based on mean monthly temperatures is high throughout Northern Brazil (A, B). Transmission suitability is projected to decline by 2080 under the RCP 8.5 climate scenario (C), as temperatures exceed mosquito upper thermal limits. To maintain current monthly transmission suitability under temperatures projected for 2080, evolutionary change, in the form of an increased critical thermal maximum of Ae. aegypti fecundity (D) may be required, with greater evolutionary change required in areas with greater projected warming.
Appendix 2—figure 1
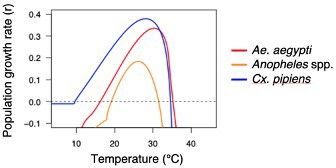
Population growth rate as a function of temperature for vector species listed in Appendix 2—table 1.
Tables
Table 1
State of knowledge on evolutionary rescue model parameters for mosquito and Drosophila species.
Numbers correspond to references; colors correspond to data availability. Purple indicates that data for these parameters are readily available (but not for all species or contexts). Blue indicates that some data are available, but further collection is warranted. Green indicates that minimal or indirect data are available (e.g. dormancy mechanisms suspected based on rapid mosquito population increases following the dry season). Yellow indicates that no estimates are available on these parameters (to our knowledge). Measurements on variation in thermal tolerance are designated as ‘inter-population’ or ‘intra-population.’.
Appendix 2—table 1
Measurements of mosquito demographic rates for major mosquito vector species.
Maximum population growth rates (r) were calculated using trait thermal responses from the references cited below and Equation S1 (Amarasekare and Savage, 2012). The temperature at which the maximum growth rate occurs, and the upper thermal limit for population growth (i.e., r = 0) are provided. The generation time is calculated as the sum of the immature development time, the gonotrophic period, and a minimum estimate of the host-blood meal and egg-laying time (4 days). We report the minimum generation time based on temperature.
| Species | Max growth rate (r) | Max growth rate temperature | Upper thermal limit for growth rate | Minimum generation time (days) | Reference |
|---|---|---|---|---|---|
| Ae. aegypti | 0.335 | 30.3°C | 35.3°C | 14 | Mordecai et al., 2017 |
| Anopheles spp. | 0.187 | 26.2°C | 31.6°C | 17 | Johnson et al., 2015 |
| Cx. pipiens | 0.379 | 28.1°C | 34.6°C | 17 | Shocket et al., 2020 |
Appendix 3—table 1
Measurements of between-population variation in mosquito thermal tolerance.
‘Evidence of local thermal adaptation’ refers to measurements where populations from warmer source environments had higher thermal tolerance than those from cooler environments.
| Species | Variation in source thermal environment | Thermal tolerance measurement | Evidence of local thermal adaptation? | Main finding | Reference |
|---|---|---|---|---|---|
| Cx. pipiens | ~3°C in mean summer temperature | larval survival | no | Population from the coolest environment had the lowest survival at all temperatures | Ruybal et al., 2016 |
| adult survival | no | Population from the coolest environment had the lowest survival at cool temperatures, but highest survival at the warmest temperature | |||
| development rate | no | Population from the warmest environment had the highest development rate at all temperatures | |||
| biting rate | no | Population rank order varied with temperature | |||
| An. darlingi | ~7, 6, 13°C in annual mean, min, and max temperature, respectively | adult lifespan | no | Population rank order varied with temperature | Chu et al., 2019 |
| larval development | no | Population from the highest minimum temperature environment developed faster at all temperatures | |||
| wing length | no | Population from the coolest environment had the longest wing length at all temperatures | |||
| Cx. tarsalis | ~5, 6, 15°C in mean daily, mean daily max, and max recorded temperature (in summer) | metabolic activity | yes | Critical thermal limits correlated positively with mean daily max temperature of source environment (but not with mean daily or max recorded temperature) | Vorhees et al., 2013 |
| Cx. tarsalis | Unspecified. Populations reared from two sites in CA, USA | larval development rate | no | Minimal variation between populations | Dodson et al., 2012 |
| % larval survival | no | Variation in survival that was strongest at the high temperature extreme | |||
| pupal development rate | no | Minimal variation between populations | |||
| % pupal survival | no | Variation in survival that was strongest at the high temperature extreme | |||
| wing length | no | No variation between populations | |||
| Cx. tarsalis | ~3°C difference in annual mean temperature | immature development rate | no | Population from warmer environment developed more quickly at all temperatures | Reisen, 1995 |
| development rate | no | Population from warmer environment developed more quickly at all temperatures | |||
| adult lifespan | no | Population from warmer environment had higher survival at intermediate, but not extreme temperatures | |||
| Cx. quinque-fasciastus | Unspecified. Populations reared from sites in New Zealand, Fiji, and Japan | larval development | no | No variation between populations | Mogi, 1992 |
| adult emergence rate | no | No variation between populations | |||
| biting rate | no | Population rank order varied with temperature | |||
| ovariole numbers | no | Population from the intermediate environment had the greatest number of ovarioles at all temperatures | |||
| egg maturation | no | Minimal variation between populations |
Appendix 3—table 2
Measurements of phenotypic plasticity in mosquito thermal tolerance, categorized as thermal acclimation, behavioral thermoregulation, and aestivation (see main text, ‘Phenotypic plasticity’).
| Form | Species | Main finding | Reference |
|---|---|---|---|
| Thermal acclimation | Cx. pipiens | Critical thermal maxima increased 1°C when developed at 26°C versus 18°C | Gray, 2013 |
| Thermal acclimation | An. arabiensis and An. funestus | Little variation in critical thermal maxima (typically increased by <2°C) after thermal acclimation | Lyons et al., 2012 |
| Thermal acclimation | An. albimanus | Heat tolerance increased with warming developmental temperatures and with a prior heat shock exposure, but mosquitoes from all treatments died at 40–43°C | Benedict et al., 1991 |
| Thermal acclimation | W. smithii | Larval and adult survival after heat shock increased ~0–30% in populations subjected to fluctuating hot/cold temperatures during development | Armbruster et al., 1999 |
| Thermal acclimation | Ae. aegypti | Larvae pre-acclimated to warmer temperatures (37–39°C) survived longer at higher temperature extremes (43–45°C) | Sivan et al., 2021 |
| Behavioral thermoregulation | Anopheles sp. | Observed seasonal shifts in feeding time, with biting occurring at dusk in cooler times of the year and late at night during warmer times | Reisen and Aslamkhan, 1978 |
| Behavioral thermoregulation | An. darlingi | Observed correlation between time of year and crepuscular biting rates, and high within-population variation in biting time | Voorham, 2002 |
| Behavioral thermoregulation | Ae. communis | Observed larvae resting in deeper, cooler waters when surface water temperatures became exceptionally high | Haufe and Burgess, 1956 |
| Behavioral thermoregulation | Ae. aegypti, Ae. japonicus | Observed preference for 30°C when exposed to thermal gradient of 30–45°C in laboratory trials | Verhulst et al., 2020 |
| Behavioral thermoregulation | An. stephensi | Observed preference for resting at ~26°C when exposed to thermal gradient of 14–38°C in laboratory trials | Blanford et al., 2009 |
| Behavioral thermoregulation | Cx. fatigans | Observed avoidance of high temperatures when exposed to thermal gradient of 25–30°C in laboratory trials | Thomson, 1938 |
| Aestivation | An. gambiae, An. coluzzii | Lower reproductive rates during the 3–6 month dry period were followed by rapidly rebounding population sizes after the first rain, suggesting persistence through aestivation | Yaro et al., 2012, Dao et al., 2014 |
Download links
A two-part list of links to download the article, or parts of the article, in various formats.
Downloads (link to download the article as PDF)
Open citations (links to open the citations from this article in various online reference manager services)
Cite this article (links to download the citations from this article in formats compatible with various reference manager tools)
How will mosquitoes adapt to climate warming?
eLife 10:e69630.
https://doi.org/10.7554/eLife.69630


