A CTP-dependent gating mechanism enables ParB spreading on DNA
- Department of Molecular Microbiology, John Innes Centre, United Kingdom
- Department of Biochemistry and Metabolism, John Innes Centre, United Kingdom
- National Centre for Biological Sciences, Tata Institute of Fundamental Research, India
- SASTRA University, India
Figures
Figure 1 with 2 supplements
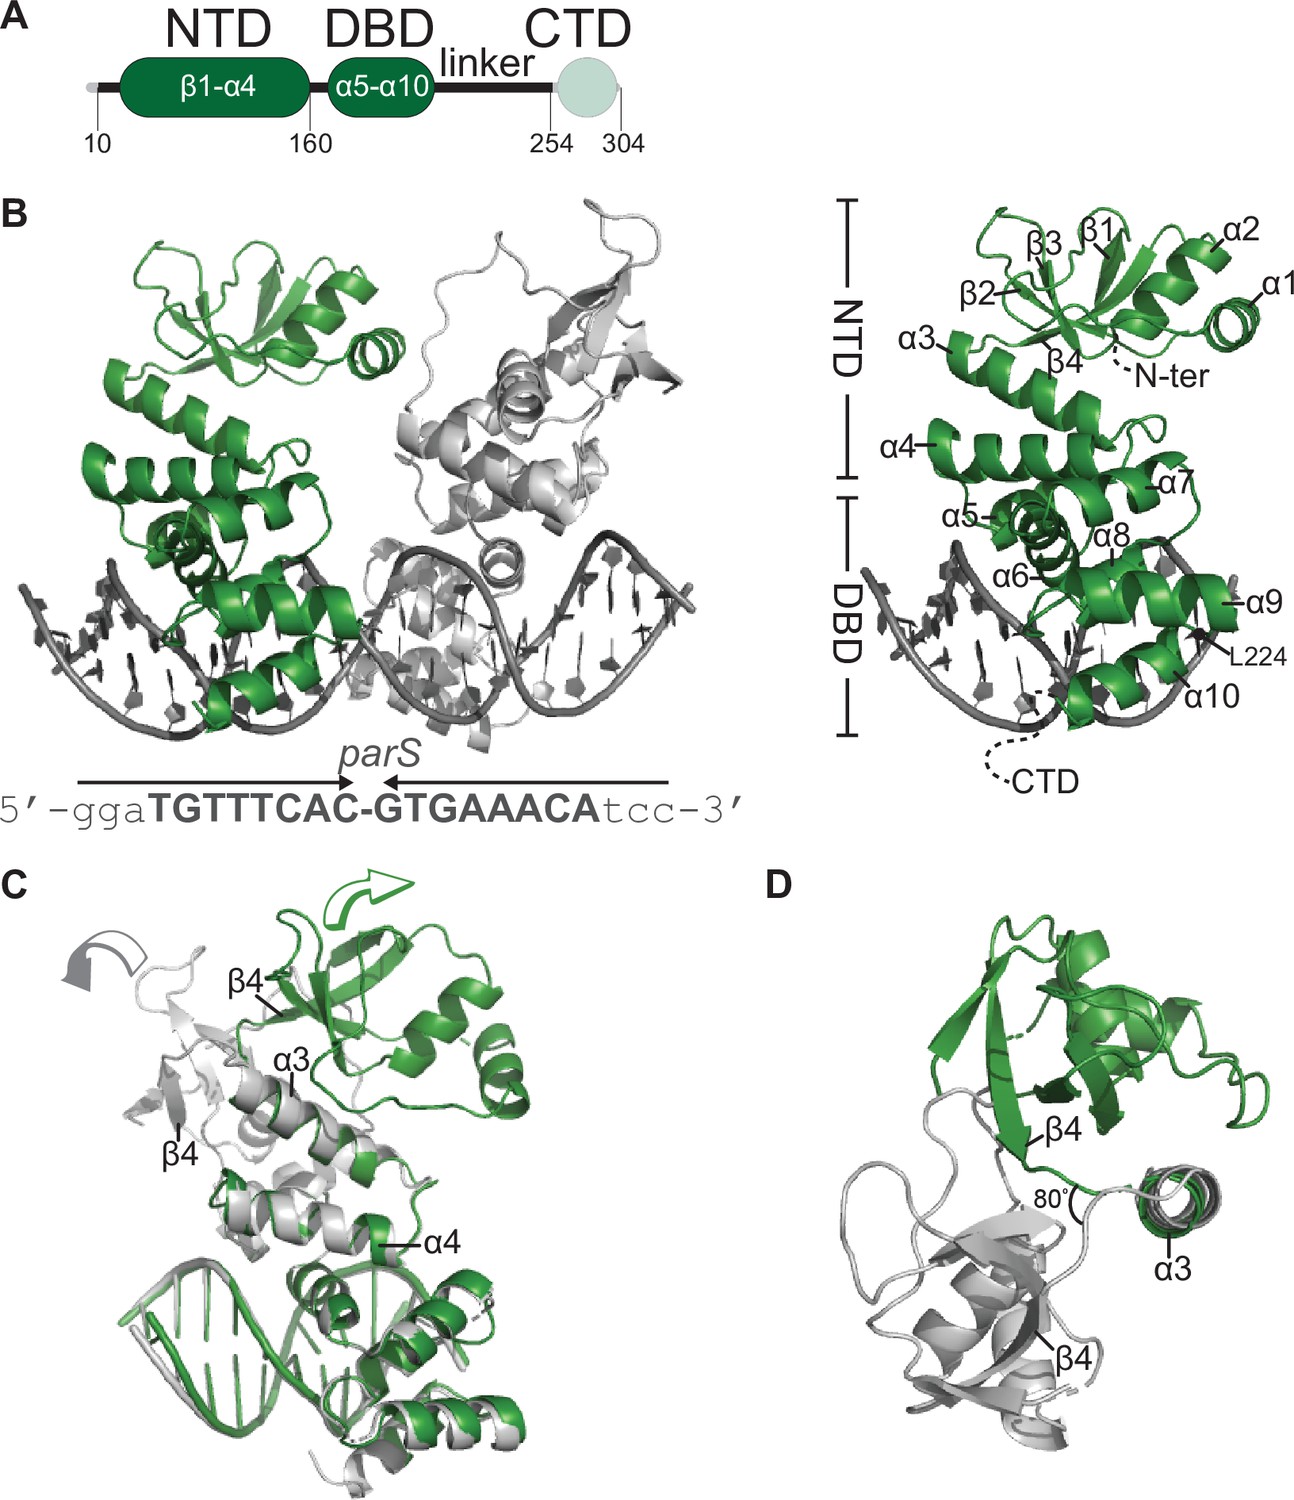
Co-crystal structure of a C. crescentus ParB∆CTD-parS complex reveals an open conformation at the N-terminal domain (NTD).
(A) The domain architecture of C. crescentus ParB: the NTD (dark green), the central DNA-binding domain (DBD, dark green), the C-terminal domain (CTD, faded green), and a linker that connects the DBD and the CTD together. The ParB∆CTD variant that was used for crystallization lacks the CTD (faded green). (B, left panel) Co-crystal structure of two C. crescentus ParB∆CTD monomers (dark green and gray) bound to a 22 bp parS DNA. The nucleotide sequence of the 22 bp parS is shown below the co-crystal structure, the core parS sequence is highlighted in bold, and each parS half-site is denoted by an arrow. The position of residue L224 is also indicated. (Right panel) The structure of a ParB∆CTD subunit bound to a parS half site with key features highlighted. (C) Superimposition of C. crescentus ParB∆CTD subunits shows two different orientations of the NTD. The arrow above each subunit shows the direction each NTD is projecting towards. (D) A top-down view of the superimposition of ParB∆CTD subunits shows their NTDs orienting ~80° apart from each other.
Figure 1—figure supplement 1
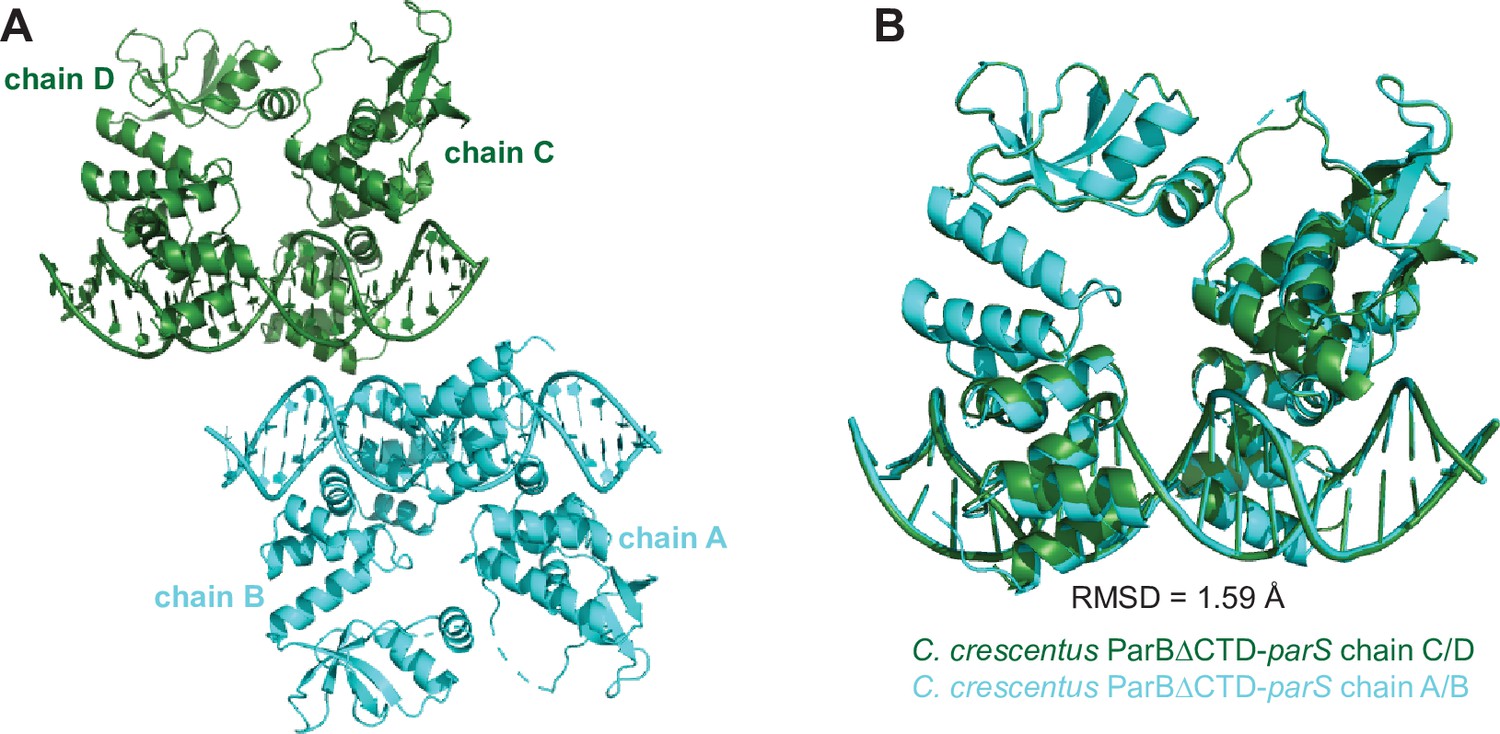
The composition of the asymmetric unit (ASU) of the C. crescentus ParB∆CTD-parS co-crystal.
(A) The ASU contains four copies of the C. crescentus ParB∆CTD monomers (chains A, B, C, and D) and two copies of the full-size parS DNA. (B) Superimposition of the chain C-D-parS complex (dark green) to the chain A-B-parS complex (cyan) shows that the two complexes in the ASU are structurally similar (root-mean-square deviation [RMSD] = 1.59 Å).
Figure 1—figure supplement 2
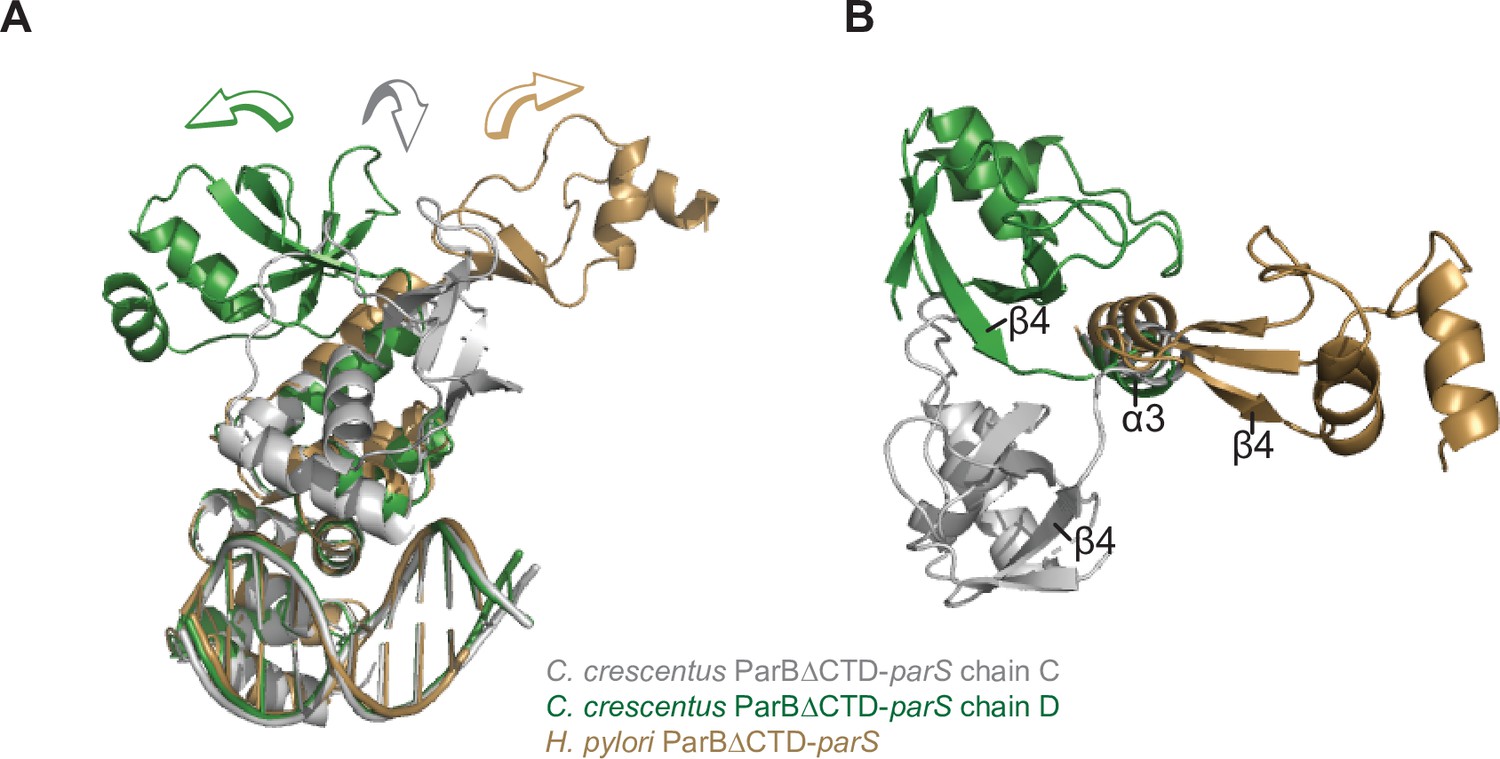
Structural comparisons of the C. crescentus ParB∆CTD-parS complex to the H. pylori ParB∆CTD-parS complex.
(A) A side view of the superimposition between C. crescentus ParB∆CTD chain C (gray), chain D (dark green), and H. pylori ParB∆CTD (golden) shows the three distinct orientations of the N-terminal domain (NTD). (B) A top view of the superimposition between C. crescentus ParB∆CTD chain C, chain D, and H. pylori ParB∆CTD. The parS DNA, DNA-binding domain (DBD), and helix α4 are omitted for clarity.
Figure 2 with 3 supplements
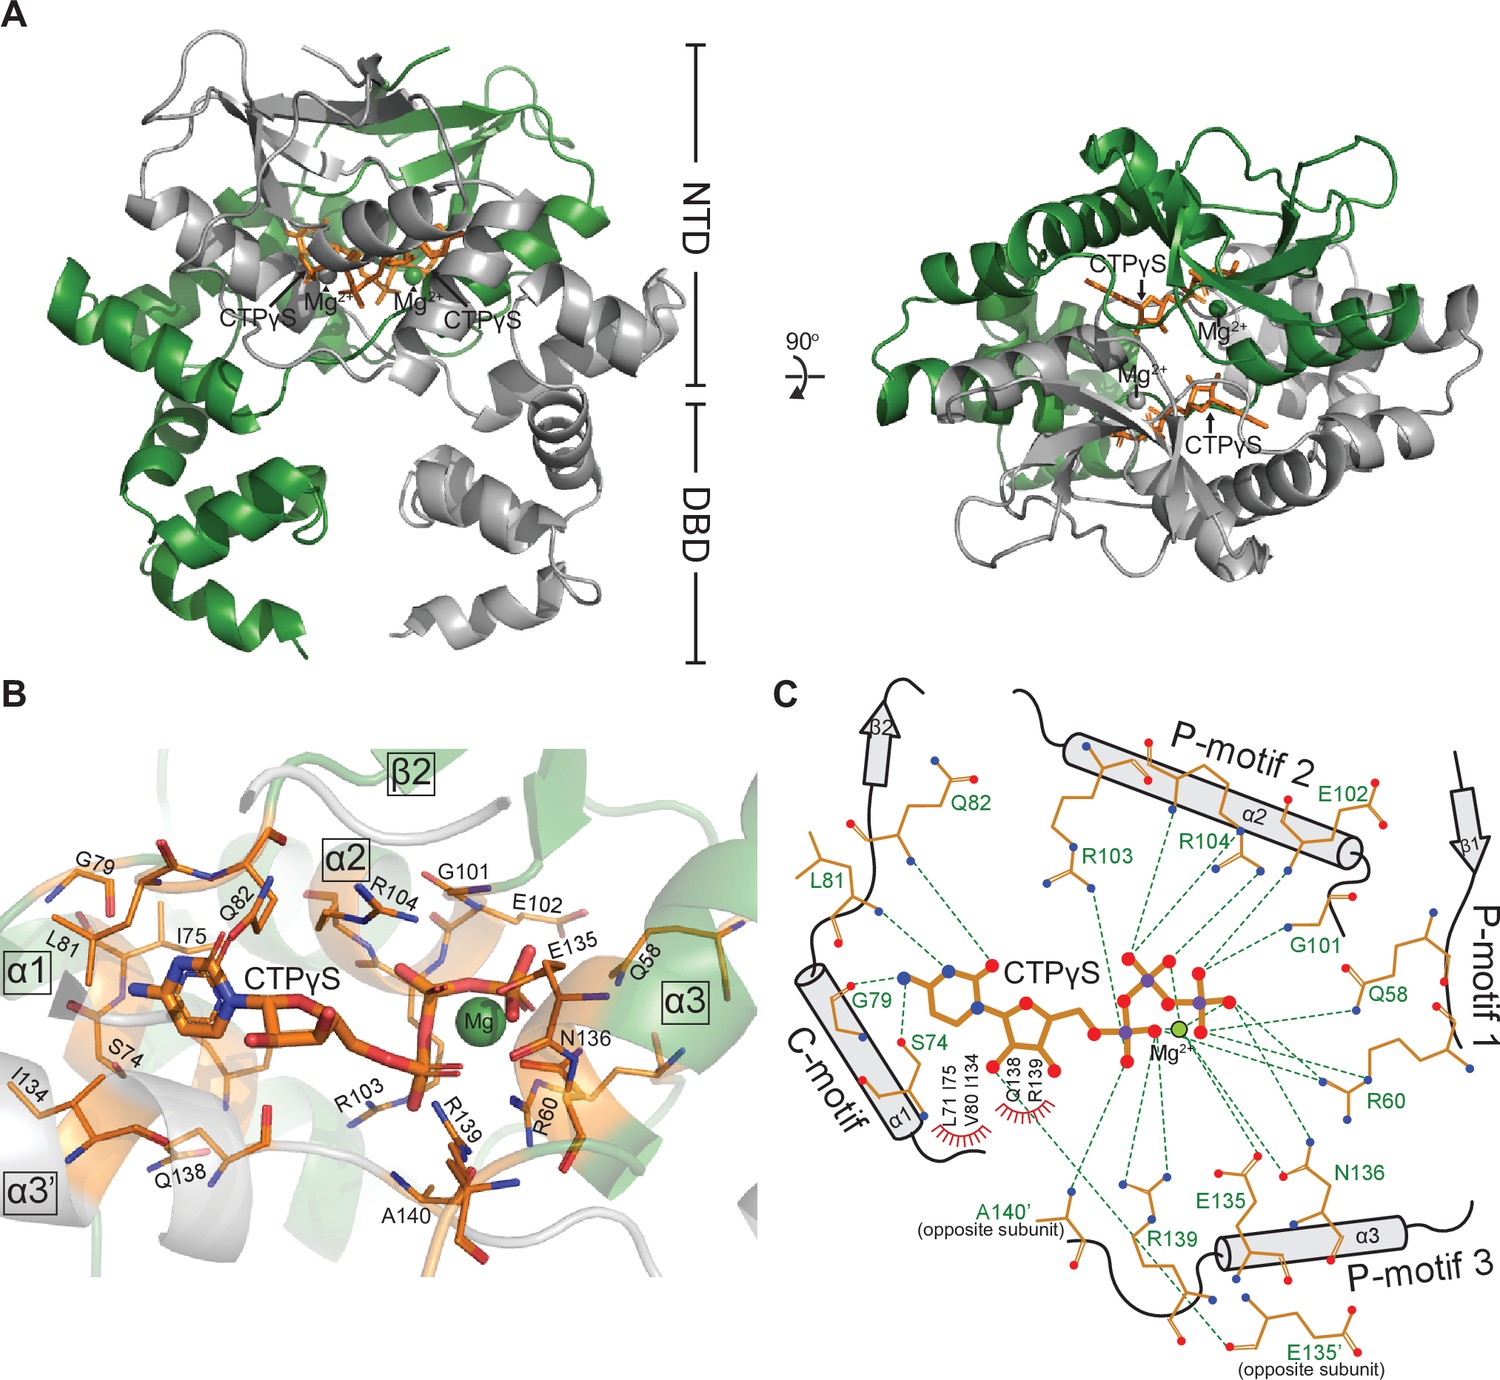
Co-crystal structure of a C. crescentus ParB∆CTD-CTPɣS complex reveals a closed conformation at the N-terminal domain (NTD).
(A, left panel) The front view of the co-crystal structure of C. crescentus ParB∆CTD (dark green and gray) bound to a non-hydrolyzable analog CTPɣS (orange) and Mg2+ ions (dark green and gray spheres). (Right panel) The top view of the C. crescentus ParB∆CTD-CTPɣS co-crystal structure. Note that helix α10 is not resolved in this structure due to a poor electron density in this region. (B) The nucleotide-binding pocket of C. crescentus ParB showing amino acid residues that contact the CTPɣS molecule and the coordinated Mg2+ ion. (C) Protein-ligand interaction map of CTPɣS bound to C. crescentus ParB∆CTD. Hydrogen bonds are shown as dashed green lines and hydrophobic interactions as red semi-circles. Nitrogen, oxygen, phosphate, and magnesium atoms are shown as blue, red, purple, and green filled circles, respectively.
Figure 2—figure supplement 1
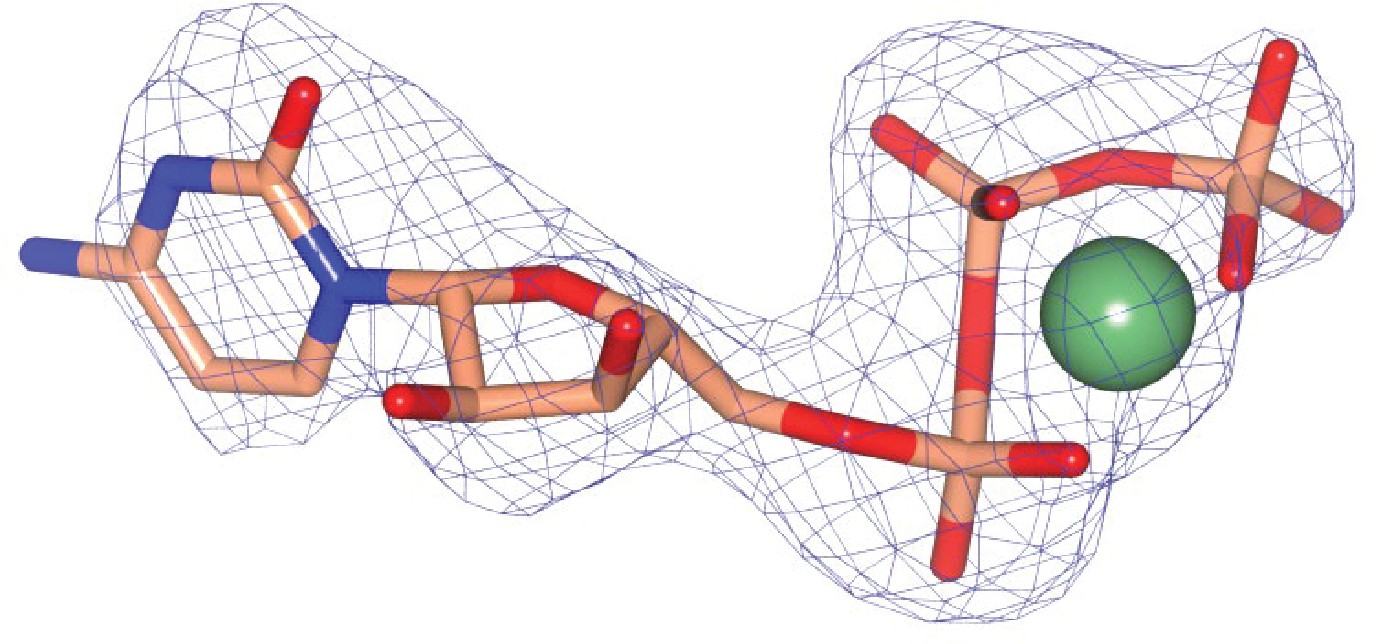
Omit mFobs-DFcalc difference electron density calculated at 2.73 Å resolution for Mg-CTP.
The omit map was calculated using phases from the final model, with the displayed atoms omitted, after the application of small random shifts to the atomic coordinates, re-setting temperature factors, and re-refining to convergence (rendered in blue mesh at a contour level of ~3.5σ).
Figure 2—figure supplement 2
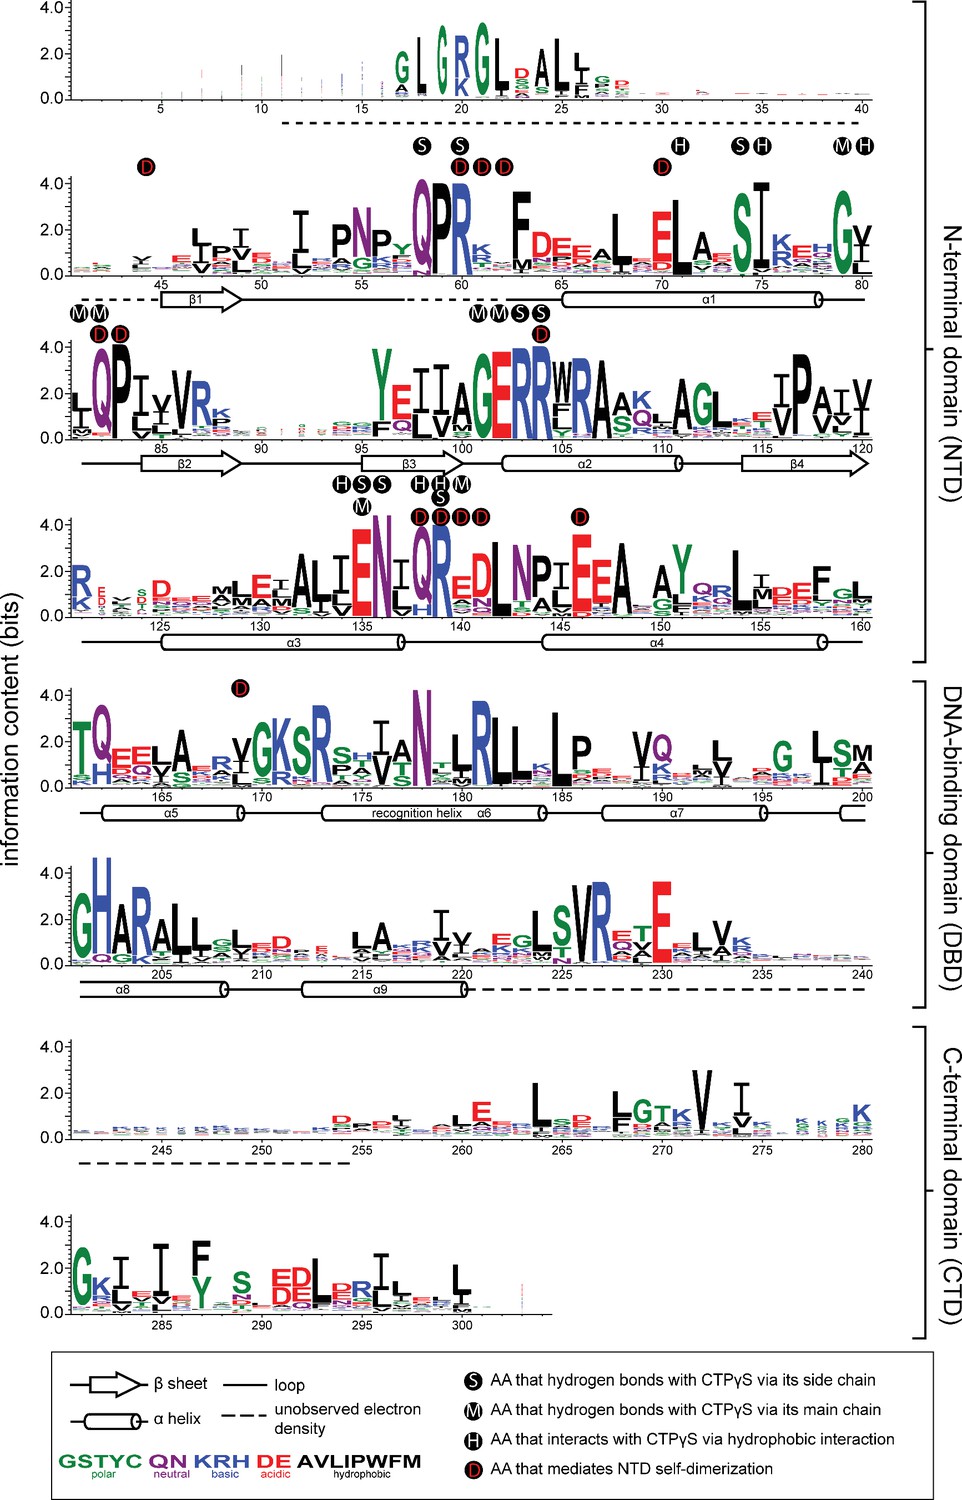
Sequence alignment of the chromosomal ParB protein family.
An alignment of ~1800 chromosomal ParB proteins was constructed and presented as a sequence logo. The height of the stack indicates the sequence conservation, while the height of symbols within the stack indicates the relative frequency of each amino acid residue at that position. Amino acids are colored based on their chemical properties. Secondary structure elements for C. crescentus ParB∆CTD are shown below the alignment. Dashed lines indicate unmodeled residues due to poor electron density in the C. crescentus ParB∆CTD-CTPɣS co-crystal structure. Residues that contact CTPɣS-Mg2+ and/or mediate the N-terminal domain (NTD) self-dimerization are also labeled.
Figure 2—figure supplement 3
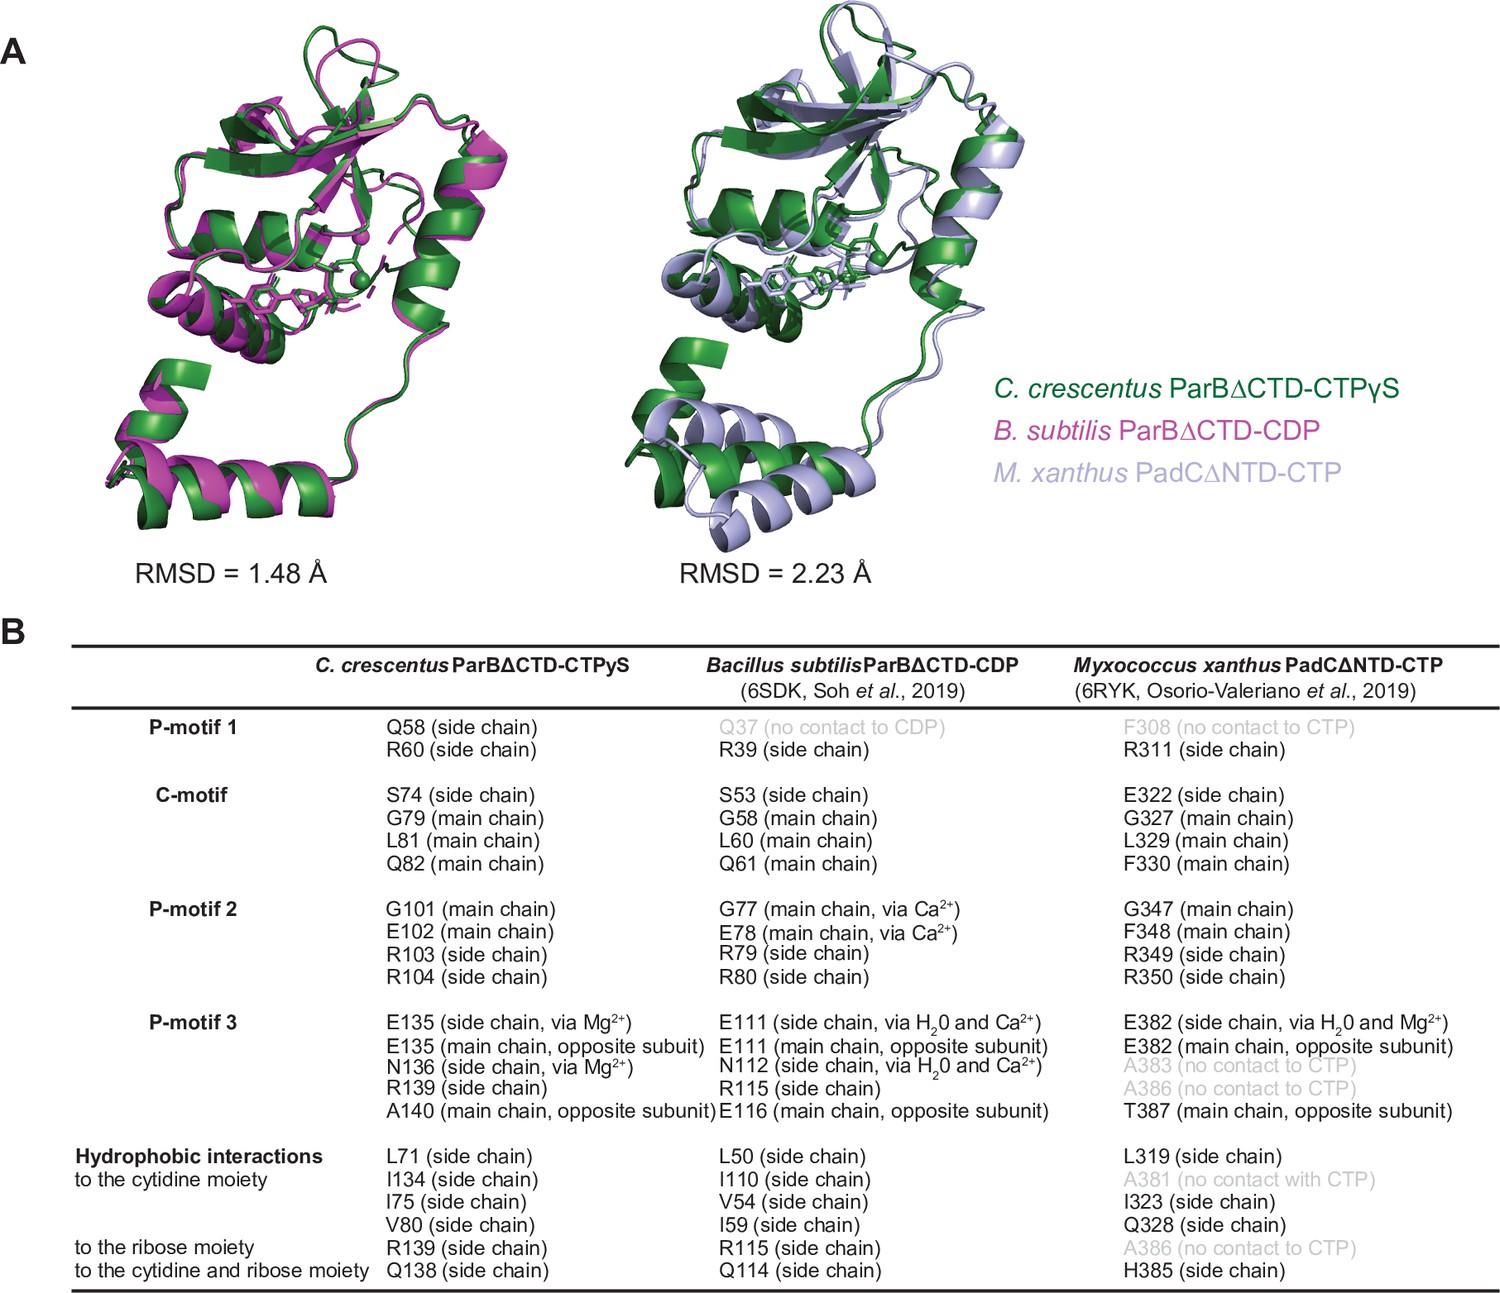
Structural comparisons of the C. crescentus ParB∆CTD-CTPɣS complex to the B. subtilis ParB∆CTD-CDP complex and the M. xanthus PadC∆NTD-CTP complex.
(A) Superimposition of nucleotide-bound structures of C. crescentus ParB∆CTD (dark green), B. subtilis ParB∆CTD (magenta), and M. xanthus PadC∆NTD (light blue) with their corresponding pairwise root-mean-square deviation values (RMSD). (B) Summary of nucleotide-contacting residues from C. crescentus ParB∆CTD-CTPɣS structure, B. subtilis ParB∆CTD-CDP structure (PDB accession code: 6SDK), and M. xanthus PadC∆NTD structure (PDB accession code: 6RYK). Positional equivalent residues that do not contact nucleotides are shown in light gray.
Figure 3

Conformational changes between the nucleating and the spreading states of C. crescentus ParB.
Structures of C. crescentus ParB∆CTD in complex with parS (left panel) and with CTPɣS (right panel), with the pairs of helices (α3–α4, and α3′–α4′ for the opposite subunit) shown in light blue and dark blue, respectively. Below each structure, only the α3–α4, α3′–α4′ pairs, and the angles between these helices are shown.
Figure 4 with 1 supplement
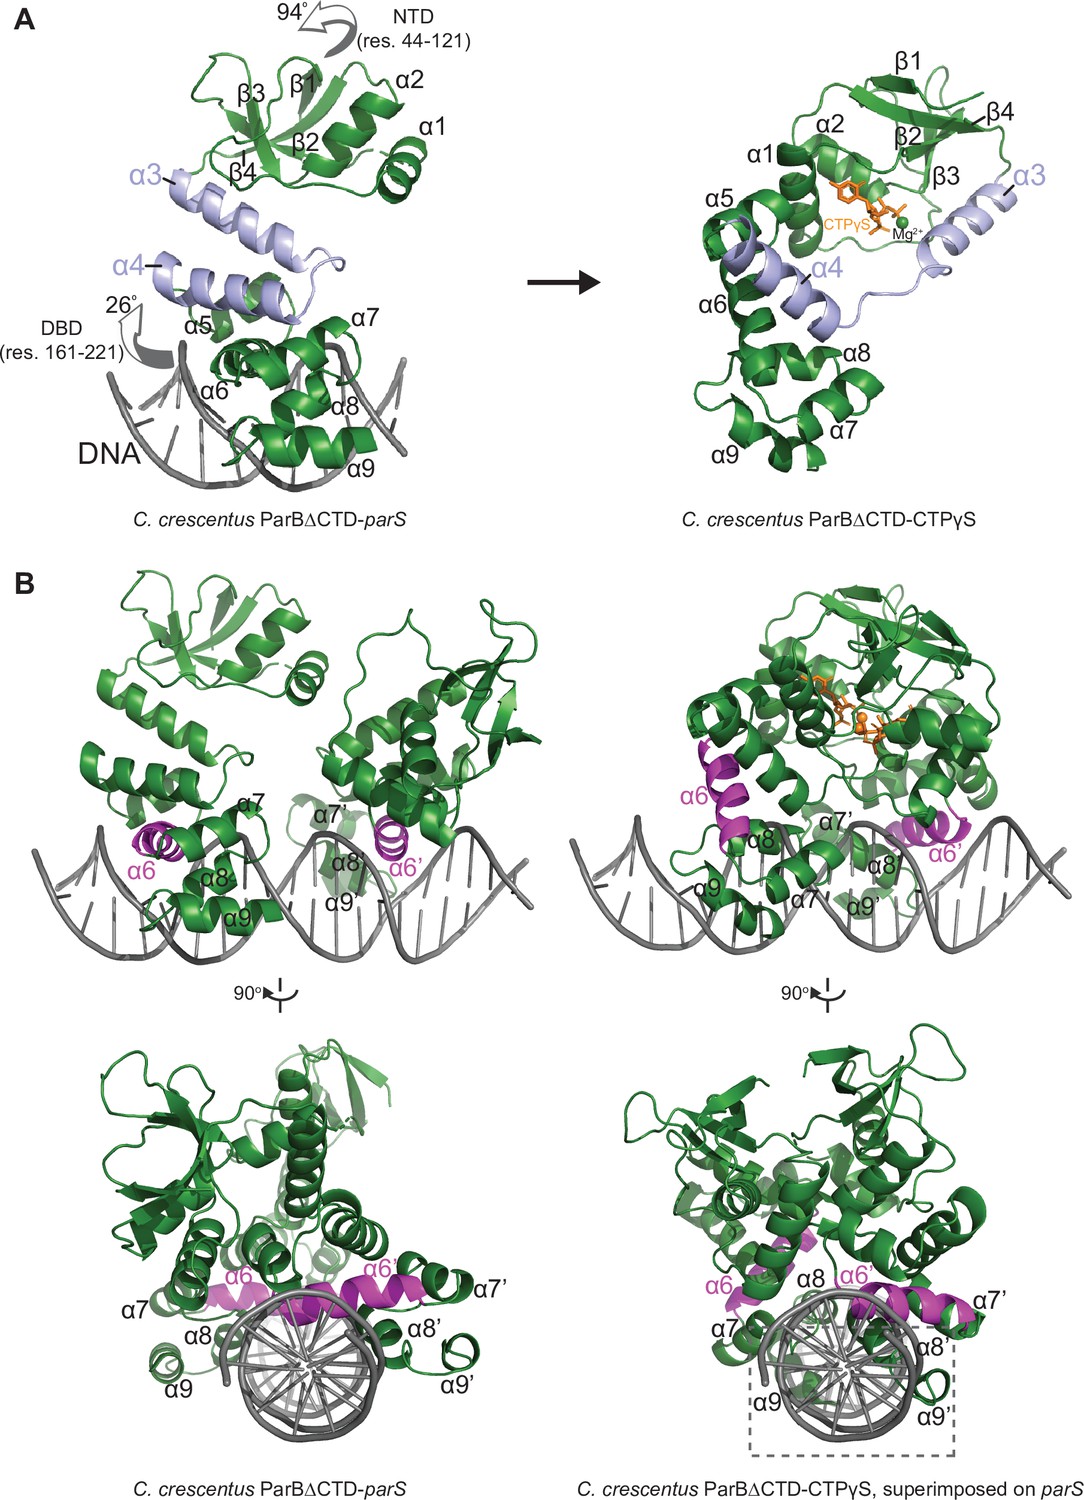
The structure of a nucleotide-bound C. crescentus ParB∆CTD is incompatible with specific parS binding at the DNA-binding domain (DBD).
(A) Structural changes between C. crescentus ParB∆CTD-parS and ParB∆CTD-CTPɣS structures. Helices α3 and α4 are shown in light blue. The arrows next to the N-terminal domain (NTD) (residues 44–121) and the DBD (residues 161–221) show the direction that these domains rotate towards in the nucleotide-bound state. (B) Superimposing the C. crescentus ParB∆CTD-CTPɣS structure onto parS DNA shows DNA-recognition helices (α6 and α6′, magenta) positioning away from the two consecutive major grooves of parS, and helices α8–α9 and α8′–α9′ at the DBD (dashed box) clashing with parS DNA.
Figure 4—figure supplement 1
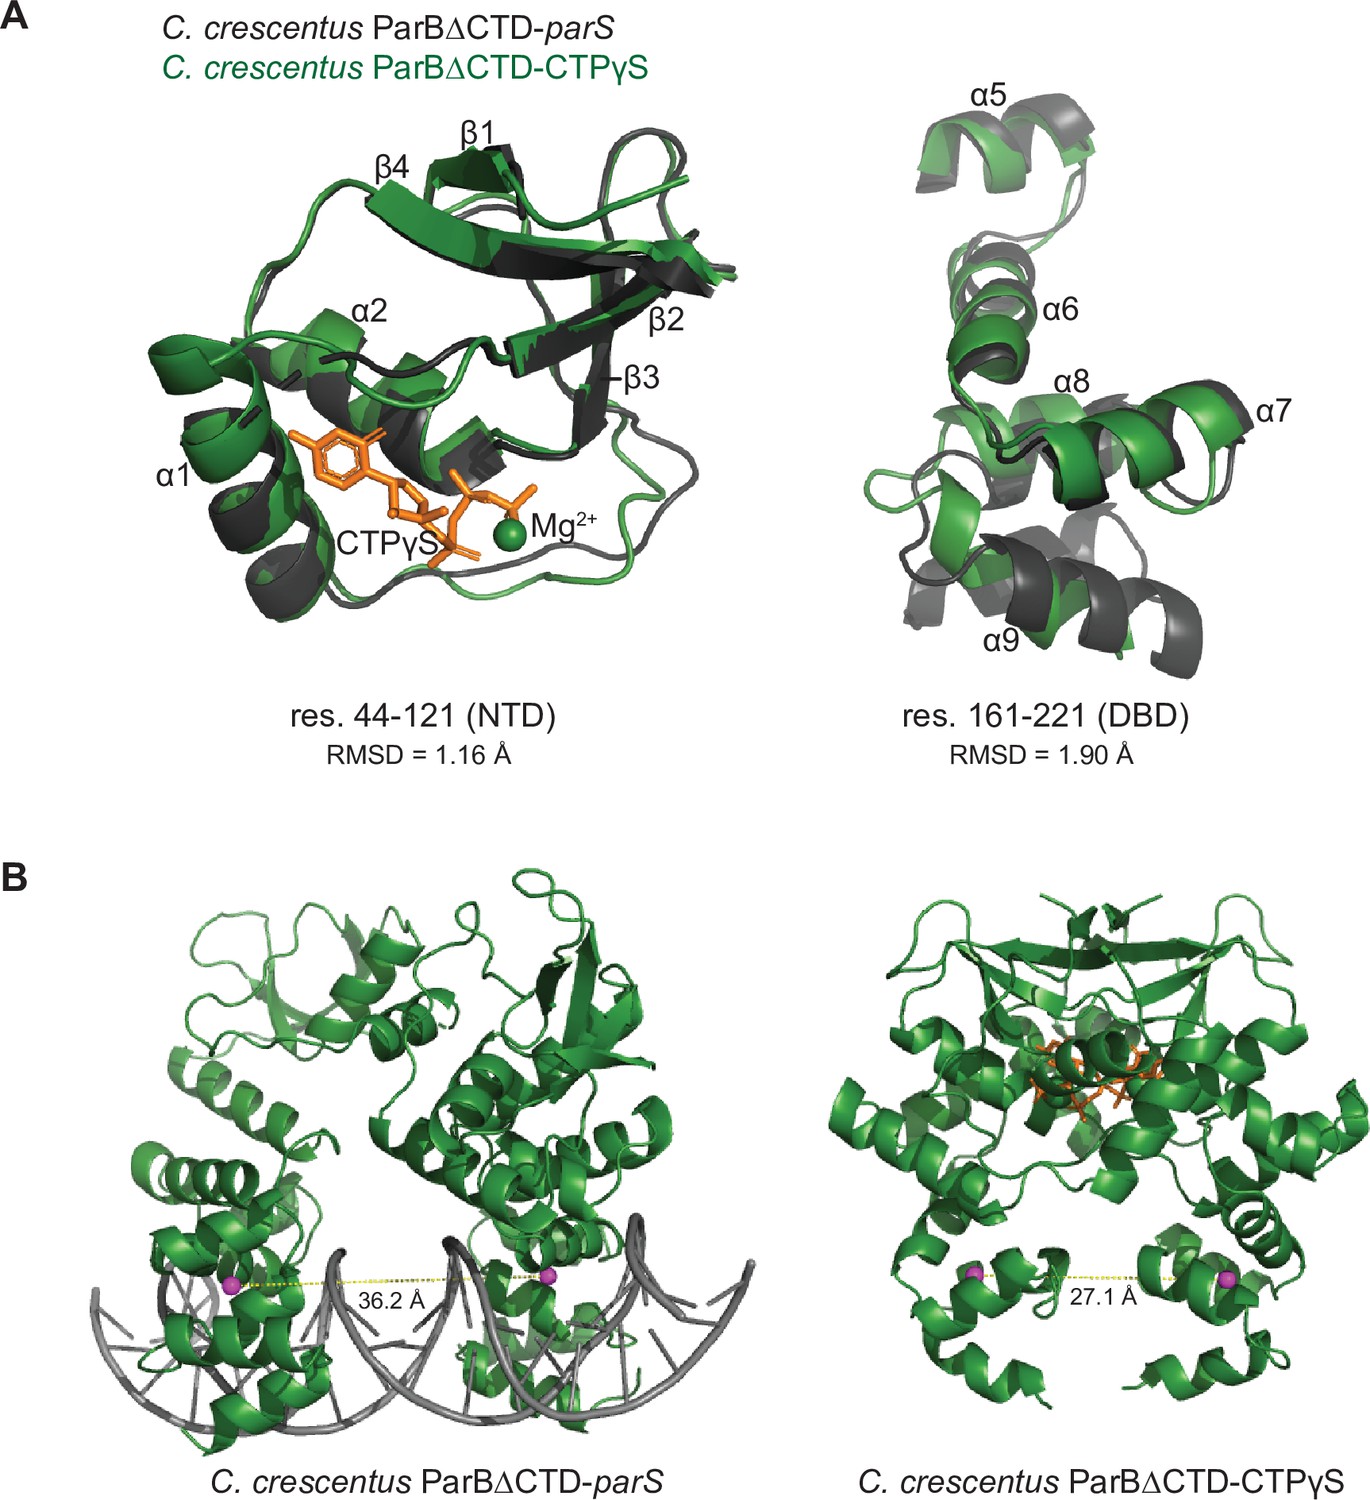
The structure of nucleotide-bound C. crescentus ParB∆CTD is incompatible with specific parS binding at the DNA-binding domain (DBD).
(A) Residues 44–121 of the N-terminal domain (NTD) and residues 161–221 of the DBD move in a near rigid-body motion between the ParB∆CTD-parS and the ParB∆CTD-CTPɣS structures. (Left panel) Structural comparison between the NTDs (residues 44–121) from the ParB∆CTD-parS structure (black) and the ParB∆CTD-CTPɣS structure (dark green). (Right panel) Structural comparison between the DBDs (residues 161–221) from the ParB∆CTD-parS structure (black) and the ParB∆CTD-CTPɣS structure (dark green). The corresponding root-mean-square deviation value (RMSD) is shown below each structural alignment. (B) The inter-domain distances between opposite DBDs in the ParB∆CTD-parS and the ParB∆CTD-CTPɣS structures. Distances (yellow dashed lines) were measured between the centroid (magenta sphere) of each DBD.
Figure 5 with 4 supplements
C. crescentus ParB entraps parS DNA in a compartment between the DNA-binding domain (DBD) and the C-terminal domain (CTD) in a cytidine triphosphate (CTP)-dependent manner.
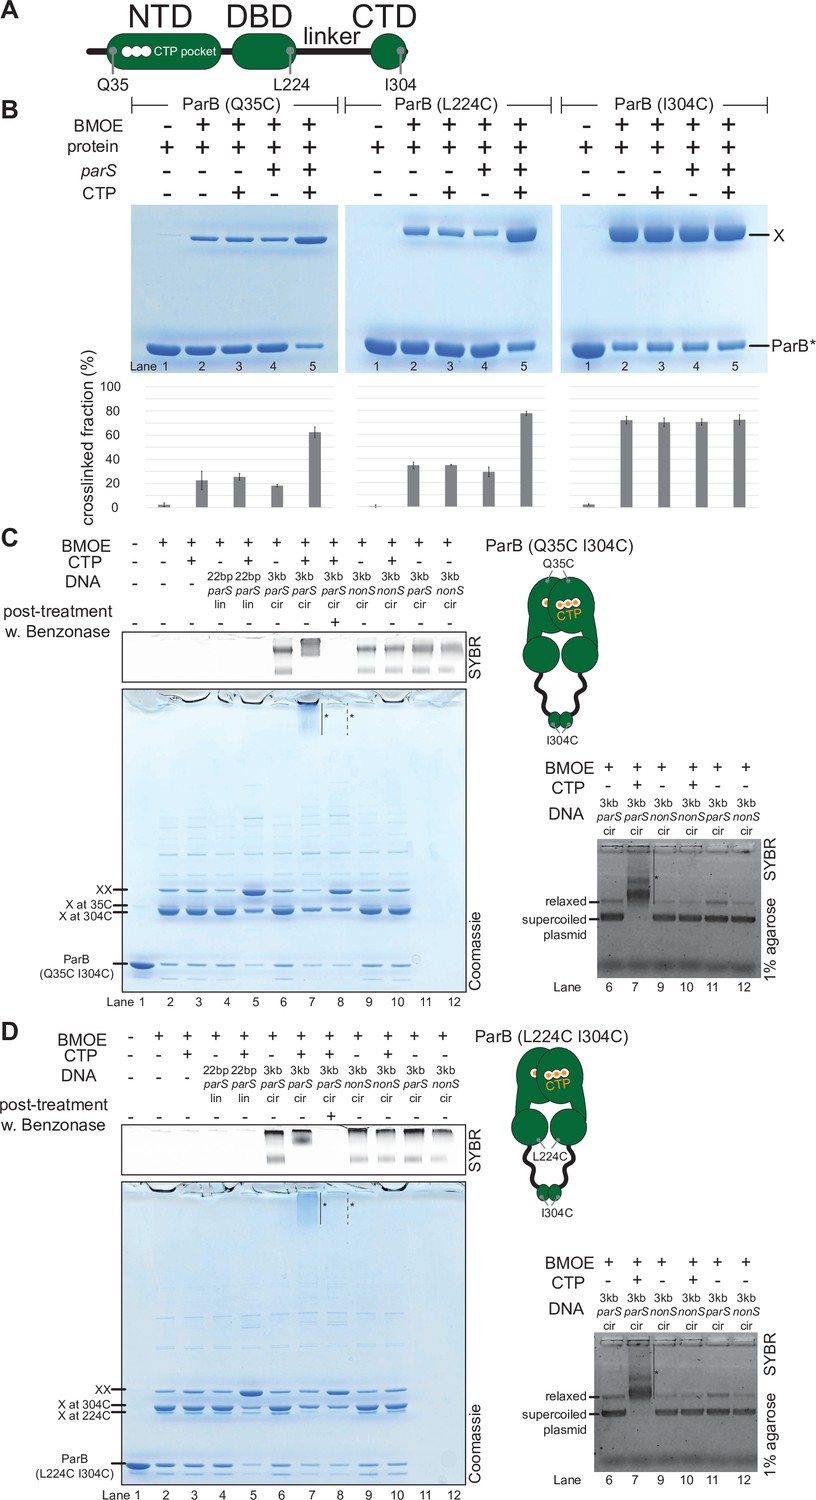
(A) A schematic diagram of C. crescentus ParB showing the position of Q35 (at the N-terminal domain [NTD]), L224 (at the DBD), and I304 (at the CTD) that were substituted either individually or in combinations for cysteine. (B) Denaturing polyacrylamide gel analysis of bismaleimidoethane (BMOE) crosslinking products of 8 µM single-cysteine ParB (Q35C/L224C/I304C) variant ±0.5 µM 22 bp parS DNA ±1 mM CTP. X indicates a crosslinked form of ParB. Quantification of the crosslinked (X) fraction is shown below each representative gel image. Error bars represent SD from three replicates. (C, left panel) Denaturing polyacrylamide gel analysis of BMOE crosslinking products of 8 µM dual-cysteine ParB (Q35C I304C) variant ±0.5 µM DNA ±1 mM CTP. Different DNA were employed in crosslinking reactions: a linear 22 bp parS DNA (22 bp parS lin), a circular 3 kb parS plasmid (3 kb parS cir), and a circular 3 kb scrambled parS plasmid (3 kb nonS cir). The high molecular weight (HMW) smear near the top of the polyacrylamide gel is marked with a solid line and an asterisk (lane 7). When the crosslinking reaction was post-treated with a non-specific DNA nuclease, Benzonase, the HMW smear was no longer observed (dashed line and asterisk, lane 8). The polyacrylamide gel was also stained with a DNA dye, Sybr Green (SYBR), and only the top section of the gel is shown. Small 22 bp parS DNA duplex migrated out of the gel, thus was not observed near the top of the Sybr-stained gel. A schematic diagram of a dual-cysteine C. crescentus ParB dimer is also shown. (Right panel) Agarose gel analysis of BMOE crosslinking products. A subset of crosslinking reactions (lanes 6, 7, and 9–12) were loaded and resolved on 1% agarose gel. The gel was subsequently stained with Sybr Green for DNA. Shifted gel bands are marked with a solid line and an asterisk. (D) Same as panel (C) but another dual-cysteine variant, ParB (L224C I304C) was employed instead.
-
Figure 5—source data 1
Original files, annotation of the full raw gels, and data used to generate Figure 5.
- https://cdn.elifesciences.org/articles/69676/elife-69676-fig5-data1-v1.zip
Figure 5—figure supplement 1
Crosslinking ParB (Q35C I304C) and ParB (L224C I304C) did not produce a high molecular weight (HMW) smear in the presence of cytidine triphosphate (CTP) and a linearized parS plasmid.
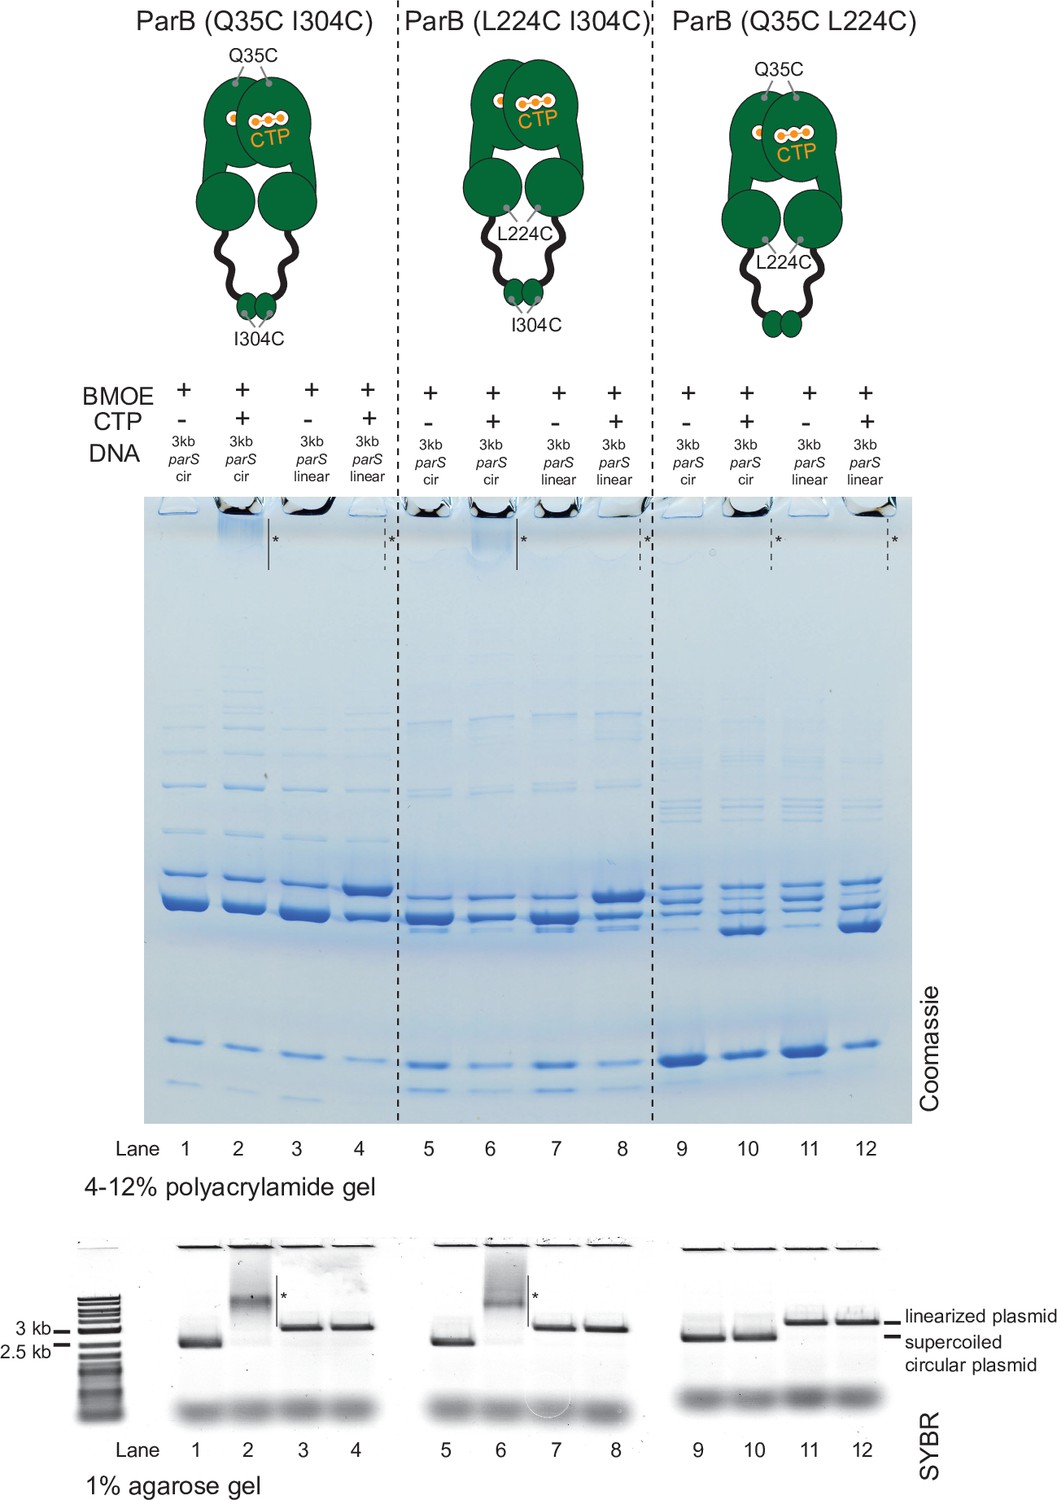
Denaturing polyacrylamide gel analysis of bismaleimidoethane (BMOE) crosslinking products of 8 µM dual-cysteine ParB variants + 0.5 µM (circular/linearized) parS-containing plasmid DNA ±1 mM CTP. Purified ParB (Q35C I304C), ParB (L224C I304C), and ParB (Q35C L224C) were used for reactions in lanes 1–4, 5–8, and 9–12, respectively. Different DNA were employed in crosslinking reactions: a circular 3 kb parS plasmid (3 kb parS cir) and a 3 kb parS plasmid that had been linearized at an unique HindIII site by HindIII restriction enzyme (3 kb parS linear). The HMW smear near the top of the polyacrylamide gel was observed when ParB (Q35C I304C) or ParB (L224C I304C) was incubated with CTP and a circular parS plasmid (lanes 2 and 6, solid lines and asterisks), but not when a linearized parS plasmid was used (lanes 4 and 8, dashed lines and asterisks) or when CTP was omitted (lanes 1 and 5). ParB (Q35C L224C) did not produce a HMW smear even in the presence of CTP and a circular parS plasmid (see also Figure 5—figure supplement 2). Crosslinking reactions were also loaded and resolved on a 1% agarose gel. The gel was subsequently stained with Sybr Green for DNA. Shifted gel bands are marked with a solid line and an asterisk.
-
Figure 5—figure supplement 1—source data 1
Original files, annotation of the full raw gels, and data used to generate Figure 5—figure supplement 1.
- https://cdn.elifesciences.org/articles/69676/elife-69676-fig5-figsupp1-data1-v1.zip
Figure 5—figure supplement 2
Crosslinking ParB (Q35C L224C) did not produce a high molecular weight (HMW) smear despite the presence of cytidine triphosphate (CTP) and a circular parS plasmid.
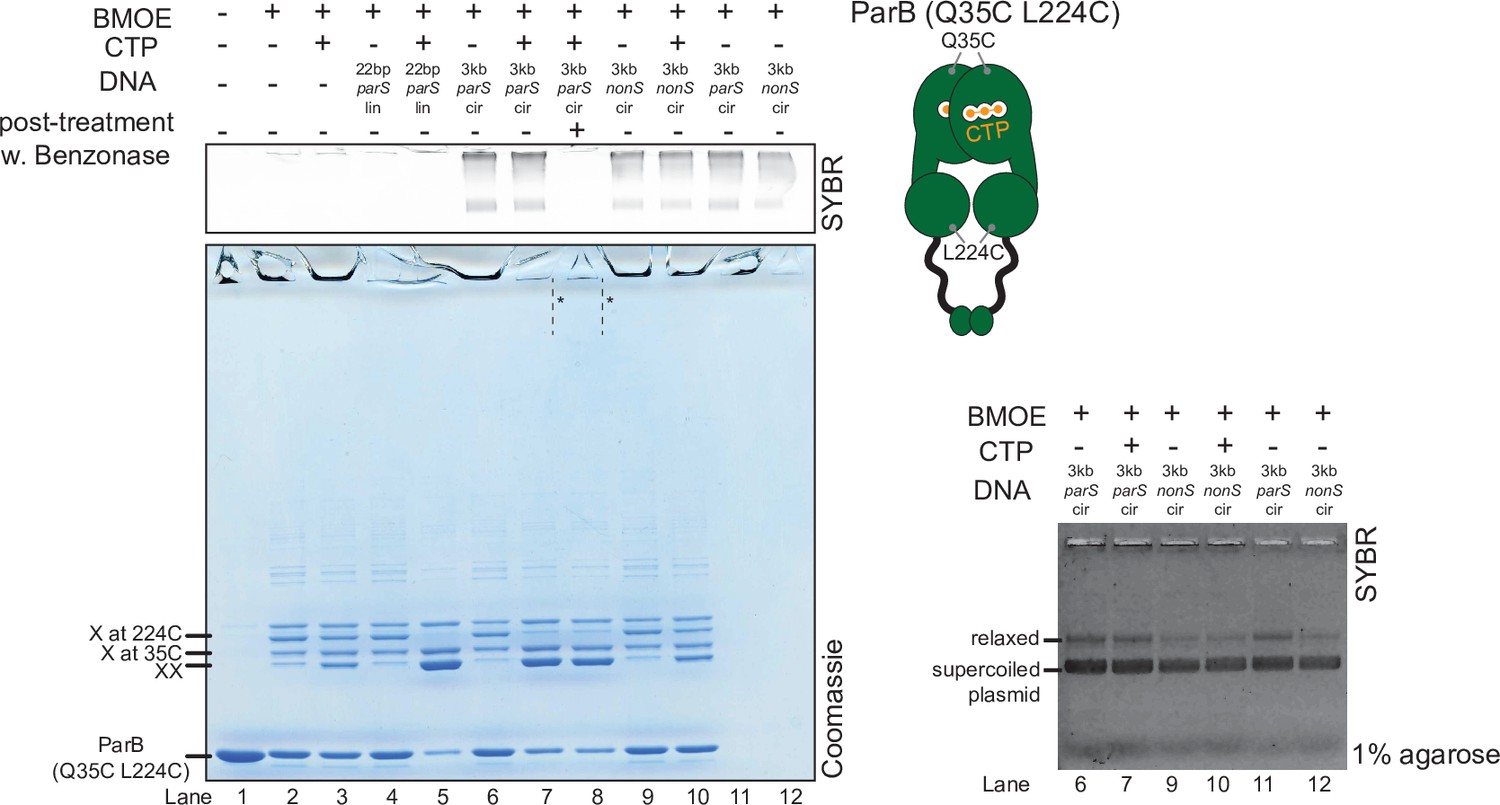
(Left panel) Denaturing polyacrylamide gel analysis of bismaleimidoethane (BMOE) crosslinking products of 8 µM dual-cysteine ParB (Q35C L224C) variant ±0.5 µM DNA ±1 mM CTP. Different DNA were employed in crosslinking reactions: a linear 22 bp parS DNA (22 bp parS lin), a circular 3 kb parS plasmid (3 kb parS cir), and a circular 3 kb scrambled parS plasmid (3 kb nonS cir). The HMW smear near the top of the polyacrylamide gel was not observed, with or without a Benzonase post-treatment (dashed lines and asterisks, lanes 7 and 8). The polyacrylamide gel was also stained with a DNA-dye, Sybr Green (SYBR), and only the top section of the gel is shown. Small 22 bp parS DNA duplex migrated out of the gel, thus was not observed near the top of the Sybr-stained gel. A schematic diagram of a dual-cysteine C. crescentus ParB dimer is also shown. (Right panel) Agarose gel analysis of BMOE crosslinking products. A subset of crosslinking reactions (lanes 6, 7, and 9–12) were loaded and resolved on 1% agarose gel. The gel was subsequently stained with Sybr Green for DNA. Shifted gel bands are marked with a solid line and an asterisk.
-
Figure 5—figure supplement 2—source data 1
Original files, annotation of the full raw gels, and data used to generate Figure 5—figure supplement 2.
- https://cdn.elifesciences.org/articles/69676/elife-69676-fig5-figsupp2-data1-v1.zip
Figure 5—figure supplement 3
The high molecular weight (HMW) smear likely contains catenates between crosslinked ParB dimers and circular parS plasmids.
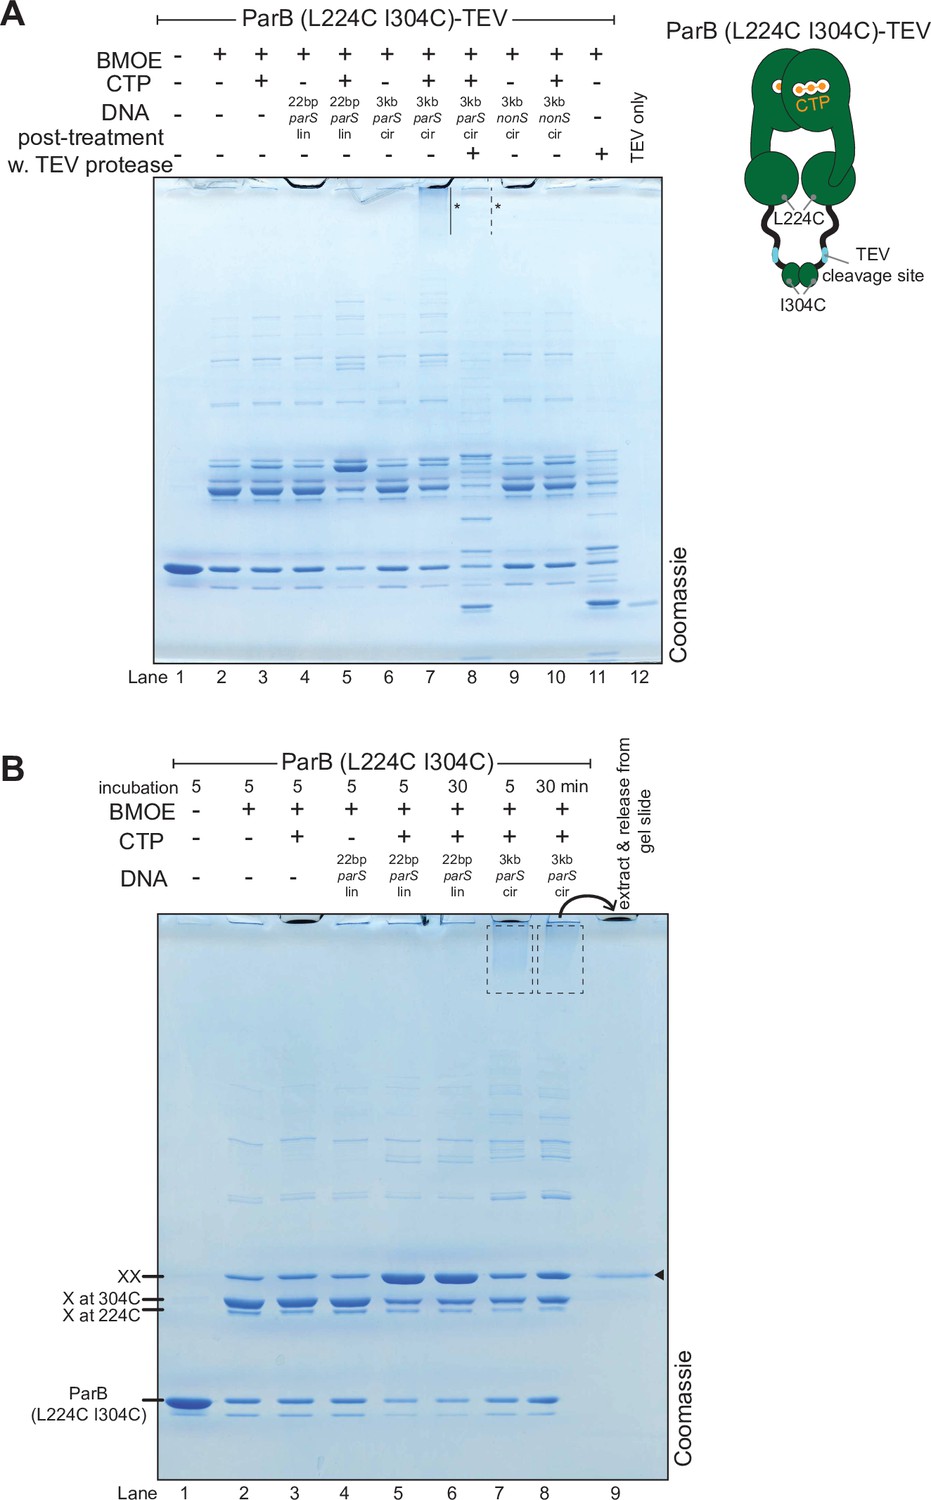
(A) A post-crosslinking treatment of a ParB (L224C I304C)-TEV variant with TEV protease eliminated the HMW smear. A dual-cysteine ParB variant was engineered with a TEV protease cleavage site in the DNA-binding domain–C-terminal domain (DBD-CTD) linker (see the schematic diagram). This ParB (L224C I304C)-TEV variant was purified and used in a bismaleimidoethane (BMOE) crosslinking reactions in the presence or absence of 1 mM cytidine triphosphate (CTP) and 0.5 µM DNA. Different DNA were employed in crosslinking reactions: a linear 22 bp parS DNA (22 bp parS lin), a circular 3 kb parS plasmid (3 kb parS cir), and a circular 3 kb scrambled parS plasmid (3 kb nonS cir). In contrast to lane 7, the HMW smear near the top of the polyacrylamide gel was no longer observed when TEV was added after the crosslinking reactions was quenched (lane 8, dashed line and asterisk). (B) Double-crosslinked ParB (L224C I304C) dimer is the major protein species in the HMW smear. Gel slices encompassing the HMW smear were crushed and soaked in a Benzonase-supplemented buffer to release bound proteins. The released protein was analyzed on a denaturing polyacrylamide gel (lane 9). The solid arrow indicates the position of a double-crosslinked ParB (L224C I304C).
-
Figure 5—figure supplement 3—source data 1
Original files, annotation of the full raw gels, and data used to generate Figure 5—figure supplement 3.
- https://cdn.elifesciences.org/articles/69676/elife-69676-fig5-figsupp3-data1-v1.zip
Figure 5—figure supplement 4
A premature closing of ParB clamps prevents their interactions with a 170 bp closed parS DNA substrate.
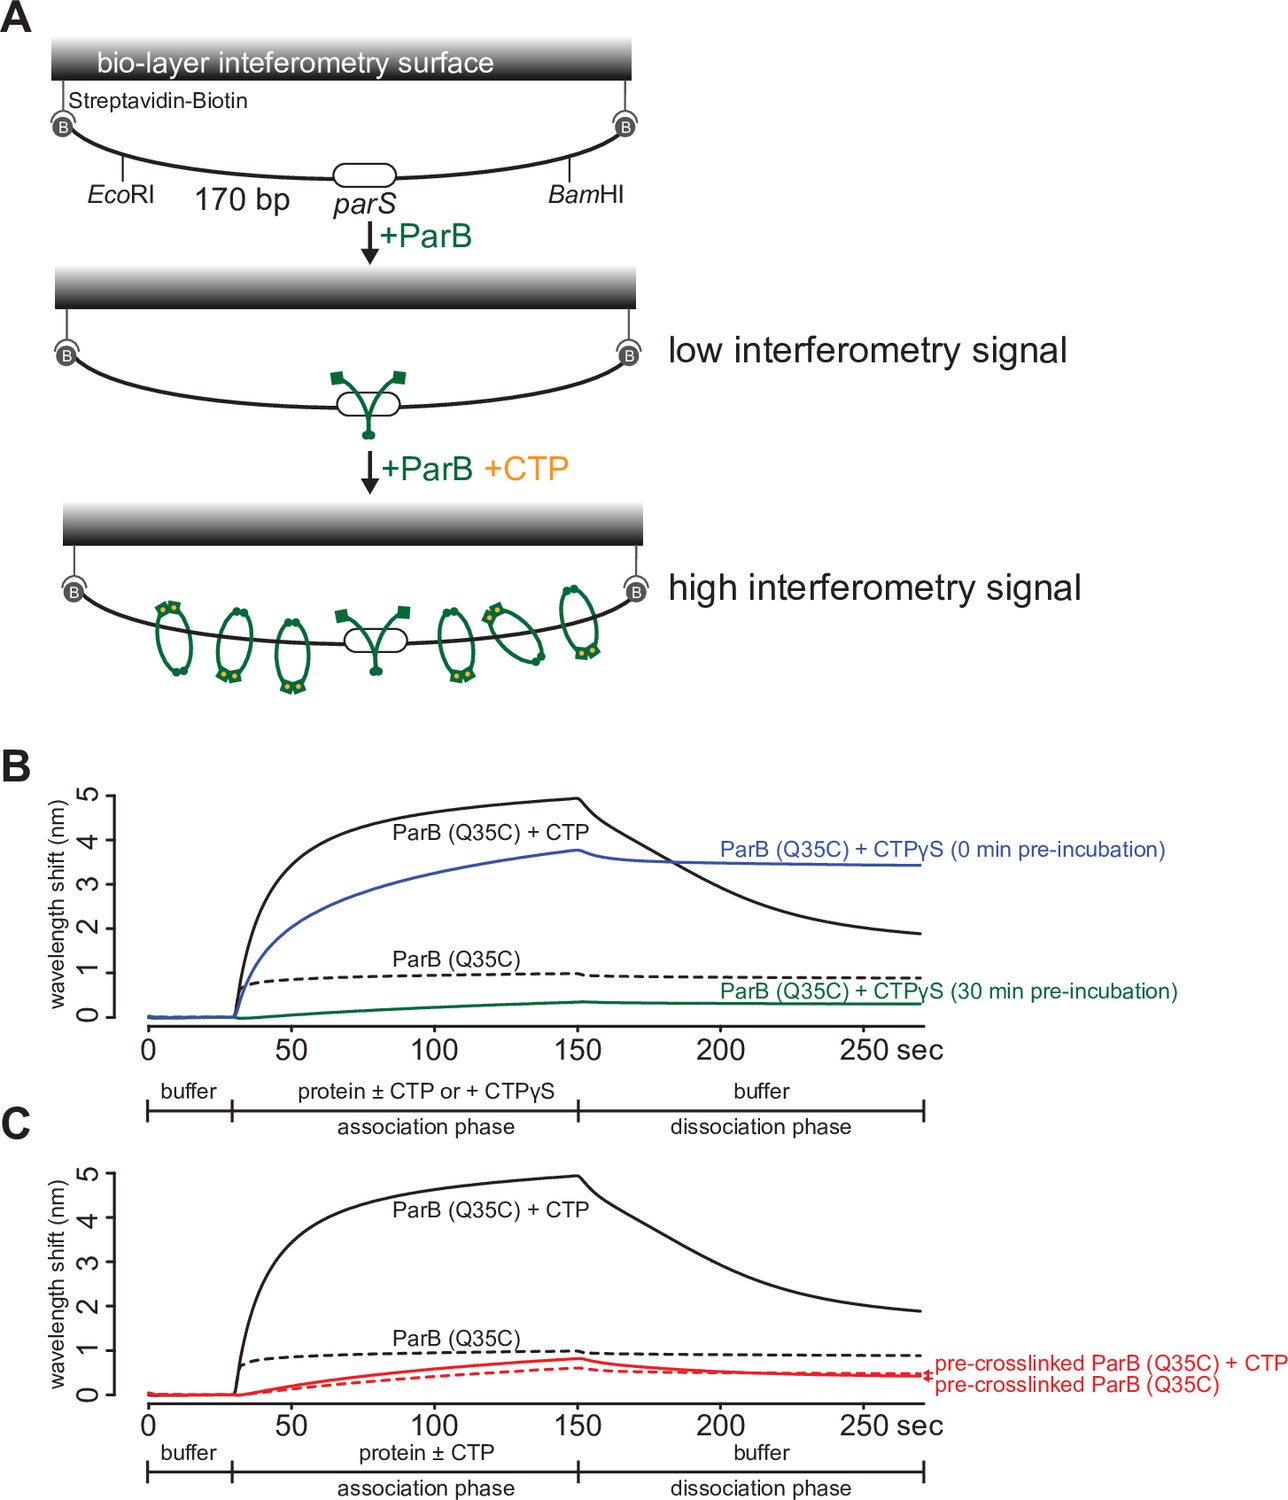
(A) A schematic diagram of the biolayer interferometry (BLI) assay. A dual biotin-labeled 170 bp parS DNA was tethered to the streptavidin (SA)-coated probe to create a DNA substrate where both ends were blocked (a closed DNA substrate). BLI assay monitors wavelength shifts (nm) resulting from changes in the optical thickness of the sensor surface during association or dissociation of the analyte. In the absence of cytidine triphosphate (CTP), ParB (green) nucleates at parS only. In the presence of CTP (orange), ParB slides on and entraps DNA to accumulate on the closed DNA substrate, thus giving rise to an elevated BLI response. (B) A prolonged (30 min) pre-incubation of ParB (Q35C) with CTPɣS eliminated most of the ParB binding and accumulation on DNA. It was shown previously that CTPɣS, in the absence of parS DNA, gradually converted apo-ParB from an open to a closed protein clamp (Jalal et al., 2020c; Soh et al., 2019). If not already bound on DNA, the now inaccessible DNA-binding domain of ParB cannot bind parS to nucleate and to subsequently slide to accumulate on DNA. (C) An irreversible closing of ParB clamps, by bismaleimidoethane (BMOE)-mediated crosslinking a closed form of ParB (Q35C), also eliminated most of the ParB binding and accumulation on DNA. Before BLI experiment, purified ParB (Q35C) was incubated with CTPɣS for 30 min, then 1 mM BMOE was added to crosslink the N-terminal domains (NTDs) of ParB (Q35C) together. The crosslinking reaction was quenched with 1 mM DTT and ParB (Q35C) was purified away from excess BMOE and DTT using a Zeba buffer exchange column (see Materials and methods). Approximately 70% ParB (Q35C) was in a crosslinked form (Jalal et al., 2020c). CTPɣS was required to convert apo-ParB (Q35C) to a closed clamp form before crosslinking. Without CTPɣS, most apo-ParB (Q35C) is in an open clamp form (Jalal et al., 2020c). For all BLI reactions in this figure, 5 µM of ParB (Q35C) and 1 mM CTP/CTPɣS were used. Each BLI experiment was triplicated and a representative sensorgram is presented.
-
Figure 5—figure supplement 4—source data 1
Data used to generate Figure 5—figure supplement 4.
- https://cdn.elifesciences.org/articles/69676/elife-69676-fig5-figsupp4-data1-v1.zip
Figure 6 with 2 supplements
Alanine scanning mutagenesis of the C. crescentus ParB cytidine triphosphate (CTP)-binding pocket reveals several classes of clamp mutants.
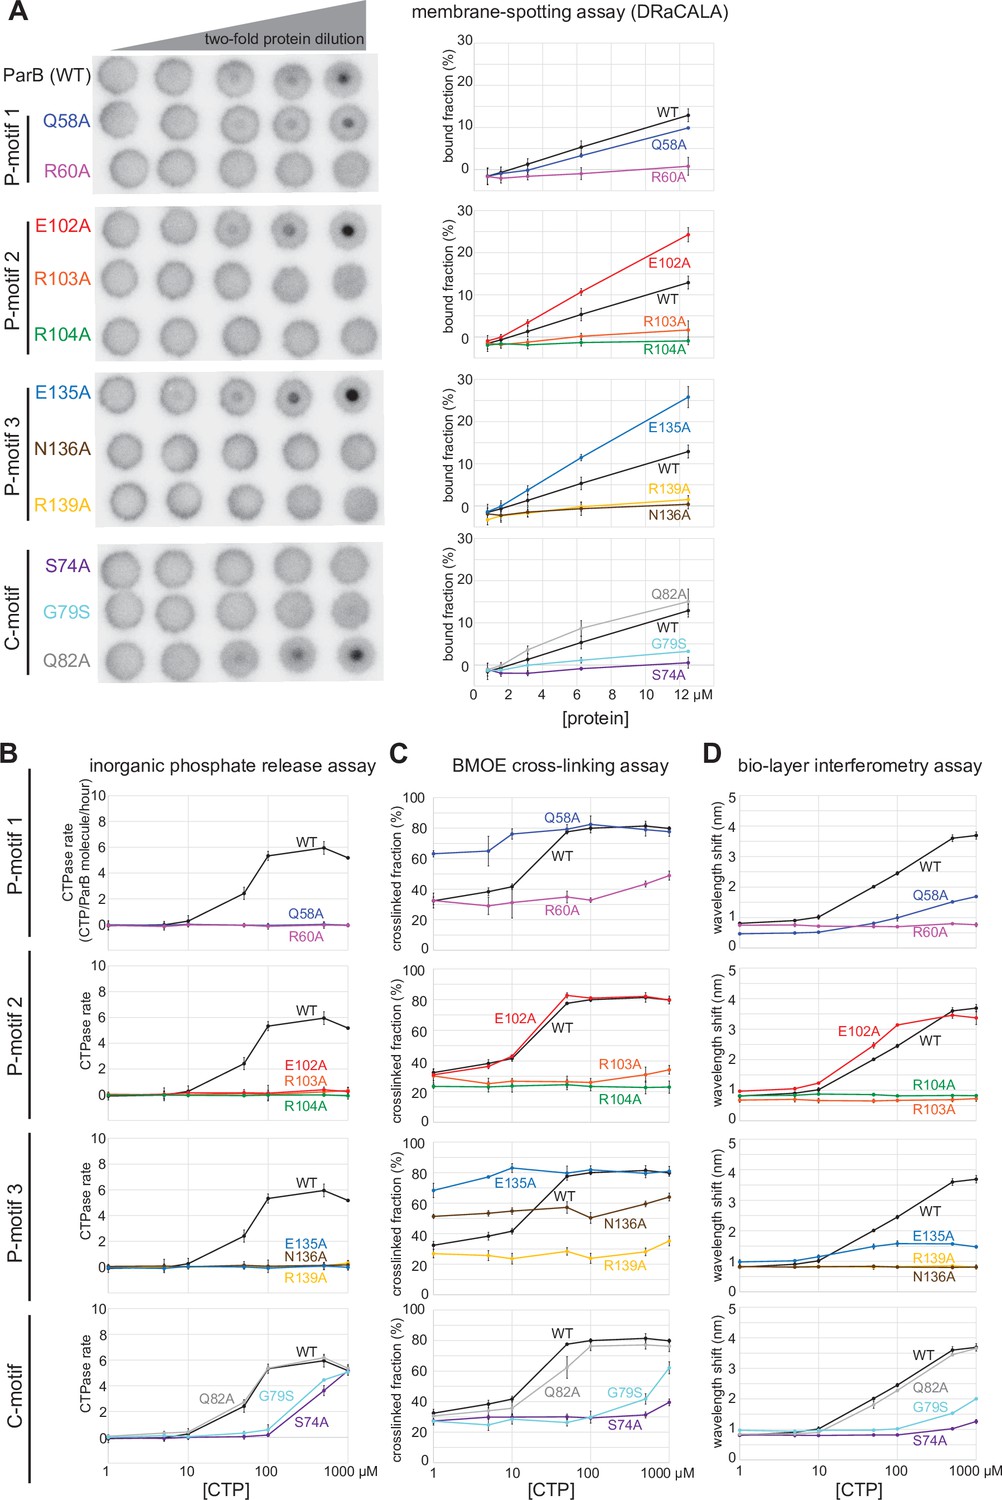
Eleven residues at C-motif and P-motifs 1–3 were individually substituted for alanine or glycine. (A) Membrane-spotting assay of ParB variants. CTP binding was monitored by membrane-spotting assay using radiolabeled CTP α-P32. The bulls-eye staining indicates CTP binding due to a more rapid immobilization of protein-ligand complexes compared to free ligands. All reactions contained various concentration of purified ParB, 5 nM radiolabeled CTP α-P32, 30 µM unlabeled CTP, and 1.5 µM 22 bp parS DNA. The bound fractions were quantified, and error bars represent SD from three replicates. All the reactions were spotted on the same membrane, the radiograph was rearranged solely for presentation purposes. (B) Inorganic phosphate release assay of ParB variants. The CTPase rates were measured at increasing concentration of CTP. All reactions contained 1 µM purified ParB variant, 0.5 µM 22 bp parS DNA, and an increasing concentration of CTP. (C) Bismaleimidoethane (BMOE) crosslinking assay of ParB variants. A second set of alanine scanning ParB variants, which harbor an additional Q35C substitution at the N-terminal domain (NTD), were also constructed and subsequently used in BMOE crosslinking experiments. Purified ParB variants (8 µM) were preincubated with 0.5 µM 22 bp parS DNA and an increasing concentration of CTP for 5 min before BMOE was added. Crosslinking products were resolved on a 12% denaturing polyacrylamide gel and the crosslinked fractions were quantified (see also Figure 6—figure supplement 1 for representation images). Error bars represent SD from three replicates. (D) Biolayer interferometry (BLI) assay of ParB variants. BLI analysis of the interaction between a premix of 1 µM ParB variant ± an increasing concentration of CTP and a 170 bp closed parS DNA substrate. See also Figure 5—figure supplement 4A for a schematic diagram of the BLI setup and Figure 6—figure supplement 2 for representative BLI sensorgrams. BLI signal at the end of the association phase (± SD from three replicates) was plotted against CTP concentrations.
-
Figure 6—source data 1
Original files, annotation of the full raw gels, and data used to generate Figure 6.
- https://cdn.elifesciences.org/articles/69676/elife-69676-fig6-data1-v1.zip
Figure 6—figure supplement 1
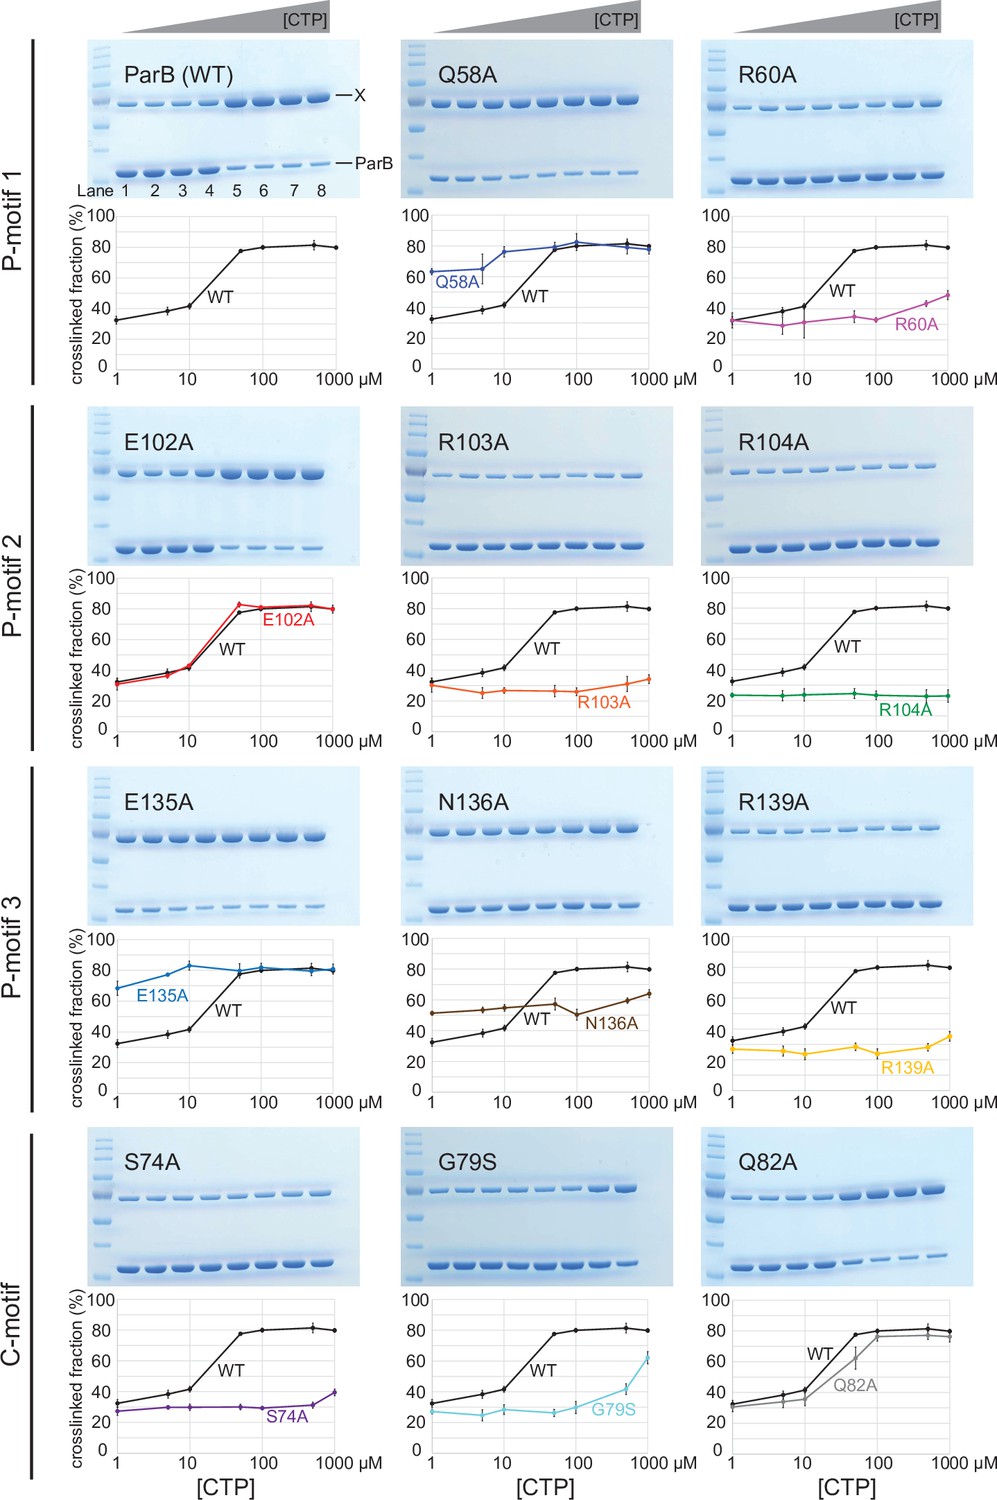
Denaturing polyacrylamide gel analysis of crosslinking products of alanine scanning ParB variants.
Purified ParB variants (8 µM) were preincubated with 0.5 µM 22 bp parS DNA, and an increasing concentration of cytidine triphosphate (CTP) for 5 min before bismaleimidoethane (BMOE) was added. Crosslinking products were resolved on a 12% denaturing polyacrylamide gel and the crosslinked fractions (X) were quantified. Error bars represent SD from three replicates.
-
Figure 6—figure supplement 1—source data 1
Original files, annotation of the full raw gels, and data used to generate Figure 6—figure supplement 1.
- https://cdn.elifesciences.org/articles/69676/elife-69676-fig6-figsupp1-data1-v1.zip
Figure 6—figure supplement 2
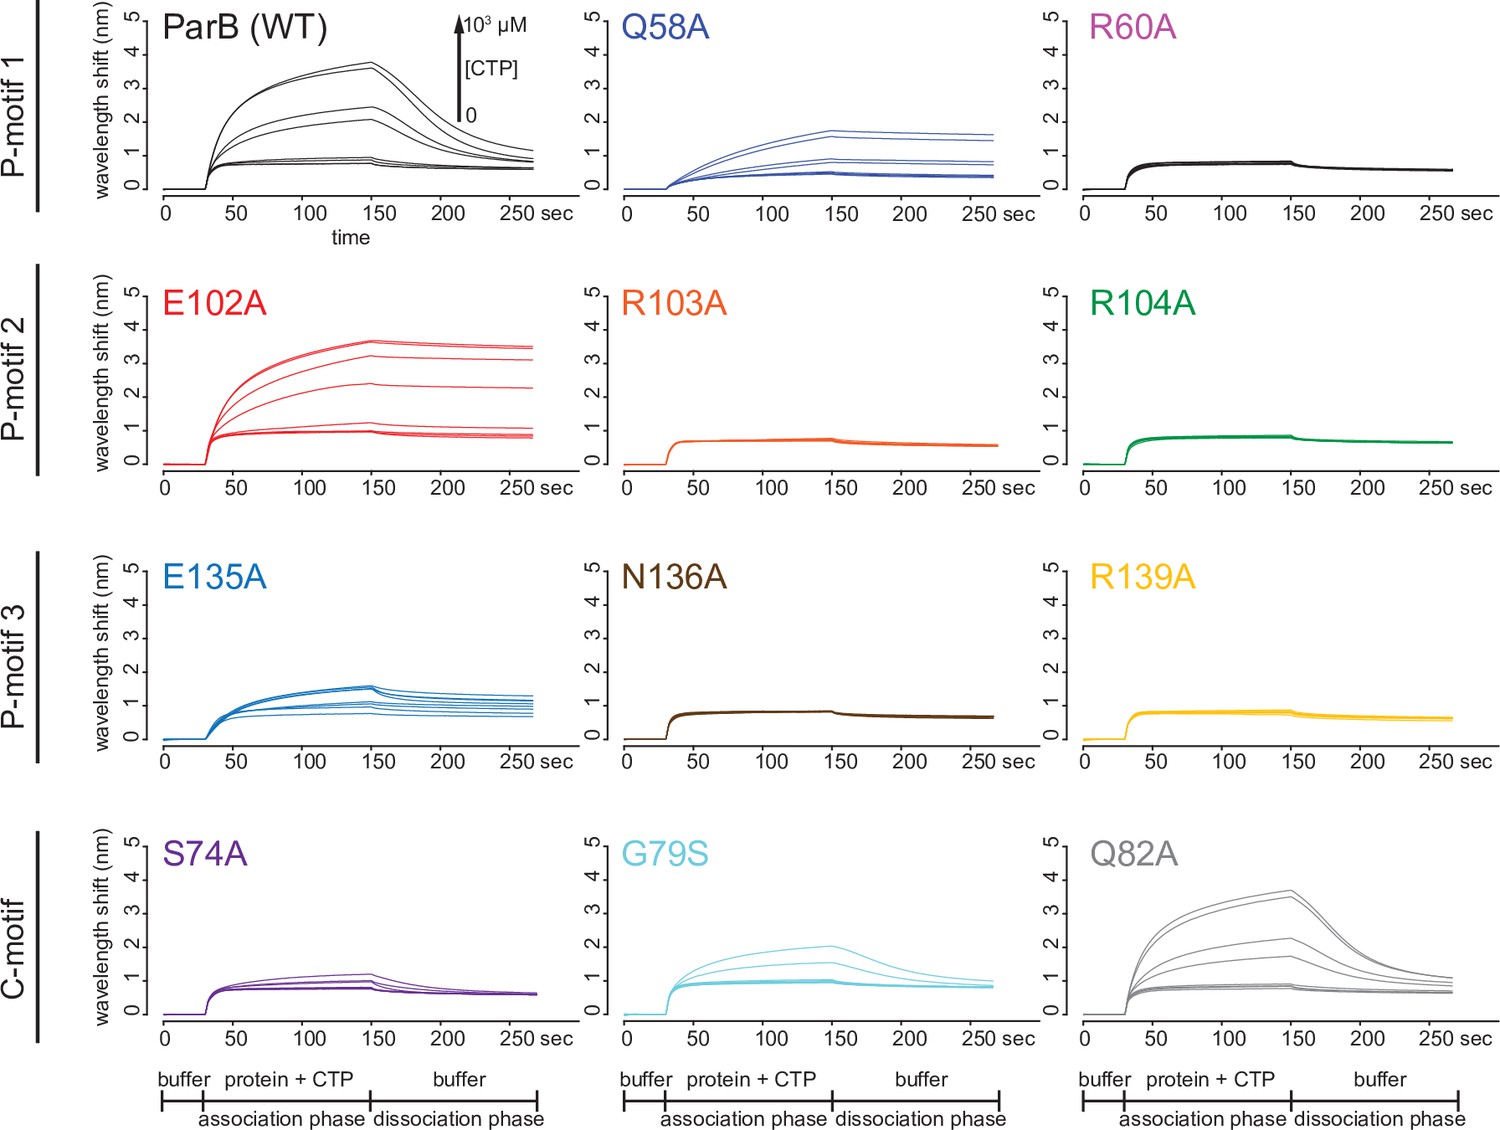
Biolayer interferometry (BLI) analysis of the interaction between ParB variants and a 170 bp closed parS DNA substrate.
Representative BLI sensorgrams of the interactions between ParB variants and the closed DNA substrate in the presence of an increasing concentration of cytidine triphosphate (CTP). The BLI probe with tethered parS DNA substrate was dipped into a buffer-only solution (0–30 s), then to a premix of 1 µM ParB ± an increasing concentration of CTP (30–150 s: association phase), and finally returned to a buffer-only solution (150–270 s: dissociation phase). Each BLI experiment was triplicated and a representative sensorgram is presented.
-
Figure 6—figure supplement 2—source data 1
Data used to generate Figure 6—figure supplement 2.
- https://cdn.elifesciences.org/articles/69676/elife-69676-fig6-figsupp2-data1-v1.zip
Figure 7
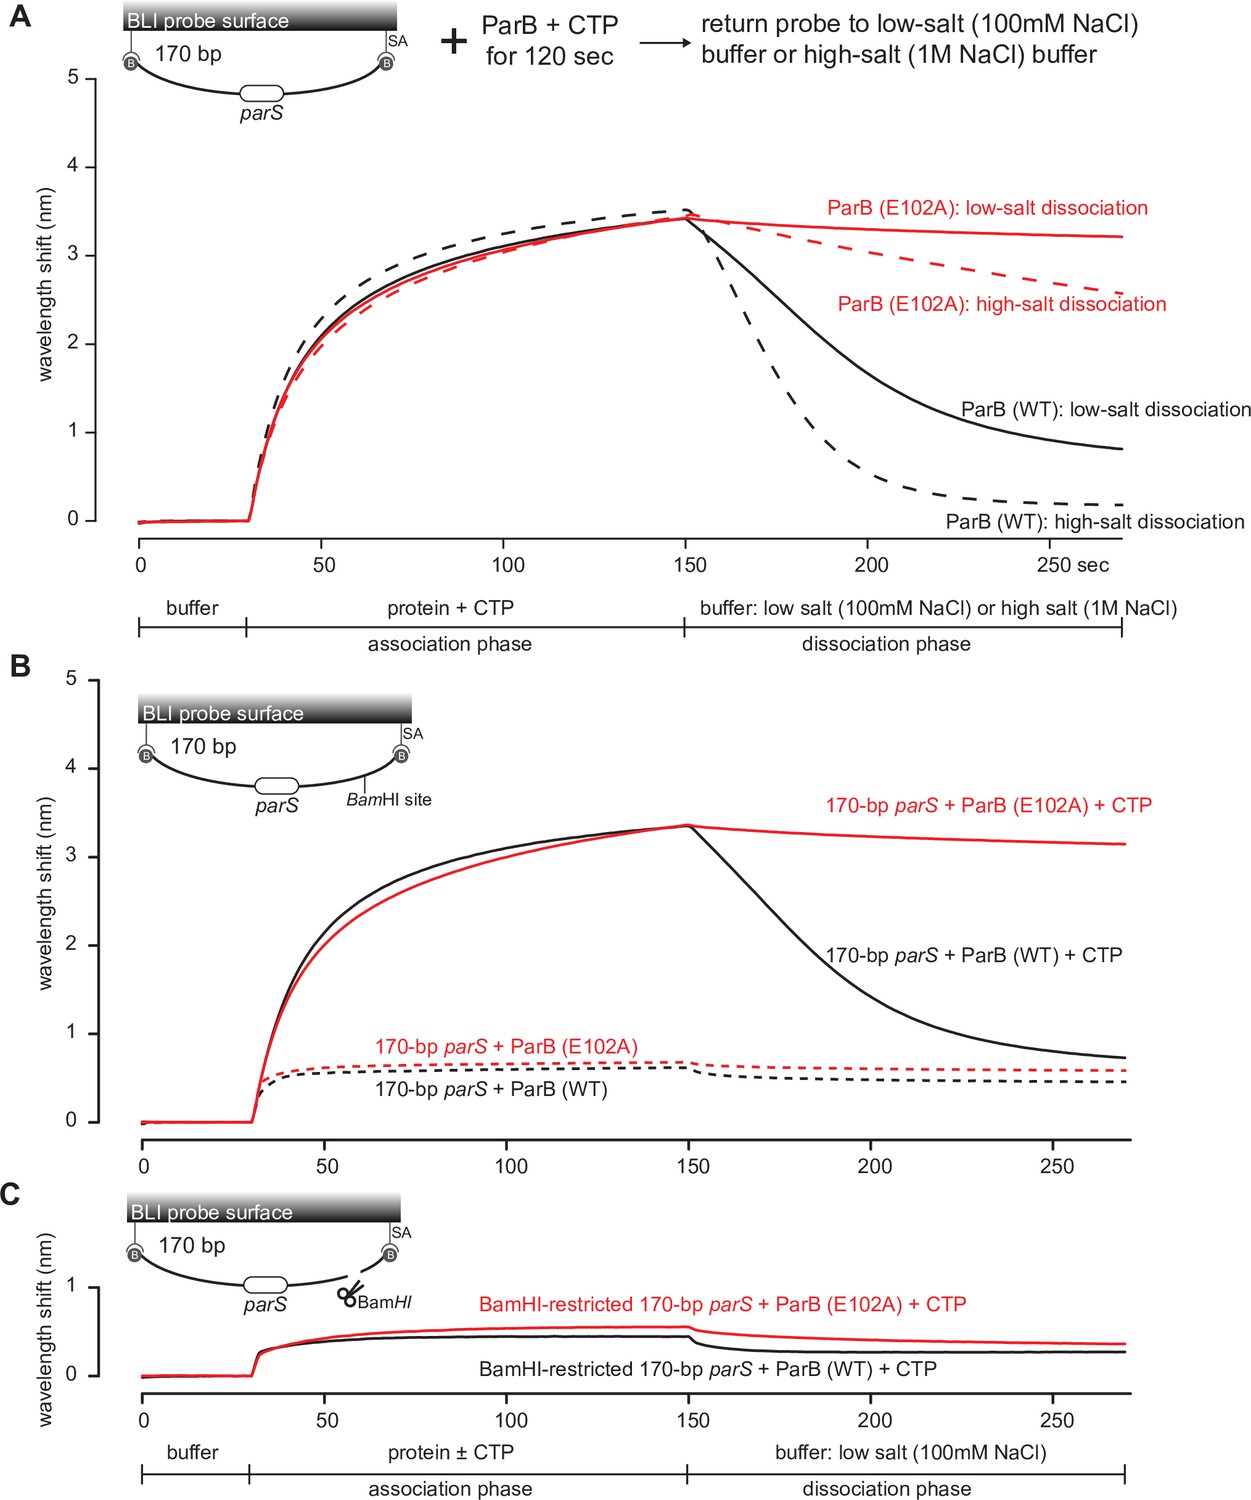
The DNA-entrapped ParB (E102A)-CTP clamp is resistant to high-salt conditions.
(A) Biolayer interferometry (BLI) analysis of the interaction between a premix of 1 µM C. crescentus ParB (WT) or ParB (E102A) + 1 mM cytidine triphosphate (CTP) and 170 bp dual biotin-labeled parS DNA. For the dissociation phase, the probe was returned to a low-salt buffer that contains 100 mM NaCl (solid black or red lines) or to a high-salt buffer that contains 1 M NaCl (dashed black or red lines). The schematic diagram of the BLI probe shows a closed parS DNA substrate due to the interactions between a dual biotin-labeled DNA and the streptavidin (SA)-coated probe surface. (B) BLI analysis of the interaction between a premix of 1 µM C. crescentus ParB (WT) or ParB (E102A) + 1 mM CTP (solid lines) or –1 mM CTP (dashed lines) and 170 bp dual biotin-labeled parS DNA. (C) Same as panel (B) but immobilized DNA fragments have been restricted with BamHI before BLI analysis.
-
Figure 7—source data 1
Data used to generate Figure 7.
- https://cdn.elifesciences.org/articles/69676/elife-69676-fig7-data1-v1.zip
Figure 8 with 3 supplements
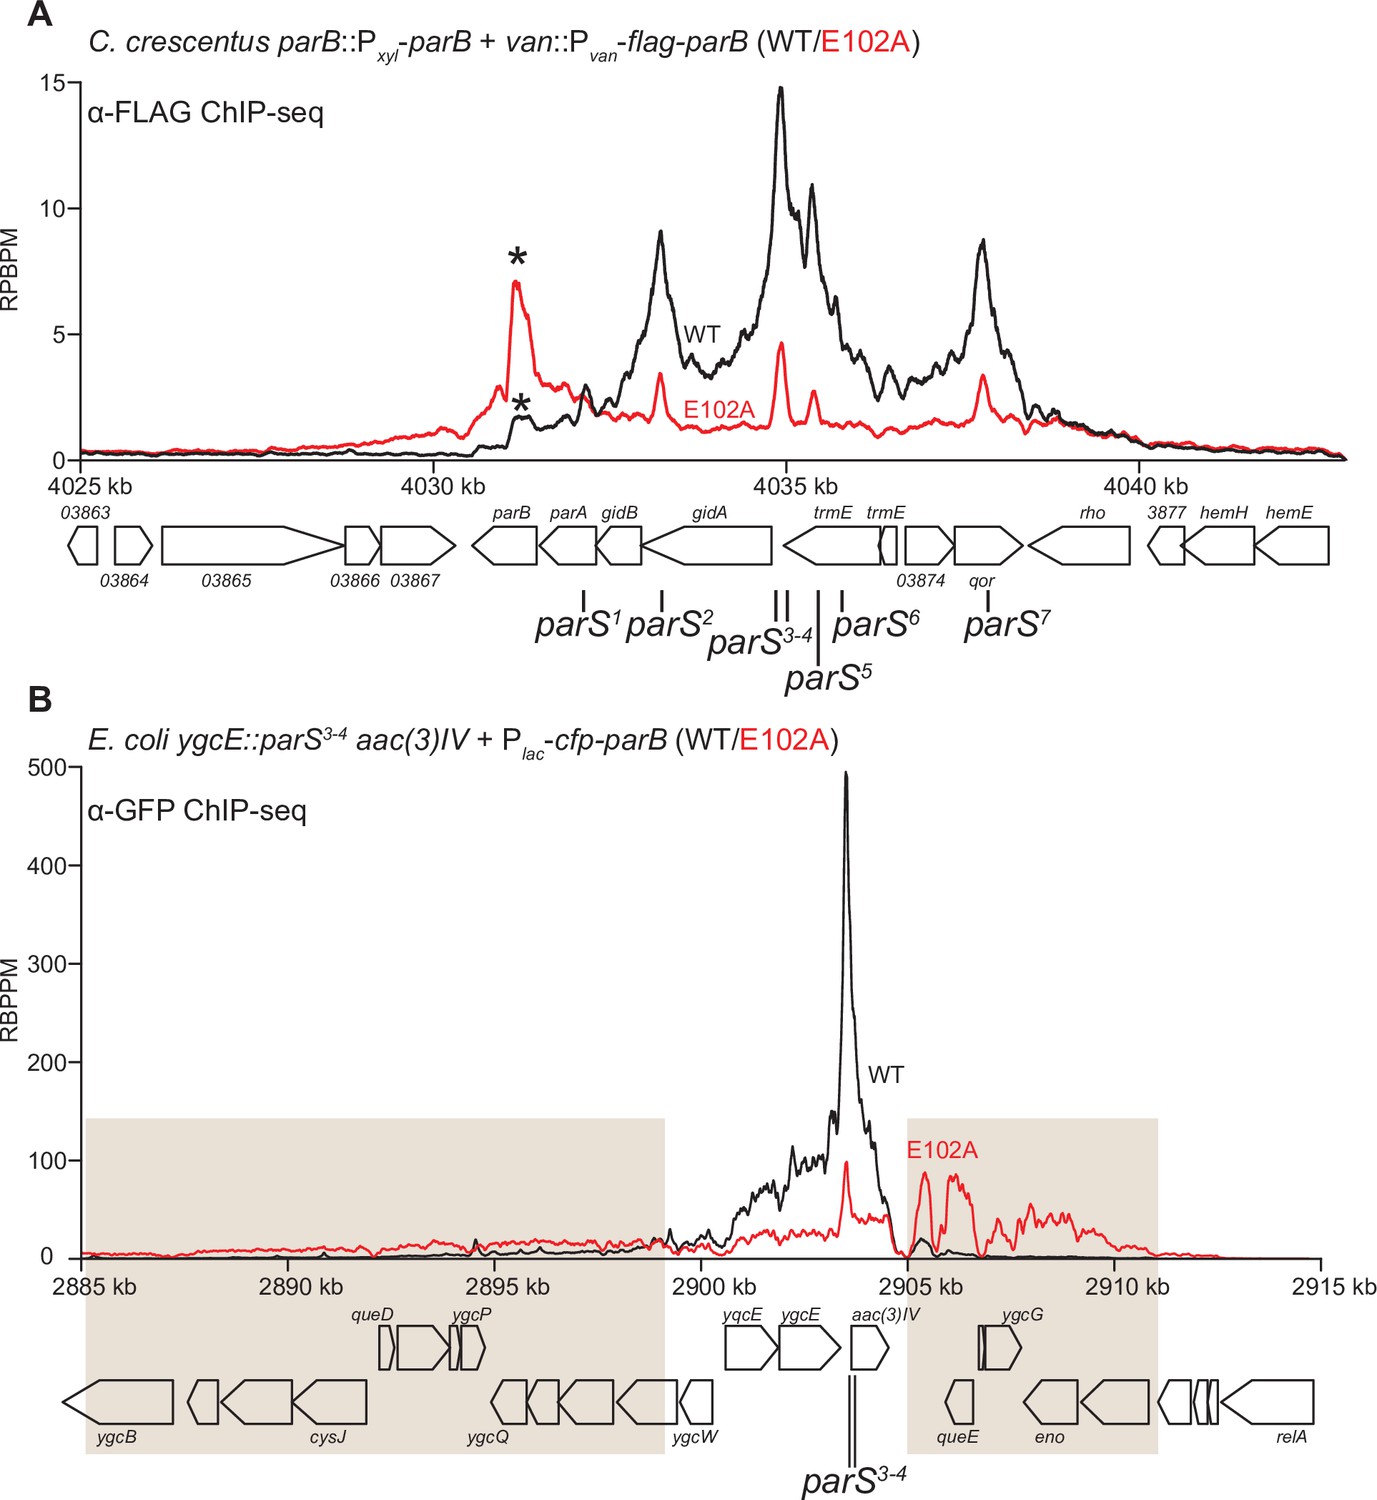
ParB (E102A) occupies a more extended DNA region surrounding parS sites than ParB (WT) in a heterologous host (E. coli) but not in the native host (C. crescentus).
(A) ChIP-seq showed the distribution of FLAG-tagged ParB (WT) (black) and FLAG-ParB (E102A) (red) on C. crescentus chromosome between +4025 kb and +4042 kb. Underlying genes and parS sites are also shown below ChIP-seq profiles. An asterisk (*) indicates an extra peak over the parB coding sequence in the profile of FLAG-ParB (E102A). ChIP-seq signals were reported as the number of reads per base pair per million mapped reads (RPBPM). (B) ChIP-seq showed the distribution of CFP-tagged ParB (WT) (black) and CFP-ParB (E102A) (red) on an E. coli chromosome between +2885 kb and +2915 kb. C. crescentus parS sites 3 and 4 were engineered onto the E. coli chromosome at the ygcE locus. CFP-tagged ParB (WT/E102A) was expressed from a leaky lactose promoter (Plac, no IPTG was added) on a medium-copy-number plasmid. Shaded boxes show areas with more enrichment in the ChIP-seq profile of CFP-ParB (E102A) compared to that of CFP-ParB (WT).
Figure 8—figure supplement 1
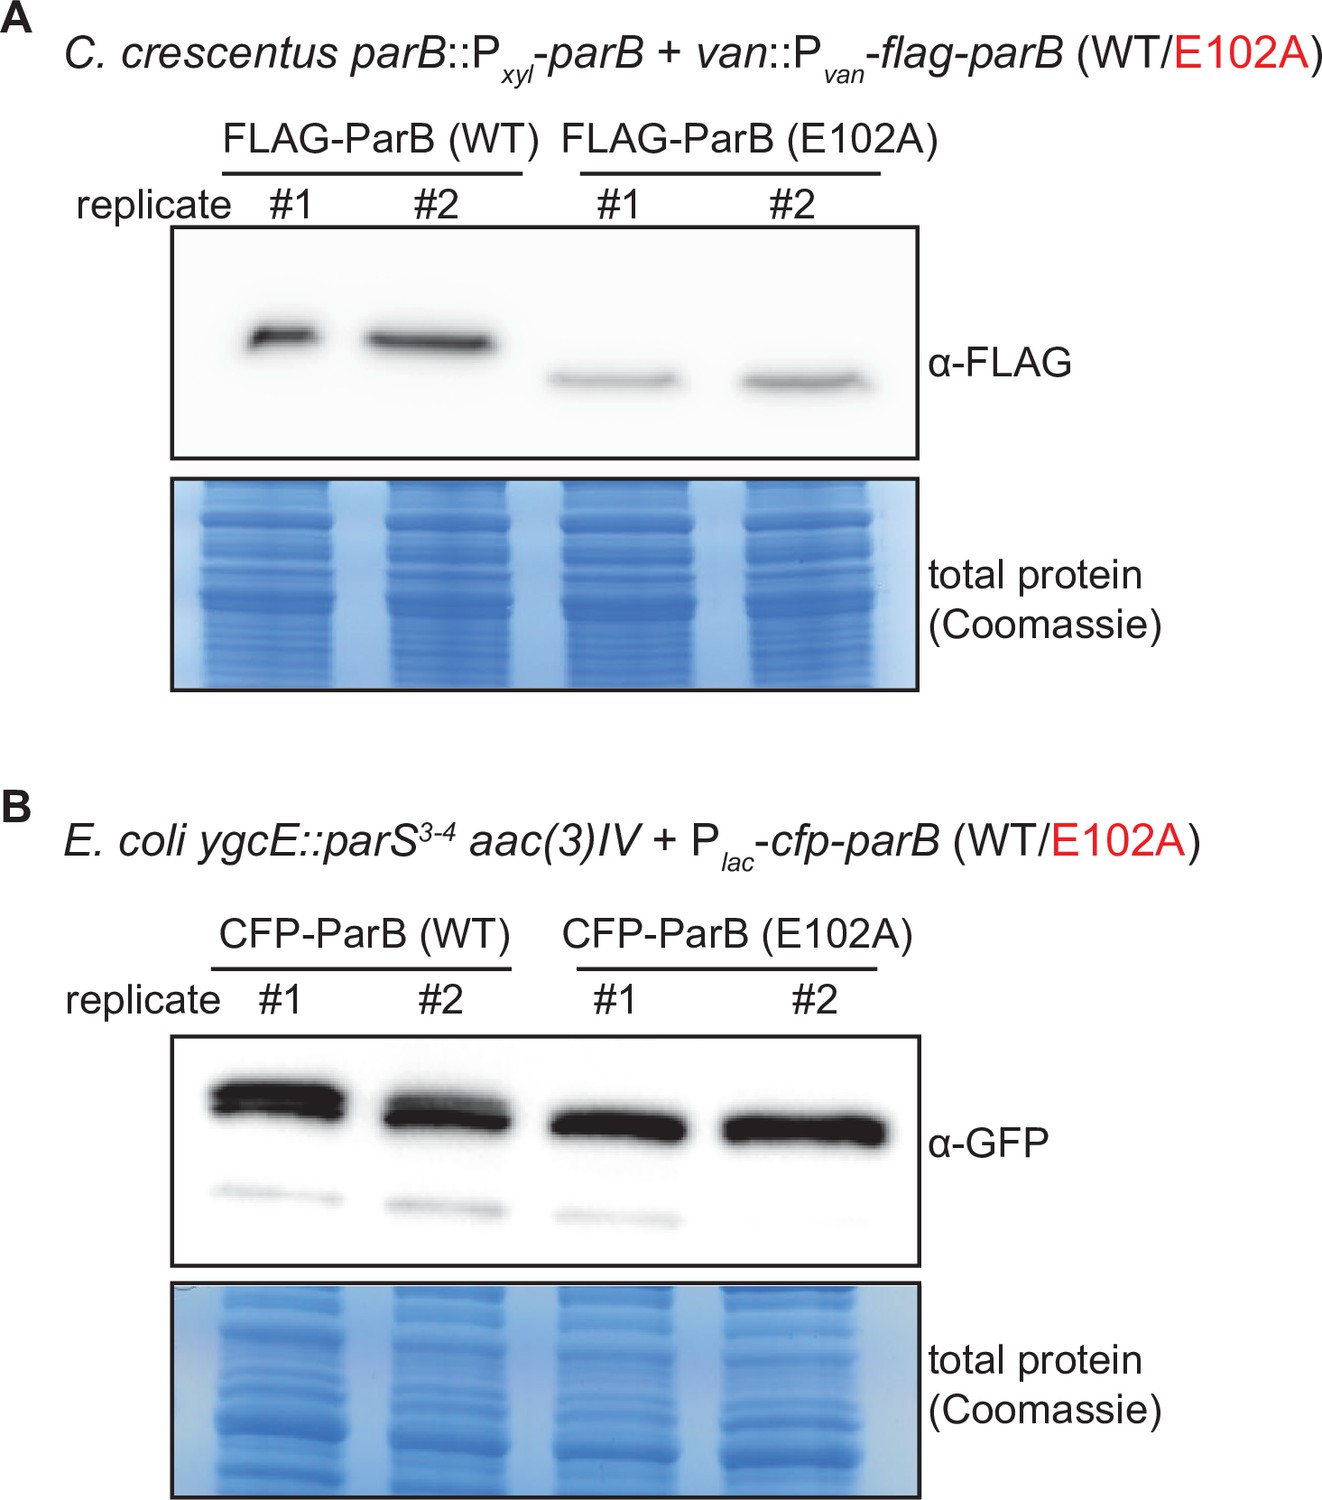
Immunoblot analysis of ParB (WT) vs. E102A.
(A) An α-FLAG immunoblot analysis of FLAG-tagged ParB (WT) vs. ParB (E102A). C. crescentus cells (TLS3050 and TLS3059) were depleted of wild-type untagged ParB for 4 hr, then vanillate was added for an additional hour to allow for expression of FLAG-tagged ParB (WT/E102A). Equal amount of total protein was loaded in each well of the SDS-PAGE. Biological replicates are shown. (B) An α-GFP immunoblot analysis of CFP-tagged ParB (WT) vs. E102A. An α-GFP antibody cross-reacted with a CFP epitope (GFP and CFP are highly similar proteins). E. coli cells (TLS3079 and TLS3080) were grown to mid-exponential phase without IPTG, and CFP-tagged ParB (WT/E102A) were expressed from a leaky lactose promoter (Plac) on a medium-copy-number plasmid. Equal amount of total protein was loaded in each well of the SDS-PAGE. Biological replicates are shown.
-
Figure 8—figure supplement 1—source data 1
Original files and annotation of the uncropped blots used to generate Figure 8—figure supplement 1.
- https://cdn.elifesciences.org/articles/69676/elife-69676-fig8-figsupp1-data1-v1.zip
Figure 8—figure supplement 2
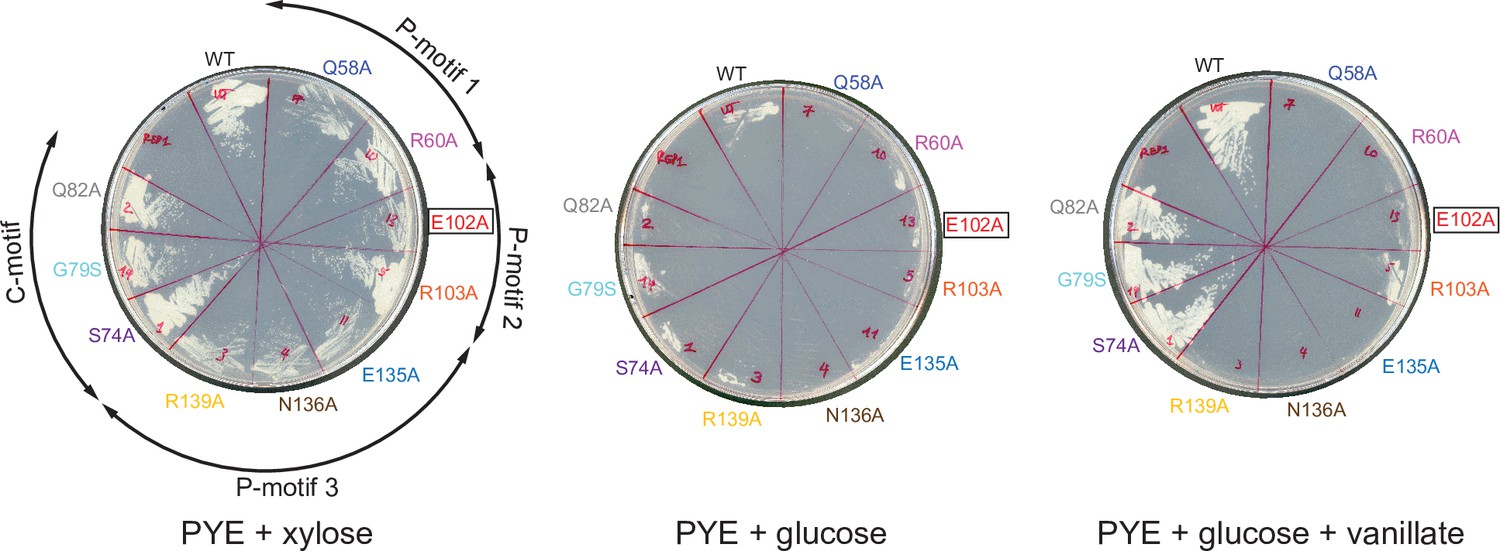
Expressing a FLAG-tagged version of ParB (E102A) could not complement the depletion of wild-type untagged ParB.
C. crescentus strains parB::Pxyl-parB van::Pvan-flag-parB (WT or mutants) were restruck on PYE+ xylose to induce the expression of the native ParB, or on PYE + glucose to repress the expression of the native ParB, or on PYE + glucose + vanillate to repress the expression of the native ParB while expressing the FLAG-tagged ParB (WT/mutants). Plates were incubated at 30°C for 48 hr.
-
Figure 8—figure supplement 2—source data 1
Original files, annotation of the full raw images, and data used to generate Figure 8—figure supplement 2.
- https://cdn.elifesciences.org/articles/69676/elife-69676-fig8-figsupp2-data1-v1.zip
Figure 8—figure supplement 3
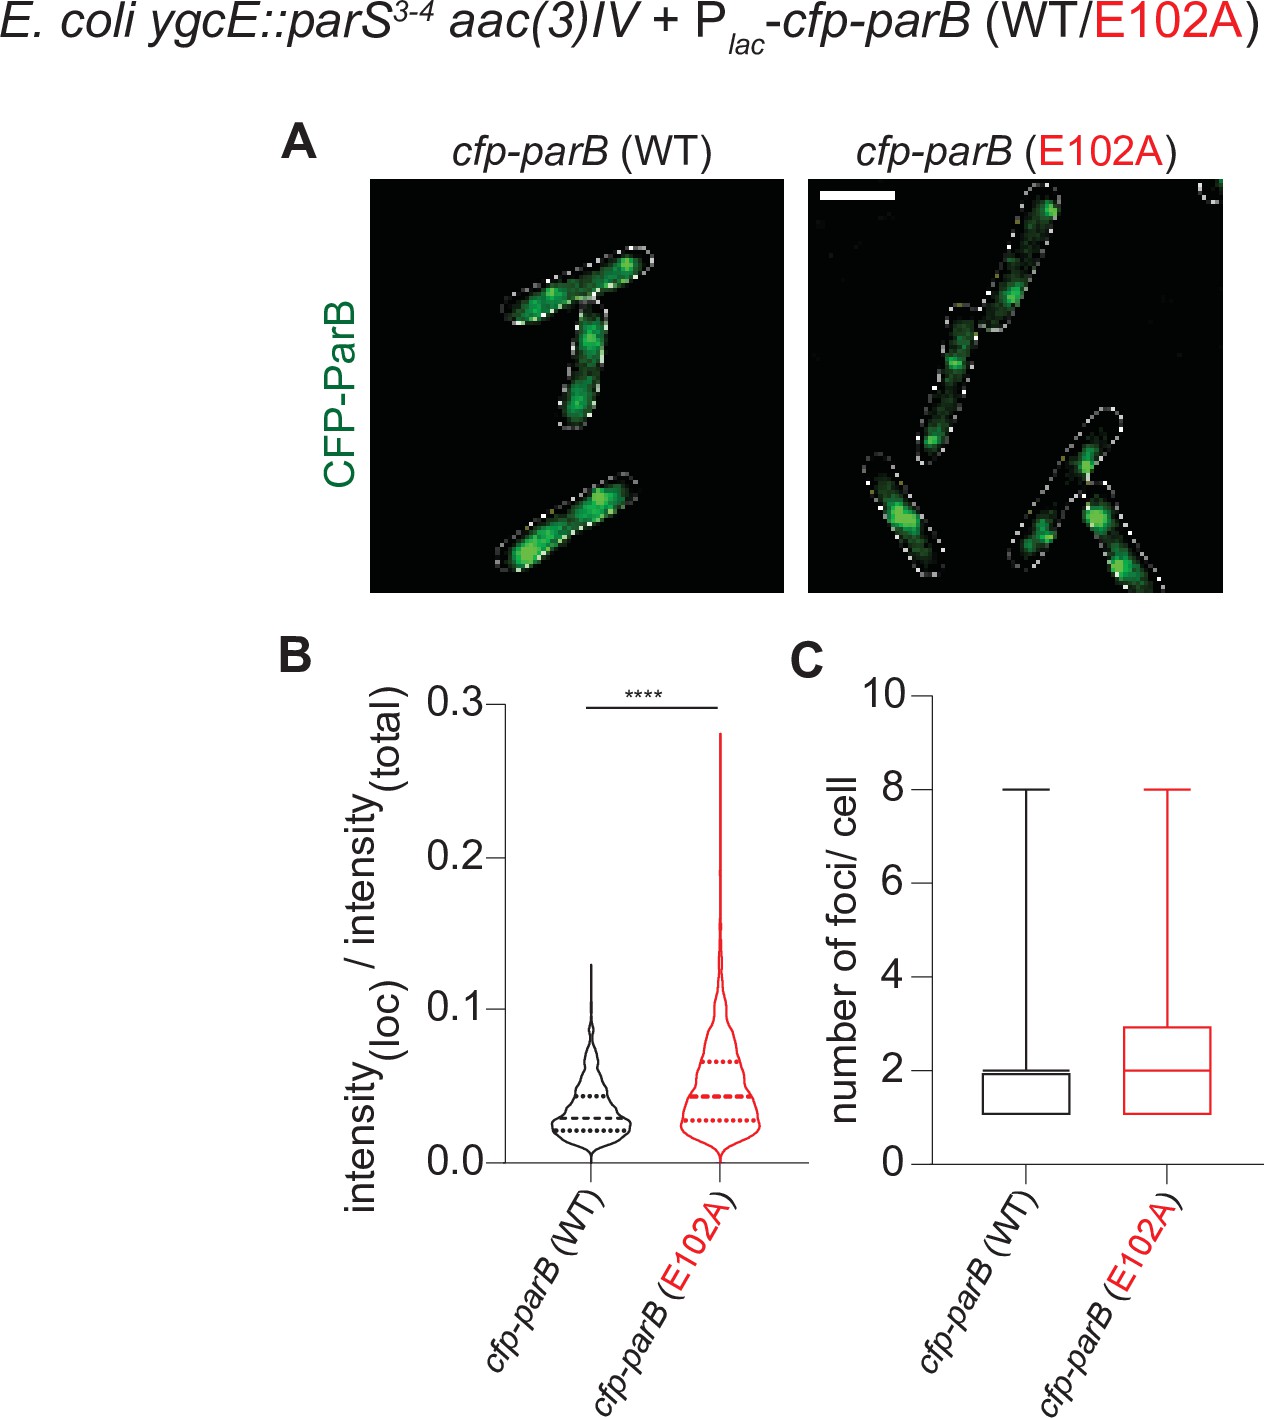
The fluorescence intensity of CFP-ParB (E102A) foci in an E. coli heterologous host is higher than that of CFP-ParB (WT).
(A) Representative images of CFP-ParB (WT/E102A) expressed from an IPTG-inducible promoter in E. coli cells carrying the cognate parS binding sites. Cells were grown in M9 medium +0.25 mM IPTG (instead of in LB without IPTG) to reduce effects of autofluorescence from the growth media and to improve the accuracy of foci detection for the purposes of measuring intensity values of the localizations. CFP-ParB (WT/E102A): green, cell outline: white. Scale bar is 2 μm. (B) Intensity of CFP-ParB (WT/E102A) in foci is estimated with respect to the total fluorescence intensity of the wild-type or mutant cell, and plotted as a violin graph. Mean and interquartile ranges are indicated. Welch’s t-test, p-value < 0.0001. Number of CFP-ParB (WT) foci = 1015 and number of CFP-ParB (E102A) foci = 1993, pooled from three independent replicates. (C) Number of CFP-ParB (WT/E102A) foci per cell was quantified and plotted as a box plot. Mean and min-max range is shown. Number of cells = 592, pooled from three independent replicates.
-
Figure 8—figure supplement 3—source data 1
Data used to generate Figure 8—figure supplement 3.
- https://cdn.elifesciences.org/articles/69676/elife-69676-fig8-figsupp3-data1-v1.zip
Figure 9

A model for C. crescentus ParB nucleating, sliding, and recycling cycle.
ParB (dark green) consists of three domains: an N-terminal CTP-binding domain (NTD), a central parS DNA-binding domain (DBD), a C-terminal dimerization domain (CTD), and a 20 amino acid linker that connects the DBD and the CTD together. Nucleating ParB is an open clamp, in which parS DNA is captured at the DBD (the DNA-gate). Upon binding CTP (orange), the NTD self-dimerizes to close the NTD-gate of the clamp. CTP-binding and the exchange of helices α4 and α4′ (blue) stabilize this closed conformation. The DBD also move closer together to close the DNA-gate, potentially driving parS DNA into a compartment between the DNA-gate and the C-terminal domain. In the nucleotide-bound state, the DBD and the DNA-recognition helices (α6 and α6′, magenta) are incompatible with DNA binding. CTP hydrolysis and/or the release of hydrolytic products (CDP and inorganic phosphate Pi) may reopen the gates to release DNA. Substitutions that affect key steps in the CTP biding/hydrolysis cycle are also indicated on the schematic diagram.
Tables
Key resources table
| Reagent type (species) or resource | Designation | Source or reference | Identifiers | Additional information |
|---|---|---|---|---|
| Strain, strain background (Escherichia coli) | See Supplementary file 1A | This paper | See Supplementary file 1A | |
| Strain, strain background (Caulobacter crescentus) | See Supplementary file 1A | This paper | See Supplementary file 1A | |
| Recombinant DNA reagent | See Supplementary file 1B | This paper | See Supplementary file 1B | |
| Sequence-based reagent | See Supplementary file 1B | This paper | See Supplementary file 1B | |
| Antibody | Anti-GFP antibody (HRP) (Rabbit polyclonal) | Abcam | Cat# ab190584 | Western blot (1:5000) |
| Antibody | Anti-GFP Sepharose beads | Abcam | Cat# ab69314 | For ChIP-seq experiments |
| Antibody | Anti-FLAG antibody (HRP) (Mouse monoclonal) | Merck | Cat# A8592 | Western blot (1:5000) |
| Antibody | Anti-FLAG M2 affinity agarose beads | Merck | Cat# A2220 | For ChIP-seq experiments |
| Commercial assay or kit | Amersham Protran supported western blotting membranes, nitrocellulose | GE Healthcare | Cat# GE10600016 | Pore size 0.45 μm, for DRaCALA assay |
| Commercial assay or kit | EnzChek Phosphate Assay Kit | ThermoFisher | Cat# E6646 | |
| Commercial assay or kit | Gibson Assembly Master Mix | NEB | Cat# E2611S | |
| Commercial assay or kit | Gateway BP Clonase II enzyme mix | ThermoFisher | Cat# 11789020 | |
| Commercial assay or kit | Dip-and-Read Streptavidin biosensors SAX2 | Sartorius UK | Cat# 18-5019 | |
| Commercial assay or kit | HisTrap High Performance column | GE Healthcare | Cat# GE17524801 | |
| Commercial assay or kit | HisTrap Heparin High Performance column | GE Healthcare | Cat# GE17040601 | |
| Commercial assay or kit | HiLoad 16/600 Superdex 200 pg column | GE Healthcare | Cat# GE28989335 | |
| Commercial assay or kit | 0.5 mL Zeba spin desalting columns | ThermoFisher | Cat# 89,882 | 7K Da molecular weight cutoff |
| Peptide, recombinant protein | BamHI-HF | NEB | Cat# R3136S | 20,000 units/mL |
| Peptide, recombinant protein | HindIII-HF | NEB | Cat# R3104S | 20,000 units/mL |
| Chemical compound, drug | Benzonase nuclease | Merck | Cat# E1014 | 250 units/µL |
| Chemical compound, drug | CTP | ThermoFisher | Cat# R0451 | 100 mM solution |
| Chemical compound, drug | CTPγS | Jena Bioscience | Custom synthesis (purity ≥96%) | |
| Chemical compound, drug | P32-α-CTP | Perkin Elmer | Cat# BLU008H250UC | 3,000 Ci/mmol, 10 mCi/mL, 250 µCi |
| Chemical compound, drug | Bismaleimidoethane (BMOE) | ThermoFisher | Cat# 22323 | Dissolved in DMSO |
| Chemical compound, drug | AcTEV protease | ThermoFisher | Cat# 12575015 | 10 units/µL |
| Software, algorithm | BLItz Pro | Molecular Devices | Cat# 50-0156 | Version 1.2 |
| Software, algorithm | AIMLESS | Evans and Murshudov, 2013 | http://www.ccp4.ac.uk/ | Version 0.7.4 |
| Software, algorithm | BUCCANEER | Cowtan, 2006 | http://www.ccp4.ac.uk/ | Version 1.6.10 |
| Software, algorithm | Coot | Emsley and Cowtan, 2004 | http://www.ccp4.ac.uk/ | Version 0.9.5 |
| Software, algorithm | CHAINSAW | Stein, 2008 | http://www.ccp4.ac.uk/ | Version 7.0.077 |
| Software, algorithm | DIALS | Winter et al., 2018 | https://dials.github.io | Version 3.1.0 |
| Software, algorithm | Excel 2016 | Microsoft | RRID:SCR_016137 | Version 16.0 |
| Software, algorithm | GraphPad Prism 8 | GraphPad Software | RRID:SCR_002798 | Version 8 |
| Software, algorithm | ImageJ | NIH | https://imagej.net/ RRID:SCR_003070 | Version 1.50 |
| Software, algorithm | Image Studio Lite | LI-COR Biosciences | RRID:SCR_013715 | Version 5.2 |
| Software, algorithm | PISA | Krissinel, 2015 | http://www.ccp4.ac.uk/pisa/ | Version 2.1.1 |
| Software, algorithm | MolProbity | Williams et al., 2018 | http://molprobity.biochem.duke.edu/ | Version 4.5 |
| Software, algorithm | PHASER | McCoy et al., 2007 | https://www.phenix-online.org/ | Version 2.8.2 |
| Software, algorithm | PyMOL | The PyMOL Molecular Graphics System | https://pymol.org/2/ | Version 2.4.0 |
| Software, algorithm | R | R Foundation for Statistical Computing | https://www.r-project.org/ | Version 3.2.4 |
| Software, algorithm | REFMAC5 | Murshudov et al., 1997 | http://www.ccp4.ac.uk/ | Version 5.8.0258 |
| Software, algorithm | SCULPTOR | Bunkóczi and Read, 2011 | http://www.ccp4.ac.uk/ | Version 0.0.3 |
| Software, algorithm | XDS | Kabsch, 2010 | https://xds.mr.mpg.de/ | Version Nov11-2017 |
| Software, algorithm | XIA2 | Winter, 2009 | https://xia2.github.io/index.html | Version 0.3.7.0 |
Table 1
X-ray data collection and processing statistics.
| Structure | C. crescentus ParB∆CTD-parS complex | C. crescentus ParB∆CTD CTPɣS complex |
|---|---|---|
| Data collection | ||
| Diamond Light Source beamline | I04-1 | I03 |
| Wavelength (Å) | 0.916 | 0.976 |
| Detector | Pilatus 6M-F | Eiger2 XE 16M |
| Resolution range (Å) | 72.96–2.90 (3.08–2.90) | 70.59–2.73 (2.86–2.73) |
| Space group | P21 | P21 |
| Cell parameters (Å/°) | a = 54.3, b = 172.9, c = 72.9, β = 90.5 | a = 69.5, b = 56.1, c = 71.4, β = 98.4 |
| Total no. of measured intensities | 198,135 (33888) | 92,266 (8473) |
| Unique reflections | 29,654 (4775) | 14,516 (1756) |
| Multiplicity | 6.7 (7.1) | 6.4 (4.8) |
| Mean I/σ(I) | 8.7 (1.4) | 5.4 (1.2) |
| Completeness (%) | 99.7 (100.0) | 98.8 (91.4) |
| Rmerge* | 0.135 (1.526) | 0.195 (1.210) |
| Rmeas† | 0.146 (1.646) | 0.212 (1.357) |
| CC½‡ | 0.997 (0.677) | 0.991 (0.825) |
| Wilson B value (Å2) | 81.6 | 57.7 |
| Refinement | ||
| Resolution range (Å) | 72.96–2.90 (2.98–2.90) | 70.59–2.73 (2.80–2.73) |
| Reflections: working/free§ | 28155/1466 | 13824/678 |
| Rwork¶ | 0.240 (0.366) | 0.248 (0.371) |
| Rfree¶ | 0.263 (0.369) | 0.284 (0.405) |
| Ramachandran plot: favored/allowed/disallowed** (%) | 95.2/4.8/0 | 95.5/4.5/0 |
| R.m.s. bond distance deviation (Å) | 0.005 | 0.002 |
| R.m.s. bond angle deviation (°) | 1.05 | 1.19 |
| Mean B factors: protein/DNA/other/ overall (Å2) | 98/74/-/92 | 81/-/61/77 |
| PDB accession code | 6T1F | 7BM8 |
-
Values in parentheses are for the outer resolution shell.
-
*
Rmerge = ∑hkl ∑i |Ii(hkl)− ⟨I(hkl)⟩|/ ∑hkl ∑iIi(hkl).
-
†
Rmeas = ∑hkl [N/(N− 1)]1/2 × ∑i |Ii(hkl)− ⟨I(hkl)⟩|/ ∑hkl ∑iIi(hkl), where Ii(hkl) is the ith observation of reflection hkl, ⟨I(hkl)⟩ is the weighted average intensity for all observations i of reflection hkl, and N is the number of observations of reflection hkl.
-
‡
CC½ is the correlation coefficient between symmetry equivalent intensities from random halves of the dataset.
-
§
The dataset was split into ‘working’ and ‘free’ sets consisting of 95% and 5% of the data, respectively. The free set was not used for refinement.
-
¶
The R-factors Rwork and Rfree are calculated as follows: R = ∑(| Fobs - Fcalc |)/∑| Fobs |, where Fobs and Fcalc are the observed and calculated structure factor amplitudes, respectively.
-
**
As calculated using MolProbity (Chen et al., 2010).
Additional files
-
Supplementary file 1
(A) Bacterial strains used in this study. (B) Plasmids, DNA, and protein sequences used in this study. (C) ChIP-seq datasets generated in this study.
- https://cdn.elifesciences.org/articles/69676/elife-69676-supp1-v1.docx
-
Transparent reporting form
- https://cdn.elifesciences.org/articles/69676/elife-69676-transrepform1-v1.docx
Download links
A two-part list of links to download the article, or parts of the article, in various formats.
Downloads (link to download the article as PDF)
Open citations (links to open the citations from this article in various online reference manager services)
Cite this article (links to download the citations from this article in formats compatible with various reference manager tools)
A CTP-dependent gating mechanism enables ParB spreading on DNA
eLife 10:e69676.
https://doi.org/10.7554/eLife.69676


