Whole brain correlates of individual differences in skin conductance responses during discriminative fear conditioning to social cues
- Department of Psychology and Social Work, Mid Sweden University, Sweden
- Department of Psychology, Uppsala University, Sweden
- Department of Clinical Neuroscience, Karolinska Institutet, Sweden
Figures
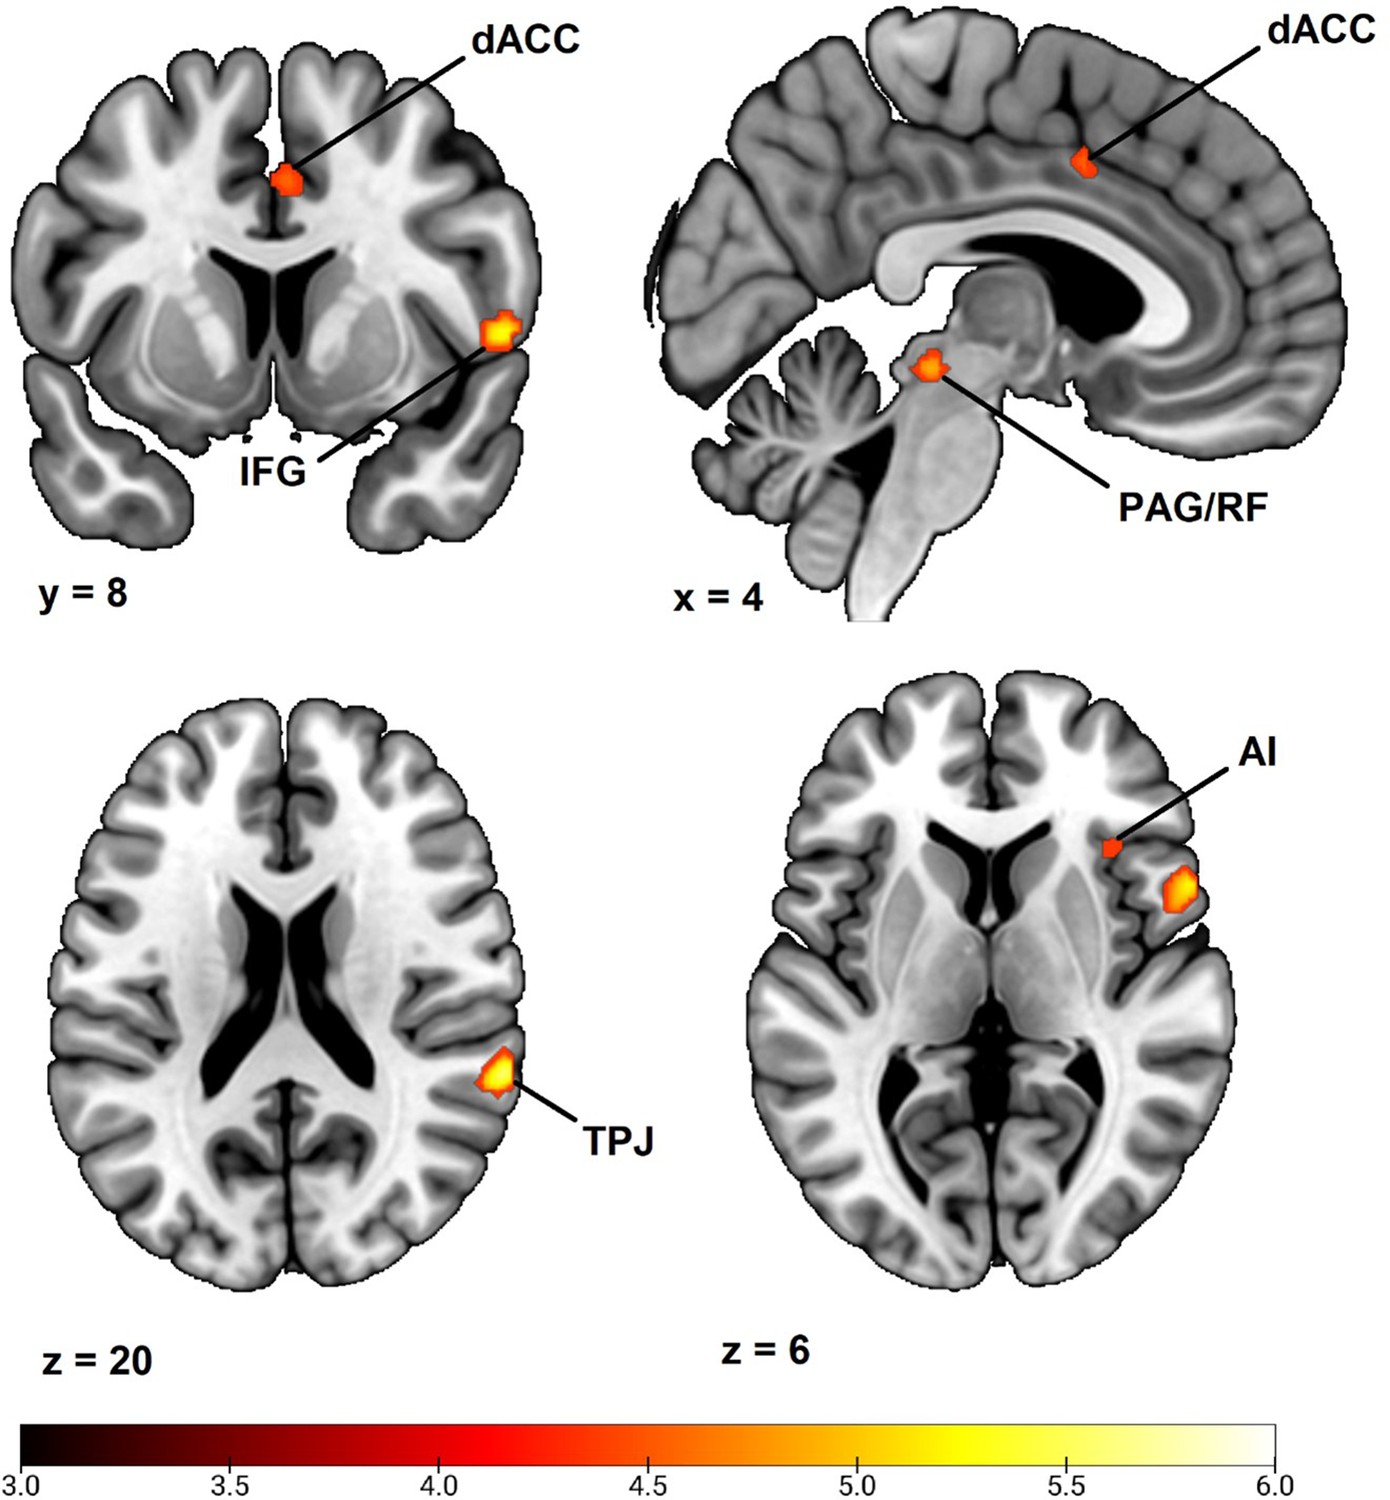
Figure 1
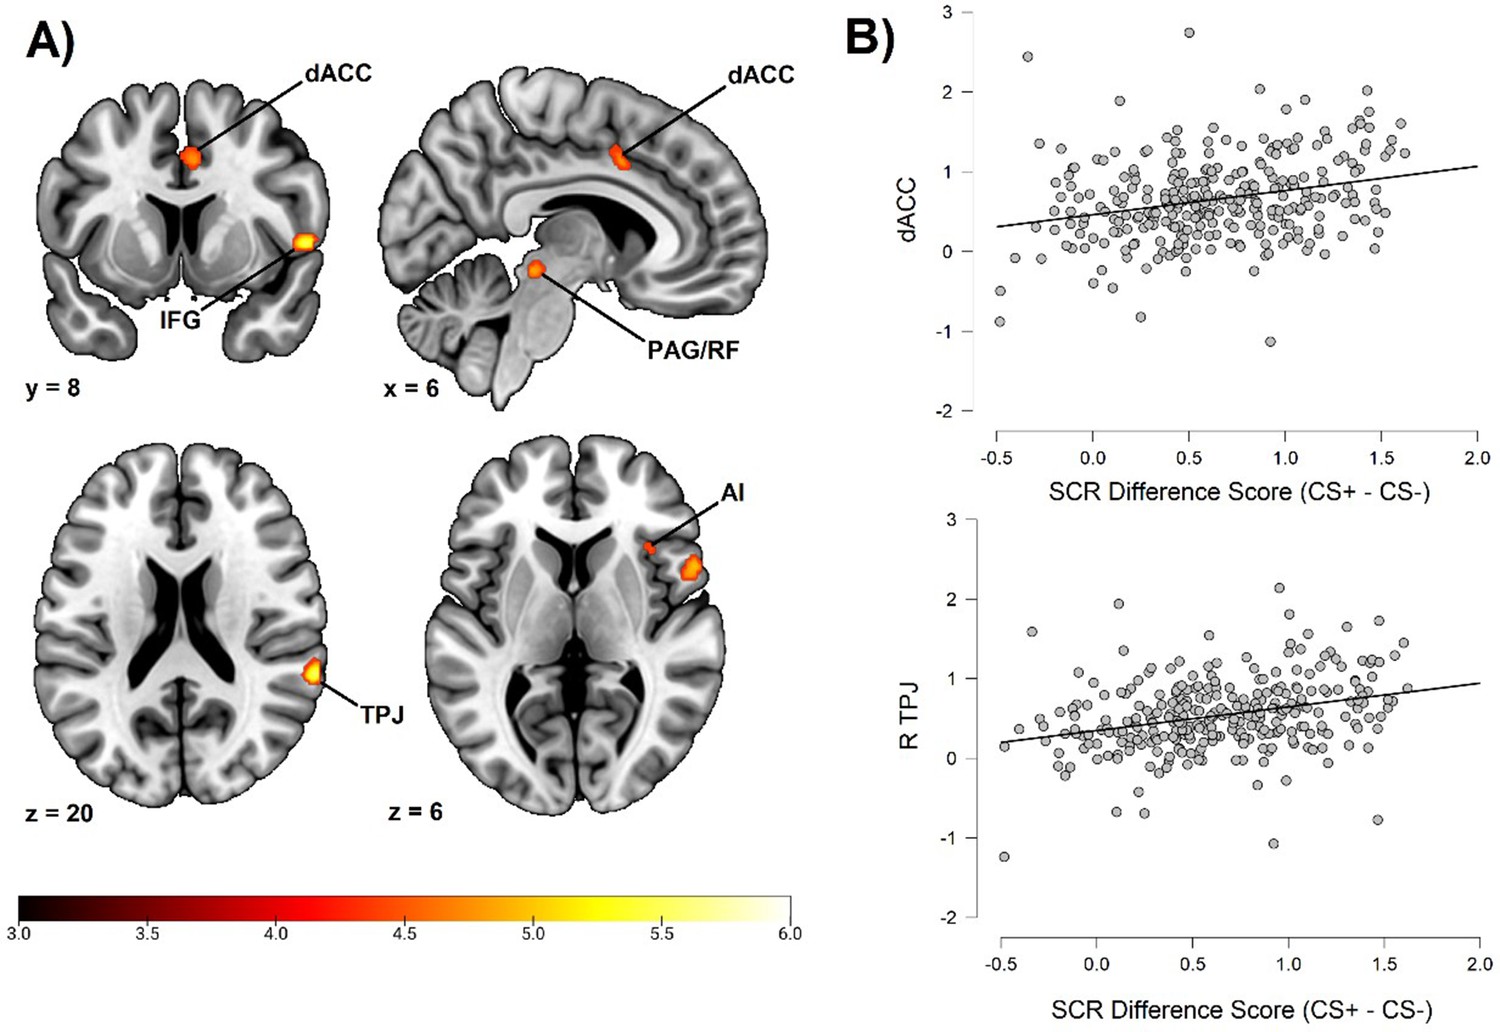
Correlation between individual differences in conditioned SCR and whole brain responses during fear conditioning, obtained using individual SCR scores (Z transformed average CS+ minus CS- SCR) as a second level, between-subjects regressor of the average CS+ > CS- BOLD activation in SPM12 (Wellcome Department of Cognitive Neurology, University College, London) software.
The sample consisted of 285 participants who passed the following exclusion criteria: pregnancy, inability to lie still for a 1 hr duration, intolerance of tight confinements, ongoing psychological treatment, metal objects in the body (due to surgery, fragmentation, etc.), current alcohol or drug-related problems, use of psychotropic medications, unsuccessful recording of skin conductance responses, loss of brain imaging data due to excessive head movement, and participant failure to comply with task instruction regarding button press in at least 80% of trials. (A) Activation map of key implicated neural regions. Color-coded t values ranged from t = 3 to t = 6. The statistical image was thresholded at P < 0.05 FWE-corrected and displayed on an anatomical brain template. (B) Scatter plots depicting correlation between SCR difference scores and eigenvariates from significant whole brain clusters in the dorsal anterior cingulate cortex (upper panel) and the temporoparietal junction (lower panel). R = right dACC = dorsal anterior cingulate cortex. TPJ = temporoparietal junction. IFG = inferior frontal gyrus. PAG/RF = periaqueductal gray/reticular formation. AI = anterior insula.
-
Figure 1—source data 1
Variable data used to produce Figure 1B, Figure 2B and statistical analyses reported in the section ‘Relative contribution of neurofunctional correlates to individual differences in SCR’, as well as Appendix 1—figure 1, Appendix 2—figure 1 and Appendix 5—table 1.
Scatter plots depicting correlation between SCR difference scores and eigenvariates from significant neural regions were rendered using JASP version 0.14.1 (JASP Team, 2020). SCR source data was computed within the Ledalab software package (v 3.4.9; Benedek and Kaernbach, 2010) implemented in Matlab 2020a (Mathworks, Inc, Natick, MA) and individual SCR difference scores were computed using the JASP software (see Materials and methods, sections 4.2.4 and 4.3.2). fMRI source data was computed from the SPM software and extracted as eigenvariates from all significant clusters (see Materials and methods, section 4.3.3) and matched to the corresponding SCR difference scores in a comma separated values (CSV) file (attached). Within the attached file you can find SCR scores for each participant using both Z transformation and square root transformation, as well as average SCR responding to the CS+ and CS-, separately. Also included are extracted eigenvariates from all implicated regions in the whole brain analysis and the amygdala ROI analysis (section 2.2.2). Notice that this data also constitutes source data for Figure 2B as well as for statistical analyses reported in section 2.2.3 and for Appendix 1—figure 1, Appendix 2—figure 1, and Appendix 5—table 1.
- https://cdn.elifesciences.org/articles/69686/elife-69686-fig1-data1-v3.csv
Figure 2
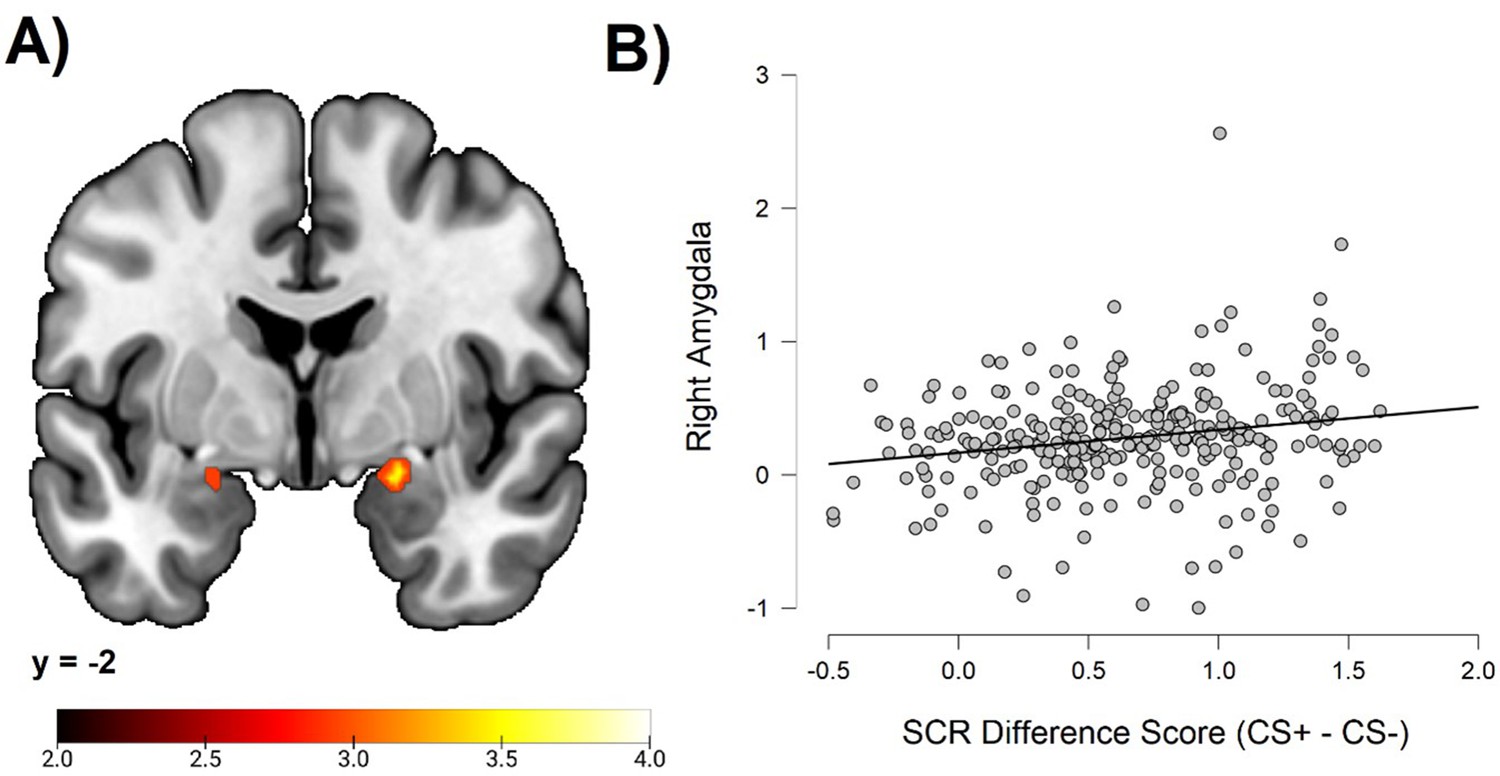
Correlations between individual differences in conditioned SCR and amygdala activation, obtained using individual SCR scores (Z transformed average CS+ minus CS- SCR) as a second level between-subjects regressor of the average CS+ > CS- BOLD activation in SPM12 (Wellcome Department of Cognitive Neurology, University College, London) software.
The sample consisted of 285 participants who passed the following exclusion criteria: pregnancy, inability to lie still for a 1 hr duration, intolerance of tight confinements, ongoing psychological treatment, metal objects in the body (due to surgery, fragmentation, etc.), current alcohol or drug-related problems, use of psychotropic medications, unsuccessful recording of skin conductance responses, loss of brain imaging data due to excessive head movement, and participant failure to comply with task instruction regarding button press in at least 80% of trials. (A) Activation map depicting significant activation on coronal section at MNI Y-coordinate = –2. Color-coded t values range from t = 2.0 to t = 4.0. The statistical image was thresholded at p < 0.05 FWE-corrected. (B) Scatter plot depicting correlation between SCR difference scores and eigenvariates from the significant right amygdala cluster within the amygdala ROI. For source data to (B), see Figure 1—source data 1.
Figure 3
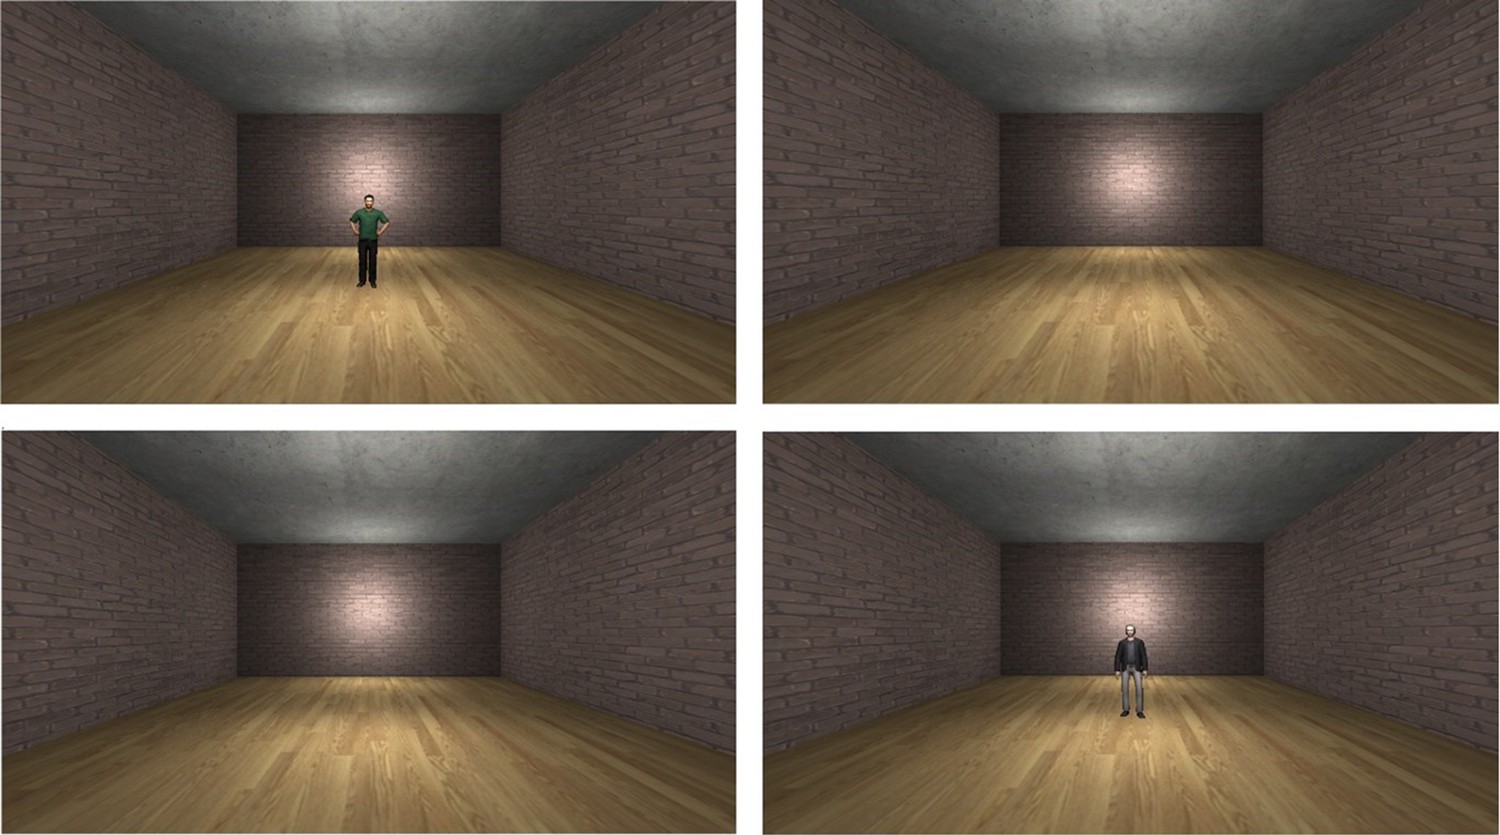
Experimental setup.
Two male characters were displayed in the scanner during the fear conditioning task (top left, bottom right). One character predicted an electric shock (CS+) whereas the other served as a control stimulus and was never followed by shock (CS-). Between character presentations, participants viewed the empty virtual environment (top right, bottom left).
Appendix 1—figure 1
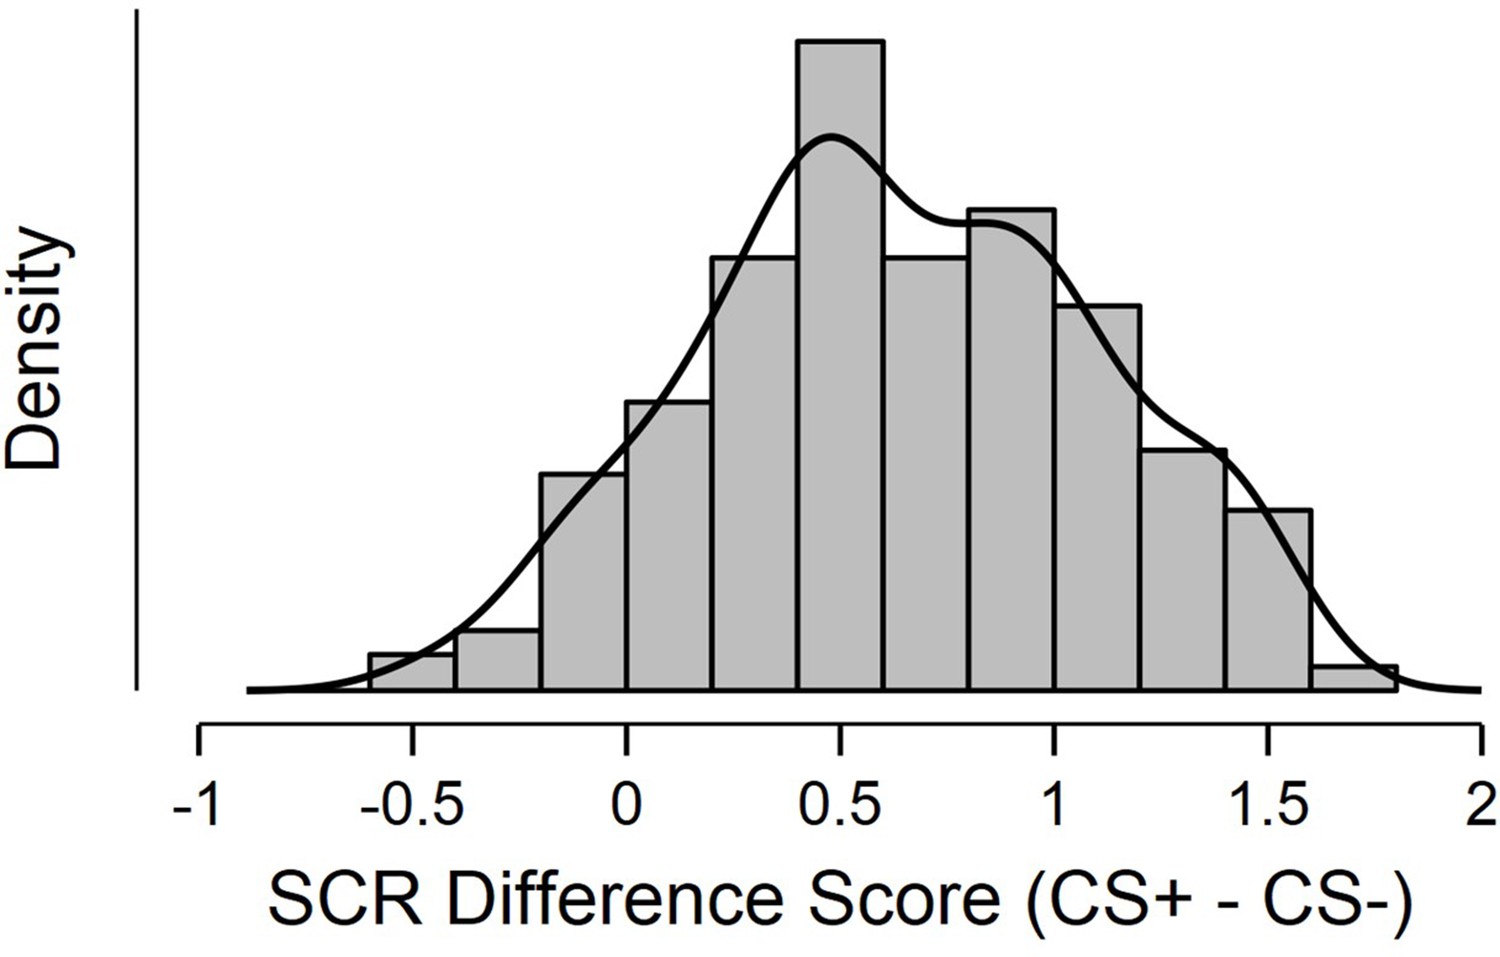
Histogram displaying distribution of SCR difference scores, defined as Z transformed average CS+ minus CS- SCR during a fear conditioning paradigm.
Sample consisted of 285 participants passing the following exclusion criteria: pregnancy, inability to lie still for a 1 hr duration, intolerance of tight confinements, ongoing psychological treatment, use of psychotropic medications, metal objects in the body (due to surgery, fragmentation etc.), current alcohol or drug related problems. For source data to Appendix 1—figure 1, see Figure 1—source data 1.
Appendix 2—figure 1
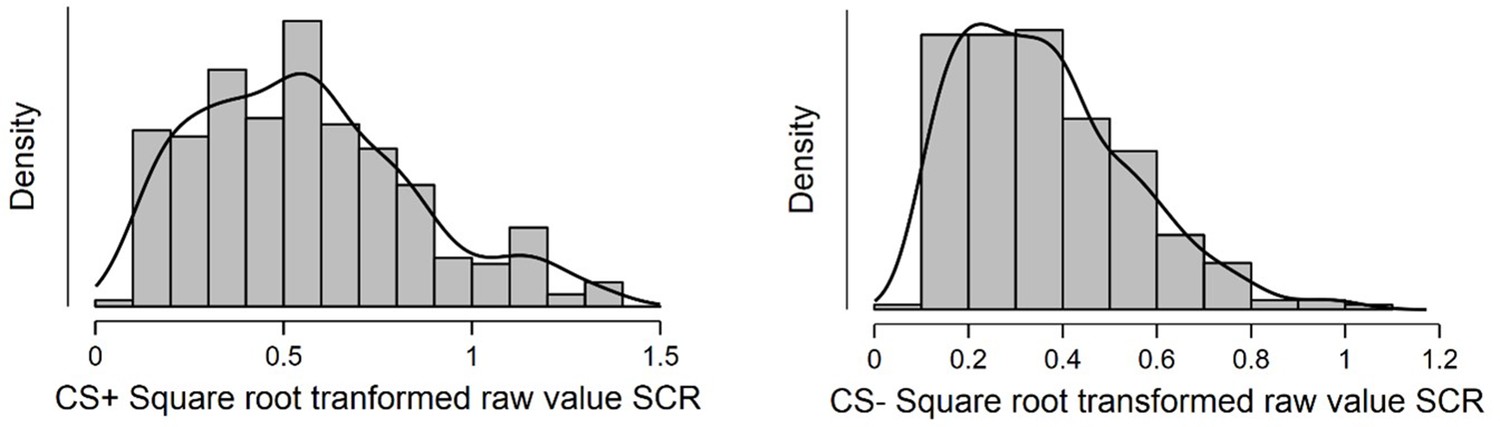
Histogram displaying distribution of average square root transformed raw value SCRs to the CS+ (left) and CS- (right) during a fear conditioning paradigm.
Sample consisted of 285 participants passing the following exclusion criteria: pregnancy, inability to lie still for a 1 hr duration, intolerance of tight confinements, ongoing psychological treatment, use of psychotropic medications, metal objects in the body (due to surgery, fragmentation etc.), current alcohol or drug related problems. For source data to Appendix 2—figure 1, see Figure 1—source data 1.
Appendix 3—figure 1
Correlation between individual differences in conditioned SCR and whole brain responses during fear conditioning, obtained using individual square root transformed raw value SCR scores (average CS+ minus average CS- SCR) as a second level between-subjects regressor of the average CS+ > CS- BOLD activation in SPM12 (Wellcome Centre for Human Neuroimaging, University College, London) software.
Sample consisted of 285 participants passing the following exclusion criteria: pregnancy, inability to lie still for a 1 hr duration, intolerance of tight confinements, ongoing psychological treatment, metal objects in the body (due to surgery, fragmentation etc.), ongoing substance abuse, use of psychotropic medications, unsuccessful recording of skin conductance responses, loss of brain imaging data due to excessive head movement, participant failure to comply with task instruction regarding button press in at least 80% of trials. Displayed is an activation map of key implicated neural regions. Color-coded t values ranges from t = 3 to t = 6. The statistical image was thresholded at p < 0.05 FWE-corrected and displayed on an anatomical brain template. dACC = dorsal Anterior Cingulate Cortex. TPJ = Temporoparietal Junction. IFG = Inferior Frontal Gyrus. PAG/RF = Periaqueductal gray/Reticular Formation. AI = Anterior Insula.
Appendix 4—figure 1

Correlation between individual differences in conditioned SCR and whole brain responses during fear conditioning with minimal participant exclusion.
Results obtained using individual SCR scores (Z transformed average CS+ minus CS- SCR) as a second level between-subjects regressor of the average CS+ > CS- BOLD activation in SPM12 (Wellcome Centre for Human Neuroimaging, University College, London) software. Sample consisted of 303 participants passing the following exclusion criteria: pregnancy, inability to lie still for a 1 hr duration, intolerance of tight confinements, ongoing psychological treatment, metal objects in the body (due to surgery, fragmentation etc.), ongoing substance abuse. Note that this is a larger sample than in the main analyses of the main text (n = 285), including an additional 5 participants with loss of brain imaging data due to excessive head movement, an additional 11 participants that failed to comply with the task instruction regarding button presses in at least 80% of trials and an additional 7 participants that used psychotropic medication. Displayed is an ctivation map of key implicated neural regions. Color-coded t values ranges from t = 3 to t = 6. The statistical image was thresholded at p < 0.05 FWE-corrected and displayed on an anatomical brain template. R = Right. dACC = dorsal Anterior Cingulate Cortex. TPJ = Temporoparietal Junction. IFG = Inferior Frontal Gyrus. PAG/SC = Periaqueductal gray/Superior Colliculus. AI = Anterior Insula.
Appendix 6—figure 1
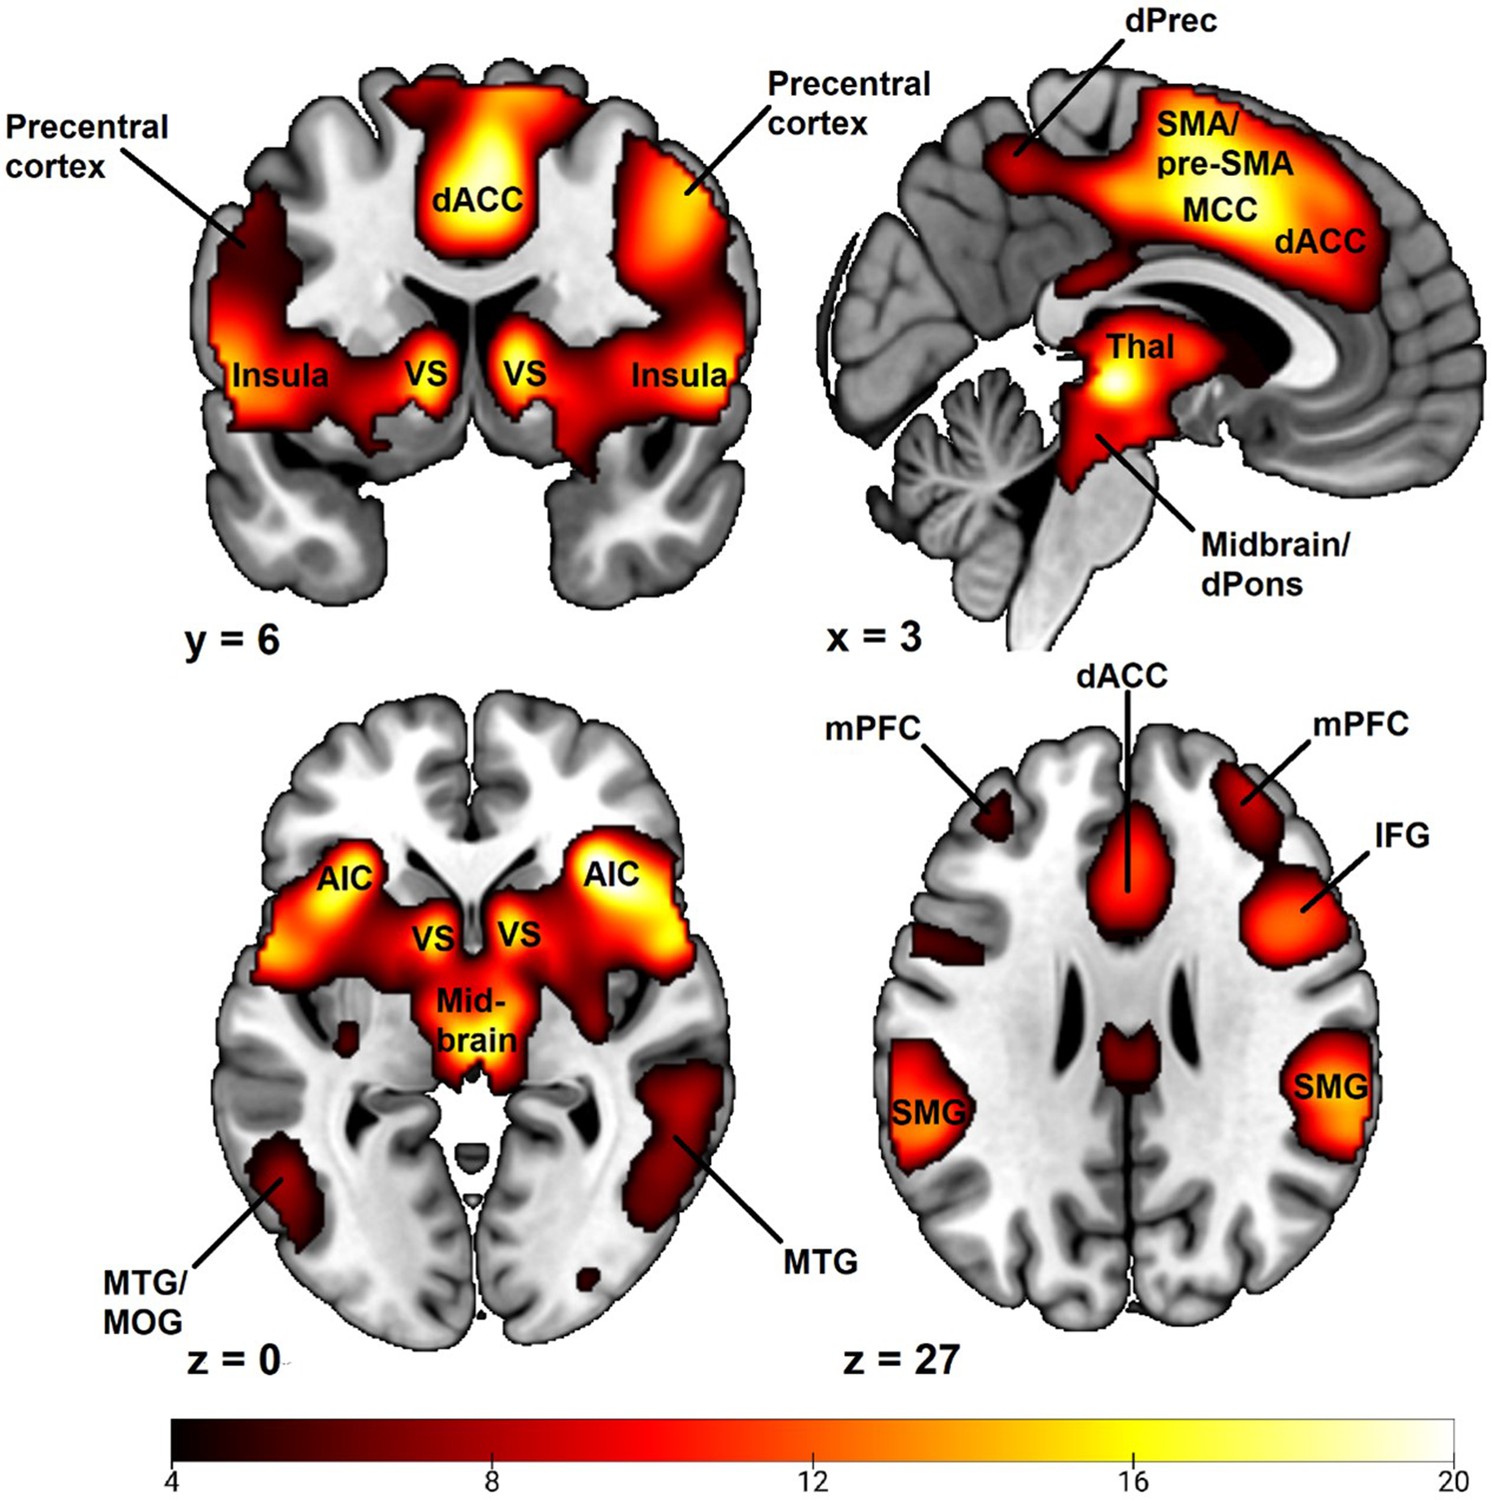
Whole brain CS+ > CS- BOLD contrast activations during a fear conditioning paradigm.
Results obtained using first-level event-related modeling of conditioned and unconditioned stimuli in a general linear model predicting BOLD signal and then examining the overall whole brain CS+ > CS- BOLD contrast on the group level in SPM12 (Wellcome Centre for Human Neuroimaging, University College, London). Sample consisted of 285 participants passing the following exclusion criteria: pregnancy, inability to lie still for a 1 hr duration, intolerance of tight confinements, ongoing psychological treatment, metal objects in the body (due to surgery, fragmentation etc.), ongoing substance abuse, use of psychotropic medications, unsuccessful recording of skin conductance responses, loss of brain imaging data due to excessive head movement, participant failure to comply with task instruction regarding button press in at least 80% of trials. Color-coded t values ranges from t = 4.0 to t = 20. Statistical images are thresholded at p < 0.05 FWE-corrected. Abbreviations: dACC = dorsal anterior cingulate cortex; VS = ventral striatum; SMA = supplementary motor area; Pre-SMA = pre-supplementary motor area; dPrec = dorsal precuneus; MCC = midcingulate cortex; Thal = thalamus; dPons = dorsal pons; AIC = anterior insula cortex; MTG = medial temporal gyrus; MOG = medial occipital gyrus; mPFC = middle prefrontal cortex; MFG = middle frontal gyrus; IFG = inferior frontal gyrus; SMG = supramarginal gyrus.
Tables
Table 1
Previous studies examining the association between individual differences in skin conductance responses (SCR) and neural activation during fear conditioning.
| Study | Participants (n) | Analysis | Definition of individual SCR scores | Definition of neural activation | ROI(s) | Statistical threshold | Findings |
|---|---|---|---|---|---|---|---|
| LaBar et al., 1998 | 5 | Correlation | CS+ minus CS- | No. of voxels in CS+ > CS- contrast | Amygdala, rostral and caudal ACC | PUnc < 0.001 | Positive correlation in Amygdala |
| Phelps et al., 2004 | 11 | Correlation | CS+ minus CS- | CS+ > CS- contrast | Amygdala, mid PFC | PUnc < 0.001 | Positive correlation in Amygdala |
| Dunsmoor et al., 2011 | 14 | Correlation | CS+ minus CS- | CS+ > CS- contrast | Whole brain, Amygdala | Whole brain: PUnc < 0.001 then ROI: PFWE < 0.05 | Positive correlation in left Amygdala |
| Petrovic et al., 2008 | 27 | Correlation | Late(CS+ minus CS-) - Early(CS+ minus CS-) | CS+ > CS- contrast | Amygdala, Fusiform Gyrus and pain regions from Peyron et al., 2000 | PUnc < 0.001 | Positive correlation in Amygdala |
| MacNamara et al., 2015 | 49 | Correlation | CS+ minus CS- | CS+ > CS- contrast | Amygdala, Insula, ACC, cerebellum (lobule 4–5), mPFC, precentral gyrus, STG | PUnc < 0.001 then PFWE < 0.05 using ClusterSim | Positive correlation in right Amygdala and left SMA. Positive correlation in left Amygdala using relaxed statistical threshold. |
| Marin et al., 2020 | 60 | High vs. low SCR responders (drawn from larger sample of N = 109) | CS+ minus CS- | CS+ > CS- contrast | Amygdala, Insula, dACC, sgACC, vmPFC | Combined ROIs: PUnc < 0.001; Single ROIs: PFWE < 0.05 | High SCR responders > Low responders: Left Amygdala, left Insula and vmPFC |
-
Note: ACC, Anterior cingulate cortex; dACC, dorsal ACC; FWE, Family-wise error, mPFC, medial PFC; PFC, Prefrontal cortex; sgACC, subgenual ACC; Unc, Uncorrected; vmPFC, ventromedial PFC.
Table 2
Whole brain correlation to conditioned SCR.
| Anatomical region | Hemisphere | Voxels | t | MNI Coordinates | ||
|---|---|---|---|---|---|---|
| x | y | z | ||||
| Dorsal Anterior Cingulate Cortex/Anterior Midcingulate Cortex | N/A | 50 | 4.79 | 6 | 8 | 40 |
| Anterior Insula | Right | 20 | 4.65 | 36 | 20 | 6 |
| Inferior Frontal Gyrus/Frontal Operculum | Right | 138 | 5.80 | 56 | 10 | 2 |
| Temporoparietal Junction/Superior Temporal Gyrus | Right | 81 | 5.66 | 64 | –40 | 20 |
| Superior Frontal Gyrus/Dorsal Premotor Cortex | Right | 44 | 5.21 | 18 | 0 | 68 |
| Midbrain | Right | 59 | 5.22 | 10 | –30 | –12 |
| Superior Parietal Lobe/Postcentral Gyrus | Right | 3 | 4.52 | 22 | –46 | 70 |
| Superior Frontal Gyrus/Dorsal Premotor Cortex | Left | 2 | 4.46 | –14 | -2 | 72 |
| Temporoparietal Junction/Superior Temporal Gyrus | Left | 1 | 4.37 | –62 | –36 | 22 |
-
Note. MNI coordinates and t values represent significant peak voxels of each cluster. Statistical significance was calculated using t tests implemented within the SPM software with an FWE corrected alpha level of α = .05.
Appendix 3—table 1
Whole Brain Correlation to Conditioned SCR using square root transformed raw value SCR.
| Anatomical region | Hemisphere | Voxels | t | MNI Coordinates | ||
|---|---|---|---|---|---|---|
| x | y | z | ||||
| Dorsal Anterior Cingulate Cortex/Anterior Midcingulate Cortex | N/A | 21 | 4.58 | 4 | 8 | 40 |
| Anterior Insula | Right | 18 | 4.60 | 36 | 22 | 6 |
| Inferior Frontal Gyrus/Frontal Operculum | Right | 144 | 5.66 | 56 | 12 | 2 |
| Temporoparietal Junction/Superior Temporal Gyrus | Right | 116 | 5.64 | 64 | –40 | 20 |
| Superior Frontal Gyrus/Dorsal Premotor Cortex/Supplementary Motor Area | Right | 125 | 5.54 | 16 | 0 | 66 |
| Midbrain | Right | 61 | 5.03 | 6 | –30 | –10 |
| Temporoparietal Junction/Superior Temporal Gyrus | Left | 6 | 4.49 | –62 | –36 | 22 |
-
Note. MNI coordinates and t values represent significant peak voxels of each cluster. Statistical significance was calculated using t tests implemented within the SPM software with an FWE corrected alpha level of α = .05.
Appendix 4—table 1
Whole Brain Correlation to Conditioned SCR without participant exclusion (N = 303).
| Anatomical region | Hemisphere | Voxels | t | MNI Coordinates | ||
|---|---|---|---|---|---|---|
| x | y | z | ||||
| Dorsal Anterior Cingulate Cortex/Anterior Midcingulate Cortex | N/A | 101 | 5.06 | 6 | 10 | 38 |
| Anterior Insula | Right | 16 | 4.54 | 36 | 20 | 6 |
| Inferior Frontal Gyrus/Frontal Operculum | Right | 149 | 5.67 | 56 | 10 | 2 |
| Temporoparietal Junction/Superior Temporal Gyrus | Right | 91 | 5.82 | 64 | –40 | 20 |
| Superior Frontal Gyrus/Dorsal Premotor Cortex/Supplementary Motor Area | Right | 17 | 4.72 | 18 | 0 | 68 |
| Midbrain | Right | 74 | 5.29 | 10 | –32 | –10 |
| Inferior frontal gyrus | Left | 2 | 4.35 | –56 | 0 | 2 |
-
Note. MNI coordinates and t values represent significant peak voxels of each cluster. Statistical significance was calculated using t tests implemented within the SPM software with an FWE corrected alpha level of α = .05.
Appendix 5—table 1
Beta coefficients from regression model.
| Model | Unstandardized | Standard Error | Standardized | t | p | |
|---|---|---|---|---|---|---|
| H₀ | (Intercept) | 0.642 | 0.028 | 23.284 | <.001 | |
| H1 | (Intercept) | 0.434 | 0.044 | 9.773 | <.001 | |
| R IFG | 0.088 | 0.086 | 0.105 | 1.026 | 0.306 | |
| R TPJ | 0.136 | 0.088 | 0.133 | 1.551 | 0.122 | |
| R Midbrain | 0.178 | 0.107 | 0.122 | 1.671 | 0.096 | |
| R dPMC | 0.077 | 0.105 | 0.065 | 0.733 | 0.464 | |
| dACC | –0.064 | 0.092 | –0.072 | –0.699 | 0.485 | |
| R AI | 0.000 | 0.080 | 0.000 | 0.011 | 0.992 | |
| R SPL | 0.039 | 0.062 | 0.047 | 0.618 | 0.537 | |
| L SFG | 0.079 | 0.085 | 0.075 | 0.939 | 0.349 | |
| L TPJ | –0.011 | 0.070 | –0.013 | –0.162 | 0.872 | |
-
Note. Coefficient results obtained from regression analysis within the JASP software (JASP Team (2020). JASP (Version 0.14.1) [Computer software]) using eigenvariates from implicated whole brain regions as independent regressors of individual differences in conditioned SCR. Abbreviations: R = Right; L = Left; TPJ = Temporoparietal Junction; IFG = Inferior Frontal Gyrus; dACC = dorsal Anterior Cingulate Cortex; dPMC = dorsal Premotor Cortex; AI = Anterior Insula; SPL = Superior Parietal Lobe.
Appendix 6—table 1
Whole brain CS+ > CS- BOLD contrast activations.
| Cluster | Brain regions with peaks within cluster | t | Peak MNI Coordinates | ||
|---|---|---|---|---|---|
| x | y | z | |||
| Cluster 1 (46343 voxels): insula, ventral striatum, inferior, middle and superior frontal cortex, thalamus, midbrain/brainstem, anterior and midcingulate cortex, supplementary motor area, middle and superior temporal gyri, supramarginal gyrus, inferior and superior parietal cortex, amygdala, cerebellum. | - | > 4.34 | - | - | - |
| Right Insula | 21.71 | 36 | 24 | 2 | |
| Left Insula | 18.71 | –32 | 24 | -4 | |
| Left Insula | 17.55 | –40 | 18 | -4 | |
| Right Frontal Operculum | 17.06 | 56 | 6 | 2 | |
| Supplementary Motor Area | 19.24 | 4 | 6 | 50 | |
| Supplementary Motor Area/Midcingulate Cortex | 19.21 | 2 | 8 | 46 | |
| Right Caudate | 18.35 | 10 | 6 | 4 | |
| Left Caudate | 17.20 | –10 | 6 | 2 | |
| Thalamus | 20.10 | 4 | –24 | -2 | |
| Right Temporoparietal Junction | 17.86 | 50 | –32 | 20 | |
| Right Precentral Gyrus | 16.29 | 46 | 2 | 46 | |
| Cluster 2 (217 voxels): Right Cuneus | |||||
| Right Cuneus | 8.46 | 14 | –72 | 38 | |
| Cluster 3 (208 voxels): Left Middle Prefrontal Cortex | |||||
| Left Middle Prefrontal cortex | 6.33 | –38 | 46 | 24 | |
| Cluster 4 (69 voxels): Left Cuneus, Left Posterior Precuneus | Left Posterior Precuneus | 6.04 | –10 | –74 | 38 |
| Cluster 5 (61 voxels): Left dorsal Cerebellum, Left Fusiform Gyrus | Left Cerebellum VI | 5.61 | –34 | –60 | –26 |
| Left Cerebellum VI | 5.05 | –38 | –64 | –24 | |
| Left Fusiform Gyrus | 5.00 | –40 | –66 | –20 | |
| Left Cerebellum VI | 4.45 | –38 | –54 | –26 | |
| Cluster 6 (15 voxels): Right Visual Cortex | Right Visual Cortex | 4.96 | 20 | –64 | 6 |
| Cluster 7 (9 voxels): Left Visual Cortex | Left Visual Cortex | 4.69 | –14 | –70 | 4 |
| Cluster 8 (8 voxels): Right Frontal Pole/Superior Orbital Gyrus | Right Frontal Pole | 4.56 | 26 | 60 | -6 |
-
Note. MNI coordinates and t values represent significant peak voxels within each cluster. Statistical significance was calculated using t tests with an FWE corrected alpha level of α = .05 within the SPM software.
Appendix 7—table 1
Sensitivity analysis.
Correlations to conditioned SCR in the significant peak voxels from the main analysis altering SCR definitions, covariates, and sample selection. Pearson correlation coefficients (r) were included to permit comparison of effect sizes. Main analysis refers to the analysis presented in the results section of the paper. Square-root transformed refers to using square-root transformed Z-transformed SCRs. The PsPM analysis used a model-based approach to compute SCR based on a Dynamic Causal Modeling framework. Please notice that this model may not be optimally suited to our data, see Appendix 8 for more information. 5 s SCR window used 5 s time window following CS-onset for peak-detection. Non-reinforced trials only included non-reinforced CS+ trials when computing SCR and neural responses. To control for shock expectancy effects, we included average shock expectancy (rated online as 0 or 1) as a covariate correlating with whole-brain responses. We also controlled for eventual familial influences by splitting twin pairs and correlating SCR in the two samples (first twin, second twin) to brain contrast values. Note that the full sample included twin pairs as well as twins without a sibling, hence there is a discrepancy in the number of twins for first and second columns (135 vs 146). Correlations between SCR to US and CS+ > CS- contrast-values are shown in the last column for reference.
| Anatomical region | Hemisphere | Voxels | x | y | z | Main analysis | Square-root transformed | PsPM (DCM) analysis | 5 s SCR time-window | Non-reinforced trials | Control for shock expectancy | Excluding first twin | Excluding second twin | SCR to US | |||||||||
|---|---|---|---|---|---|---|---|---|---|---|---|---|---|---|---|---|---|---|---|---|---|---|---|
| t283 (r) | t283 (r) | t283 (r) | t283 (r) | t283 (r) | t282 (r) | t135 (r) | t146 (r) | t283 (r) | |||||||||||||||
| Dorsal Anterior Cingulate Cortex/ Anterior Midcingulate Cortex | N/A | 50 | 6 | 8 | 40 | 4.79 | (0.27) | 4.58 | (0.26) | 3.63 | (0.21) | 4.95 | (0.28) | 4.55 | (0.26) | 3.07 | (0.18) | 3.90 | (0.32) | 2.78 | (0.23) | 0.00 | (0.00) |
| Anterior Insula | Right | 20 | 36 | 20 | 6 | 4.65 | (0.27) | 4.50 | (0.26) | 4.51 | (0.26) | 5.01 | (0.29) | 3.95 | (0.23) | 2.69 | (0.16) | 3.68 | (0.30) | 2.88 | (0.24) | 0.31 | (0.02) |
| Inferior Frontal Gyrus/Frontal Operculum | Right | 138 | 56 | 10 | 2 | 5.80 | (0.33) | 5.31 | (0.30) | 5.03 | (0.29) | 5.94 | (0.33) | 5.02 | (0.29) | 3.44 | (0.20) | 4.69 | (0.37) | 3.59 | (0.30) | 1.35 | (0.08) |
| Temporoparietal Junction/Superior Temporal Gyrus | Right | 81 | 64 | –40 | 20 | 5.66 | (0.32) | 5.45 | (0.31) | 4.39 | (0.25) | 5.68 | (0.32) | 4.49 | (0.26) | 3.54 | (0.21) | 4.22 | (0.34) | 3.81 | (0.31) | 1.44 | (0.09) |
| Superior Frontal Gyrus/Dorsal Premotor Cortex | Right | 44 | 18 | 0 | 68 | 5.21 | (0.30) | 5.25 | (0.30) | 4.12 | (0.24) | 5.20 | (0.30) | 4.73 | (0.27) | 2.58 | (0.15) | 3.70 | (0.30) | 3.65 | (0.30) | 0.91 | (0.05) |
| Midbrain | Right | 59 | 10 | –30 | –12 | 5.22 | (0.30) | 5.14 | (0.29) | 5.06 | (0.29) | 5.03 | (0.29) | 4.53 | (0.26) | 2.78 | (0.16) | 4.00 | (0.33) | 3.31 | (0.27) | 2.51 | (0.15) |
| Superior Parietal Lobe/Postcentral Gyrus | Right | 3 | 22 | –46 | 70 | 4.52 | (0.26) | 4.28 | (0.25) | 3.89 | (0.23) | 4.97 | (0.28) | 4.30 | (0.25) | 2.89 | (0.17) | 3.51 | (0.29) | 2.86 | (0.24) | 1.81 | (0.11) |
| Superior Frontal Gyrus/Dorsal Premotor Cortex | Left | 2 | –14 | -2 | 72 | 4.46 | (0.26) | 4.39 | (0.25) | 4.12 | (0.24) | 4.71 | (0.27) | 4.45 | (0.26) | 3.05 | (0.18) | 4.52 | (0.36) | 2.00 | (0.17) | 0.56 | (0.03) |
| Temporoparietal Junction/Superior Temporal Gyrus | Left | 1 | –62 | –36 | 22 | 4.37 | (0.25) | 4.24 | (0.24) | 3.02 | (0.18) | 5.07 | (0.29) | 3.93 | (0.23) | 1.81 | (0.11) | 3.73 | (0.31) | 2.55 | (0.21) | 1.65 | (0.10) |
-
Note. MNI coordinates and t values represent significant peak voxels of clusters from the main analysis. Statistical significance was calculated using t tests implemented within the SPM software with an FWE corrected alpha level of α = .05.
Additional files
Download links
A two-part list of links to download the article, or parts of the article, in various formats.
Downloads (link to download the article as PDF)
Open citations (links to open the citations from this article in various online reference manager services)
Cite this article (links to download the citations from this article in formats compatible with various reference manager tools)
Whole brain correlates of individual differences in skin conductance responses during discriminative fear conditioning to social cues
eLife 11:e69686.
https://doi.org/10.7554/eLife.69686


