Dysregulated heparan sulfate proteoglycan metabolism promotes Ewing sarcoma tumor growth
- Cancer and Blood Disease Institute, Children's Hospital Los Angeles, United States
- Division of Pathology and Laboratory Medicine, Children's Hospital Los Angeles, United States
- Department of Pathology, Keck School of Medicine, University of Southern California, United States
- Department of Pediatrics, Keck School of Medicine, University of Southern California, United States
- Department of Medicine, Keck School of Medicine, University of Southern California, United States
Figures
Figure 1 with 3 supplements

Cre-inducible expression of EWSR1-FLI1 drives small round blue cell tumor (SRBCT) development in zebrafish.
(A) Overview of experimental method. The Tol2 transposon system was used to integrate human EWSR1-FLI1 into the wild-type zebrafish genome by microinjection into single-cell-stage embryos. (enhanced Green Fluorescent Protein) eGFP-positive fish were monitored up to 4 months. (B) Constructs for Cre-inducible expression of EWSR1-FLI1. (C) Incidence of eGFP+ tumors detected in Ubi:RSG-EWSR1-FLI1; Cre RNA (n = 77) injected zebrafish versus Ubi:RSG-EWSR1-FLI1; eGFP RNA (n = 142) and uninjected controls (N = 150) in a wild-type genetic background (p < 0.001 by log-rank test). (D) Representative images of eGFP-positive tumors in zebrafish (top panel) and H&E staining of tumor sections (bottom panel): (I) SRBCT with diffuse skeletal muscle infiltration and (II) visceral SRBCT arising from fin dorsal radial bone. Scale bars, 100 μm. (E) Percent tumor incidence at different anatomic sites.
Figure 1—figure supplement 1
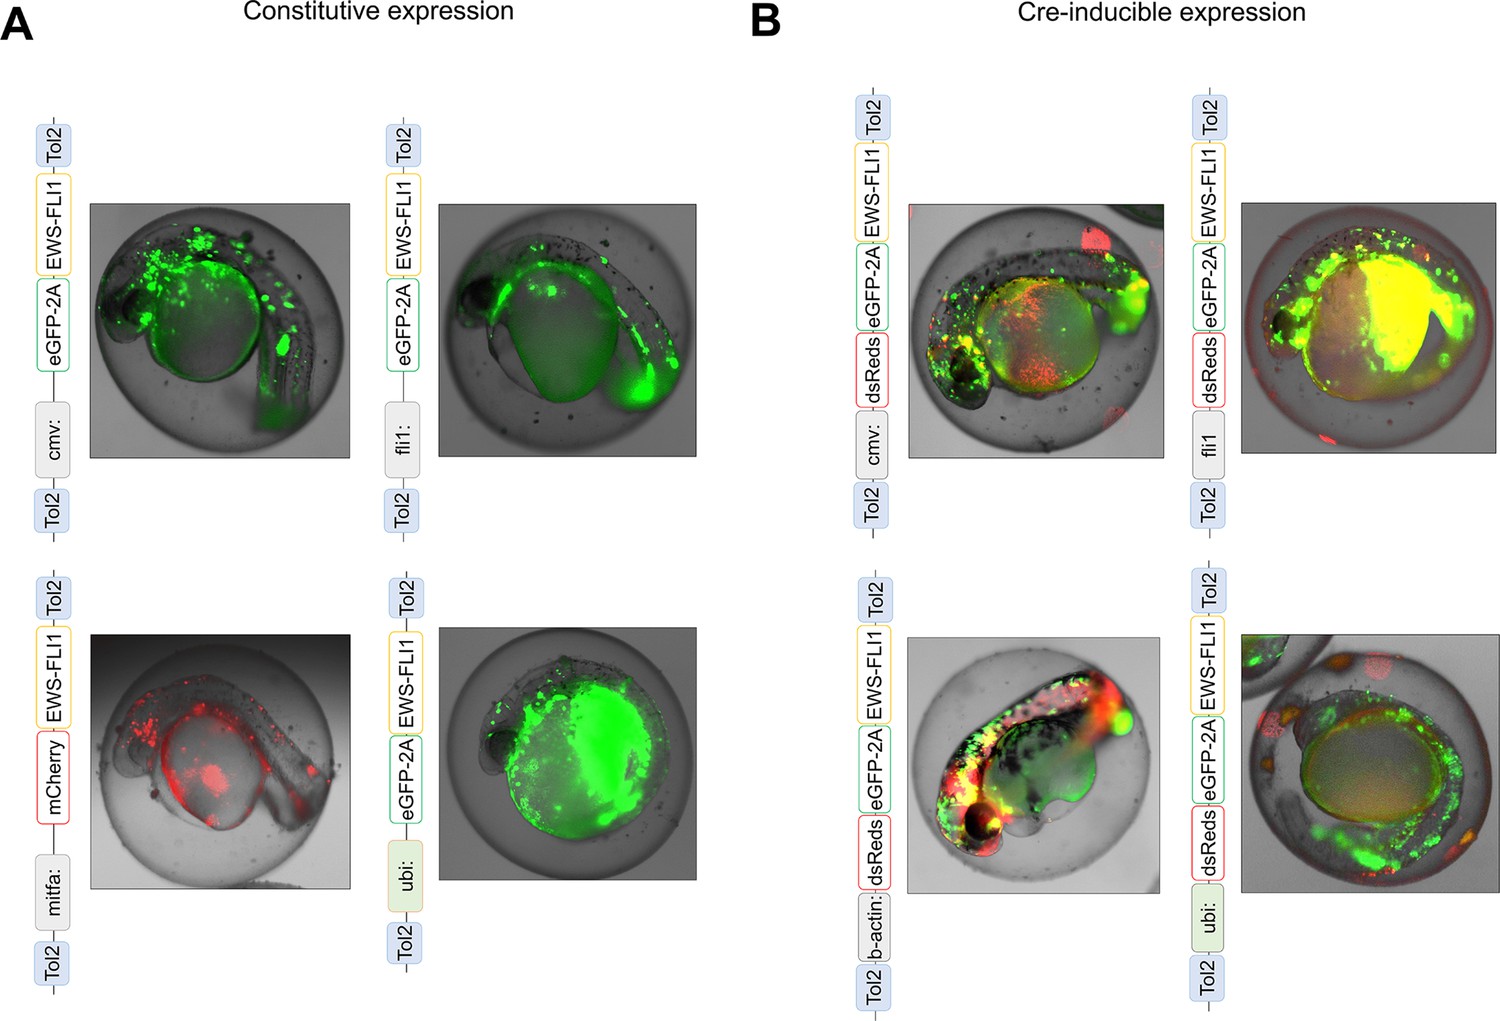
The Tol2 transposon-based system was used to integrate EWSR1-FLI1 into the zebrafish genome by microinjection into single-cell-stage zebrafish embryos.
(A) Scheme of constructs for expression of EWSR1-FLI1 under cmv, fli1, mitfa, ubi promoters. (B) Scheme of constructs for Cre-inducible expression of eGFP-2A-EWSR1-FLI1 under cmv, fli1, b-actin, ubi promoters.
Figure 1—figure supplement 2
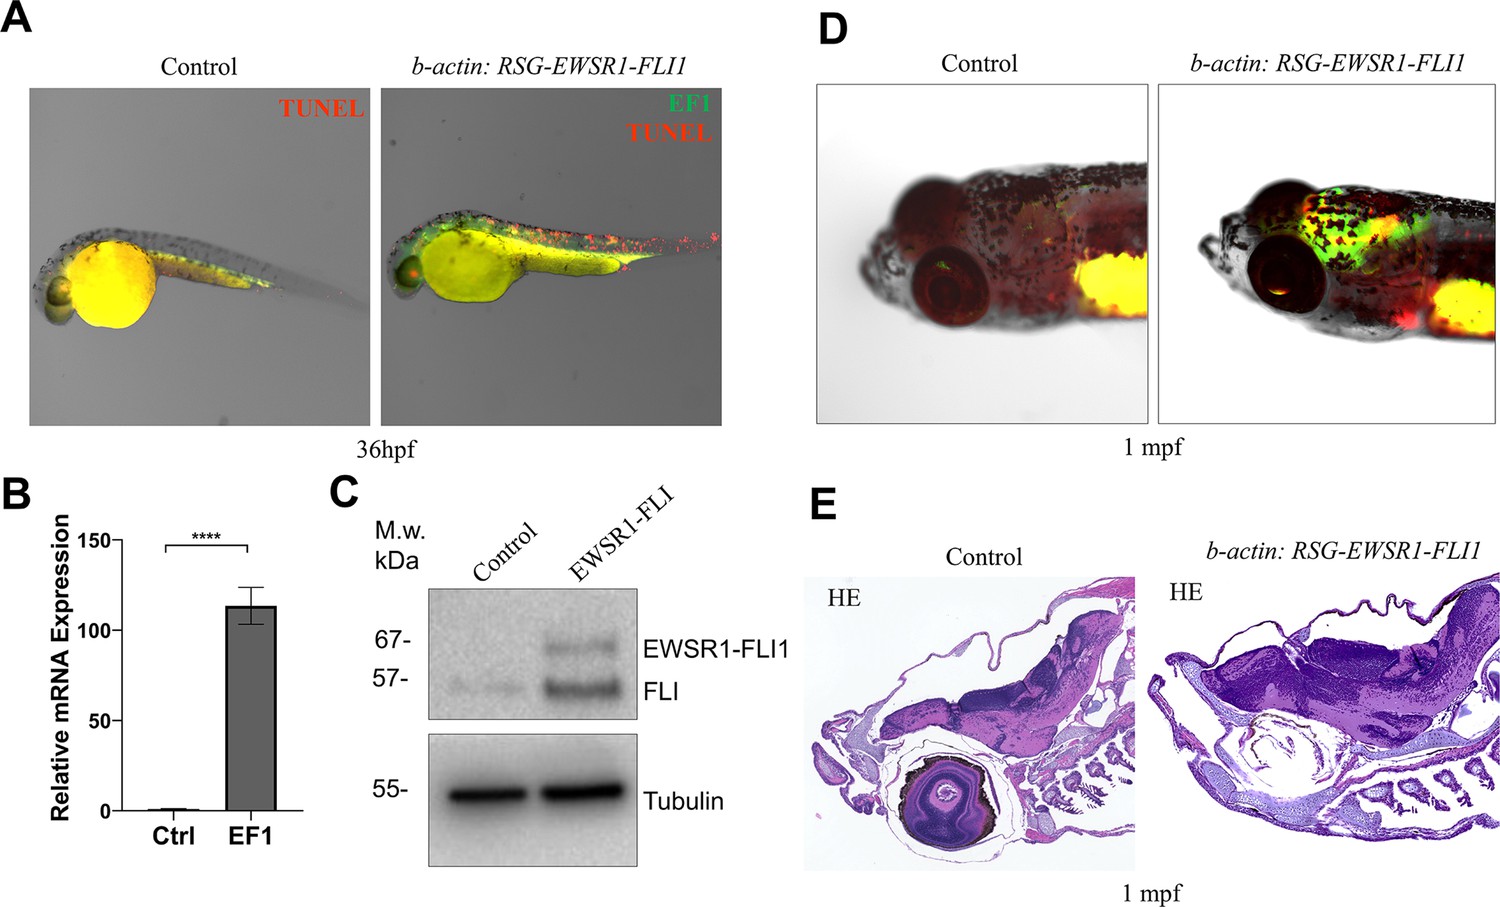
The Tol2 transposon-based system was used to integrate b-actin:RSG-EWSR1-FLI1 into the wild-type zebrafish genome.
Coinjection of Cre mRNA or GFP mRNA was used to generate EWSR1-FLI1-expressing or control zebrafish, respectively. (A) TUNEL assay (red) made on zebrafish expressing eGFP (green) or eGFP2A-EWSR1-FLI1 (green) at 36 hpf. (B) Relative mRNA expression of EWSR1-FLI1 in b-actin:RSG-EWSR1-FLI1 zebrafish injected with Cre RNA or GFP RNA. (C) Expression of EWSR1-FLI1 on the protein level was confirmed by immunoblotting. (D) Representative images of zebrafish expressing EWSR1-FLI1 driven by b-actin promoter at 1 mpf. (E) H&E staining of cell masses formed in the head of zebrafish expressing EWSR1-FLI1 under b-actin promoter (right) and control (left). Error bars represent standard error of the mean (SEM), N = 3, ****p < 0.0001, two-tailed Student’s t-test.
Figure 1—figure supplement 3
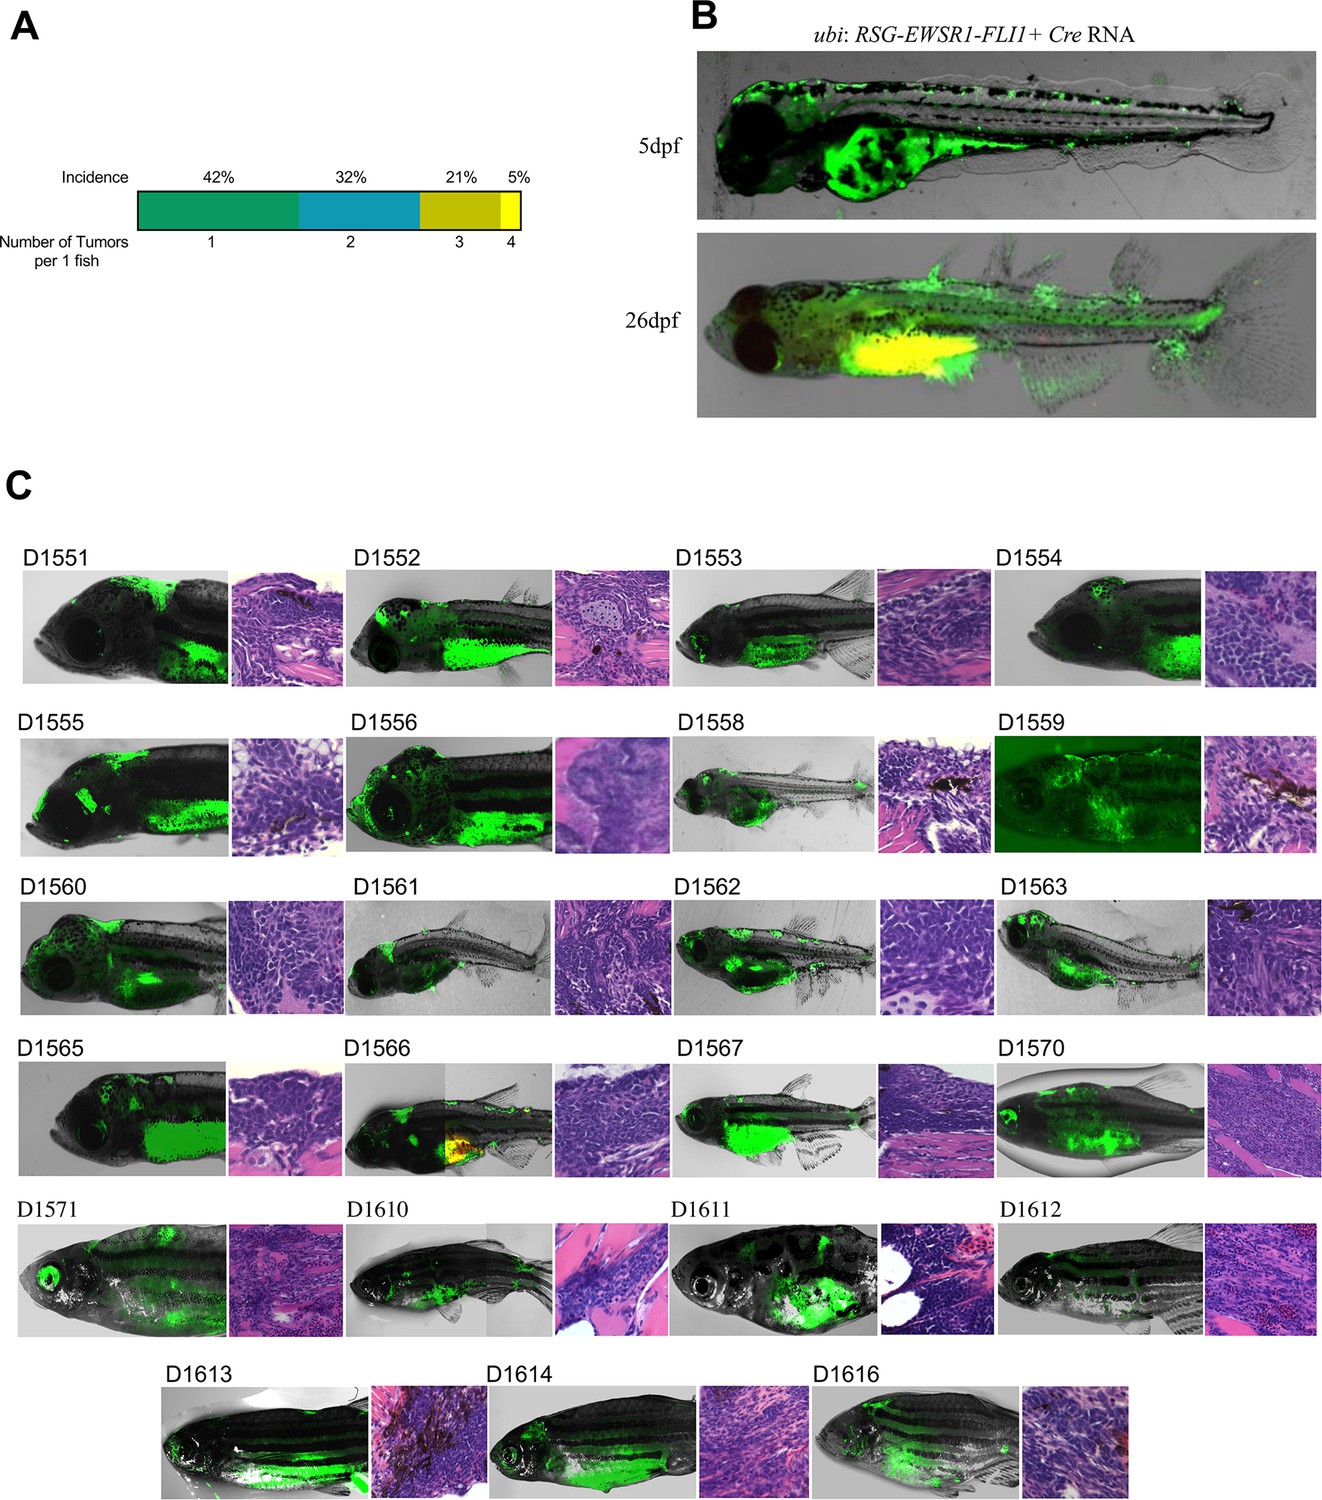
Mosaic model of Ewing sarcoma generated by the microinjection of ubi:RSG-EWSR1-FLI1 plus Cre mRNA into single-cell-stage embryos.
(A) Plot representing the incidence of one, two, three, or four tumors per zebrafish. (B) EWSR1-FLI1 triggers the formation of ectopic fins in zebrafish. (C) Examples of tumors observed in mosaic model of Ewing sarcoma.
Figure 2 with 1 supplement
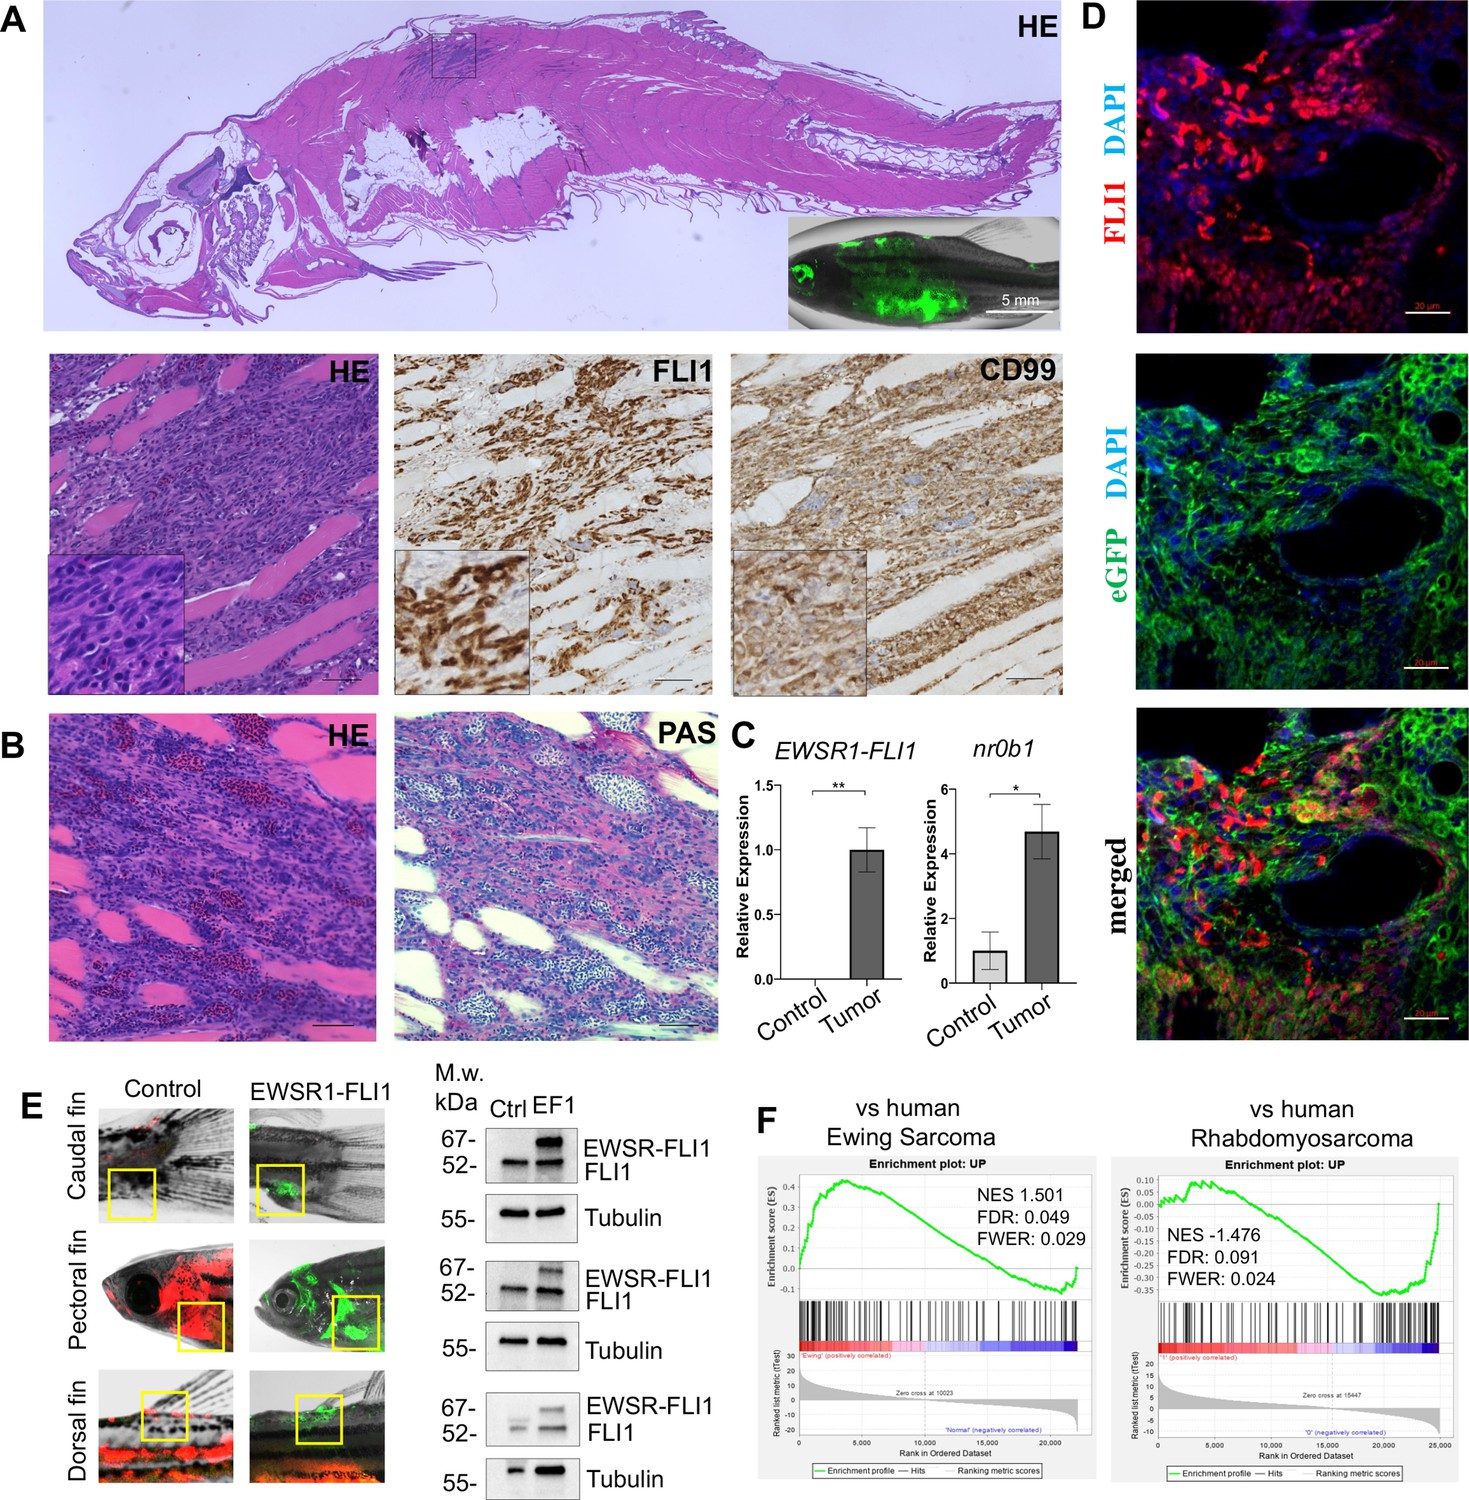
Zebrafish tumors phenocopy human Ewing sarcoma.
(A) Representative image of Ewing sarcoma tumor in WT zebrafish. H&E staining, immunohistochemistry (IHC) staining with anti-FLI1 and anti-CD99 antibodies. Scale bars, 100 μm. (B) H&E and Periodic acid-Schiff (PAS) staining of zebrafish tumors. Scale bars, 50 μm. (C) Relative mRNA expression of human EWSR1-FLI and zebrafish nr0b1 in normal and tumor tissues. Error bars represent standard error of the mean (SEM), N = 3, *p < 0.05, **p < 0.01, two-tailed Student’s t-test. (D) Immunofluorescence staining of zebrafish tumor with anti-eGFP and anti-FLI1 antibodies. Scale bars, 20 μm. (E) Validation of EWSR1-FLI1 expression in tumors at different sites by immunoblotting. (F) Gene set enrichment analysis (GSEA) comparing the enrichment of common upregulated proteins at dorsal, caudal and pectoral fin tumors to human Ewing sarcoma (GSE17674) and human Rhabdomyosarcoma (GSE108022) datasets.
Figure 2—figure supplement 1
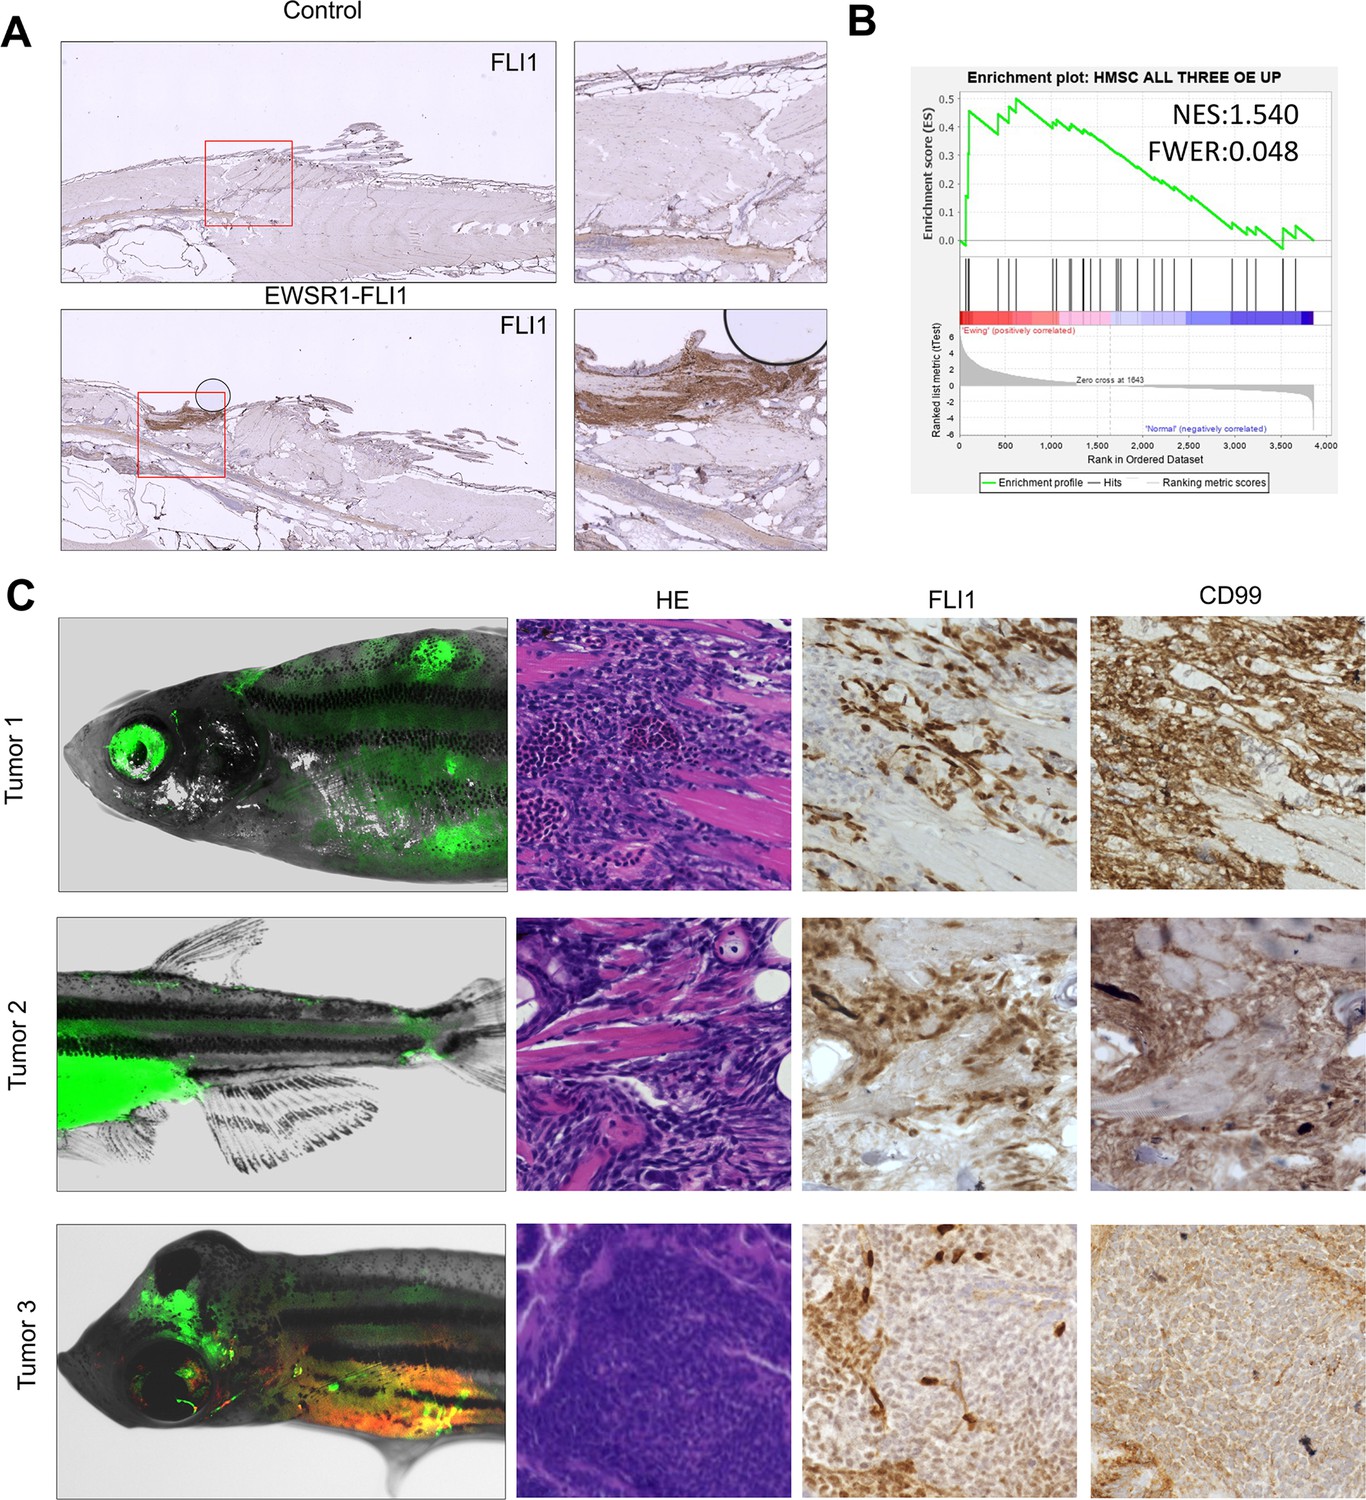
Validation of zebrafish model of Ewing sarcoma.
(A) Immunohistochemistry (IHC) staining of sections of zebrafish tumor and control zebrafish with anti-FLI1 antibodies. (B) Gene set enrichment analysis (GSEA) showing the enrichment of proteins significantly upregulated in human mesenchymal cells after the expression of EWSR1-FLI1 oncofusion (oncotarget-09-14428 s009) in zebrafish tumors. (C) Representative image of Ewing sarcoma tumors located in zebrafish trunk, caudal fin, and head in WT zebrafish. H&E staining, IHC staining with anti-FLI1 and anti-CD99 antibodies.
Figure 3

Validation of EWSR1-FLI expression in zebrafish embryos.
(A) Rate of embryos expressing EWSR1-FLI1 during the first 10 days of development (N = 524 Survival). Uninjected embryos (N = 528) as well as embryos injected with ubi:RSG-EWSR1-FLI1 plus GFP mRNA (N = 328) or ubi:RSG plus Cre mRNA (N = 304) were used as negative controls (p < 0.001 by log-rank test). (B) Timeline of zebrafish development after injection with ubi:RSG-EWSR1-FLI1 plus Cre mRNA (top panel). Zebrafish injected with ubi:RSG-EWSR1-FLI1 plus GFP mRNA (middle panel) or ubi:RSG plus Cre mRNA (bottom panel) were used as negative controls. Images were taken at 12 hpf, 24 hpf, and 5 dpf time points. (C) Representative image of embryos with low (GFP+), medium (GFP++), and high (GFP+++) levels of EWSR1-FLI1 expression. (D) Relative mRNA expression of EWSR1-FLI1 in embryos with low (GFP+), medium (GFP++), and high (GFP+++) levels of EWSR1-FLI1 according to eGFP signal. (E) Immunoblot confirming the expression of EWSR1-FLI1 protein in embryos with low (GFP+), medium (GFP++), and high (GFP+++) levels of EWSR1-FLI1 expression according to eGFP signal. (F) RNA scope staining of control and EWSR1-FLI1-positive embryos for nkx2.2a (529751-C2 RNAscope Probe – Dr-nkx2.2a-C2) and eGFP (538851 RNAscope Probe – EGFP-O4).
Figure 4 with 1 supplement
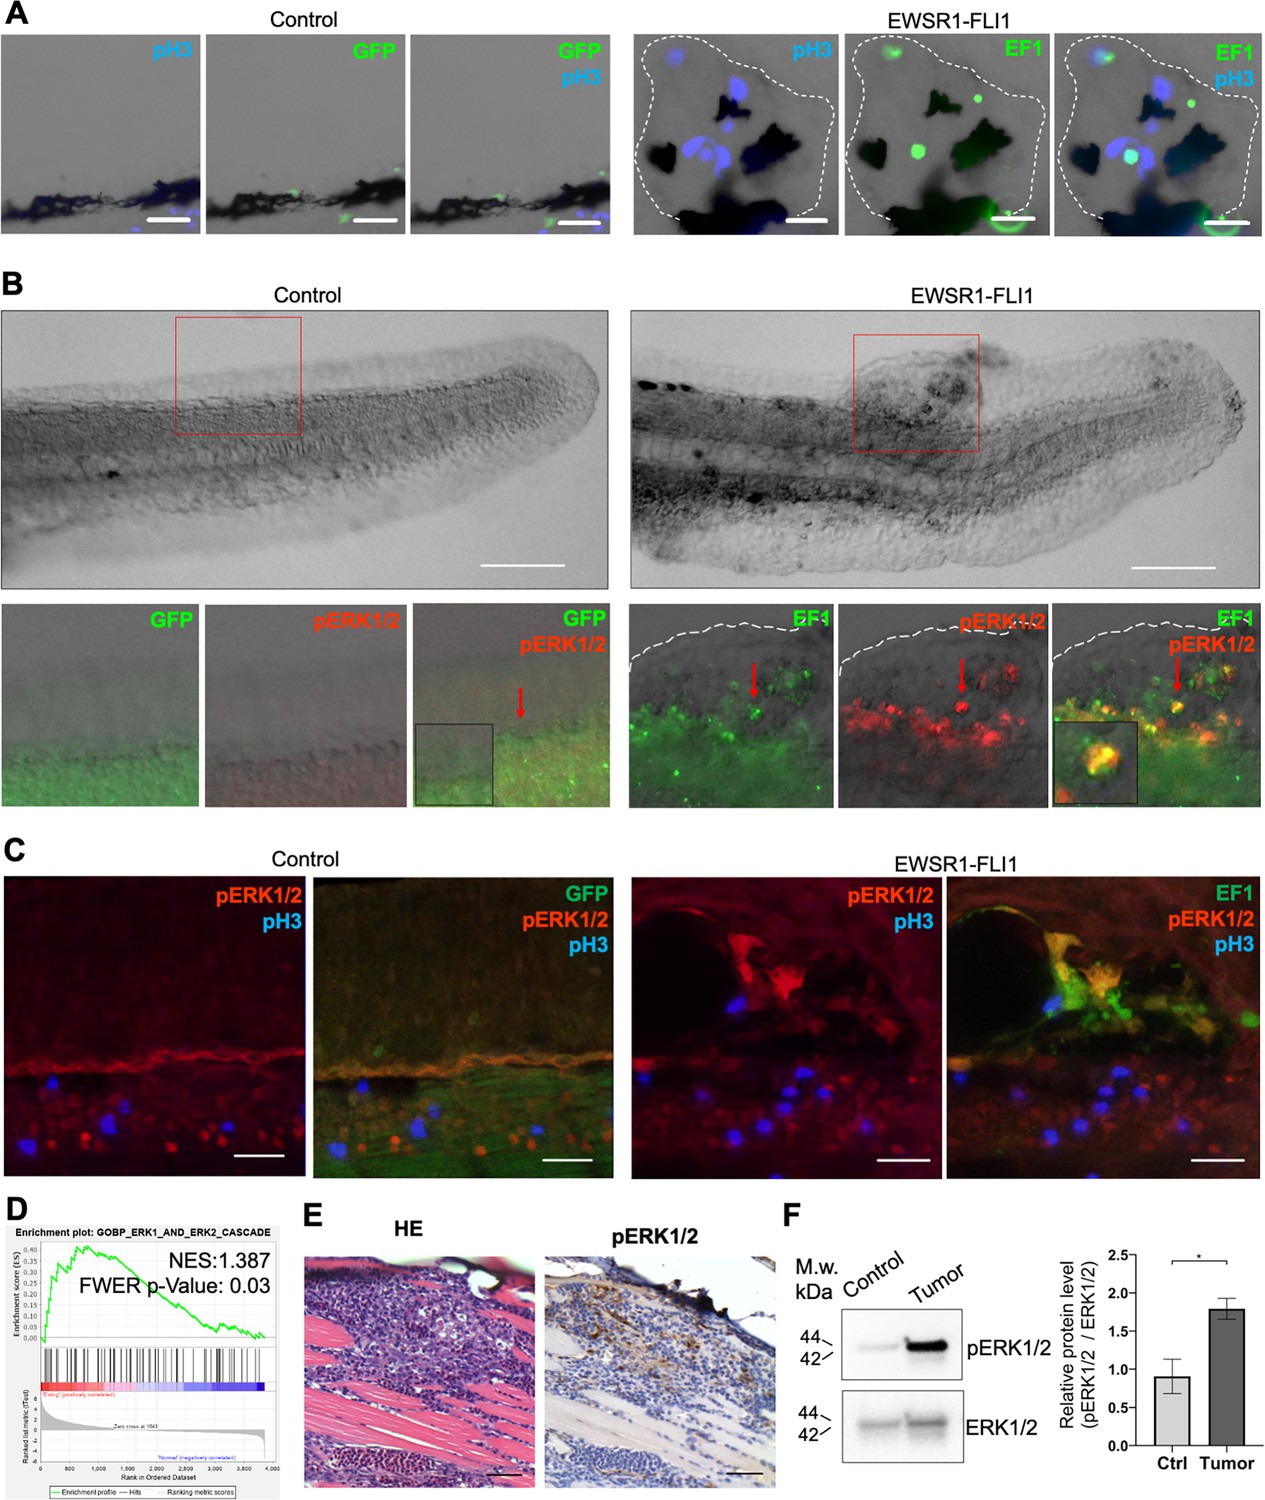
EWSR1-FLI expression activates the ERK1/2 signaling pathway in vivo.
(A) Immunofluorescent staining of eGFP (control) and eGFP2A-EWSR1-FLI1-expressing embryos at 48 hpf. Blue: phosphohistone H3. Green: eGFP or eGFP2A-EWSR1-FLI1. A small region of the dorsal surface is shown. The outgrowth is outlined with a dashed white line. Scale bars, 20 μm. (B) Immunofluorescent staining of eGFP (control) and eGFP2A-EWSR1-FLI1-expressing embryos at 24 hpf for pERK1/2 (red) and eGFP. Scale bars, 100 μm. (C) Immunofluorescent staining of eGFP (control) and eGFP2A-EWSR1-FLI1-expressing embryos at 48 hpf for pERK1/2 (red), pH3 (blue), or eGFP (green). Scale bars, 20 μm. (D) Gene set enrichment analysis (GSEA) showing the enrichment of genes associated with ERK1/2 pathway (GOBP_ERK1_AND_ERK2_CASCADE) in zebrafish tumors. (E) Immunostaining of zebrafish tumor for pERK1/2. (F) Immunoblot analysis and immunoblot quantification of pERK1/2 and ERK1/2 levels in tumor and normal tissue. Error bars represent standard error of the mean (SEM), N = 3, *p < 0.05, two-tailed Student’s t-test.
Figure 4—figure supplement 1
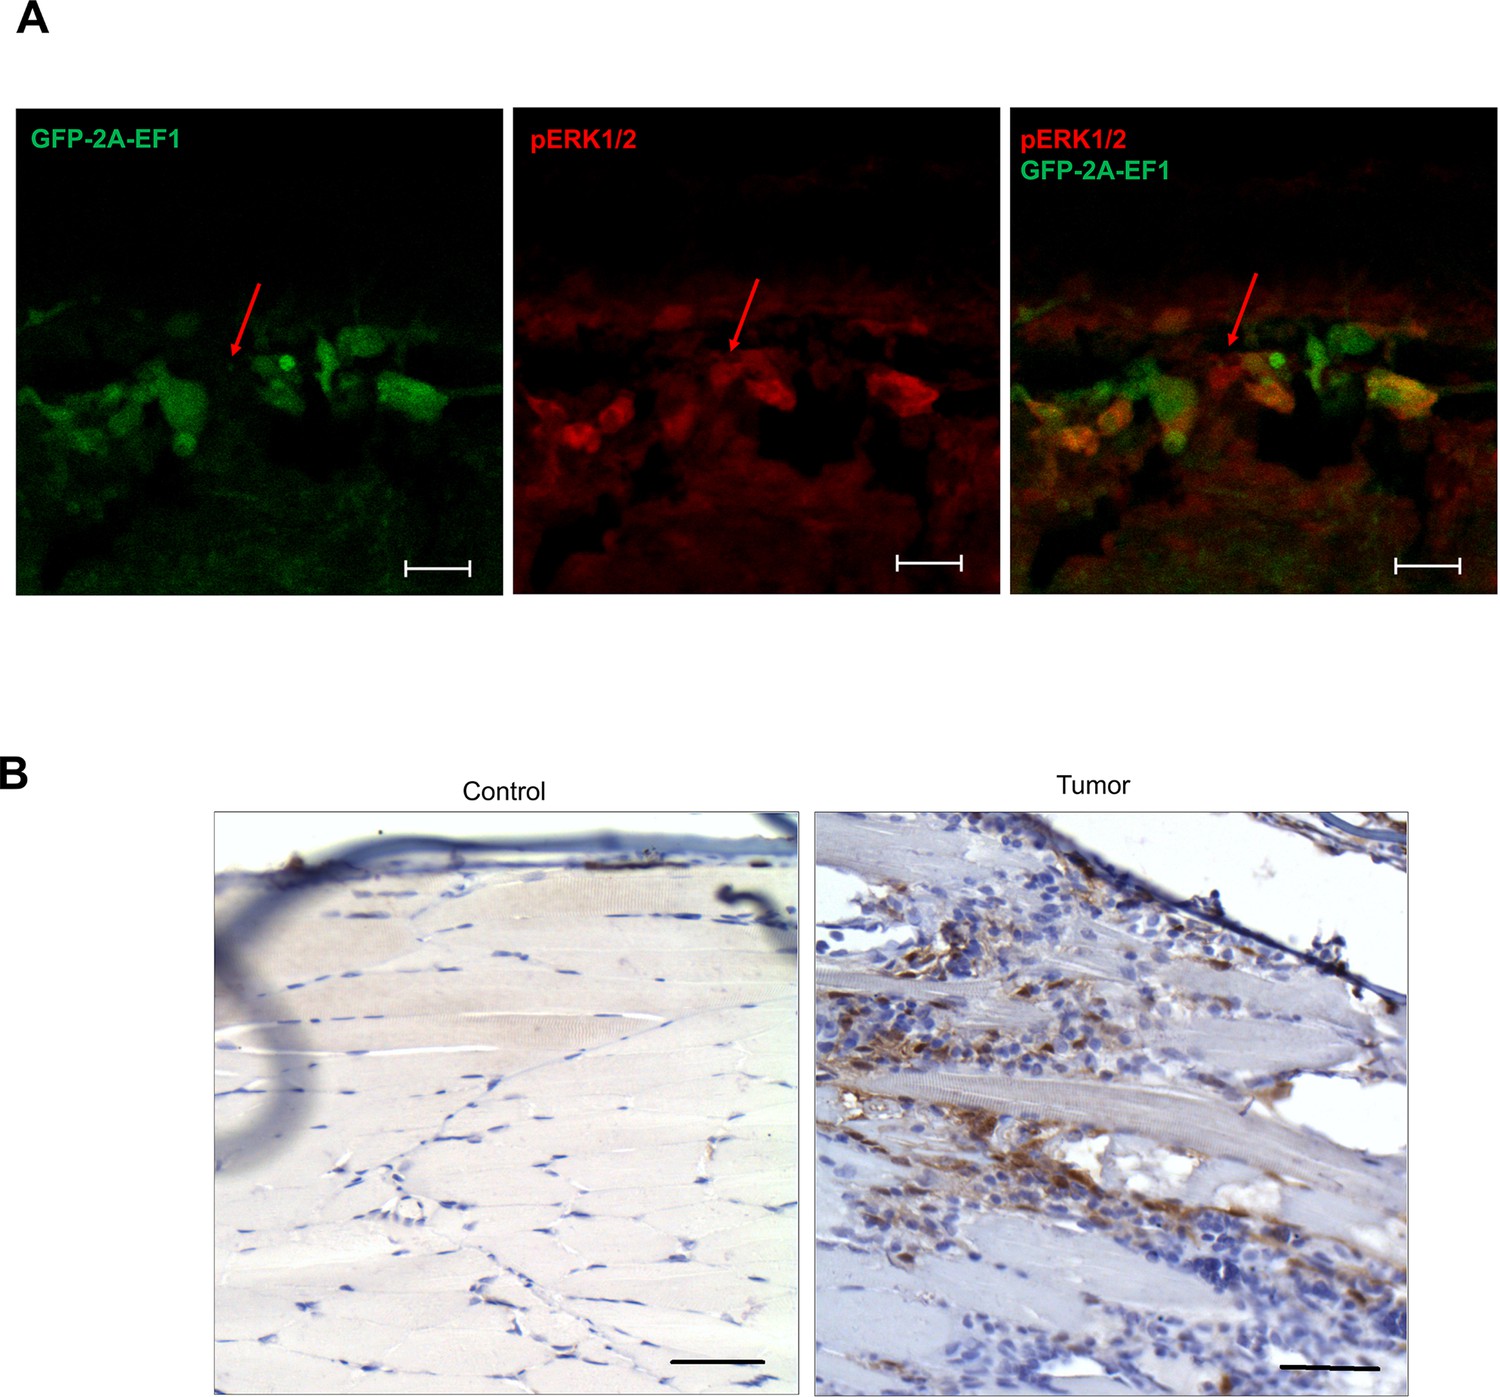
Immunostaining of zebrafish tumors for pERK1/2.
(A) Immunofluorescence staining of zebrafish outgrowth at 72 hpf for pERK1/2 (red) eGFP2A-EWSR1-FLI1 (green). Arrows indicate cells positive for pERK1/2 and negative for EWSR1-FLI1. Scale bars, 20 μm. (B) Immunohistochemistry (IHC) staining of sections of zebrafish tumor and control zebrafish with anti-pERK1/2 antibodies. Scale bars, 100 μm.
Figure 5

Liquid chromatography–mass spectrometry (LC–MS/MS) analysis of proteins affected by EWSR1-FLI1 expression in developing zebrafish.
(A) Heat map representing the differentially expressed proteins dysregulated by EWSR1-FLI1 at 24 and 48 hpf. (B) Quantitative analysis of the differentially expressed proteins at 24 and 48 hpf. (C, D) Gene ontology (GO) analysis of differentially expressed proteins at 48 hpf. (E) Volcano plot of significantly downregulated and upregulated proteins in EWSR1-FLI1-expressing embryos. (F) Heatmap of the most differentially expressed proteins involved in proteoglycan metabolism in human Ewing sarcoma compared to normal tissue (GSE17674).
Figure 6
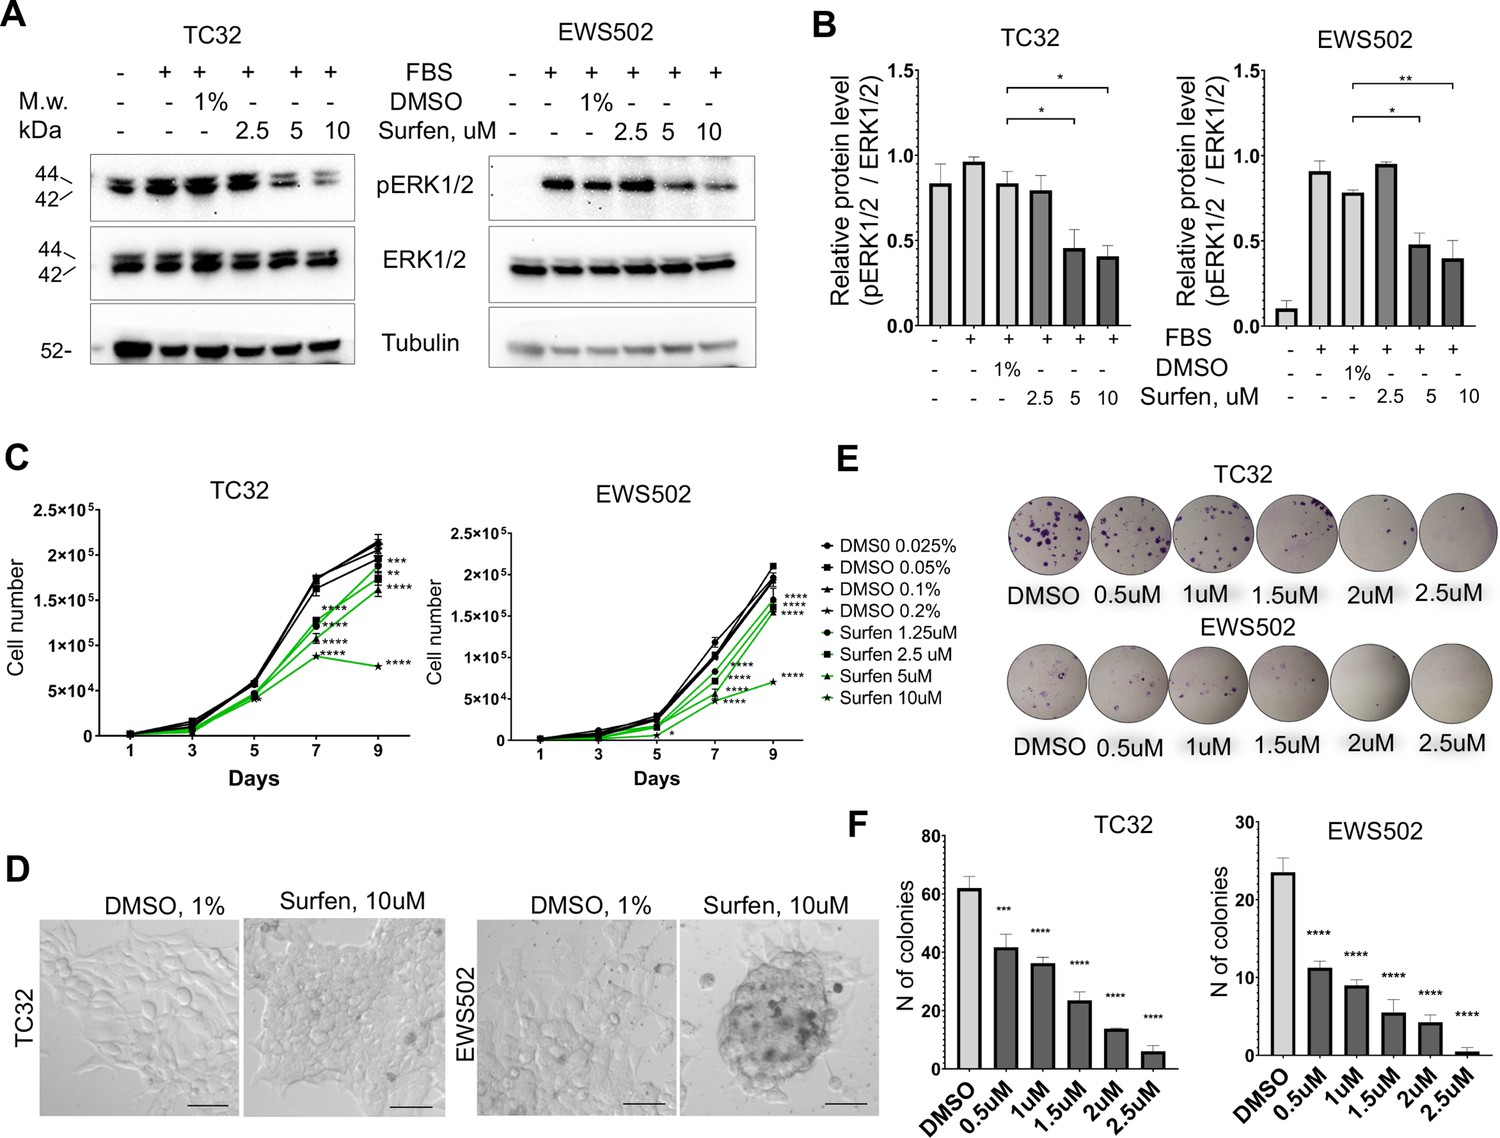
Surfen treatment impairs ERK1/2 signaling and growth of Ewing sarcoma cells.
(A) Immunoblot analysis of pERK1/2, ERK1/2, and tubulin levels in TC32 and EWS502 cells treated with surfen or DMSO. (B) Immunoblot quantification of pERK1/2 expression level relative to ERK1/2 in TC32 and EWS502 cells treated with surfen or DMSO vehicle control. Error bars represent standard error of the mean (SEM), N = 3, *p < 0.05, **p < 0.01, based on one-way analysis of variance (ANOVA) test. (C) Proliferation rates of TC32 and EWS502 cells treated with surfen or DMSO. Error bars represent SEM, N = 3, **p < 0.01, ***p < 0.001, ****p < 0.0001 based on one-way ANOVA test. (D) Morphological changes in TC32 and EWS502 cells after surfen or DMSO treatment. (E) Clonogenic assay and (F) clonogenic assay quantification of TC32 and EWS502 cells treated with surfen or DMSO. Error bars represent SEM, N = 4, ***p < 0.001, ****p < 0.0001 based on one-way ANOVA test.
Figure 7 with 3 supplements
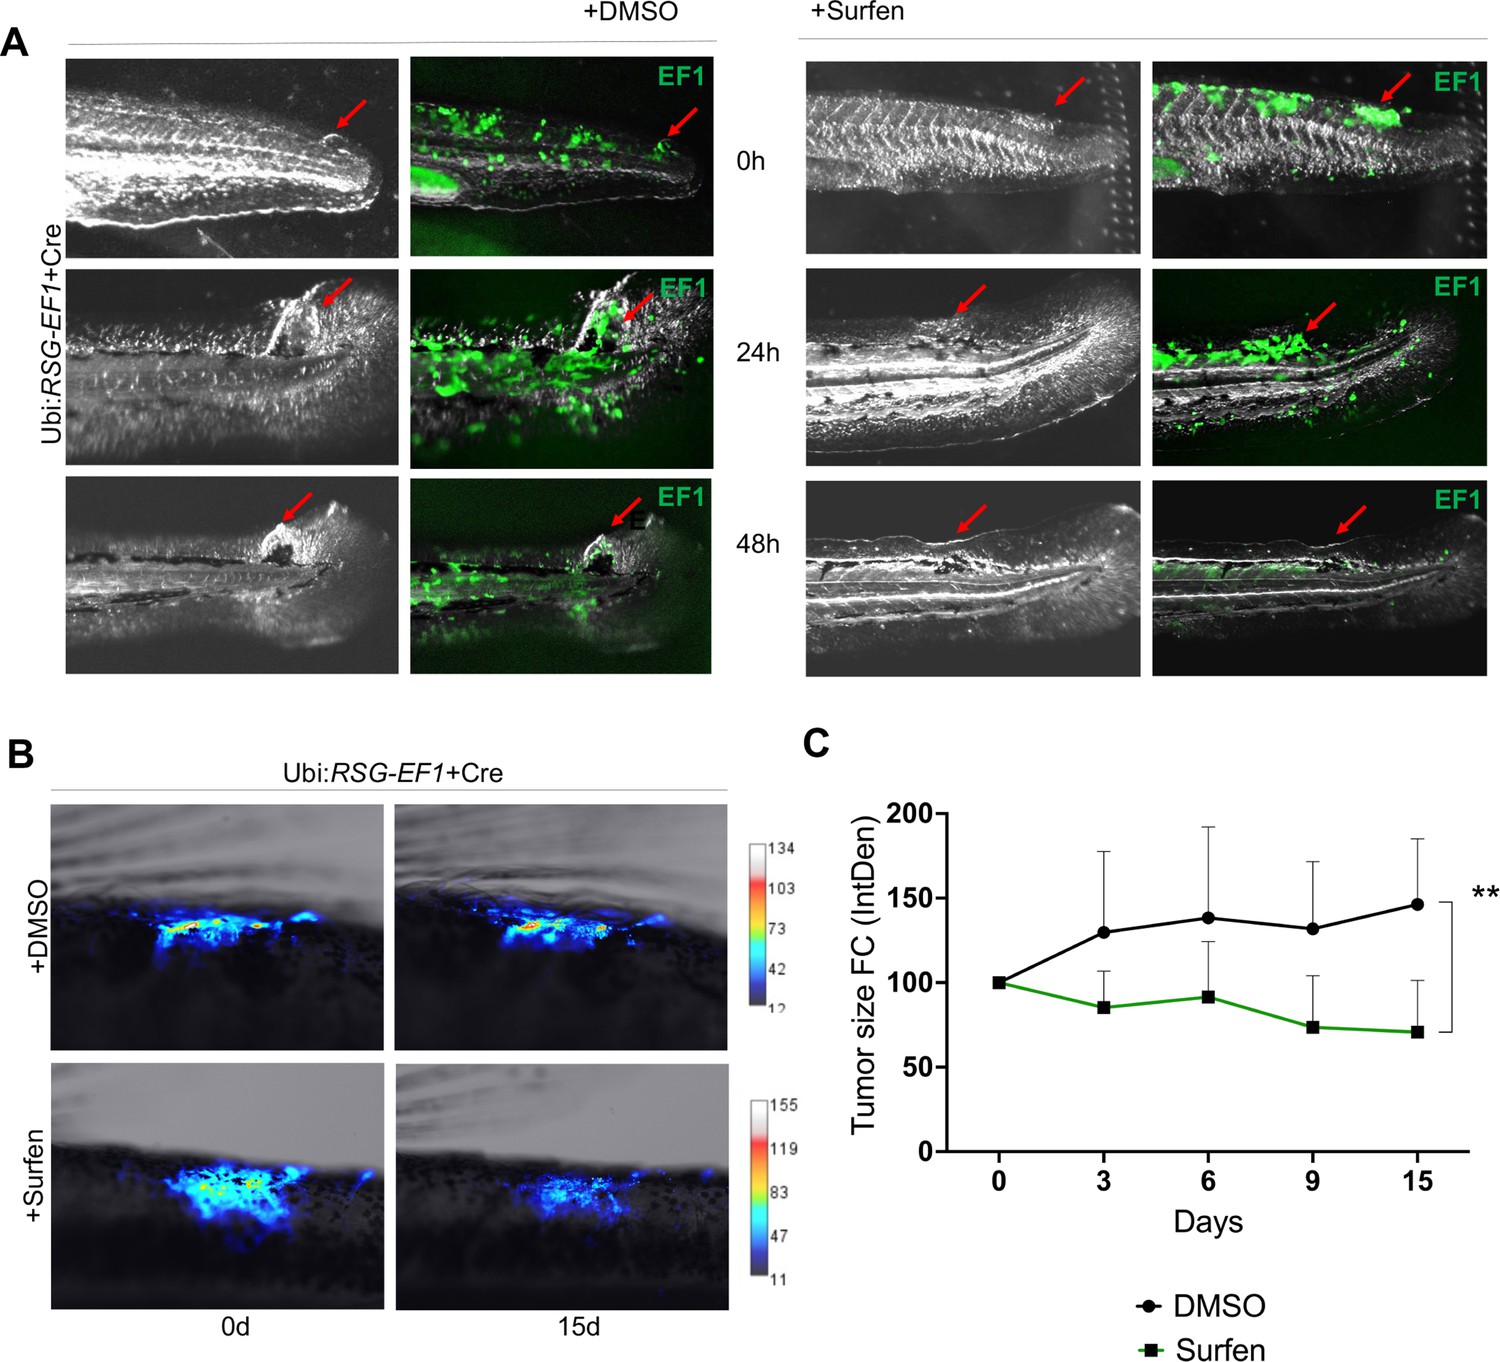
Surfen inhibits EWSR1-FLI1-mediated growth in the zebrafish model.
(A) Surfen inhibits the development of EWSR1-FLI1-driven outgrowths in zebrafish larvae. (B) Surfen inhibits progression of EWSR1-FLI1-driven tumors. Animals with eGFP-positive tumors were grouped for treatment with surfen (N = 4) or DMSO (N = 4). Each group had tumors similar in size and location. (C) Quantification of changes in tumor size based on fluorescence intensity. Error bars represent SD, **p < 0.01 based on two-way analysis of variance (ANOVA) test.
Figure 7—figure supplement 1
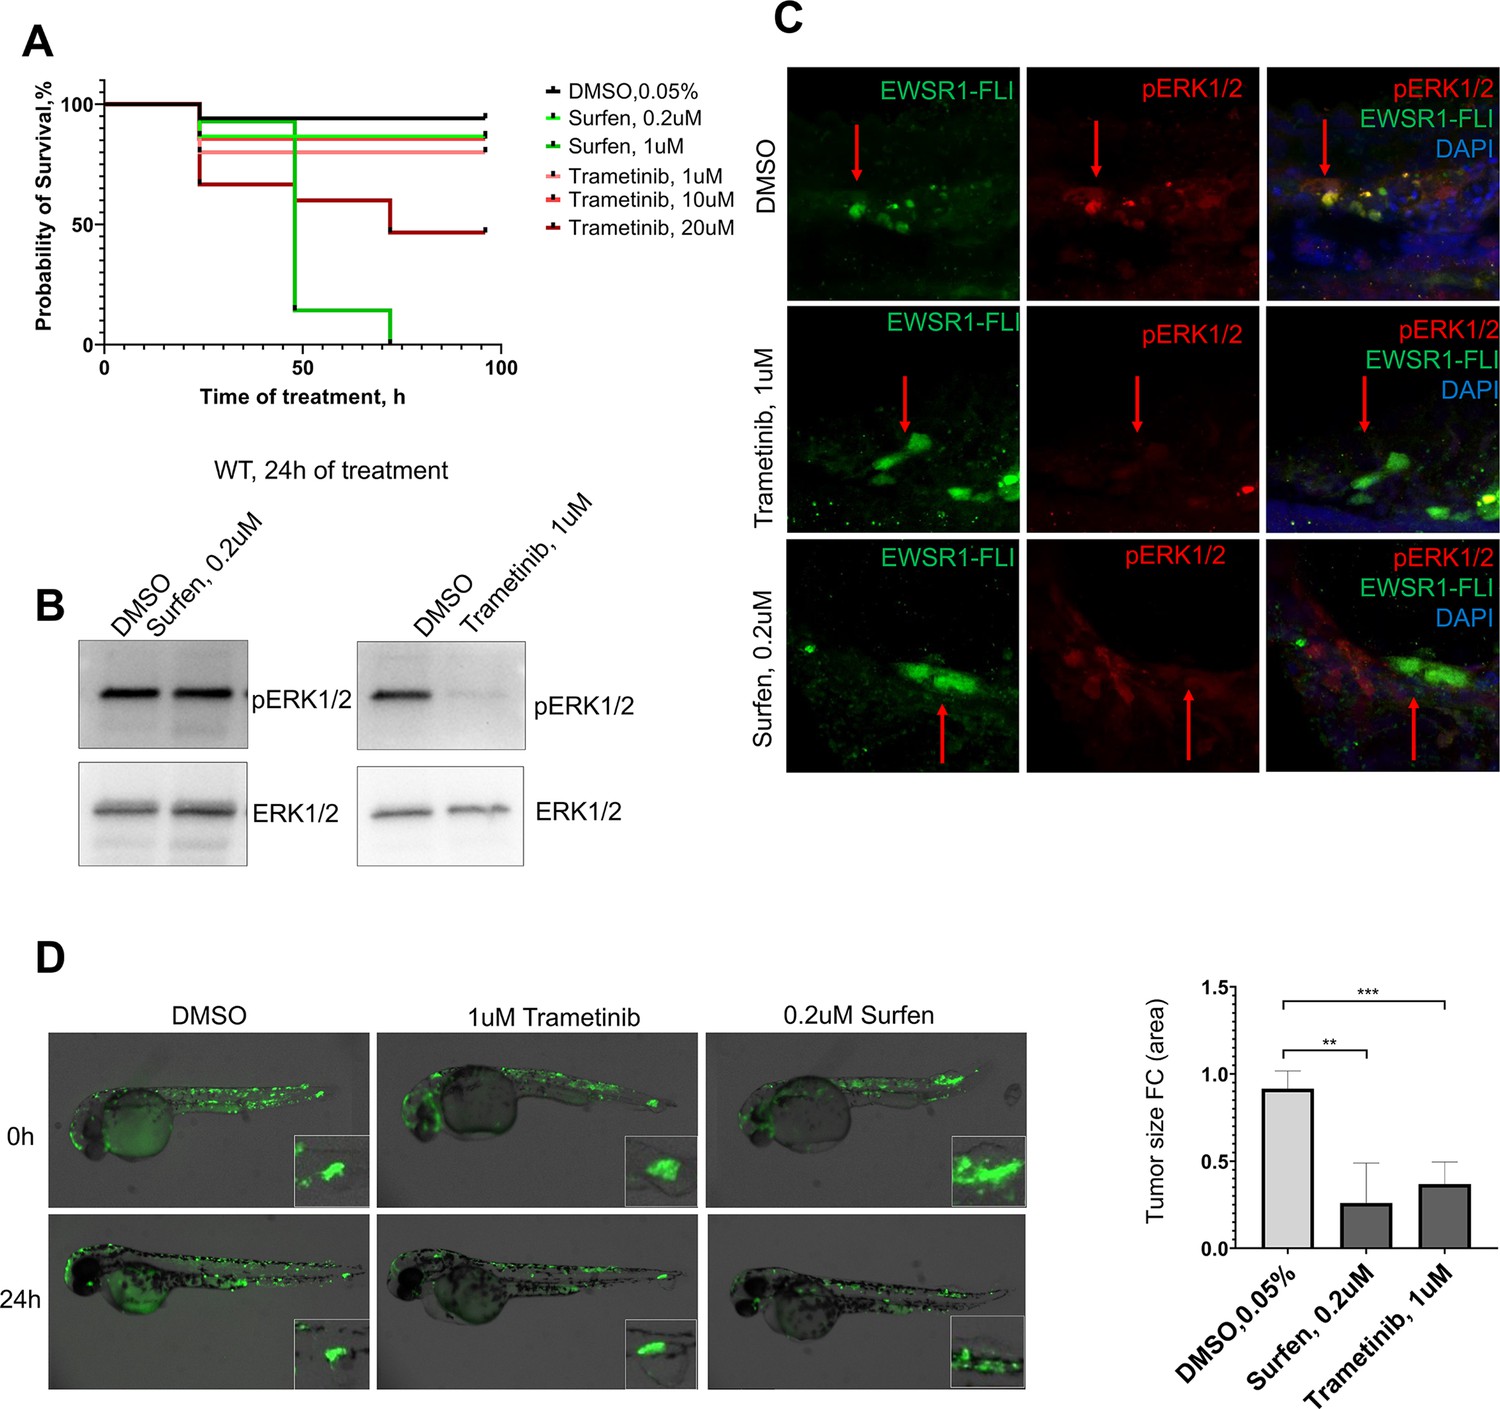
Targeting ERK signaling pathway in embryonic model of Ewing sarcoma.
(A) Survival rate of embryos during the first 100 hr of treatment with surfen (0.2 and 1 μM), trametinib (1, 10, and 20 μM), or DMSO. (B) Immunoblot confirming the level of pERK1/2 in embryos treated with 0.2 μM surfen, 1 μM trametinib, or DMSO. (C) Immunofluorescence staining of 48 hpf zebrafish embryos for pERK1/2 (red), and EWSR1-FLI1 (green) after treatment with surfen, trametinib, or DMSO for 24 hr. (D) Surfen and trametinib inhibit the development of EWSR1-FLI1-driven outgrowths in zebrafish larvae. Error bars represent standard error of the mean (SEM), N = 3, **p < 0.01, ***p < 0.001 based on one-way analysis of variance (ANOVA) test.
Figure 7—figure supplement 2
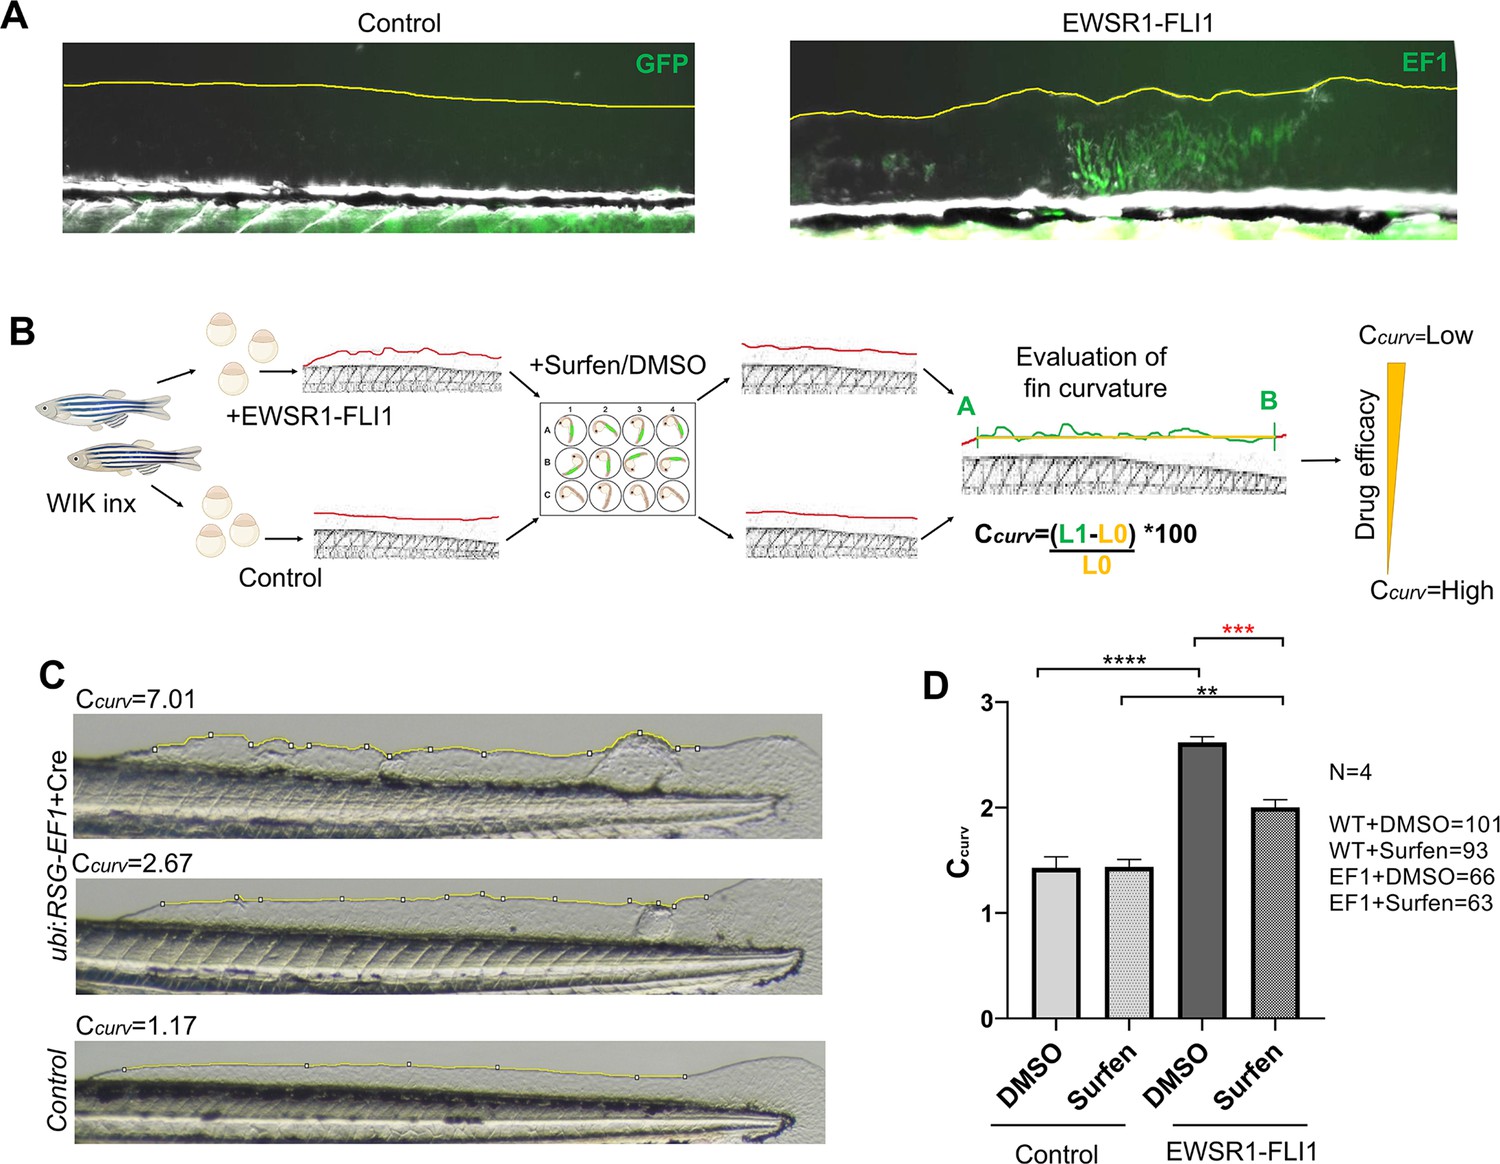
Changes in the fin shape driven by EWSR1-FLI1 expression as a readout for drug screening.
(A) Changes in the fin shape driven by EWSR1-FLI1 expression. Embryos injected with ubi:RSG-EWSR1-FLI1 plus GFP mRNA were used as control. (B) Scheme of surfen treatment. Wild-type embryos were used for the integration of EWSR1-FLI1 into the zebrafish genome. Uninjected fish were used as control. eGFP-positive embryos were treated with surfen at 0.2 μM or 0.2% DMSO vehicle control. Zebrafish were imaged after 48 hr of treatment. Coefficient of curvature was calculated as following Ccurv = (L1 − L0)/L0 × 100, where L1 is the length of fin edge between points A and B and L0 is the length of the straight line between those two points. (C) Fins representing different coefficients of curvature Ccurv caused by EWSR1-FLI1 expression. (D) Treatment of fish expressing EWSR1-FLI1 with surfen leads to the rescue of fin curvature phenotype. Error bars represent SD, biological replicates N = 4, **p < 0.01, ***p < 0.001, ****p < 0.0001 based on one-way analysis of variance (ANOVA) test.
Figure 7—figure supplement 3
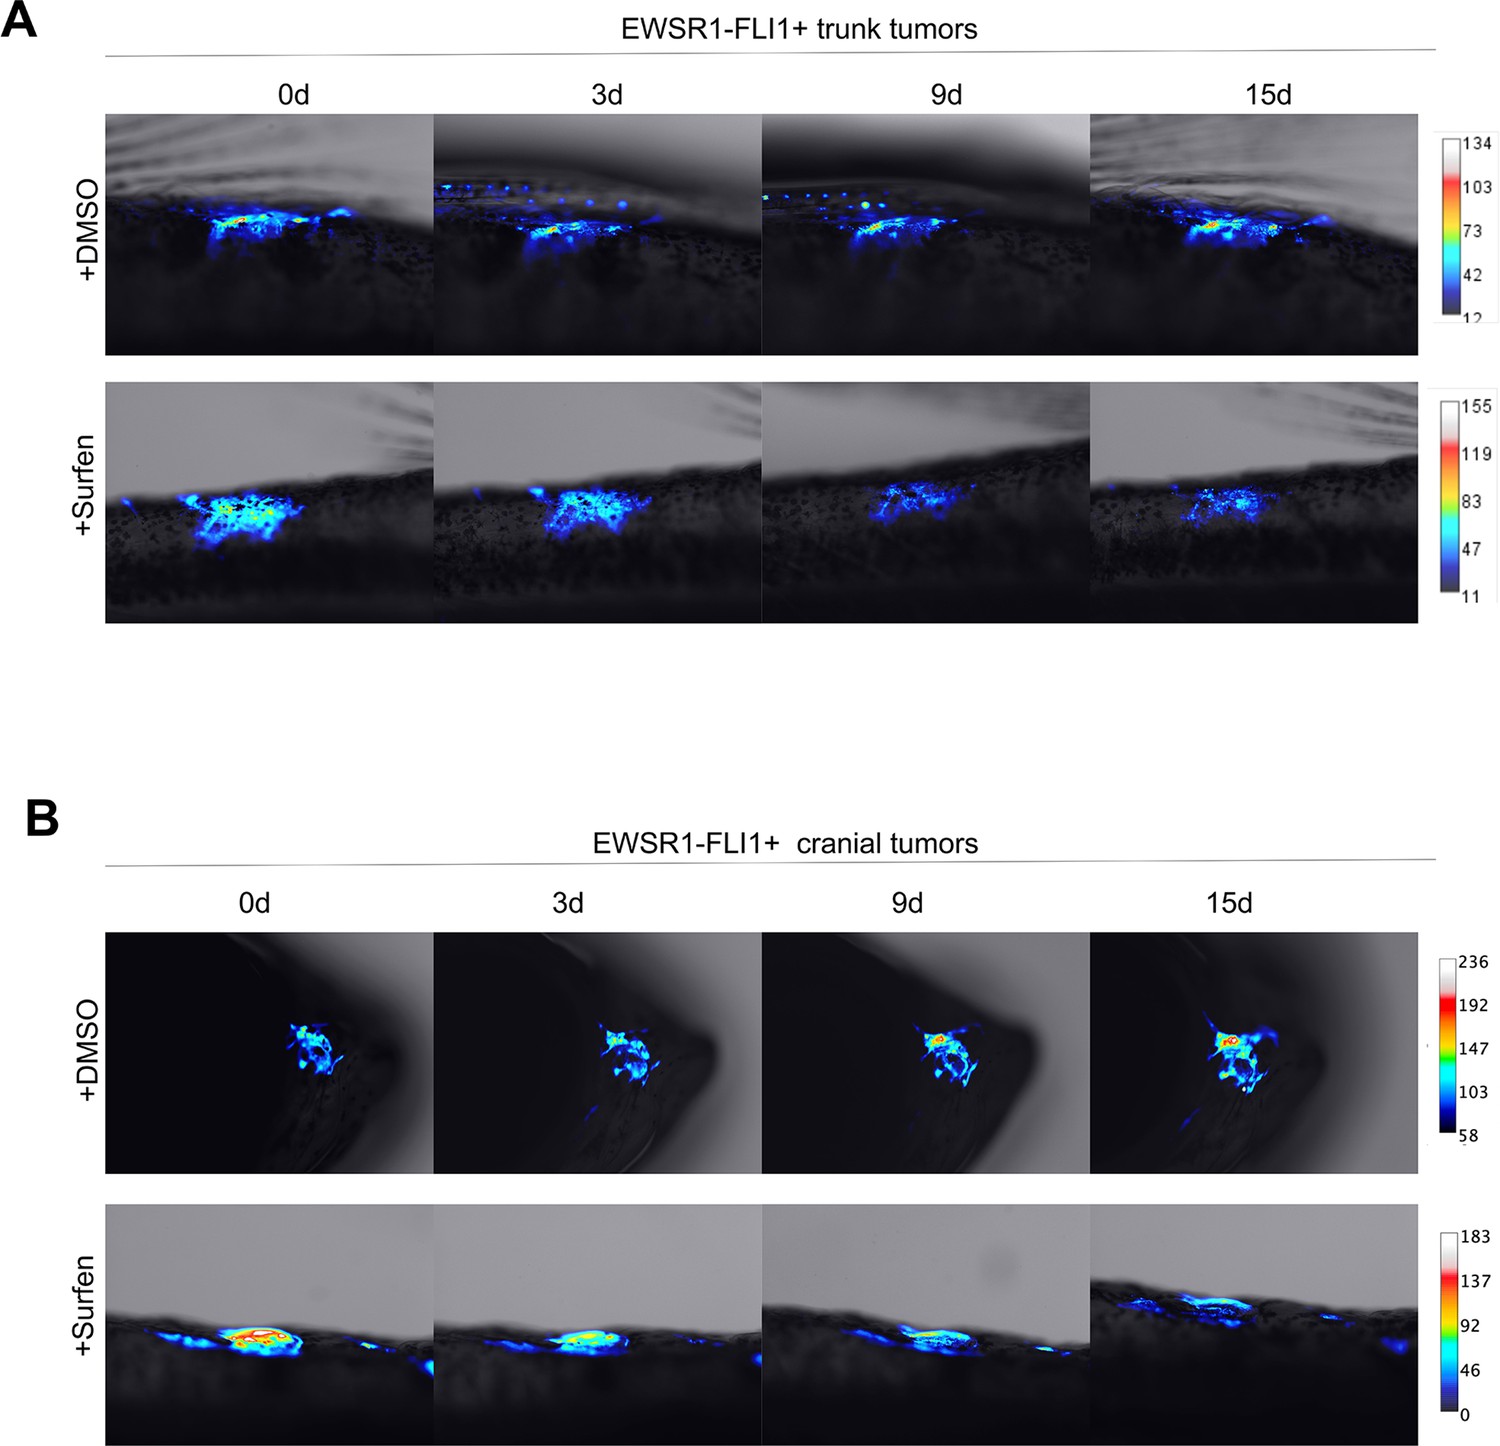
Surfen inhibits progression of EWSR1-FLI1-driven tumors.
Representative image of animals with trunk (A) and head (B) tumors. Timeline of zebrafish tumor progression after 0, 3, 9, and 15 days of surfen or DMSO treatment.
Videos
Video 1
Immunofluorescence staining of a 48 hpf zebrafish embryo for pERK1/2 (red), EWSR1-FLI1 (green), and pH3 (blue).
Confocal Z-stack focusing on a region of the trunk and dorsal fin.
Video 2
Immunofluorescence staining of a tumor outgrowth in 48 hpf zebrafish embryo for pERK1/2 (red), EWSR1-FLI1 (green), and pH3 (blue).
Confocal Z-stack focusing on an outgrowth arising from the dorsal surface of the embryo.
Additional files
-
Supplementary file 1
Detailed characterization of zebrafish tumors driven by EWSR1-FLI1 expression.
- https://cdn.elifesciences.org/articles/69734/elife-69734-supp1-v2.xlsx
-
Supplementary file 2
List of downregulated and upregulated proteins identified by LC–MS/MS analysis in EWSR1-FLI1-expressing tumors, p < 0.05.
- https://cdn.elifesciences.org/articles/69734/elife-69734-supp2-v2.xlsx
-
Supplementary file 3
List of downregulated and upregulated proteins identified by LC–MS/MS analysis in EWSR1-FLI1-expressing embryos, p < 0.05.
- https://cdn.elifesciences.org/articles/69734/elife-69734-supp3-v2.xlsx
-
Supplementary file 4
List of primers for RT-PCR.
- https://cdn.elifesciences.org/articles/69734/elife-69734-supp4-v2.xlsx
-
Source data 1
Western Blot - Raw Data.
- https://cdn.elifesciences.org/articles/69734/elife-69734-data1-v2.zip
-
Transparent reporting form
- https://cdn.elifesciences.org/articles/69734/elife-69734-transrepform1-v2.docx
Download links
A two-part list of links to download the article, or parts of the article, in various formats.
Downloads (link to download the article as PDF)
Open citations (links to open the citations from this article in various online reference manager services)
Cite this article (links to download the citations from this article in formats compatible with various reference manager tools)
Dysregulated heparan sulfate proteoglycan metabolism promotes Ewing sarcoma tumor growth
eLife 11:e69734.
https://doi.org/10.7554/eLife.69734


