Convergent, functionally independent signaling by mu and delta opioid receptors in hippocampal parvalbumin interneurons
- Division of Biological Sciences, Neurobiology Section, University of California, San Diego, United States
Figures
Figure 1 with 1 supplement
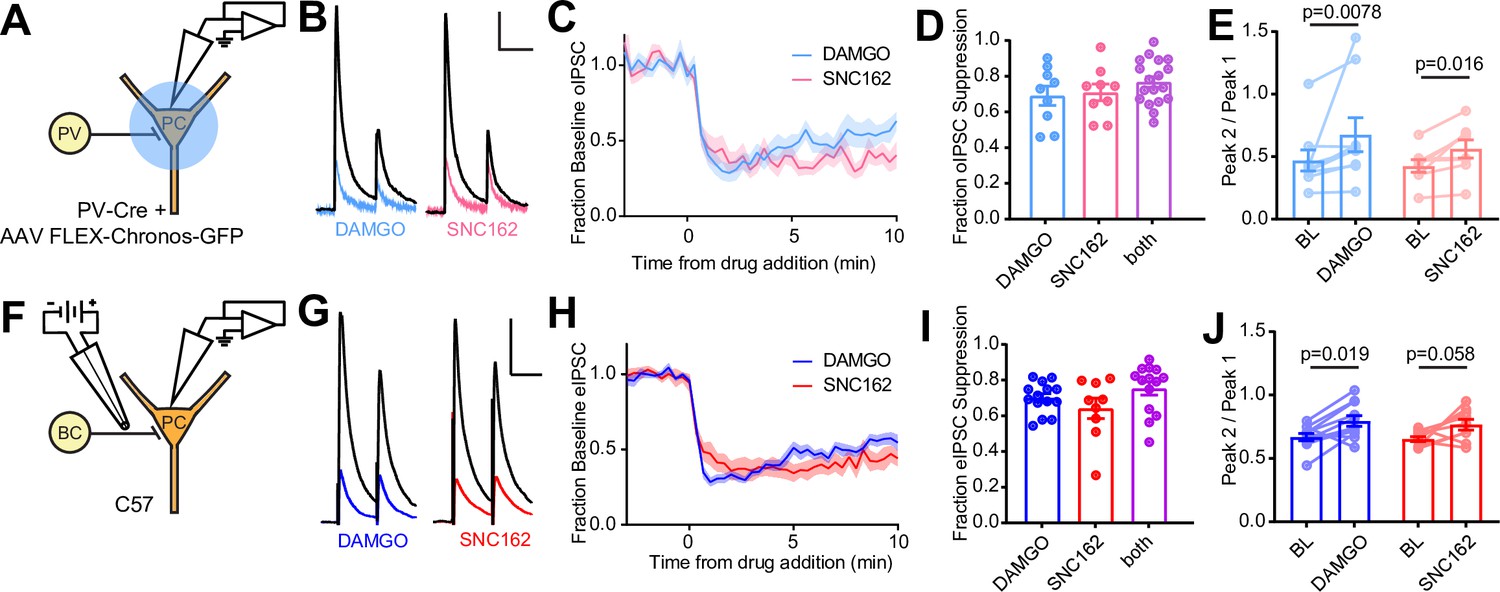
Electrophysiological recordings of opioid-sensitive synaptic output from hippocampal parvalbumin basket cells.
(A) Schematic of the experimental configuration for recording optogenetically evoked inhibitory synaptic transmission in PV-Cre mice. (B) Representative optically evoked IPSC (oIPSC) pairs (50 ms interval) recorded from a pyramidal cell. Black traces are the average of six baseline sweeps, and colored traces are the average of six sweeps after addition of either [d-Ala2, NMe-Phe4, Gly-ol5]enkephalin (DAMGO) (1 µM, blue) or SNC162 (1 µM, red). Scale bars: x = 40 ms, y = 100 pA. (C) Baseline-normalized, average oIPSC amplitude over time during bath application of DAMGO (n = 9 cells from six mice) or SNC162 (n = 9 cells from seven mice). (D) Summary data of double flow-in experiments, comparing oIPSC suppression by DAMGO or SNC162 alone, followed by the other drug. (E) oIPSC paired-pulse ratios (Peak 2/Peak 1), before (baseline, BL) and after drug addition. (F) Schematic of the experimental configuration for recording electrically evoked inhibitory synaptic transmission in wild-type mice. (G) Representative electrically evoked IPSC (eIPSC) pairs (50 ms interval) recorded from a pyramidal cell (as in B). Scale bars: x = 40 ms, y = 200 pA. (H) Baseline-normalized, average eIPSC amplitude over time during bath application of DAMGO (n = 15 cells from 13 mice) or SNC162 (n = 9 cells from five mice). (I) Summary data of double flow-in experiments with electrical stimulation (as in D). (J) eIPSC paired-pulse ratios (Peak 2/Peak 1), before and after drug addition.
-
Figure 1—source data 1
IPSC suppression, paired pulse ratios, and time courses for DAMGO and SNC162.
- https://cdn.elifesciences.org/articles/69746/elife-69746-fig1-data1-v3.xlsx
Figure 1—figure supplement 1
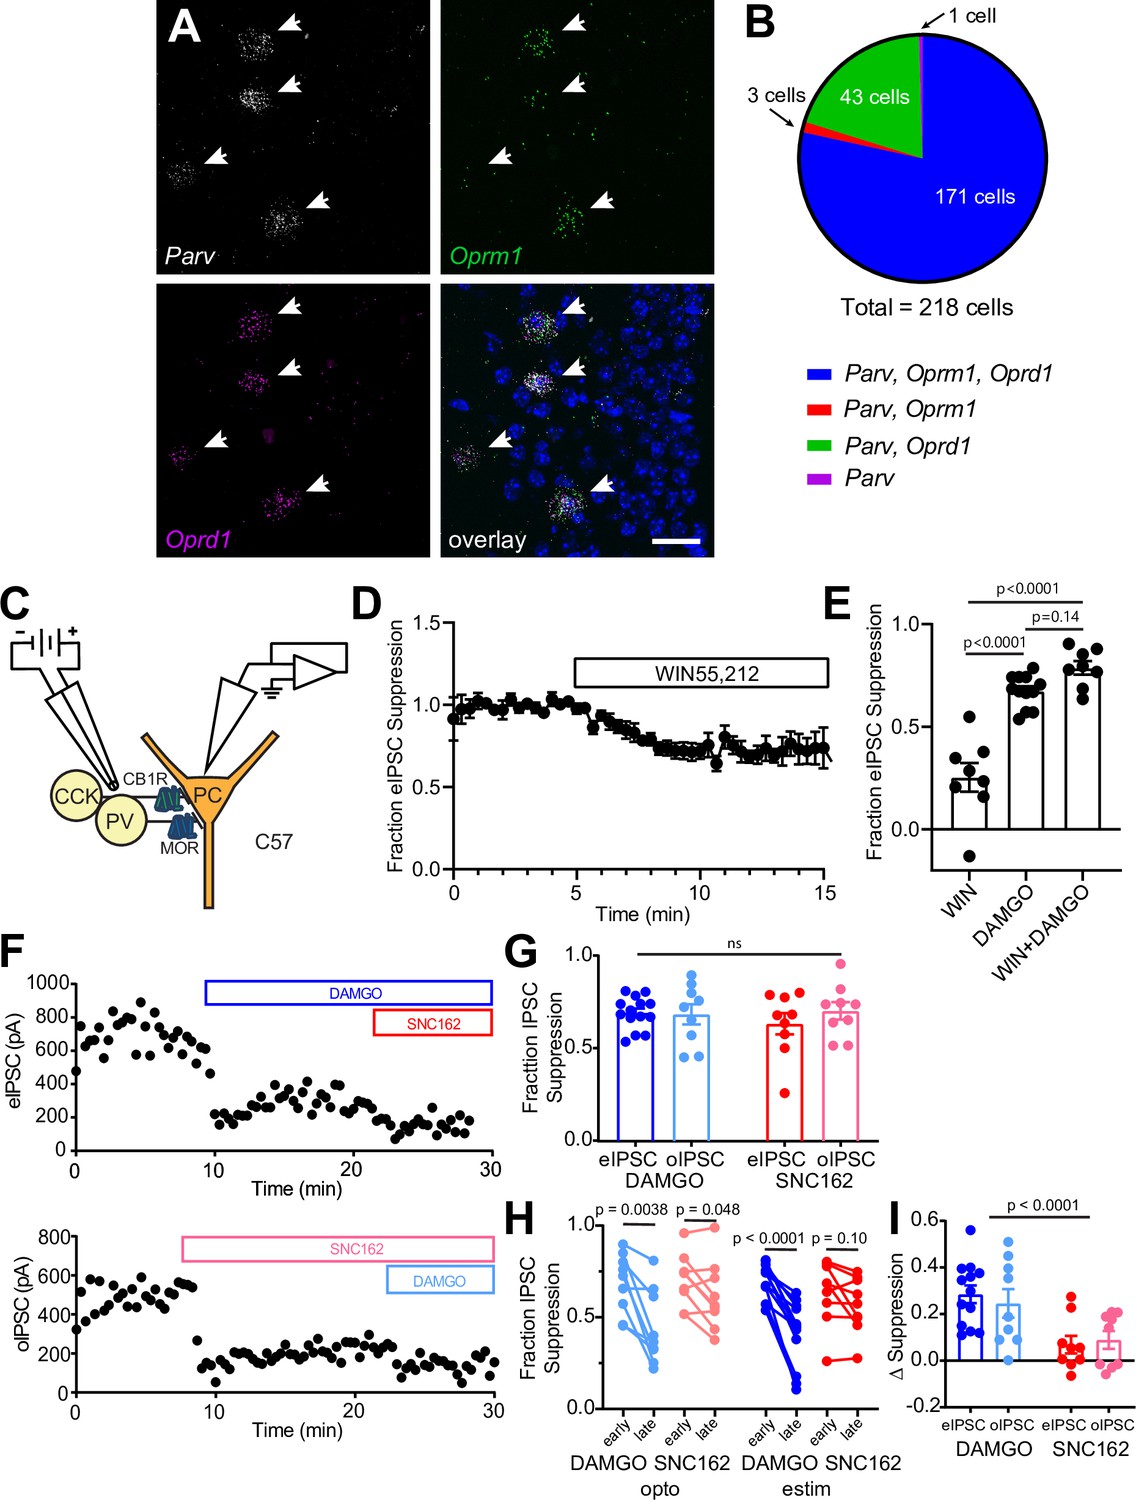
Opioid receptor mRNA in CA1 parvalbumin interneurons and characterization of the neuromodulator sensitivity of CA1 basket cell synaptic output.
(A) Example fluorescence in situ hybridization image of Pvalb, Oprm1, and Oprd1 mRNA in the CA1 pyramidal layer of mouse hippocampus. Scale bar = 20 μm. (B) Summary of Pvalb, Oprm1, and Oprd1 mRNA co-localization images acquired from five mice. (C) Schematic of recording configuration for electrical stimulation depicting two populations of basket cells and their distinguishing neuromodulator receptors. (D) Baseline-normalized, average electrically evoked IPSC (eIPSC) amplitude over time during bath application of the CB1R agonist WIN55,212 (n = 9 cells from three mice). (E) Summary data of WIN55,212 and DAMGO flow-in experiments (DAMGO data replotted from Figure 1I), revealing only a small contribution to the eIPSC from CCK-BCs that are suppressed by CB1R but not mu opioid receptor (MOR). (F) Example double flow-in experiments with optogenetic stimulation (top) and electrical stimulation (bottom) of synaptic transmission. (G) Summary data of IPSC suppression by DAMGO and SNC162, comparing electrical to optogenetic stimulation (data are replotted from Figure 1D and I). (H) Paired desensitization data plotting the early phase of IPSC suppression (1–3 min after drug addition) compared to the late phase of IPSC suppression (8–10 min after drug addition) for both DAMGO and SNC162 and both stimulation protocols. (I) The change in IPSC suppression between early phase and late phase on a cell-by-cell basis for both DAMGO and SNC162 and both stimulation protocols.
-
Figure 1—figure supplement 1—source data 1
IPSC suppression and time courses for WIN55,212, DAMGO, and SNC162 using opto and estim.
- https://cdn.elifesciences.org/articles/69746/elife-69746-fig1-figsupp1-data1-v3.xlsx
Figure 2
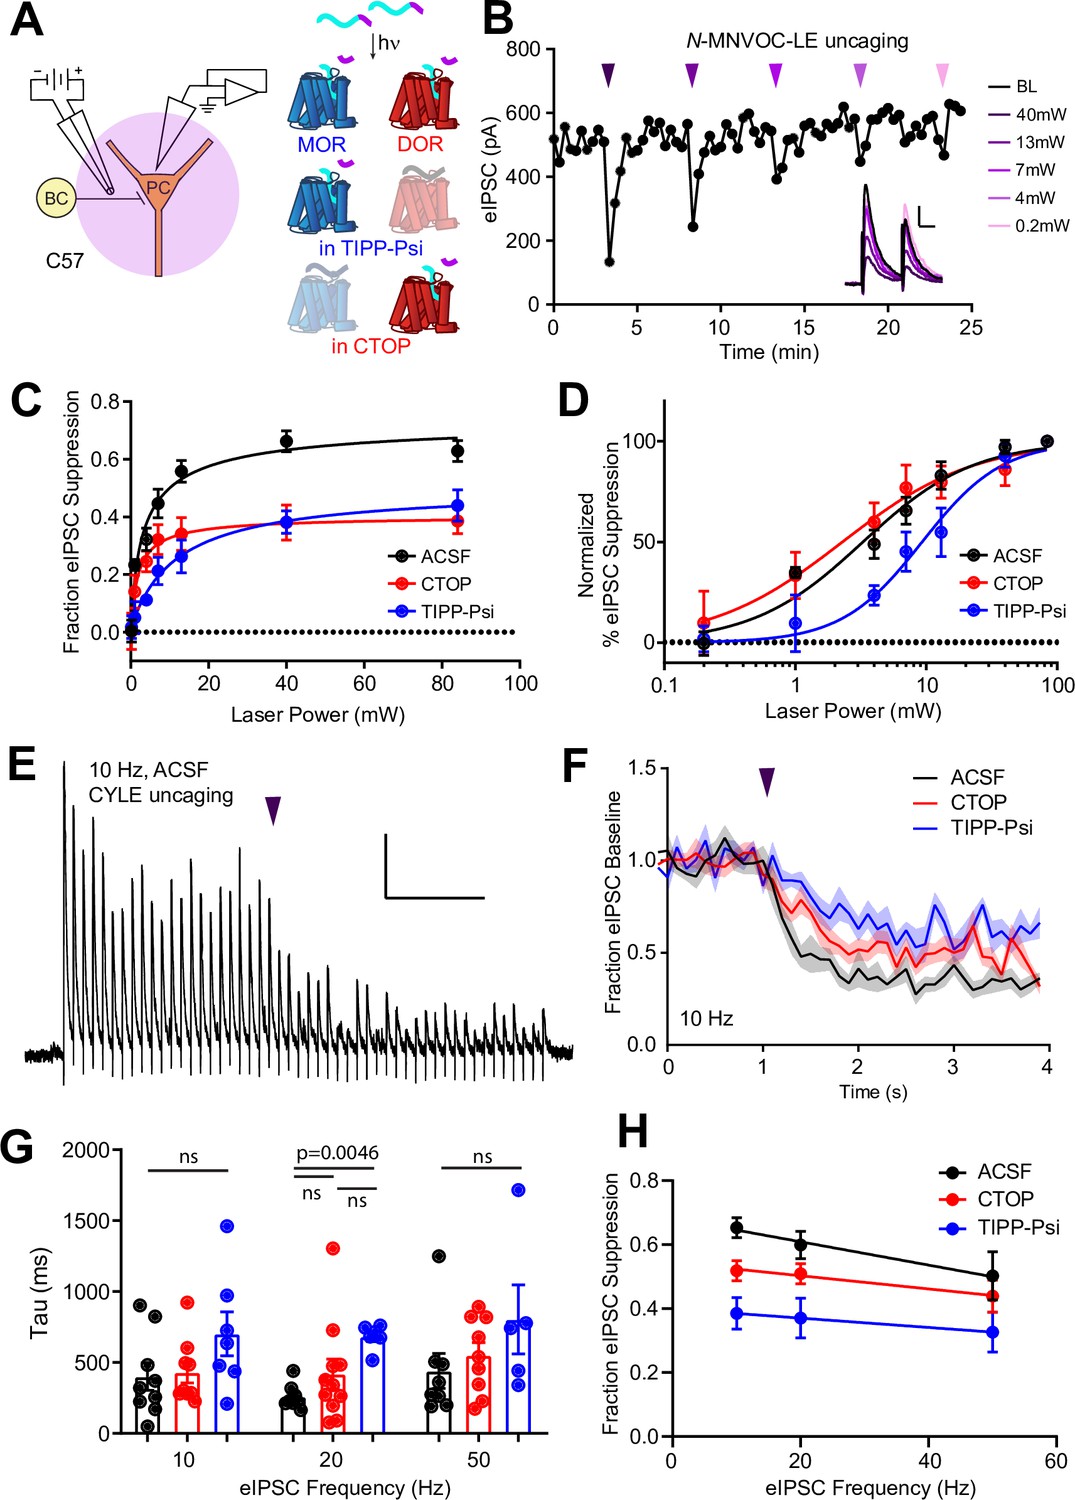
Characterization of the potency and kinetics of synaptic modulation by [Leu5]-enkephalin (LE) at mu (MOR) and delta opioid receptors (DOR) using caged peptides.
(A) Left: Schematic of the experimental configuration for photo-uncaging of opioid neuropeptides while recording electrically evoked inhibitory synaptic transmission in wild-type mice. Right: Schematic of photoreleasing LE (cyan) from N-MNVOC-LE or CYLE (cyan with purple caging group) in the presence of selective antagonists to isolate its action on either MOR (blue, in TIPP-Psi) or DOR (red, in CTOP). (B) Example recording showing graded suppression of inhibitory synaptic transmission by uncaging N-MNVOC-LE at various light intensities. Inset: Example electrically evoked IPSC (eIPSCs) before (black) and after LE uncaging at each light intensity. Scale bars: x = 20 ms, y = 100 pA. (C) Linear optical power-response curves of eIPSC suppression as a function of light intensity, in the absence (black, n = 6–12 cells per laser intensity) and presence of either CTOP (red, n = 5–8 cells) or TIPP-Psi (blue, n = 4–10 cells). (D) Logarithmic optical power-response curves of the data in (C) normalized to the maximal eIPSC suppression observed in each condition. (E) Representative recording from a pyramidal cell demonstrating rapid suppression of eIPSC amplitude in response to photoactivation of CYLE during 10 Hz trains of electrical stimuli. Purple arrow represents CYLE uncaging at 2 s into the 10 Hz train. Outward stimulus artifacts are removed for clarity. Scale bars: x = 1 s, y = 100 pA. (F) Average, baseline subtracted and baseline-normalized eIPSC amplitude showing the kinetics of synaptic suppression with electrical stimulation at 10 Hz in the absence (artificial cerebrospinal fluid [ACSF], n = 9 cells from six mice) and presence of either CTOP (n = 12 cells from seven mice) or TIPP-Psi (n = 8 cells from six mice). (G) Time constants of synaptic suppression in response to CYLE photoactivation with an 84 mW light flash at the indicated frequencies of synaptic stimulation. At 20 Hz, the time constant in TIPP-Psi was significantly greater than the time constant without any antagonists. (H) Plot of eIPSC suppression as a function of synaptic stimulation frequency.
-
Figure 2—source data 1
Power-response curves and onset kinetics at presynaptic MOR and DOR.
- https://cdn.elifesciences.org/articles/69746/elife-69746-fig2-data1-v3.xlsx
Figure 3
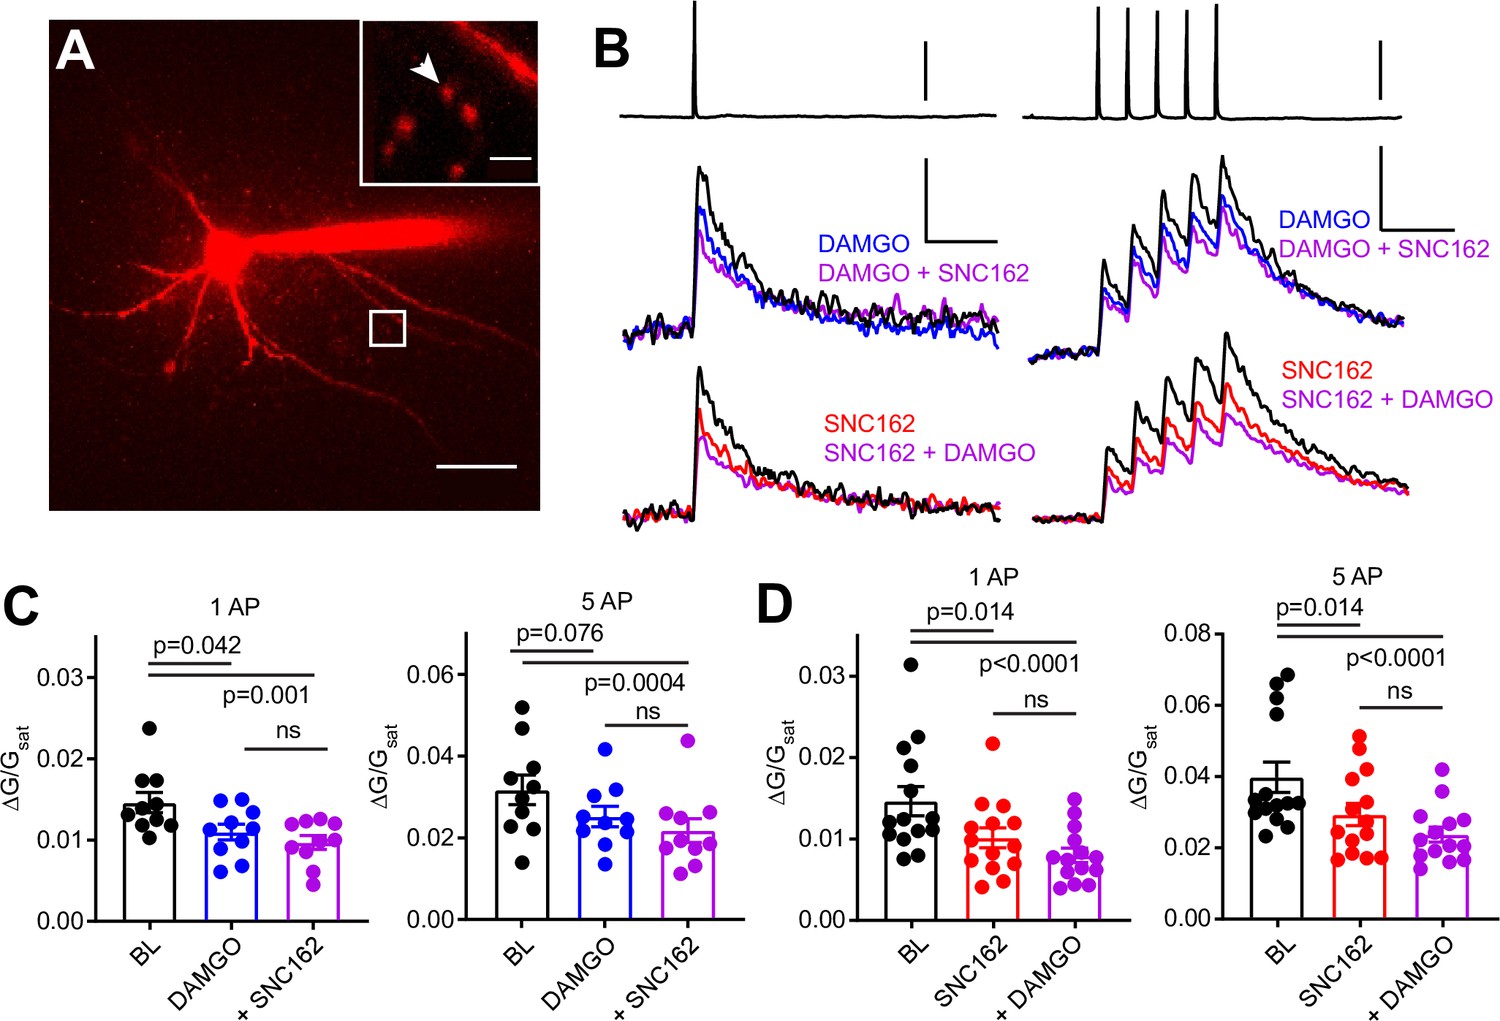
Axonal calcium imaging reveals that both mu and delta opioid receptors suppress presynaptic voltage-sensitive calcium channels.
(A) Two-photon image of a tdTomato-expressing basket cell filled with 30 µM Alexa 594 and 300 µM Fluo-5F in a brain slice taken from a PV-Cre; tdTom mouse. Scale bar: 50 μm. Inset shows the two axonal boutons where the line scan was carried out, with the orientation of the line scan indicated by the arrow. Scale bar: 5 μm. (B) Example of either a single action potential (AP) (left) or five APs (right) triggered in the cell body (top), and the resulting averaged, presynaptic Ca2+ transients, before and after application of DAMGO (top, blue, n = 8 cells, 16 boutons), SNC162 (red bottom, n = 7 cells, 14 boutons), and both drugs (top and bottom, purple). The transients are measured as the change in green signal (ΔG) , divided by G in saturating Ca2+ conditions (Gsat). Scale bars: top, 50 mV; bottom, x = 100 ms, y = 0.01 (left) or 0.02 (right) (ΔG/Gsat. (C) Summary of peak Ca2+ transients for DAMGO application in response to one AP (left) or five APs (right). One AP: BL 0.014 ± 0.001; DAMGO 0.011 ± 0.001; DAMGO+ SNC162 0.010 ± 0.001 (p = 0.042 and p = 0.0001, n = 10 pairs, Friedman test with Dunn’s multiple comparisons) five AP: BL 0.032 ± 0.004; DAMGO 0.025 ± 0.002, DAMGO+ SNC162 0.022 ± 0.003 (p = 0.076 and p = 0.0004, n = 10 pairs). (D) Summary of peak Ca2+ transients for SNC162 application in response to one AP (left) or five APs (right). One AP: BL 0.014 ± 0.002; SNC162 0.010 ± 0.002; SNC162+ DAMGO 0.008 ± 0.001 (p = 0.014 and p < 0.0001, n = 14 pairs, Friedman test with Dunn’s multiple comparisons). Five AP: BL 0.039 ± 0.004; SNC162 0.029 ± 0.003; SNC162+ DAMGO 0.023 ± 0.002 (p = 0.014 and p < 0.0001, n = 14 pairs).
-
Figure 3—source data 1
Ca2+ transient peaks with and without DAMGO and SNC162.
- https://cdn.elifesciences.org/articles/69746/elife-69746-fig3-data1-v3.xlsx
Figure 4 with 1 supplement
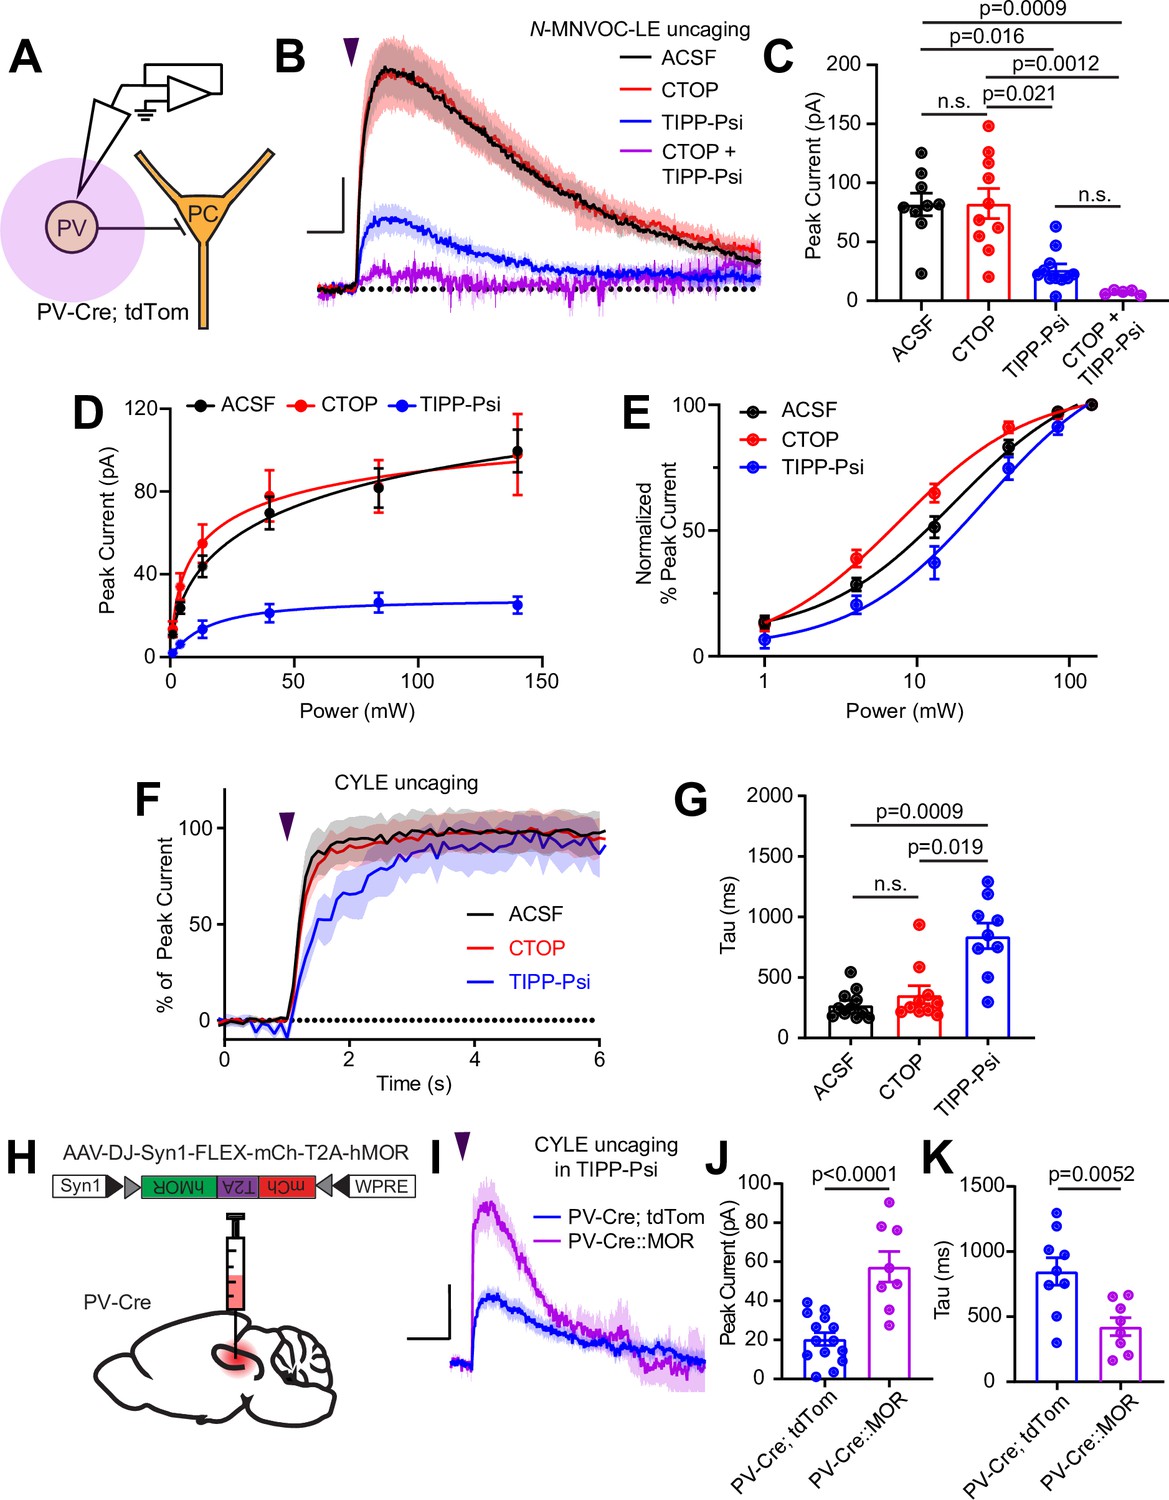
Enkephalin evokes outward currents in CA1 parvalbumin (PV) interneurons through both mu and delta opioid receptors.
(A) Schematic of whole-cell voltage clamp recording configuration from PV interneurons with peptide uncaging. (B) Average outward currents evoked by photoactivation of N-MNVOC-LE (6 μM) with an 84 mW light flash in the absence (black, artificial cerebrospinal fluid [ACSF], n = 9 cells from five mice) and presence of mu and delta opioid receptor antagonists (red, CTOP, n = 10 cells from six mice; blue, TIPP-Psi, n = 11 cells from six mice; purple, CTOP+ TIPP-Psi, n = 5 cells from three mice). Scale bar: x = 5 s, y = 20 pA. (C) Summary of peak current amplitudes shown in B. (D) Linear optical power-response curve of peak current as a function of light intensity, in the absence (ACSF, black, n = 9 cells per laser intensity) and presence of either CTOP (red, n = 10 cells) or TIPP-Psi (blue, n = 11 cells). (E) Logarithmic optical power-response curves of the data in D normalized to the maximal peak current observed in each condition. (F) Rising phase of the average peak-normalized outward currents evoked by photoactivation of CYLE (6 μM) with an 84 mW light flash in the absence (black, ACSF, n = 11 cells from four mice) and presence of mu and delta opioid receptor antagonists (red, CTOP, n = 10 cells from four mice; blue, TIPP-Psi, n = 12 cells from four mice). (G) Time constants of current activation in response to photoactivation of CYLE from F. (H) Schematic of viral Cre-dependent mu opioid receptor over-expression in CA1 of PV-Cre mice. (I) Average outward currents evoked by photoactivation of CYLE by an 84 mW light flash in the presence of TIPP-Psi in either PV-Cre; tdTom mice (blue, data from B) or PV-Cre mice overexpressing the mu opioid receptor (purple, n = 8 cells from three mice). Scale bar: x = 10 s, y = 20 pA. (J) Summary of current amplitudes shown in I. (K) Time constants of current activation in response to photoactivation of CYLE.
-
Figure 4—source data 1
Power-response curves and onset kinetics at somato-dendritic MOR and DOR and MOR currents after overexpression.
- https://cdn.elifesciences.org/articles/69746/elife-69746-fig4-data1-v3.xlsx
Figure 4—figure supplement 1
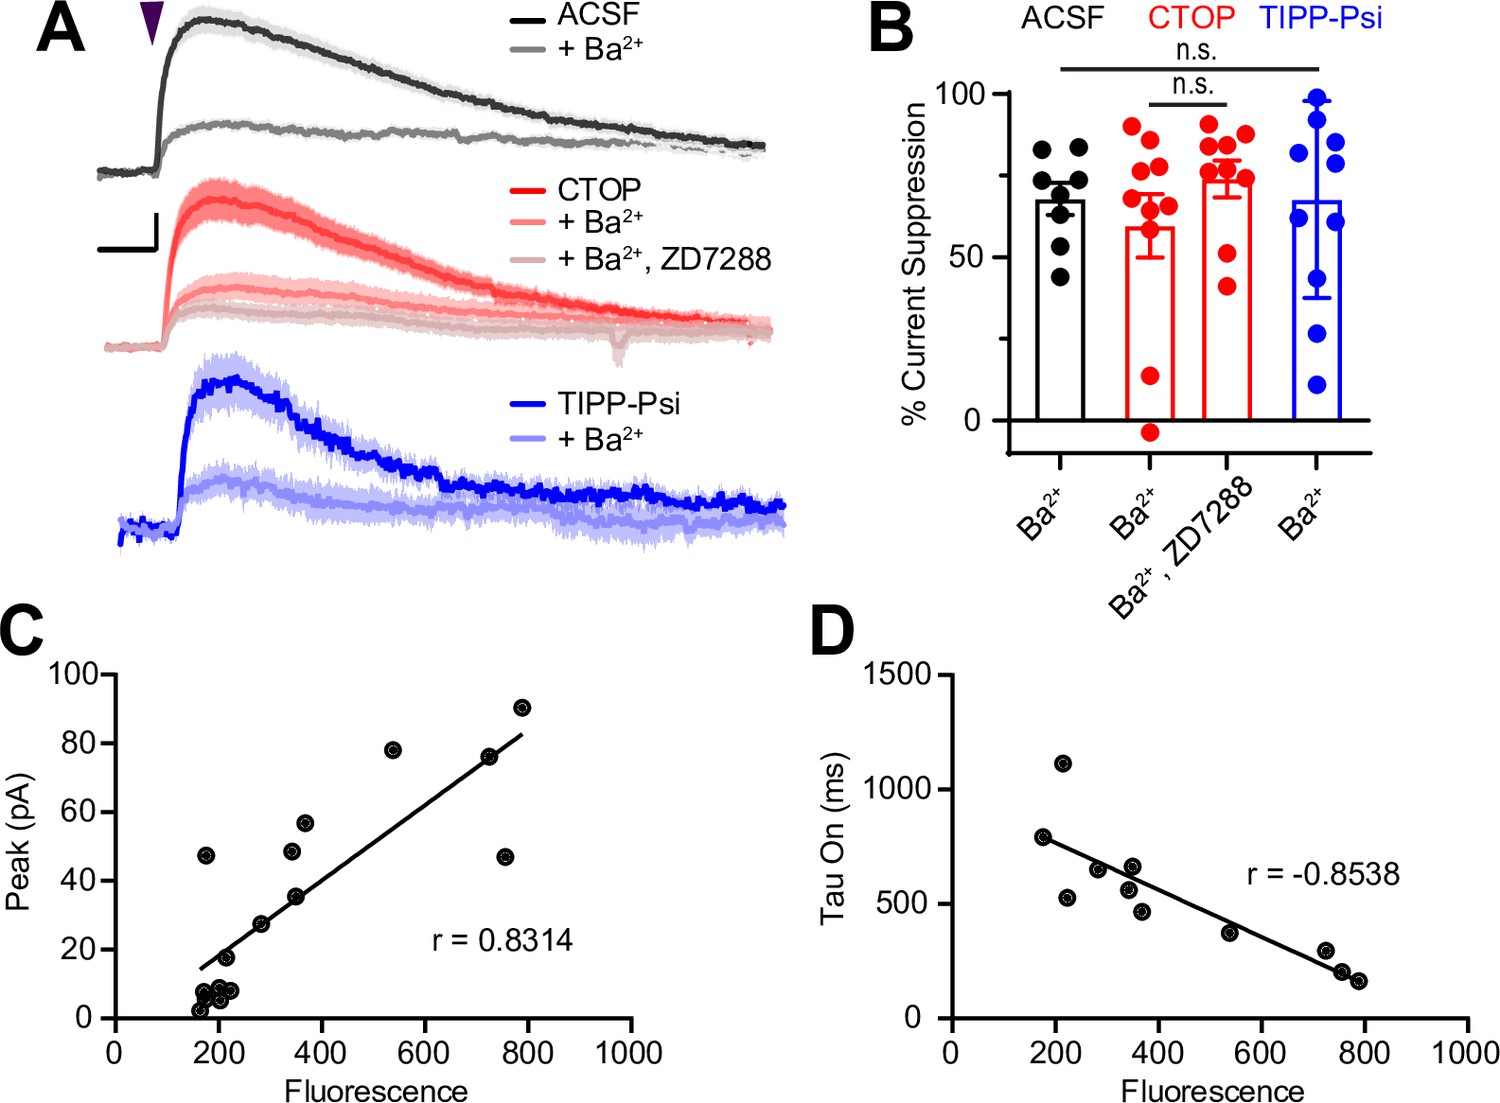
Sensitivity of somato-dendritic currents to the G protein-coupled inward rectifier K+ (GIRK) blocker Ba2+ and mu opioid receptor expression level.
(A) Average outward currents evoked by photoactivation of CYLE with a 84 mW light flash in the absence (black, artificial cerebrospinal fluid [ACSF], n = 13 cells from seven mice) and presence of mu and delta opioid receptor antagonists (red, CTOP, n = 14 cells from 10 mice; TIPP-Psi, n = 13 cells from nine mice), as well as Ba2+ (1 mM) (gray, ACSF + Ba2+, n = 8 cells from two mice; light red, CTOP + Ba2+, n = 10 cells from four mice; light blue, TIPP-Psi + Ba2+, n = 10 cells from four mice), and the hyperpolarization-gated cyclic nucleotide (HCN) blocker ZD7288 (lightest red, CTOP + Ba2+, ZD7288, n = 9 cells from three mice), as indicated. Scale bar: x = 5 s, y = 25% of current without Ba2+ or ZD7288. (B) Summary of the percentage of the average peak current amplitude that is blocked in each condition shown in A. (C) Peak amplitude of the MOR current in PvalbCre neurons expressing mCh-2A-hMOR vs. red fluorescence in the recorded cell, as well as the Pearson’s correlation coefficient. For this comparison, all cells were used regardless of fluorescence level. Meanwhile, in Figure 4I–K, only cells that had fluorescence >250 were included. (D) Time constant of MOR-current activation in PvalbCre neurons expressing mCh-2A-hMOR vs. red fluorescence in the recorded cell, as well as the Pearson’s correlation coefficient.
-
Figure 4—figure supplement 1—source data 1
Somato-dendritic currents in Ba2+ and ZD7288 and correlation between mCherry fluorescence and MOR currents.
- https://cdn.elifesciences.org/articles/69746/elife-69746-fig4-figsupp1-data1-v3.xlsx
Figure 5
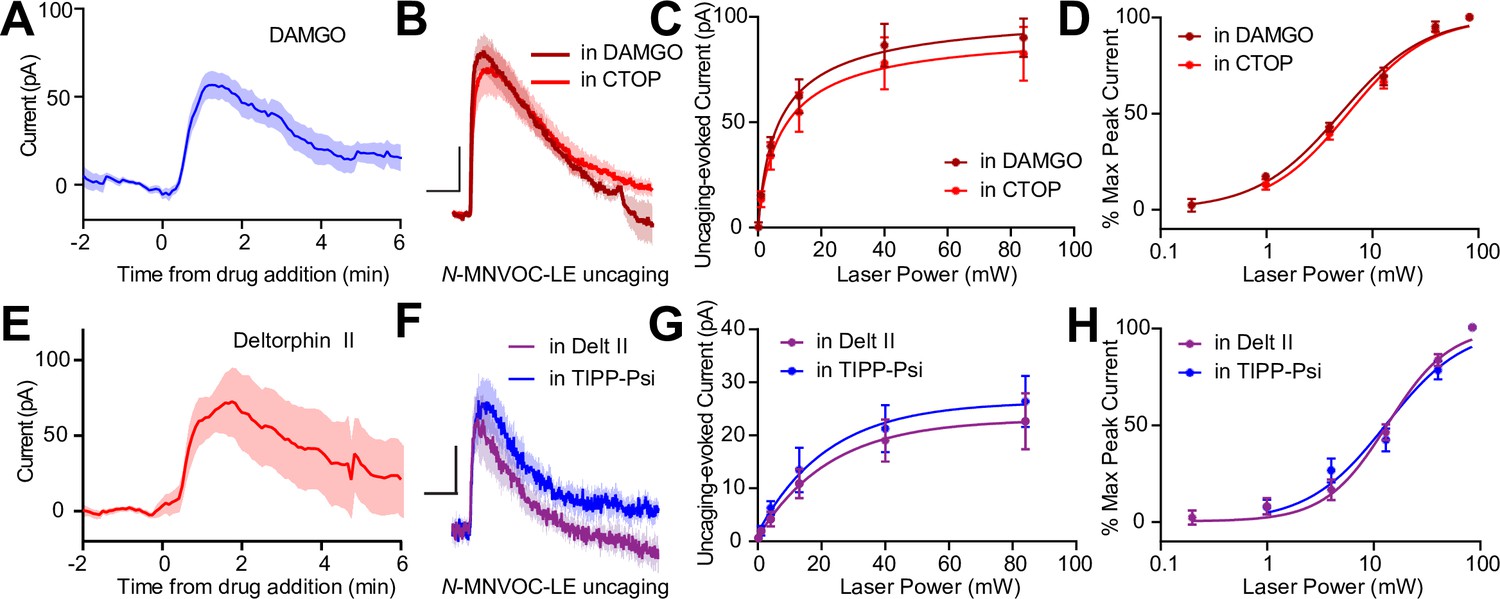
Somato-dendritic mu and delta opioid receptors do not exhibit heterologous desensitization.
(A) Average outward current evoked by sustained bath application of DAMGO (n = 9 cells from six mice). (B) Average outward currents evoked by photoactivation of N-MNVOC-LE either in the presence of CTOP (red, data from 4B) or in the presence of DAMGO, after desensitization (brick red, n = 9 cells from four mice). Scale bars: x = 10 s, y = 25 pA. (C) Linear optical power-response curve of peak current as a function of light intensity, in the presence of either CTOP (red, n = 10 cells, data from 4C) or DAMGO (brick red, n = 9 cells). (D) Logarithmic optical power-response curves of the data in (C) normalized to the maximal peak current observed in each condition. (E) Average outward current evoked by sustained bath application of deltorphin II (n = 12 cells from six mice). (F) Average outward currents evoked by photoactivation of N-MNVOC-LE either in the presence of TIPP-Psi (blue, data from 4B) or in the presence of deltorphin II, after desensitization (purple, n = 8 cells from four mice). Scale bars: x = 10 s, y = 10 pA. (G) Linear optical power-response curve of peak current as a function of light intensity, in the presence of either TIPP-Psi (blue, n = 11 cells, data from 4C) or deltorphin II (purple, n = 8 cells). (H) Logarithmic optical power-response curves of the data in F normalized to the maximal peak current observed in each condition.
-
Figure 5—source data 1
Somato-dendritic currents from DAMGO and Deltorphin II and power-response curves of uncaging-evoked currents.
- https://cdn.elifesciences.org/articles/69746/elife-69746-fig5-data1-v3.xlsx
Figure 6 with 1 supplement
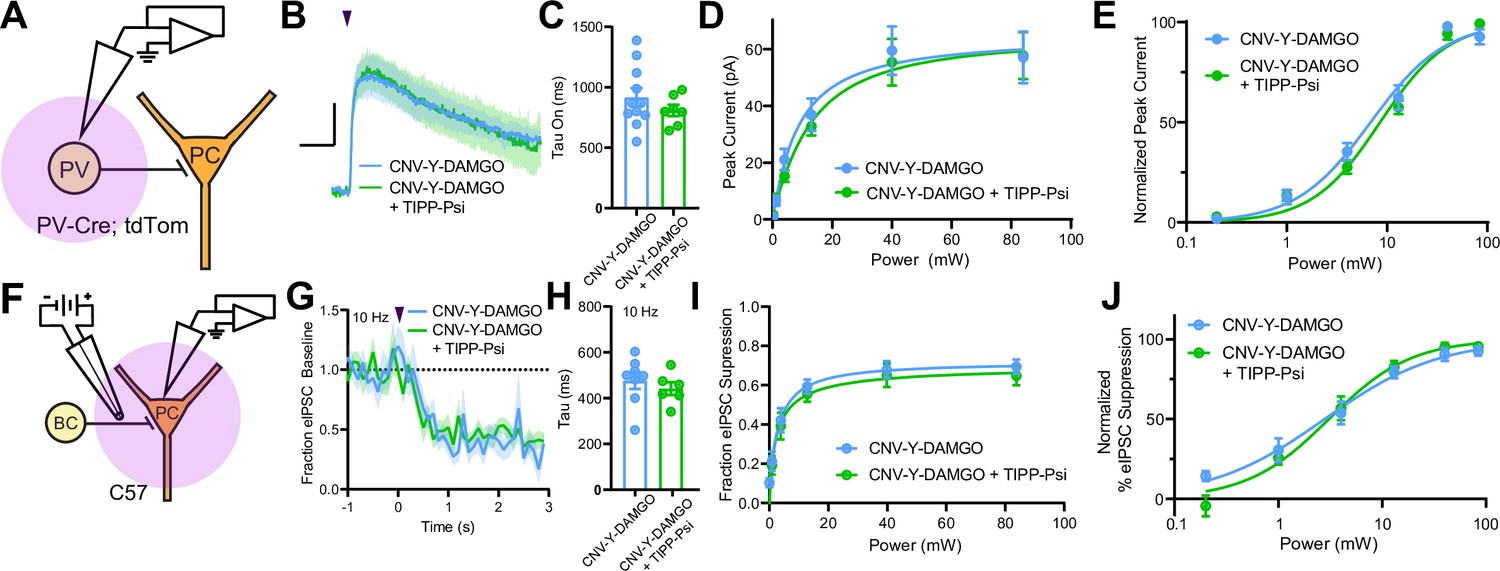
Mu and delta opioid receptors do not signal as heteromers in CA1 parvalbumin (PV) neurons.
(A) Schematic of whole-cell voltage clamp recording configuration from PV interneurons with peptide uncaging. (B) Average outward currents evoked by photoactivation of CNV-Y-DAMGO with an 84 mW light flash either in the absence (sky blue, n = 8 from five mice) or presence (green, n = 7 cells from four mice) of TIPP-Psi. Scale bar: x = 10 s, y = 20 pA. (C) Time constants of current activation in response to photoactivation of CNV-Y-DAMGO in the absence or presence of TIPP-Psi. (D) Linear optical power-response curve of peak current as a function of light intensity, in the absence (sky blue) or presence (green) of TIPP-Psi. (E) Logarithmic optical power-response curves of the data in (D) normalized to the maximal peak current observed in each condition. (F) Schematic of the experimental configuration for photo-uncaging of opioid neuropeptides while recording electrically evoked inhibitory synaptic transmission in wild-type mice. (G) Average, baseline subtracted and baseline-normalized electrically evoked IPSC (eIPSC) amplitude showing the kinetics of synaptic suppression with electrical stimulation at 10 Hz in the absence (sky blue, n = 8 cells from four mice) or presence of TIPP-Psi (green, n = 8 cells from four mice). (H) Time constants of synaptic suppression at 10 Hz stimulation in response to photoactivation of CNV-Y-DAMGO in the absence or presence of TIPP-Psi. (I) Linear optical power-response curve of eIPSC suppression as a function of light intensity, in the absence (sky blue) or presence (green) of TIPP-Psi. (J) Logarithmic optical power-response curves of the data in I normalized to the maximal eIPSC suppression observed in each condition.
-
Figure 6—source data 1
Power-response curves and onset kinetics of CNV-Y-DAMGO uncaging with and without TIPP-Psi.
- https://cdn.elifesciences.org/articles/69746/elife-69746-fig6-data1-v3.xlsx
Figure 6—figure supplement 1
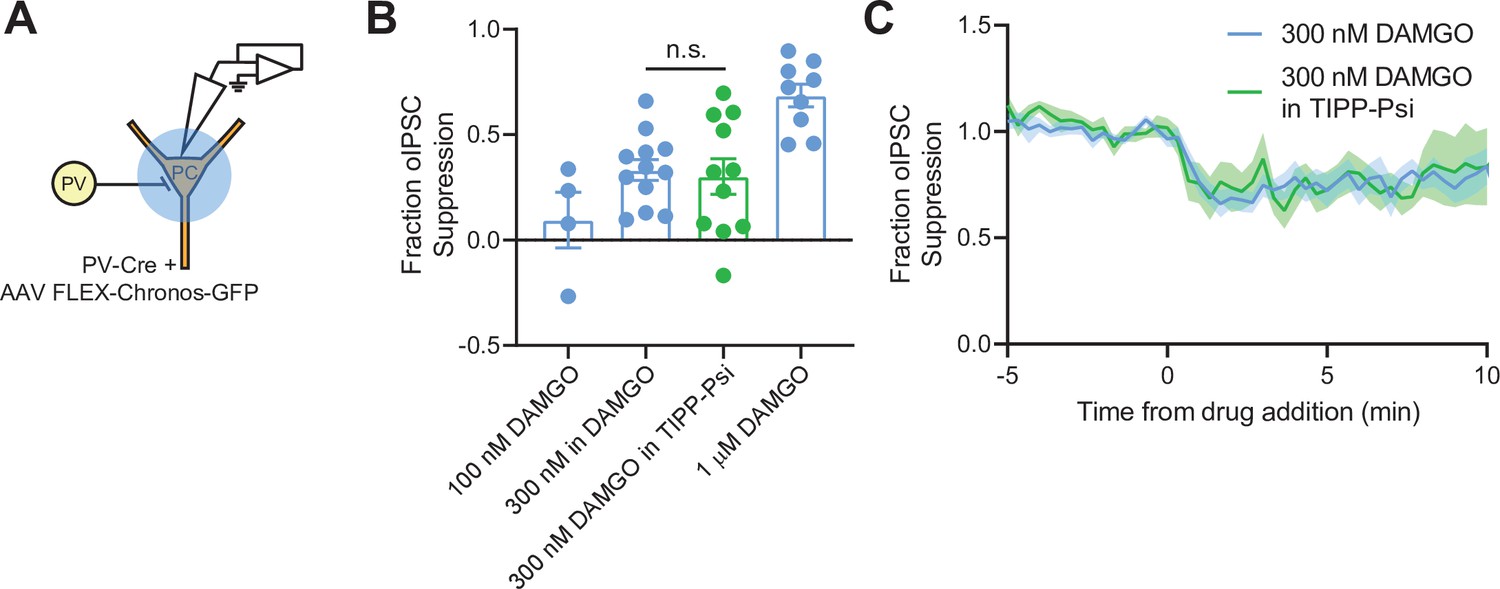
Optogenetic activation confirms that mu opioid receptor (MOR) and delta opioid receptor (DOR) do not signal as heteromers in parvalbumin (PV) terminals.
(A) Schematic of the experimental configuration for recording optogenetically evoked inhibitory synaptic transmission in PvalbCre mice. (B) Summary data showing fraction of optically evoked IPSC (oIPSC) suppression by 100 nM DAMGO (n = 4 cells from two mice), 300 nM DAMGO (n = 12 cells from six mice), 300 nM DAMGO in 1 μM TIPP-Psi (green, n = 11 cells from five mice), and 1 μM DAMGO (n = 9 cells from six mice, same data as Figure 1D) for comparison. (C) Baseline-normalized, average oIPSC amplitude over time during bath application of 300 nM DAMGO (n = 12 cells from six mice) or 300 nM DAMGO in the presence of 1 μM TIPP-Psi (n = 11 cells from five mice).
-
Figure 6—figure supplement 1—source data 1
Optogenetically-evoked IPSC suppression by 300 nM DAMGO with and without TIPP-Psi.
- https://cdn.elifesciences.org/articles/69746/elife-69746-fig6-figsupp1-data1-v3.xlsx
Figure 7
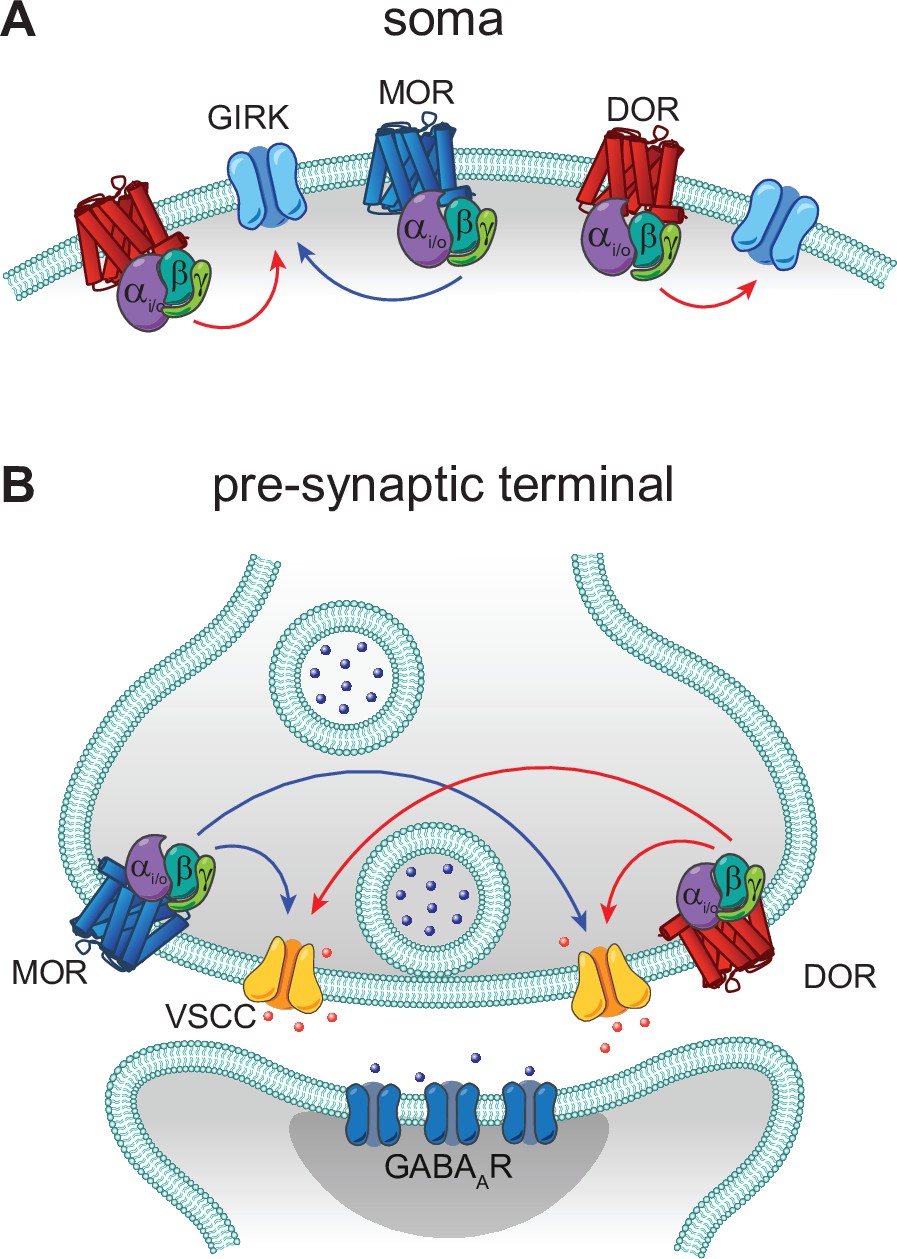
Models of mu opioid receptor (MOR) and delta opioid receptor (DOR) signaling in the soma and the pre-synaptic terminal.
(A) In the soma, both MORs (blue) and DORs (red) signal through G protein-coupled inward rectifier K+ (GIRK) channels. MORs are expressed at lower levels than DORs, as the somato-dendritic currents evoked by activation of MORs alone are small and are increased by increasing MOR expression. The unidirectional occlusion observed suggests that MORs only have access to a subset of GIRKs, whereas DORs have access to a larger pool that encompasses the MOR-pool. (B) In the pre-synaptic terminal, MORs and DORs both act on voltage-sensitive calcium channels (VSCCs) to suppress Ca2+ influx and inhibit vesicle release. Unlike somatic MORs and DORs, pre-synaptic MORs and DORs are bidirectionally occlusive, so that both MORs and DORs have access to the majority of VSCCs.
Tables
Key resources table
| Reagent type (species) or resource | Designation | Source or reference | Identifiers | Additional information |
|---|---|---|---|---|
| Strain, strain background (Mus musculus, male and female) | C57Bl/6 | The Jackson Laboratory | Cat # 000664RRID:IMSR_JAX:000664 | |
| Strain, strain background (Mus musculus, male and female) | PvalbCre | The Jackson Laboratory | Cat # 012358RRID:IMSR_JAX:012358 | |
| Strain, strain background (Mus musculus, male and female) | Rosa26-lsl-tdTomato (Ai14) | The Jackson Laboratory | Cat # 007914RRID:IMSR_JAX:007914 | |
| Recombinant DNA reagent | AAV1-Syn-FLEX-Chronos-GFP | Addgene | Cat # 62722RRID:Addgene_62722 | |
| Recombinant DNA reagent | AAVDJ-hSyn1-FLEX-mCh-T2A-FLAG-hMOR-WPRE | Banghart Lab | Addgene Plasmid #166970 | |
| Commercial assay or kit | RNAscope Fluorescent Multiplex Kit | ACD bio/Bio-Techne | Cat # 320850 | |
| Commercial assay or kit | Pvalb FISH probe | ACD bio/Bio-Techne | Cat # 421931-C3 | |
| Commercial assay or kit | Oprd1 FISH probe | ACD bio/Bio-Techne | Cat # 427371-C2 | |
| Commercial assay or kit | Oprm1 FISH probe | ACD bio/Bio-Techne | Cat # 315841 | |
| Chemical compound, drug | N-MNVOC-LE | Banghart et al., 2018 | ||
| Chemical compound, drug | CYLE | Banghart Lab and NIDA Drug Supply Program Banghart and Sabatini, 2012 | MPSP-117 (NDSP) | |
| Chemical compound, drug | CNV-Y-DAMGO | Ma et al., 2021 | ||
| Chemical compound, drug | NBQX | HelloBio | Cat # HB0443 | |
| Chemical compound, drug | (R)-CPP | HelloBio | Cat # HB0021 | |
| Chemical compound, drug | TIPP-Psi | NIDA Drug Supply Program | MPSP-056 | |
| Chemical compound, drug | CTOP | Tocris | Cat # 1578 | |
| Chemical compound, drug | DAMGO | Tocris | Cat # 1171 | |
| Chemical compound, drug | SNC162 | Tocris | Cat # 1529 | |
| Chemical compound, drug | AlexaFluor 547 | Thermo Fisher | Cat # 10438 | |
| Chemical compound, drug | Fluo5F | Thermo Fisher | Cat # F14221 | |
| Chemical compound, drug | Picrotoxin | Sigma | Cat # P1675 | |
| Chemical compound, drug | TTX | HelloBio | Cat # HB1035 | |
| Chemical compound, drug | WIN55,212 | Tocris | Cat # 1038 | |
| Chemical compound, drug | Deltorphin II | NIDA Drug Supply Program | MPSP-036 | |
| Chemical compound, drug | ZD7288 | Tocris | Cat # 1000 | |
| Software, algorithm | MATLAB | Mathworks Inc | RRID:SCR_001622 | |
| Software, algorithm | ScanImage | Pologruto et al., 2003 | RRID:SCR_014307 | |
| Software, algorithm | Igor Pro | WaveMetrics | RRID:SCR_000325 | |
| Software, algorithm | ImageJ | NIH | RRID:SCR_003070 | |
| Software, algorithm | Illustrator CC | Adobe Systems Inc | RRID:SCR_010279 | |
| Software, algorithm | Prism 7 | GraphPad Inc | RRID:SCR_002798 | |
| Software, algorithm | Excel | Microsoft | RRID:SCR_016137 |
Author response table 1
| Figure | Normal? | Results changed? | |
|---|---|---|---|
| 1D | Yes | One way ANOVA | No |
| 1E new | No for BL(DAM) | Wilcoxon test, both significant | No |
| 1I | Yes | One way ANOVA | No |
| 1J new | No for BL(DAM) | Wilcoxon test, DAMGO p = 0.0186, SNC p = 0.058 | DAMGO significant, SNC no longer significant |
| S1E | Yes | One way ANOVA w/ Tukey (changed from Dunnett’s) | No |
| S1G | Yes | Two way ANOVA | No |
| S1H | Yes | Paired t-test | New data |
| S1I | No | Skillings-Mack non-parametric test for grouped data | New data |
| 2G | No | Kruskal-Wallis (non-parametric): only significant difference is for 20hz, between ACSF and TIPP-Psi | No |
| 3C | No | Friedman test with Dunn’s multiple comparisons | No |
| 3D | No | Friedman test with Dunn’s multiple comparisons | No |
| 4C | No | Kruskal-Wallis (non-parametric) with Dunn’s multiple comparisons | No |
| 4G | No | Kruskal-Wallis (non-parametric) with Dunn’s multiple comparisons | No |
| 4J | Yes | Unpaired t-test | No |
| 4K | Yes | Unpaired t-test | No |
| S2B | Yes | One way ANOVA, and t-test for CTOP condition only | No |
| 6C | No | Mann-Whitney test, p = 0.4252 | No |
| 6H | No | Mann-Whitney test, p = 0.2824 | No |
| S3B | Yes | Unpaired t-test, p = 0.7518 | No |
Additional files
Download links
A two-part list of links to download the article, or parts of the article, in various formats.
Downloads (link to download the article as PDF)
Open citations (links to open the citations from this article in various online reference manager services)
Cite this article (links to download the citations from this article in formats compatible with various reference manager tools)
Convergent, functionally independent signaling by mu and delta opioid receptors in hippocampal parvalbumin interneurons
eLife 10:e69746.
https://doi.org/10.7554/eLife.69746


