Cryo-EM structures of the caspase-activated protein XKR9 involved in apoptotic lipid scrambling
- Department of Biochemistry, University of Zurich, Switzerland
Figures
Figure 1 with 3 supplements
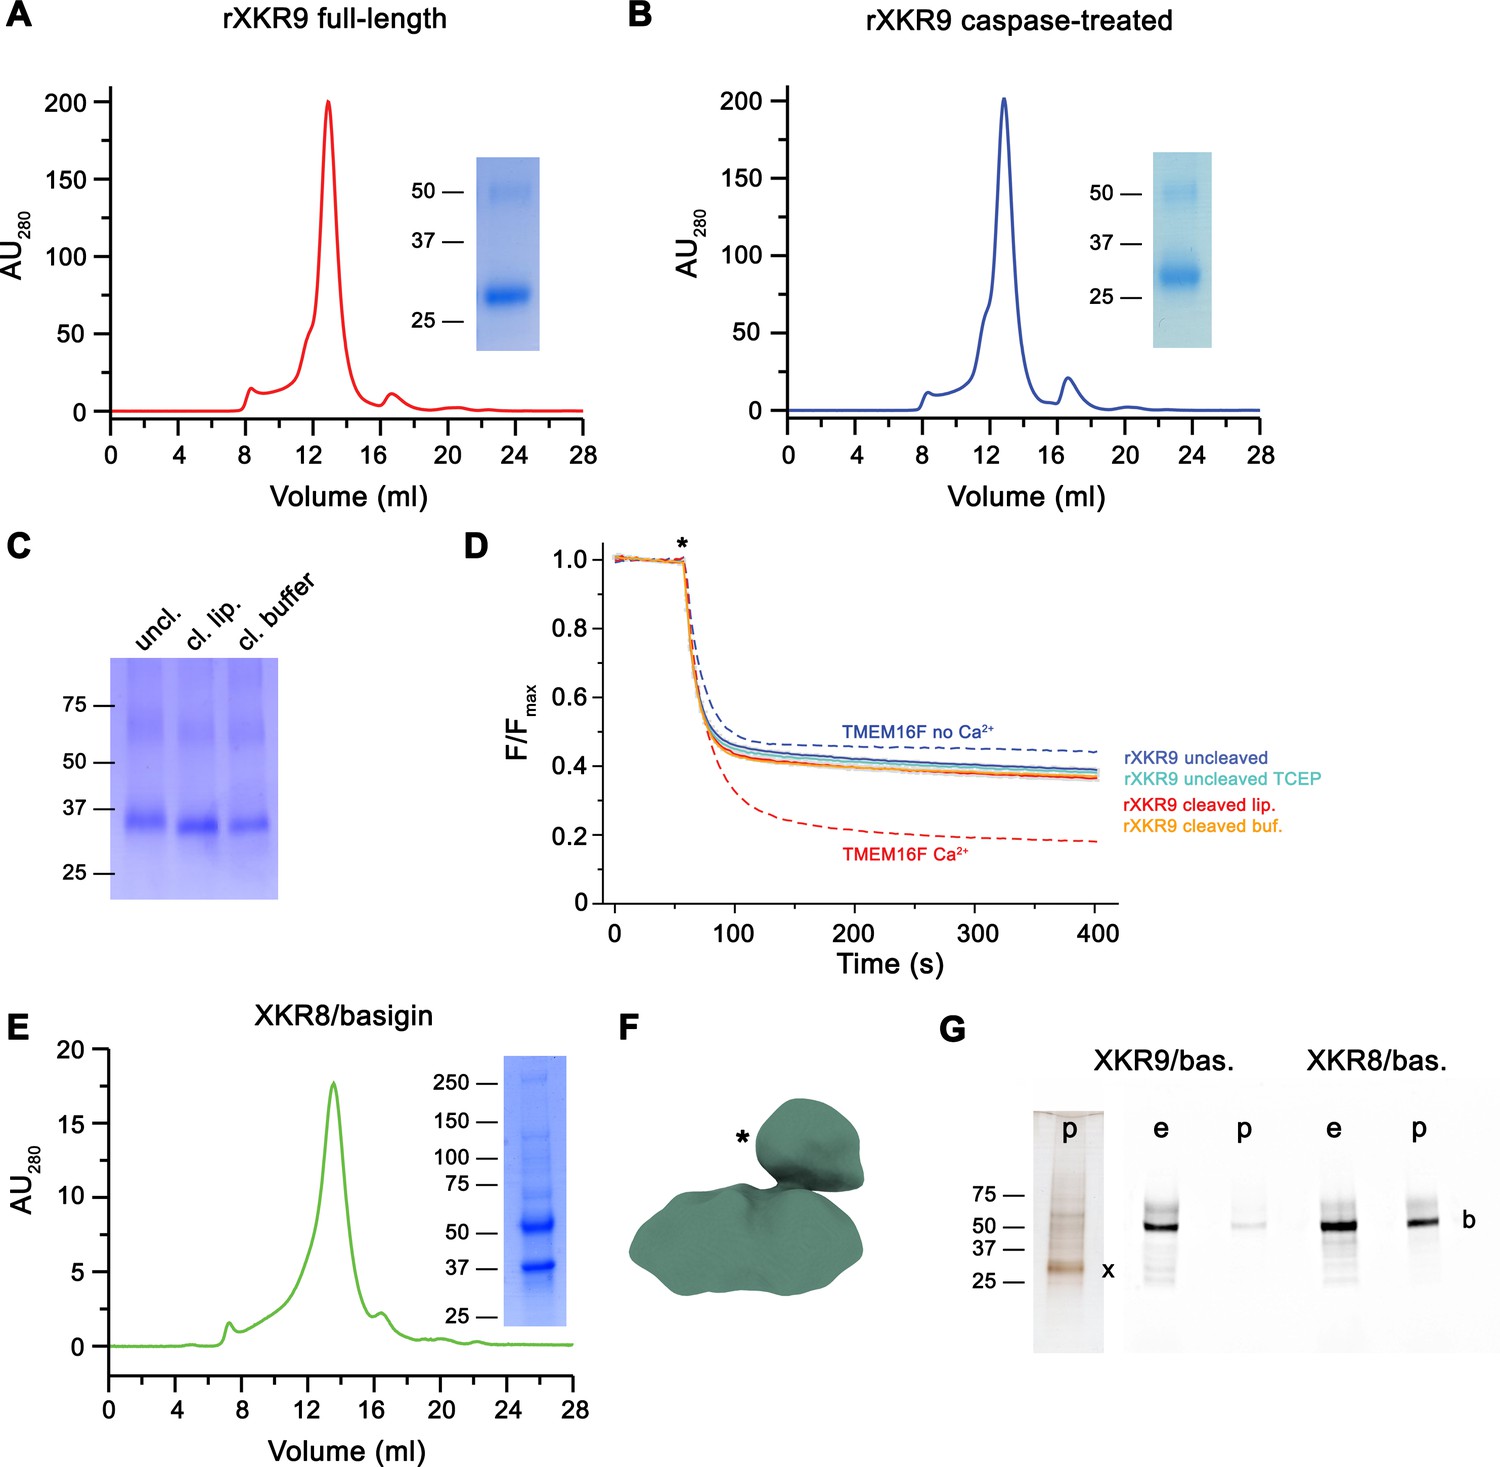
Biochemical and functional properties of rXKR9.
Size-exclusion chromatogram of full-length (A) and caspase-treated (B) rXKR9. Insets show SDS–PAGE gel of the pooled and concentrated peak sample. (C) SDS–PAGE gel of rXKR9 extracted from different proteoliposome preparations used for lipid scrambling assays. The samples treated with caspase-3 in liposomes (cl. lip.) or detergent solution prior to reconstitution (cl. buffer) show shift toward smaller molecular weight compared to the full-length protein (uncl.). (D) Assay to monitor the protein-catalyzed movement of fluorescent lipids between both leaflets of a bilayer. The addition of the reducing agent dithionite to the solution (*) is indicated. Traces of TMEM16F in the absence and presence of 100 µM Ca2+ displayed in Figure 1—figure supplement 1C are shown as controls for an inactive and active scramblase, respectively (dashed lines). No pronounced activity is observed in any of the liposome preparations containing either full-length or caspase-3-treated samples. Data show mean and standard deviations of three technical replicates. (E) Purification of a human XKR8-basigin complex. Left, size-exclusion chromatogram of hXKR8 in complex with basigin containing a GFP fusion. The complex was purified via a tag attached to hXKR8. SDS–PAGE gel showing the Coomassie stained bands of the purified complex (right). (F) Low-resolution reconstruction of the hXKR8-basigin complex. The density protruding from the membrane-inserted part (*) corresponds to the extracellular part of basigin. (G) In-gel fluorescence showing GFP-tagged basigin (b) in whole-cell extracts (e) and after affinity purification (p) of hXKR8 and rXKR9. Whereas the XKR8 samples show a pronounced basigin band, the XKR9 samples only contain traces of the protein. The presence of XKR9 in the sample (marked with ‘x’) is shown on silver-stained SDS–PAGE gel (left). The concentration of XKR8 after pulldown is several times lower as judged by its barely detectable band on the same gel (not shown). (A–C, E, G) Molecular weight (kDa) of marker proteins on SDS–PAGE gels are indicated.
-
Figure 1—source data 1
SDS–PAGE gel of full-length rXKR9 shown in Figure 1A.
- https://cdn.elifesciences.org/articles/69800/elife-69800-fig1-data1-v2.zip
-
Figure 1—source data 2
SDS–PAGE gel of caspase-3 treated rXKR9 shown in Figure 1B.
- https://cdn.elifesciences.org/articles/69800/elife-69800-fig1-data2-v2.zip
-
Figure 1—source data 3
SDS–PAGE gel of full-length or caspase-3-treated rXKR9 extracted from respective proteoliposomes shown in Figure 1C.
- https://cdn.elifesciences.org/articles/69800/elife-69800-fig1-data3-v2.zip
-
Figure 1—source data 4
Normalized individual traces of scrambling experiments displayed in Figure 1D.
- https://cdn.elifesciences.org/articles/69800/elife-69800-fig1-data4-v2.zip
-
Figure 1—source data 5
SDS–PAGE gel of the XKR8/basigin complex shown in Figure 1E.
- https://cdn.elifesciences.org/articles/69800/elife-69800-fig1-data5-v2.zip
-
Figure 1—source data 6
Silver-stained SDS–PAGE gel of the XKR9 co-expressed with basigin ahown in Figure 1G.
- https://cdn.elifesciences.org/articles/69800/elife-69800-fig1-data6-v2.zip
-
Figure 1—source data 7
In-gel fluorescence of Venus-tagged proteins detected in SDS–PAGE gel of the XKR8 or XKR9 expressed with basigin shown in Figure 1G.
- https://cdn.elifesciences.org/articles/69800/elife-69800-fig1-data7-v2.zip
Figure 1—figure supplement 1
Biochemical characterization of rXKR9.
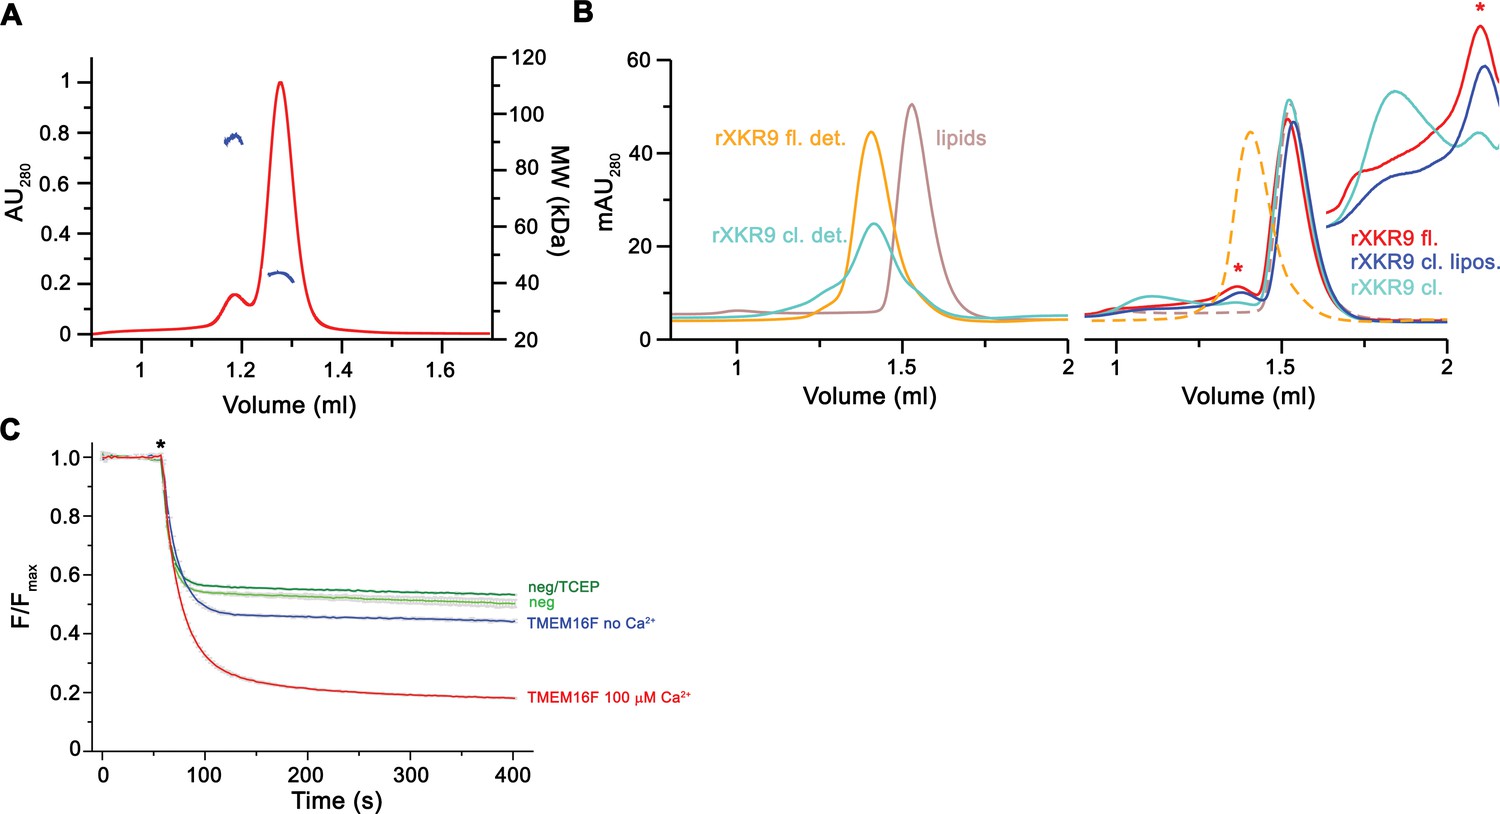
(A) Multi-angle light scattering coupled to size-exclusion chromatography of detergent-solubilized rXKR9. Continuous red trace corresponds to the absorption at 280 nm. The corrected molecular weights of the protein components of monomeric rXKR9 (43.4 kDa) and traces of a dimer are shown in blue. (B) Size-exclusion chromatogram of detergent-solubilized proteoliposomes containing reconstituted rXKR9 constructs used for scrambling experiments shown in Figure 1C,D. Left, chromatograms of detergent-solubilized full-length (rXKR9 fl. det.) and caspase-treated (rXKR9 cl. det.) proteins used for reconstitution and solubilized liposomes (lipids) for the determination of the elution volumes of protein and lipid components. Right, size-exclusion chromatograms of solubilized proteoliposomes of full-length (rXKR9 fl.) and samples treated with caspase-3 before (rXKR9 cl.) and after reconstitution (rXKR9 cl. lipos.). Peak of monomeric protein (*) is indicated. Elution profiles of reference protein and lipid samples are shown as dashed lines for comparison. Inset shows scaled regions of protein peaks and aggregates, which are pronounced in the sample of rXKR9 treated with caspase-3 prior to reconstitution. (C) Assay to monitor the protein-catalyzed movement of fluorescent lipids between both leaflets of a bilayer. The addition of the reducing agent dithionite to the solution (*) bleaches the fluorescent groups located in the outer leaflet, which leads to a decrease of the initial fluorescence to about half (45–55% depending on the preparation) in the absence of scrambling activity and a further reduction in case of lipid flip-flop. Traces of TMEM16F in absence and presence of 100 µM Ca2+ are shown as example for an inactive and an active scramblase. Traces of liposomes without protein, in presence and absence of 1 mM TCEP are displayed for comparison. Data show mean and standard deviations of three technical replicates.
-
Figure 1—figure supplement 1—source data 1
Normalized individual traces of scrambling experiments displayed in Figure 1—figure supplement 1C.
- https://cdn.elifesciences.org/articles/69800/elife-69800-fig1-figsupp1-data1-v2.zip
Figure 1—figure supplement 2
Preparation of rXKR9-Sb1XKR9 complexes.
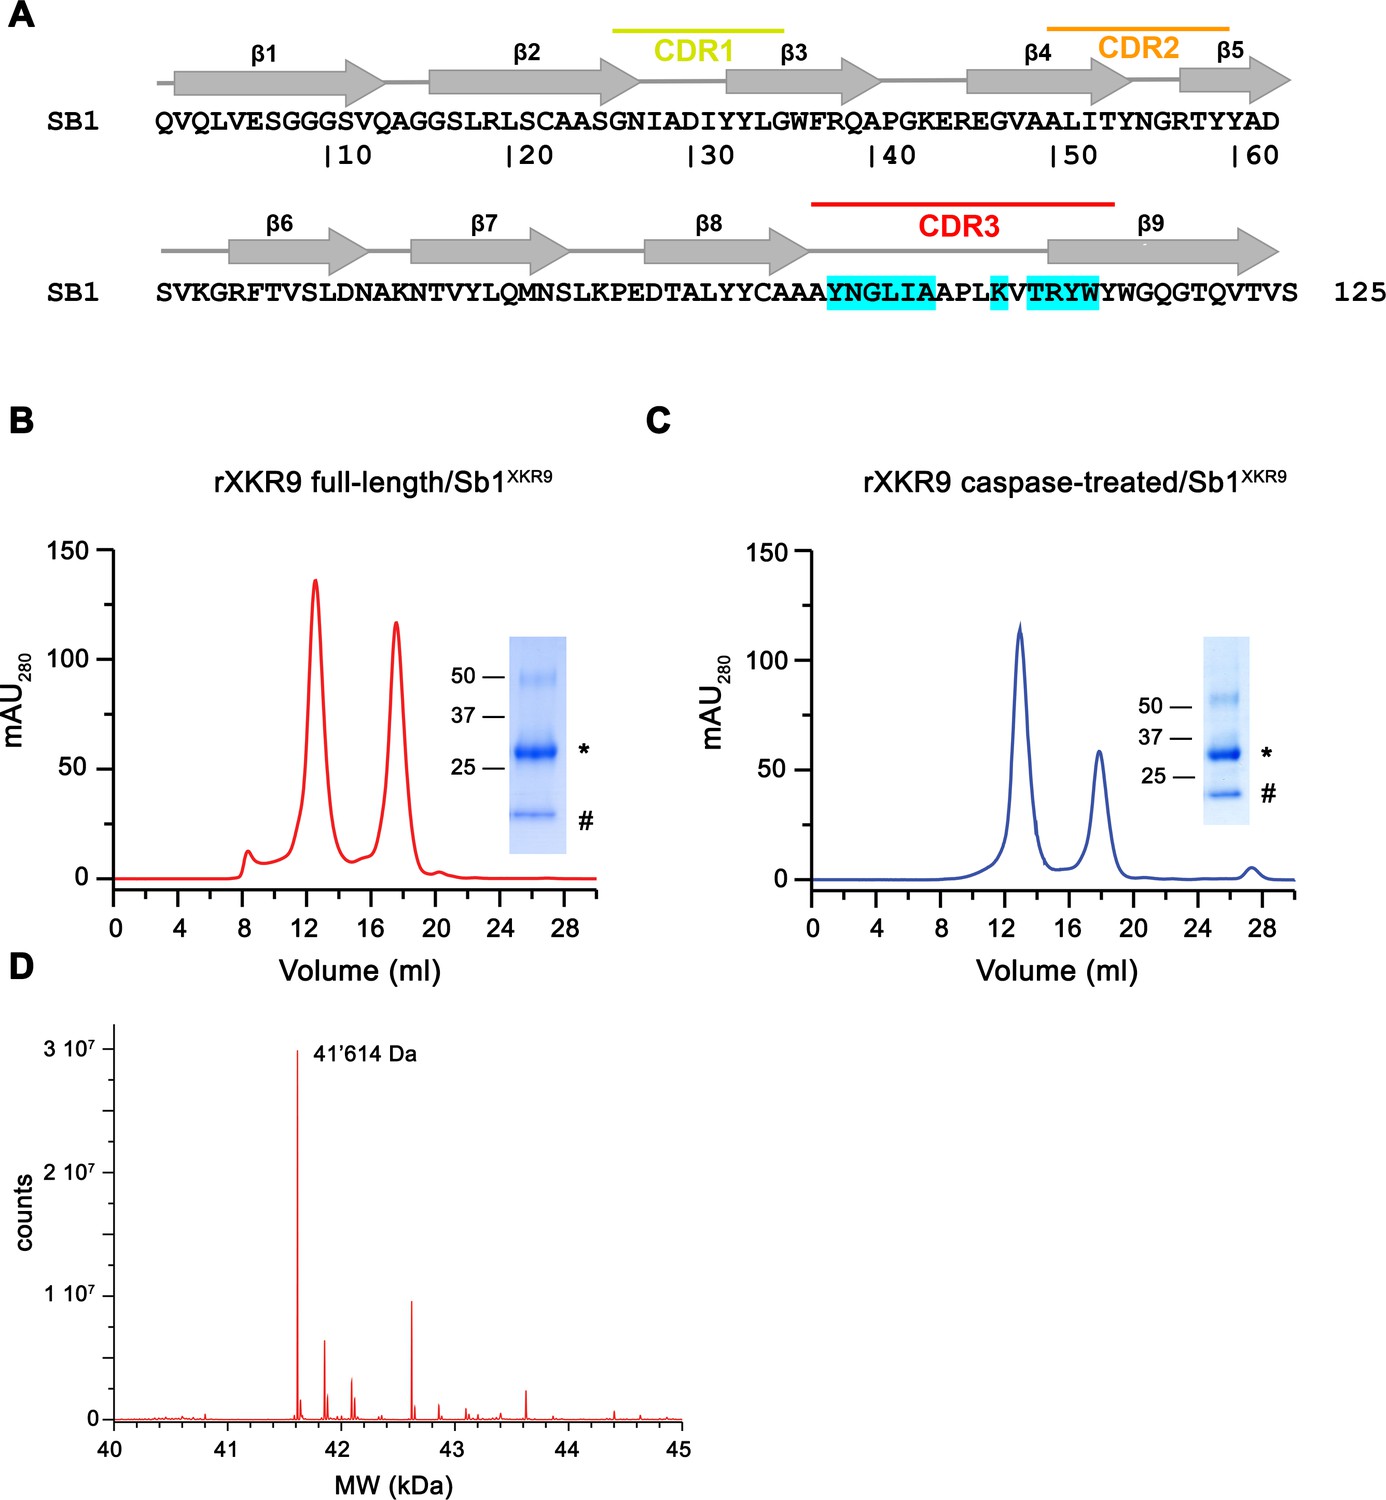
(A) Sequence of the sybody Sb1XKR9. Secondary structure and randomized complementary determining regions are indicated. Residues in contact with rXKR9 are highlighted in cyan. Size-exclusion chromatogram of full-length (B) and caspase-treated (C) rXKR9-Sb1XKR9 used for cryo-EM analysis. Unbound sybodies added in excess are eluted as peak with a retention volume of 18 ml. Insets show SDS–PAGE of the pooled and concentrated peak samples. rXKR9 and Sb1 XKR9 are marked by ‘*’ and ‘#’, respectively. (D) Section of the mass spectrum of the rXKR9-Sb1XKR9 complex confirming the reduced mass of rXKR9 after caspase treatment. The observed molecular weight (41,614 Da) matches the expected weight of the cleaved construct.
-
Figure 1—figure supplement 2—source data 1
SDS–PAGE gel of purified full-length rXKR9 in complex with Sb1XKR9 shown in Figure 1B.
- https://cdn.elifesciences.org/articles/69800/elife-69800-fig1-figsupp2-data1-v2.zip
-
Figure 1—figure supplement 2—source data 2
SDS–PAGE gel of purified caspase-3 treated rXKR9 in complex with Sb1XKR9 shown in Figure 1B.
- https://cdn.elifesciences.org/articles/69800/elife-69800-fig1-figsupp2-data2-v2.zip
-
Figure 1—figure supplement 2—source data 3
Mass spectrum of caspase-3-treated XKR9 shown in Figure 1—figure supplement 2D.
- https://cdn.elifesciences.org/articles/69800/elife-69800-fig1-figsupp2-data3-v2.zip
Figure 1—figure supplement 3
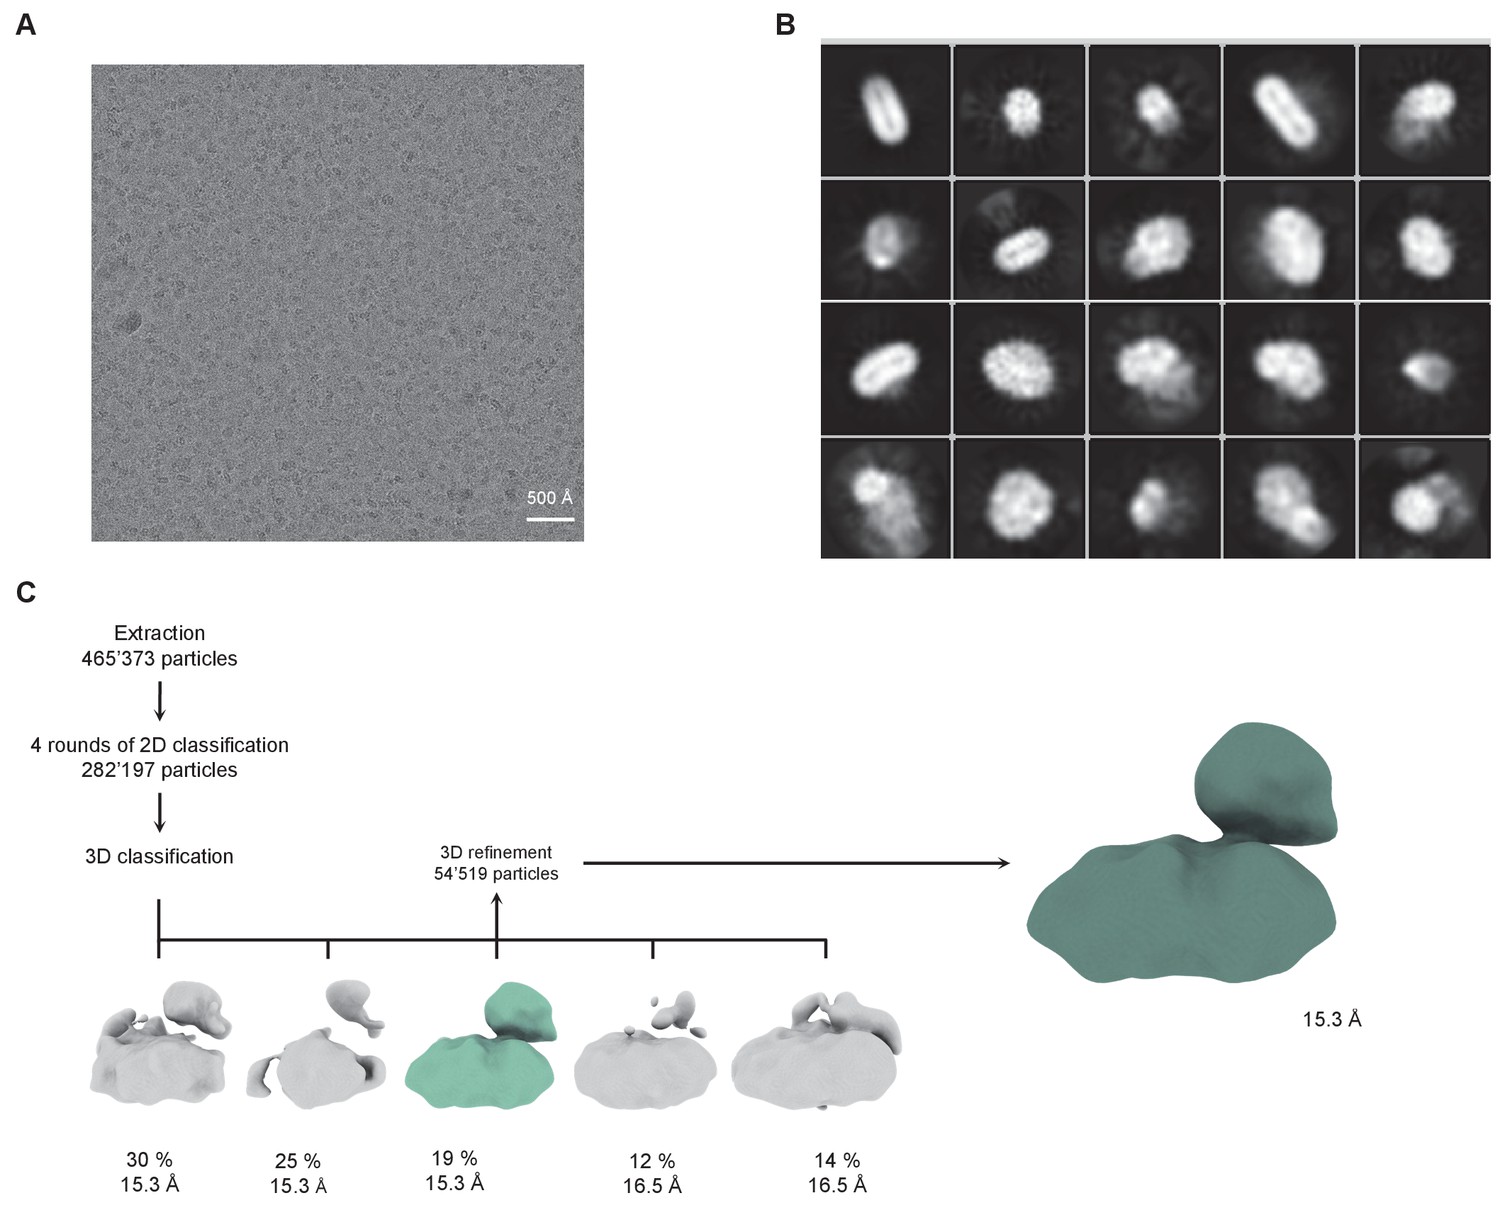
Low-resolution cryo-EM reconstruction of a hXKR8-basigin complex.
(A) Representative cryo-EM micrograph acquired with a Tecnai G2 Polara microscope and a K2 summit camera. (B) 2D class averages of a hXKR8-basigin complex. (C) Data processing workflow. After extraction and four rounds of 2D classification, a 3D classification with five classes was performed. The class with protein-like features (highlighted in color) was used as an input for 3D refinement with C1 symmetry, which yielded a 15.3 Å map. The percent of particles and resolution of each class are indicated.
Figure 2 with 4 supplements
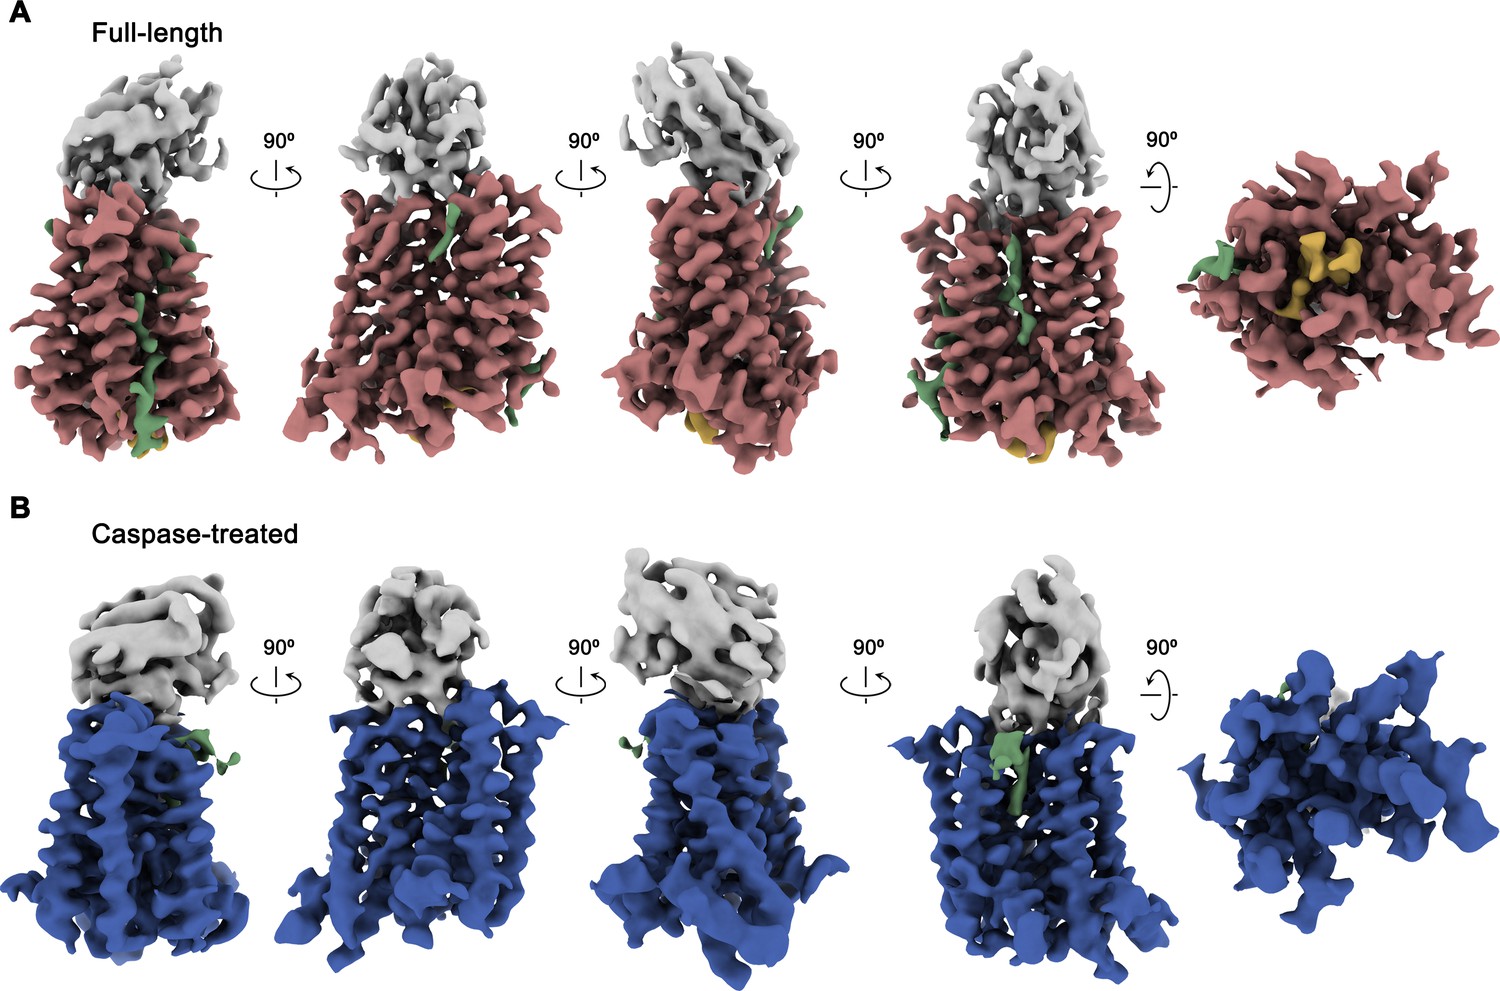
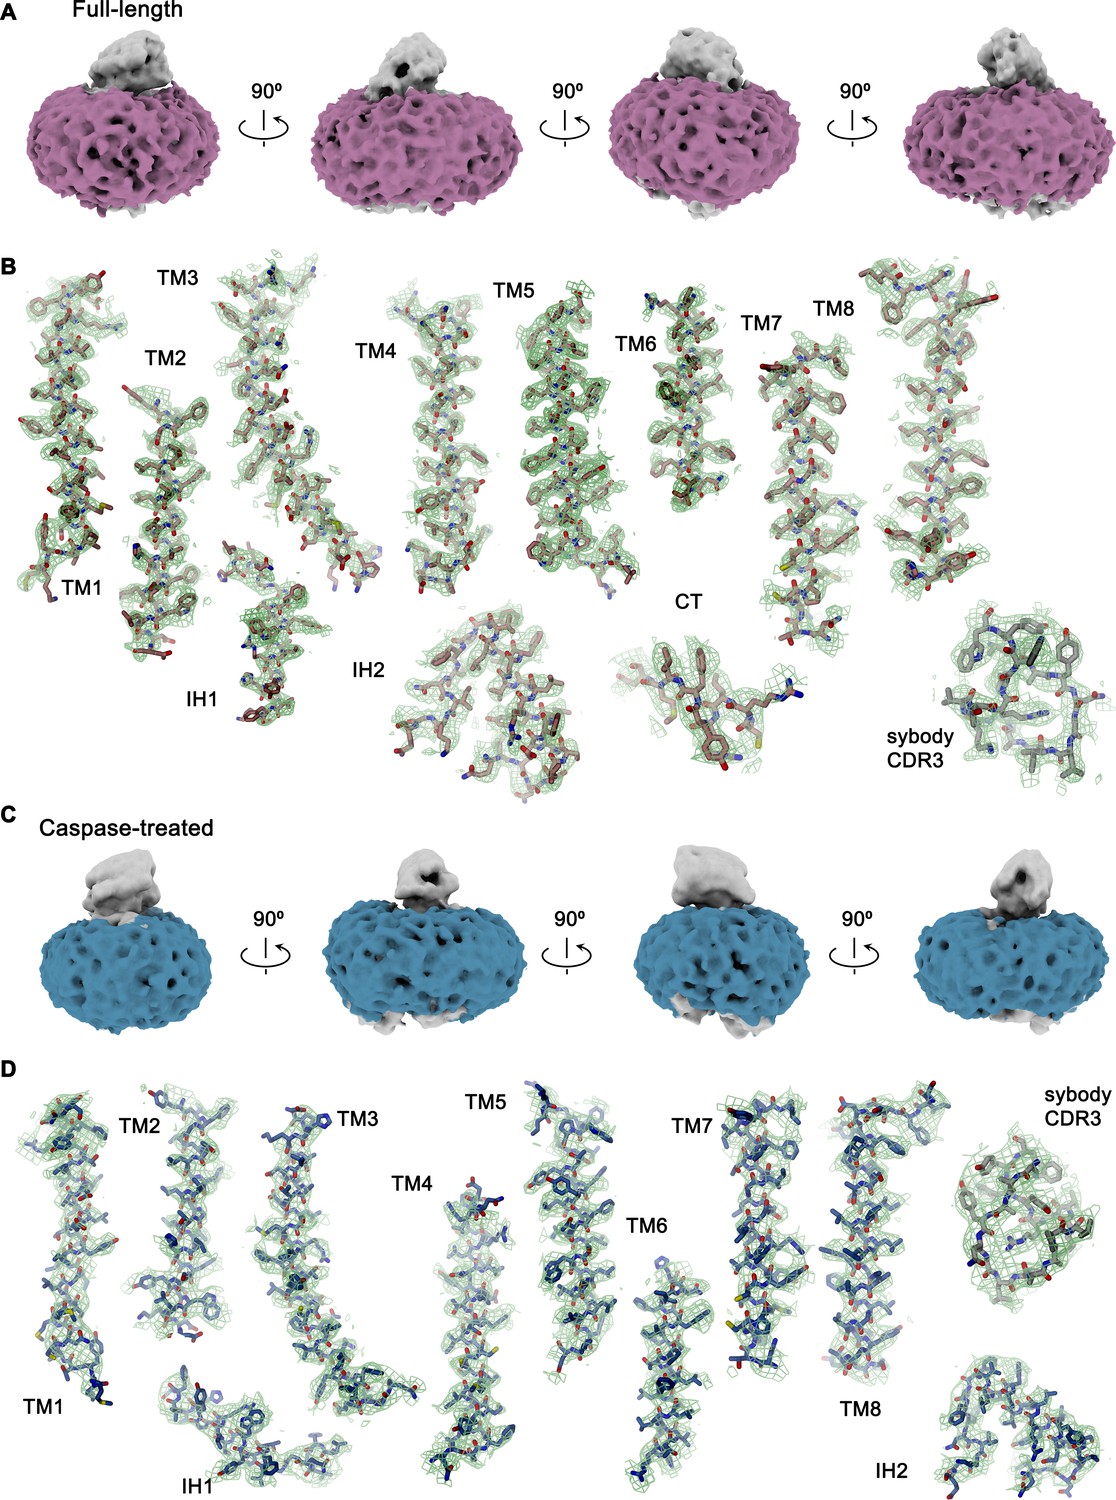
Cryo-EM maps of rXKR9-Sb1XKR9 complexes.
(A) Cryo-EM density of complexes of the full-length construct at 3.66 Å (contoured at 9.5 σ) and (B), the caspase-treated protein at 4.3 Å (contoured at 8.8 σ). The relationship between orientations is indicated. rXKR9 density is shown in unique colors, density of Sb1XKR9 is shown in gray, residual density that can be attributed to bound lipids in green. Density of the C-terminus of full-length protein (A) is colored in orange.
Figure 2—figure supplement 1
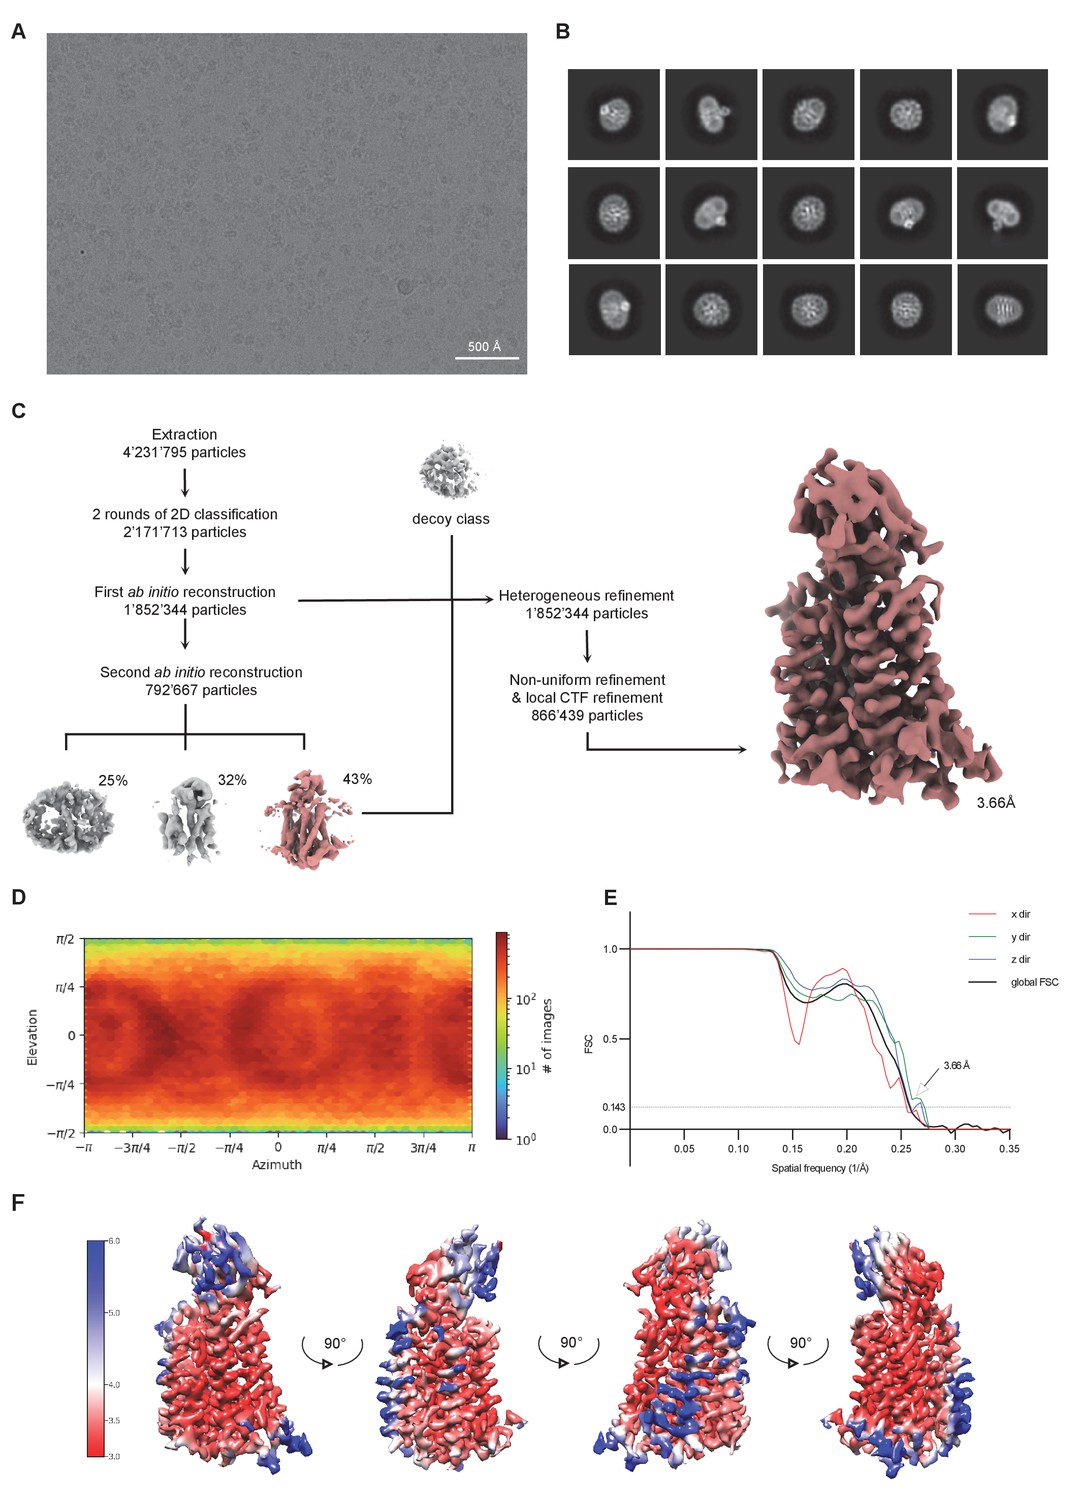
Cryo-EM reconstruction of the full-length rXKR9-Sb1XKR9 complex.
(A) Representative micrograph of the complex acquired with a Titan Krios G3i microscope equipped with a K3 camera. (B) 2D class averages of the rXKR9-Sb1XKR9 dataset. (C) Data processing workflow. After extraction and two rounds of 2D classification, a first ab initio reconstruction with five classes was performed (classes not shown). The particles classes with protein-like features were used as an input for the second round of ab initio reconstruction. The second ab initio reconstruction resulted in one class with distinct protein features (highlighted in color). The particle distribution is indicated in %. The class with the highest number of particles, together with a decoy class, and all the particles used for the second round of ab initio reconstruction were subjected to three rounds of heterogeneous refinement. Non-uniform (NU) refinement, local CTF-refinement and a second round of NU-refinement with C1 symmetry yielded a map at a resolution of 3.66 Å. (D) Angular distribution of particle orientations. The heatmap displays the number of particles for a given viewing angle. (E) Directional and global FSC plots. The global FSC is shown in black. Dashed line indicates 0.143 cut-off and the resolution at which the FSC curve drops below 0.143 is indicated. The directional FSC curves providing an estimation of anisotropy of the dataset are shown for directions x, y, and z. (F) Final 3D reconstruction of the rXkr9-Sb1XKR9 complex in indicated orientations, colored according to the local resolution, estimated in cryoSPARC v.3.2.0.
Figure 2—figure supplement 2
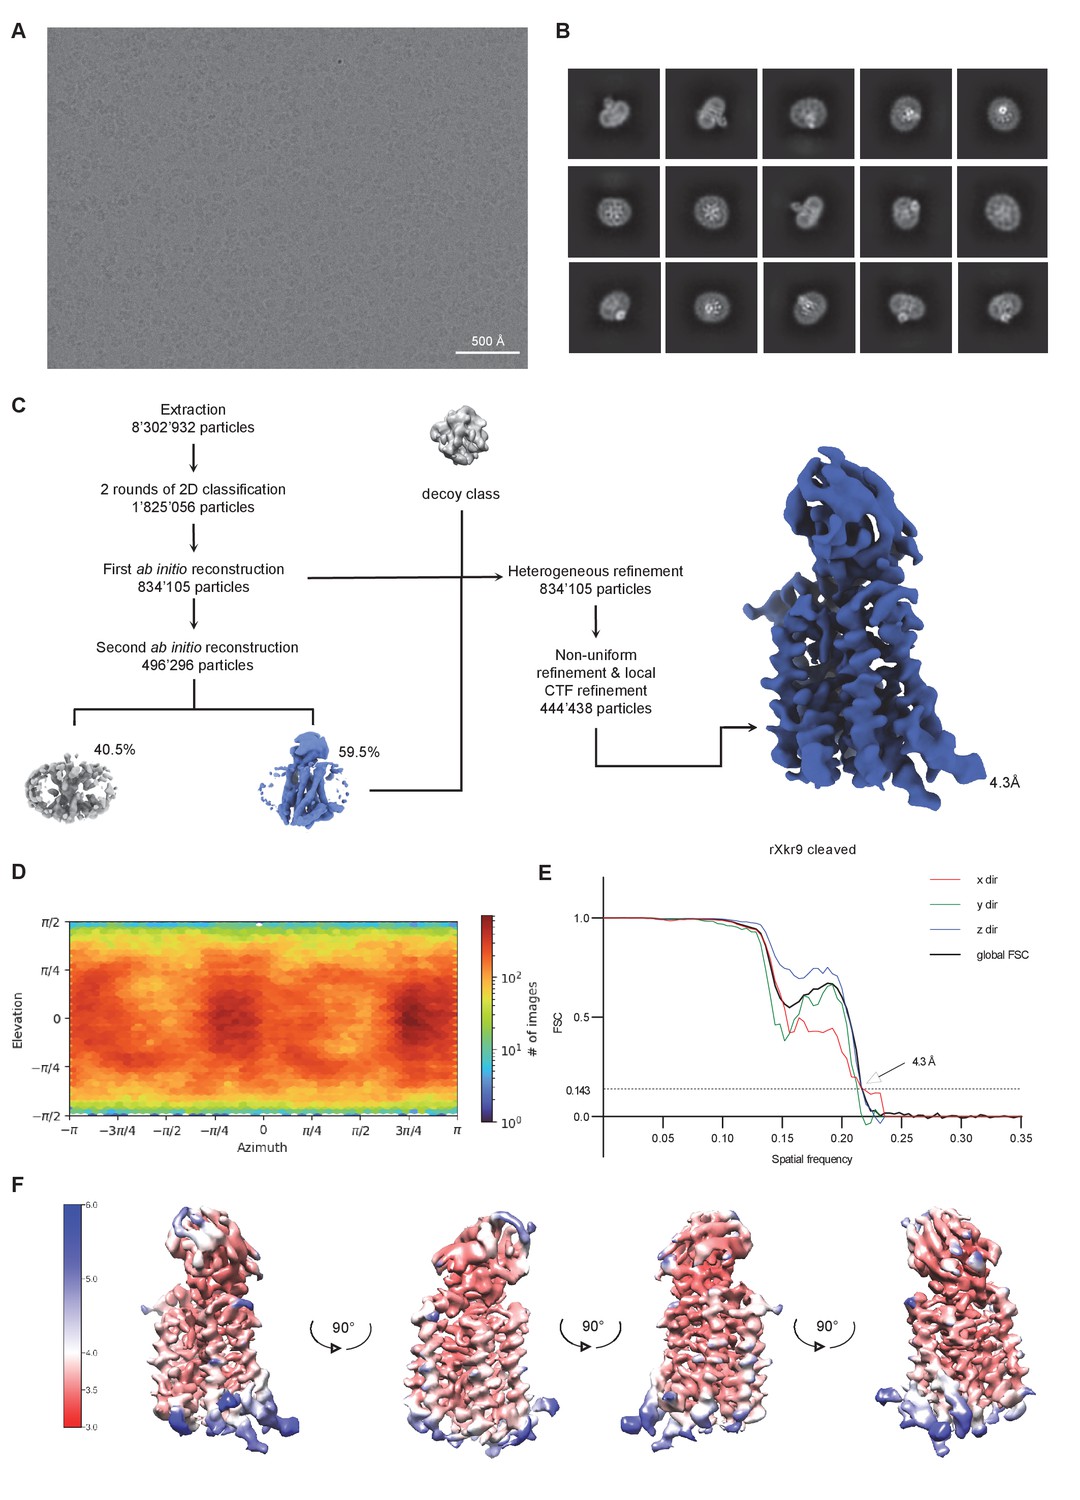
Cryo-EM reconstruction of the caspase-treated rXKR9-Sb1XKR9 complex.
(A) Representative micrograph of the complex acquired with a Titan Krios G3i microscope equipped with a K3 camera. (B) 2D class averages of the caspase-treated rXKR9-Sb1XKR9 dataset. (C) Data processing workflow. After extraction and two rounds of 2D classification, a first ab initio reconstruction with five classes was performed (classes not shown). The particles classes, with protein-like features, were used as an input for the second round of ab initio reconstruction. The second ab initio reconstruction resulted in one class with distinct protein features (highlighted in color). The particle distribution is indicated in %. The class with the highest number of particles, together with a decoy class, and all the particles used for the second round of ab initio reconstruction were subjected to three rounds of heterogeneous refinement. Non-uniform (NU) refinement, local CTF-refinement, and a second round of NU-refinementwith C1 symmetry yielded a map with a resolution of 4.3 Å. (D) Angular distribution of particle orientations. The heatmap displays the number of particles for a given viewing angle. (E) Directional and global FSC plots. The global FSC is shown in black. Dashed line indicates 0.143 cut-off and the resolution at which the FSC curve drops below 0.143 is indicated. The directional FSC curves providing an estimation of anisotropy of the dataset are shown for x, y, and z directions. (F) Final 3D reconstruction of the caspase-cleaved rXkr9-Sb1XKR9 complex in indicated orientations, colored according to the local resolution, estimated in cryoSPARC v.3.2.0.
Figure 2—figure supplement 3
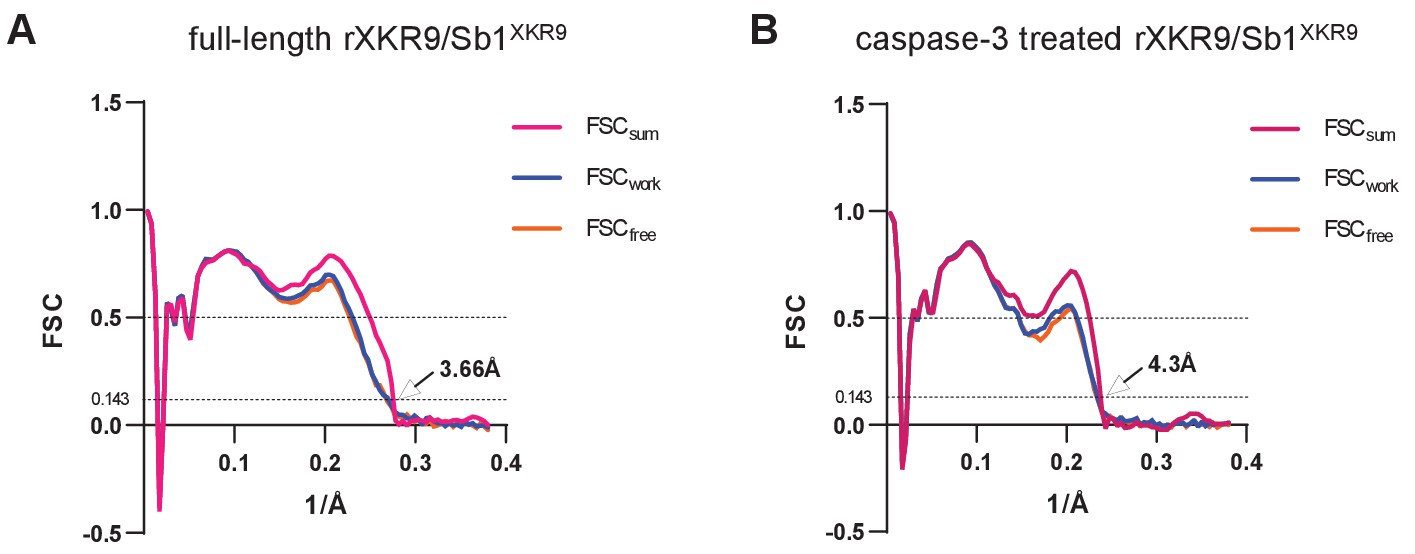
Model validation.
FSC plots of atomic rXKR9-Sb1XKR9 models refined against the respective cryo-EM data. (A) Full-length rXKR9-Sb1XKR9, (B) Caspase-3-treated rXKR9-Sb1XKR9. FSCsum (magenta) is calculated for the full masked map and the model refined against the complete dataset. FSCwork (blue) is calculated for the half-map one and the model refined against the dataset comprising half-map 1. FSCfree (orange) is calculated for the half-map two and the model refined against the dataset comprising half-map 1. The gold-standard FSC threshold (0.143) was used for FSCwork, FSC free, and FSCsum.
Figure 2—figure supplement 4
Cryo-EM density.
(A) Density of the detergent belt (magenta) in the ab initio cryo-EM reconstruction of the full-length rXKR9-Sb1XKR9 complex (contoured at 5.8σ). Relationships between orientations are indicated. (B) Sections of the cryo-EM density (green, 8σ) superimposed on the refined structure of the full-length rXKR9-Sb1XKR9 complex 3.66 Å. (C) Density of the detergent belt (blue) in the ab initio Cryo-EM reconstruction of the caspase-cleaved rXKR9-Sb1XKR9 complex (contoured at 6.7σ). Relationships between orientations are indicated. (D) Sections of the cryo-EM density (green, 7σ) superimposed on the refined structure of the caspase-cleaved rXKR9-Sb1XKR9 complex 4.3 Å.
Figure 3 with 1 supplement
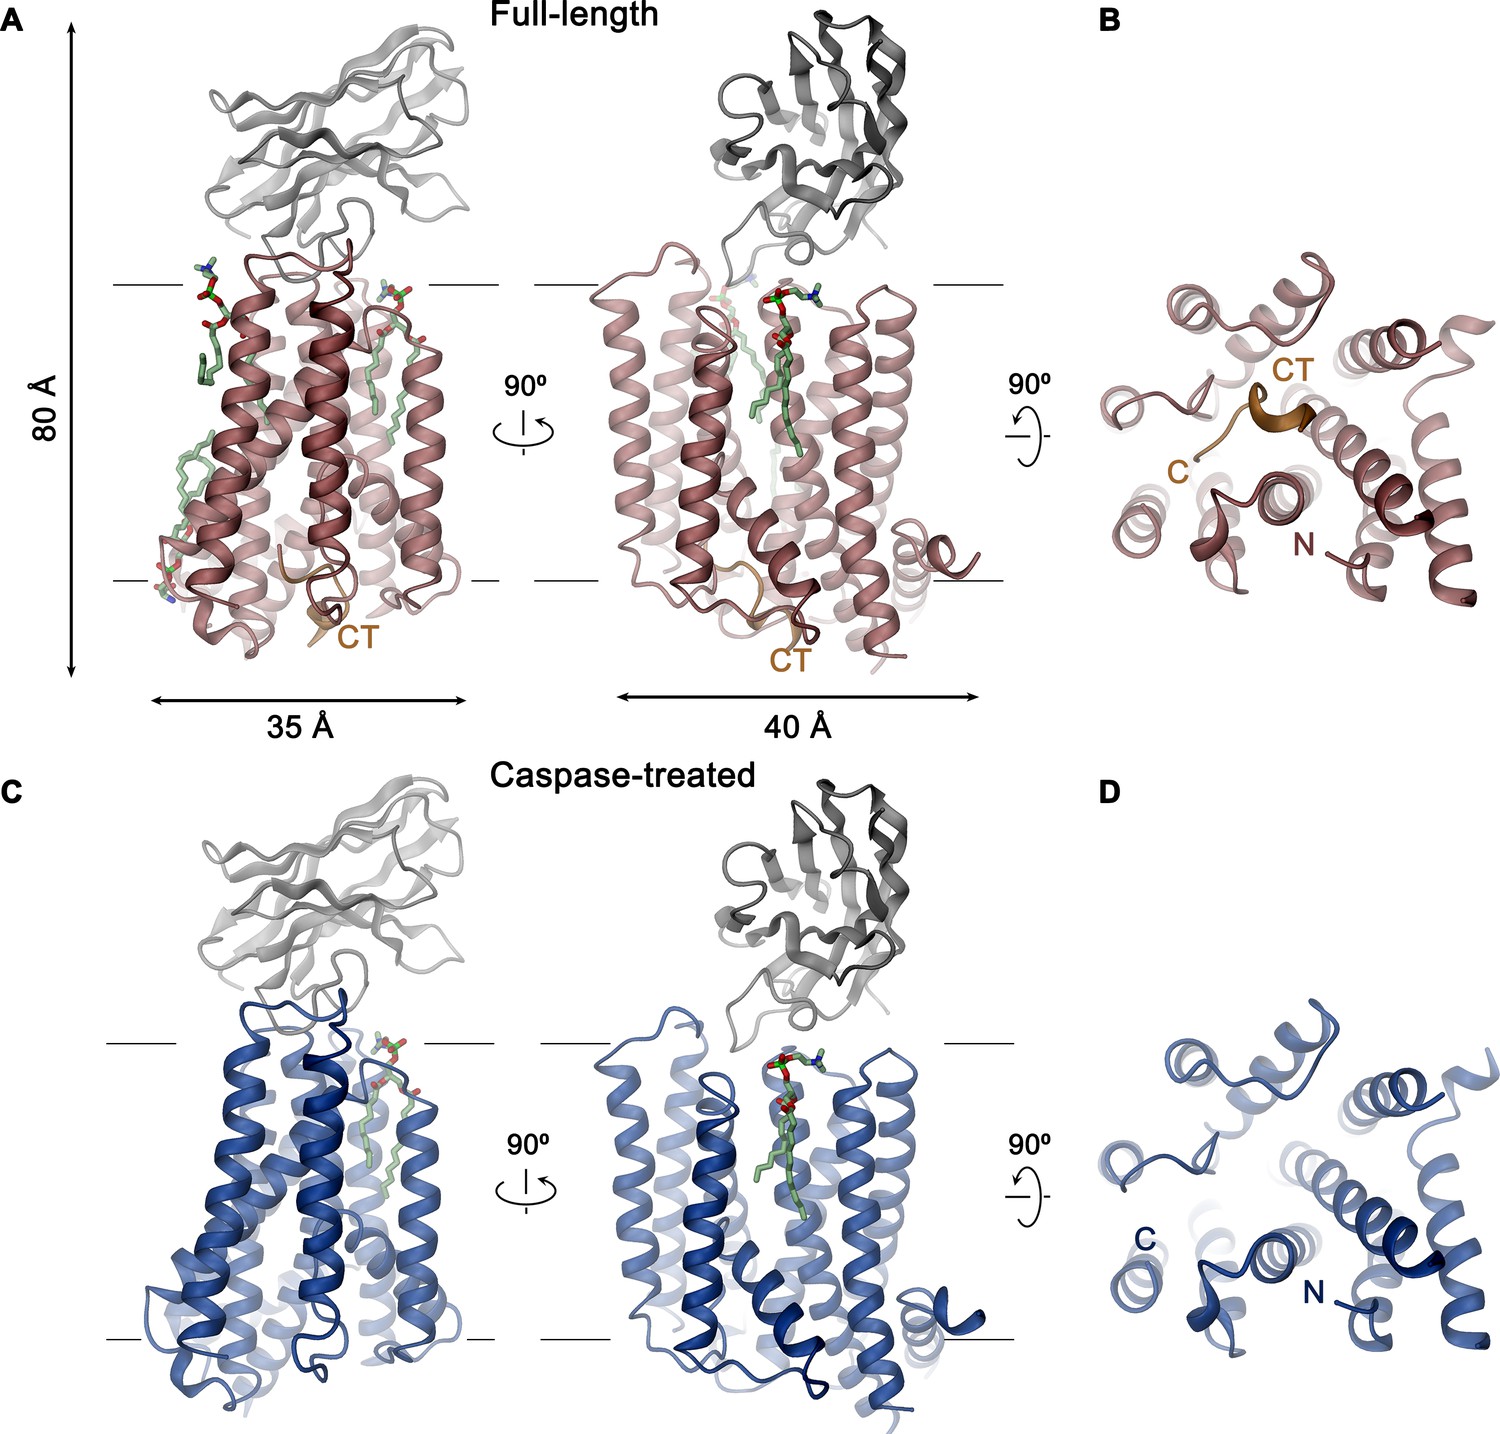
XKR9-SB1XKR9 complex.
Ribbon representation of Sb1XKR9 complexes of (A, B) full-length and (C, D) caspase-treated rXKR9. The relationship between orientations is indicated. rXKR9 is shown in unique colors, Sb1XKR9 in gray, and the C-terminus of the full-length protein (CT) that is cleaved upon caspase-3-treatment in orange. Bound lipids are shown in green as stick models. (A, C) View is from within the membrane, with membrane boundaries indicated. (B, D) View is from the cytoplasm.
Figure 3—figure supplement 1
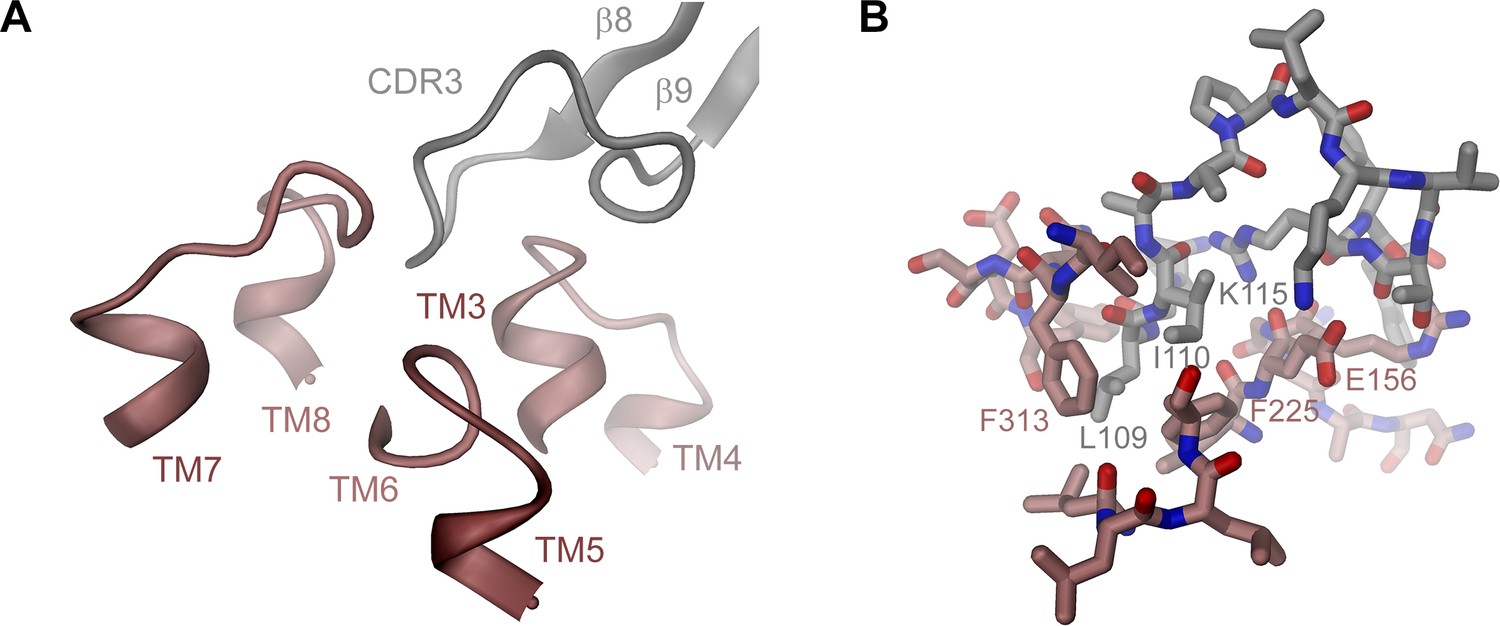
rXKR9-Sb1XKR9 interactions.
(A) Ribbon representation of the rXKR9-Sb1XKR9 interaction interface. Color code is as in Figure 3A. Secondary structure elements and complementary determining regions are indicated. (B) Stick model of interacting residues. View as in (A), with selected residues labeled.
Figure 4 with 1 supplement
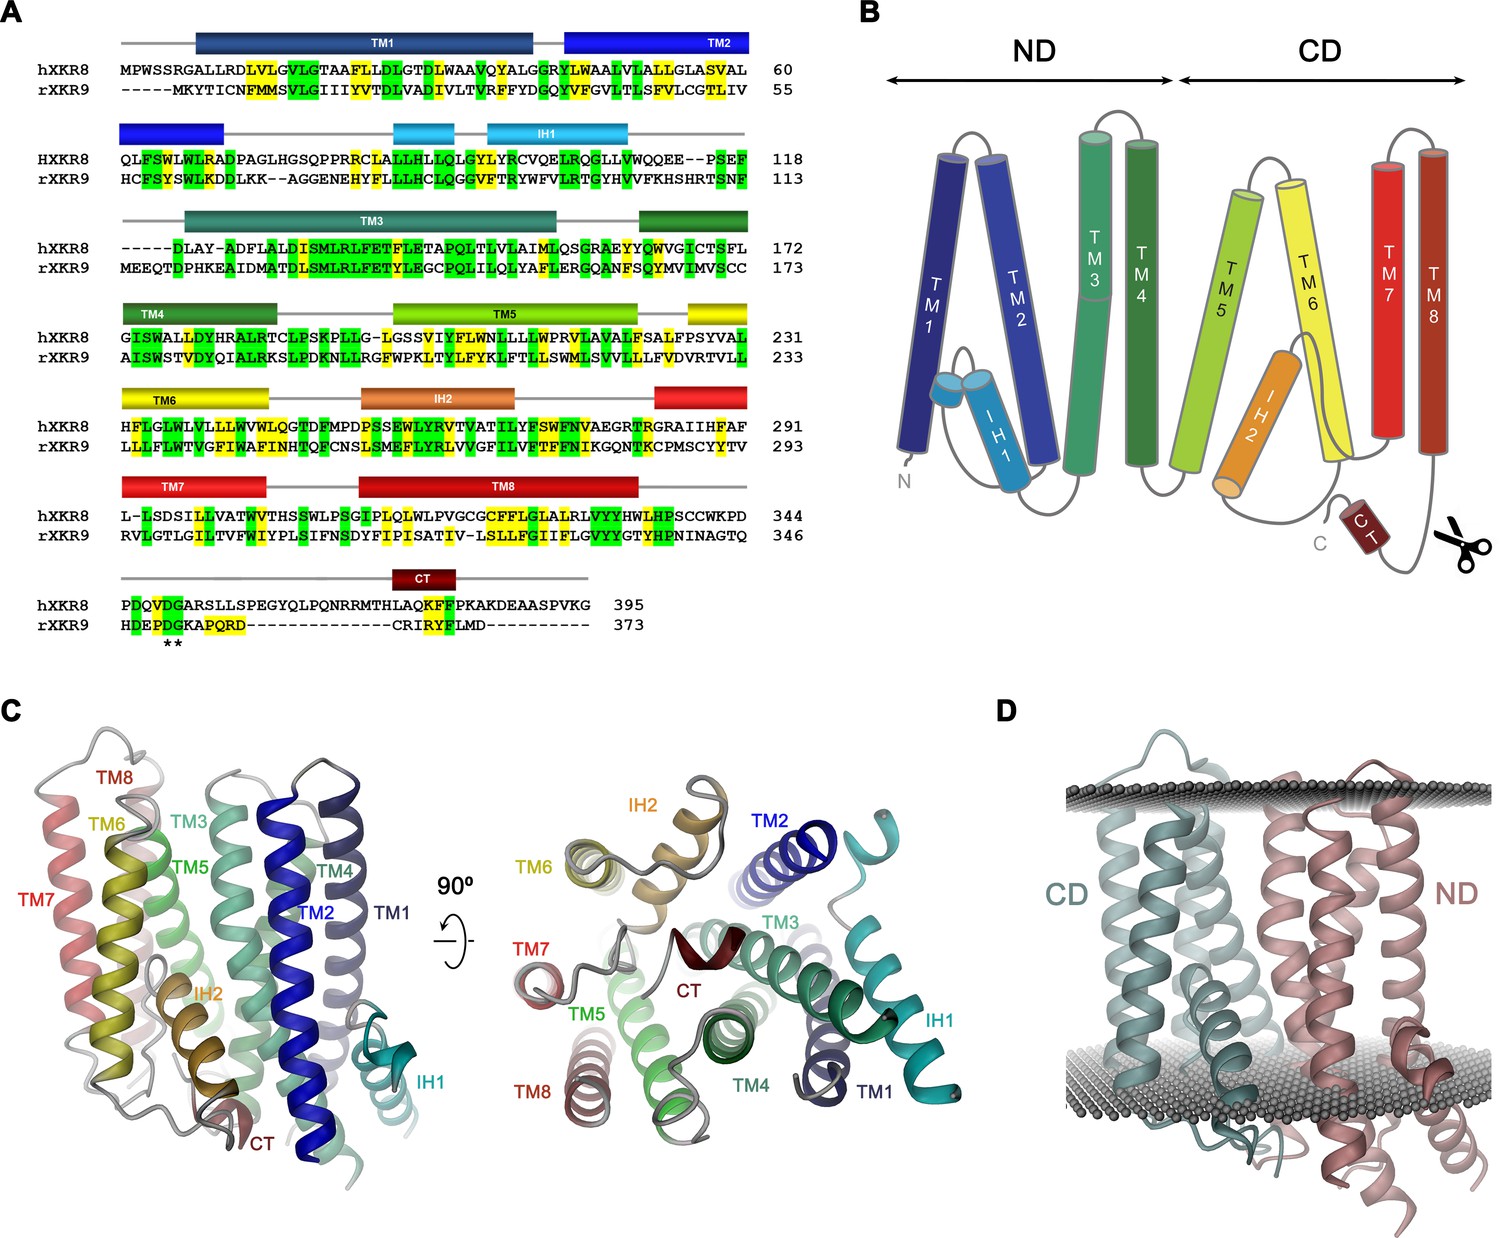
Sequence and topology.
Sequence alignment of human XKR8 (hXKR8, NCBI: NP_060523.2) and rXKR9 (NCBI: NP_001012229.1), secondary structure elements are indicated. Identical residues are highlighted in green, similar residues in yellow. The caspase-3 cleavage site is marked by *. (B) Schematic topology of rXKR9. ND and CD refer to N-terminal and C-terminal domain, respectively. Scissors indicate location of caspase cleavage site. (C) Ribbon representation of the rXKR9 subunit. The relationship between orientations is indicated. Color code is as in (A) and (B). (D) Ribbon representation of rXKR9 with ND and CD shown in unique colors. Gray spheres indicate inner and outer boundaries of the hydrophobic core of the lipid bilayer.
Figure 4—figure supplement 1
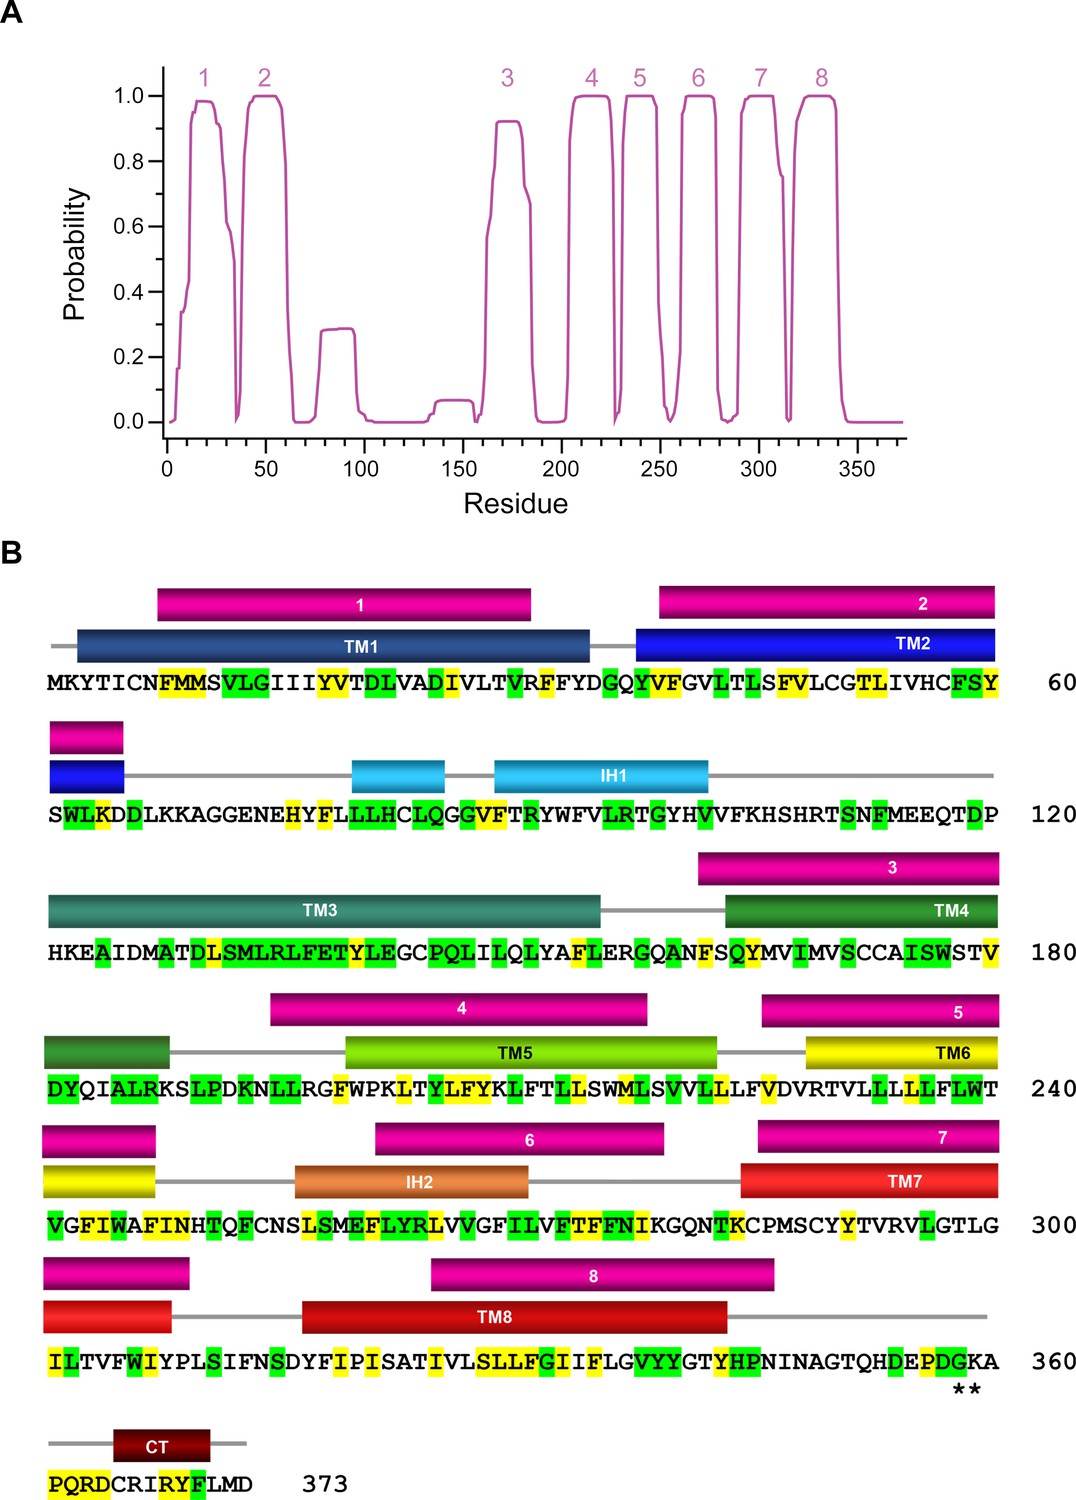
Hydropathy analysis of the rXKR9 sequence.
(A) Prediction of membrane-spanning helices (numbered) by the TMHMM server (Krogh et al., 2001). (B) rXKR9 sequence comparing location of predicted (top, magenta) and actual TM helices (bottom colored as in Figure 4A). The low score in the prediction of TM3 and the high score in the region around IH2 is apparent.
Figure 5 with 2 supplements
Features of the rXKR9 structure of potential functional relevance.
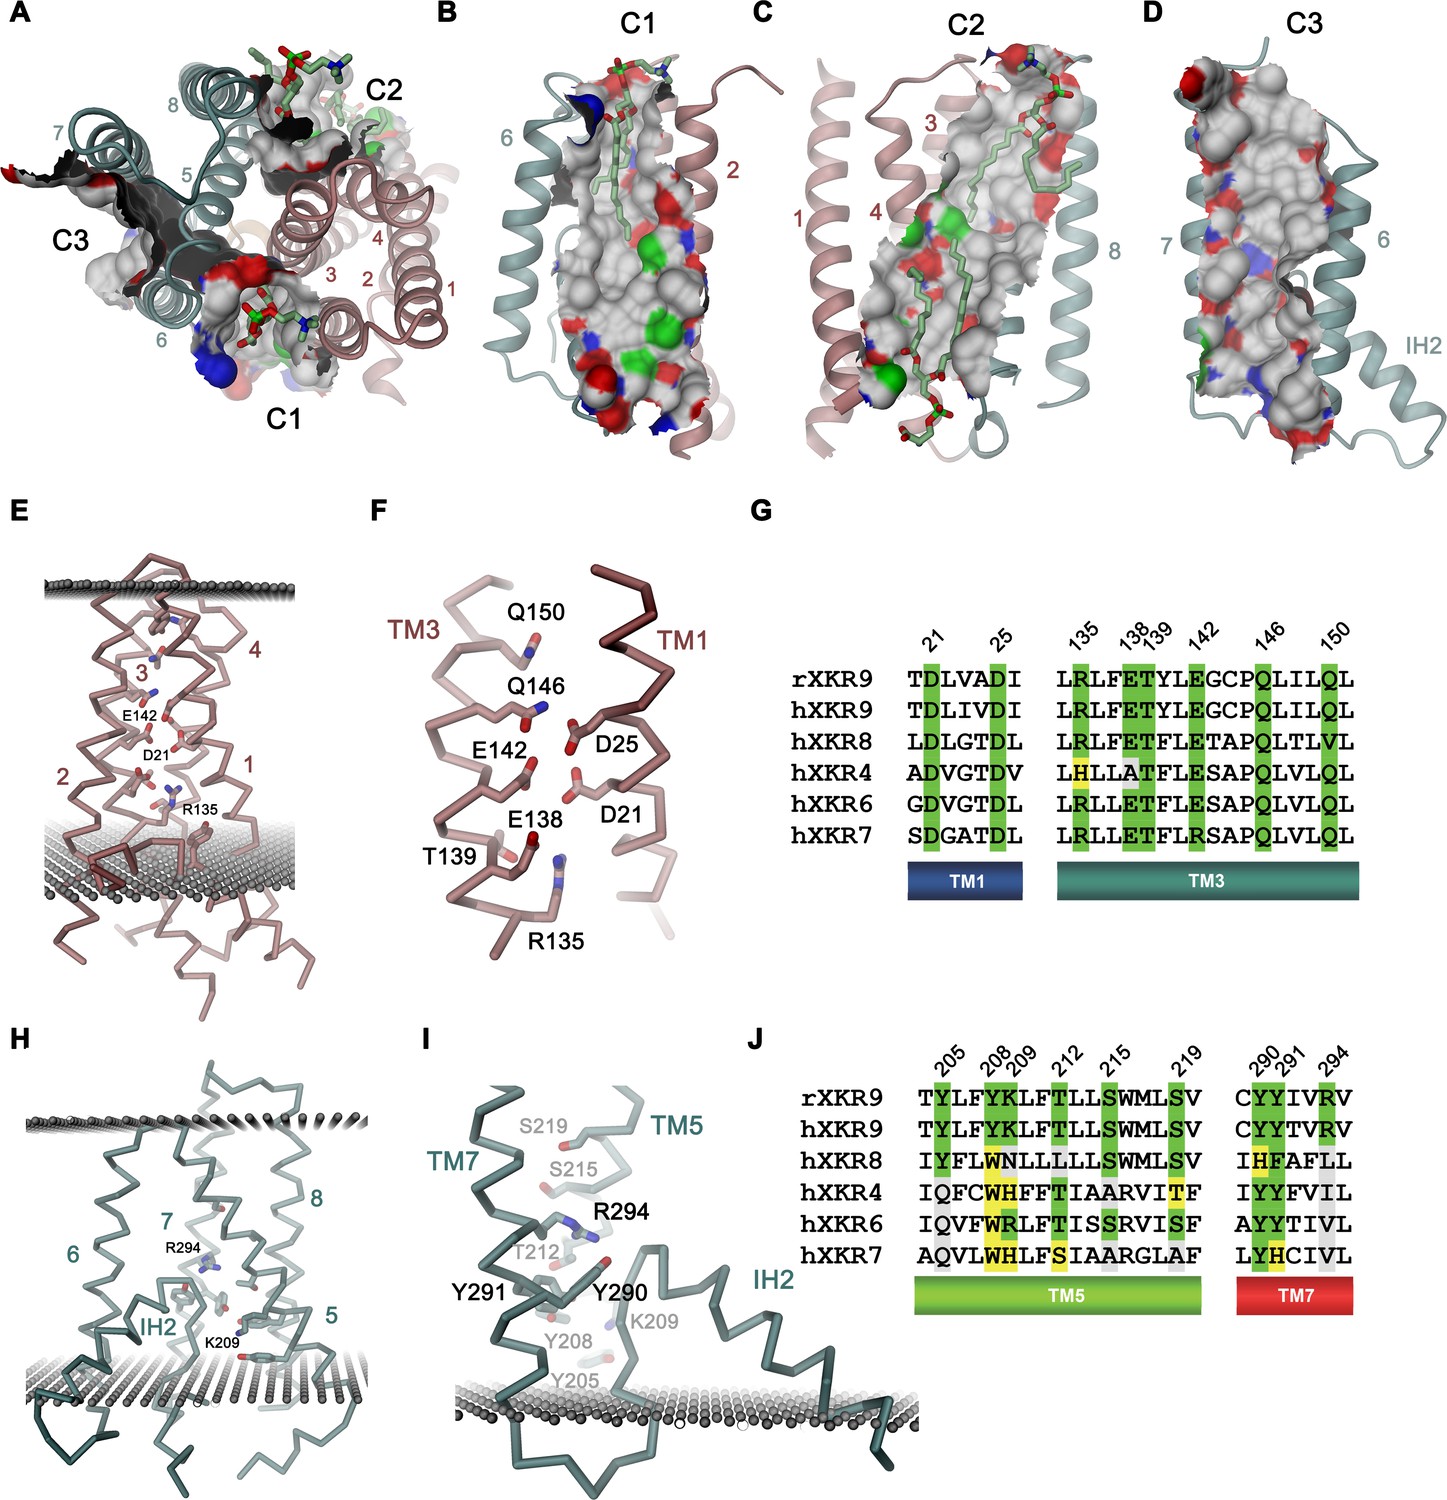
(A–D) Cavities on the surface of the rXKR9 structure that are suitable for lipid interactions. Segments of the protein are displayed as ribbon. Sections of the molecular surface are shown and colored according to the contacting atoms (carbon: gray, oxygen: red, nitrogen: blue, sulfur: green). Transmembrane helices are numbered and cavities are labeled (C1–C3). (A) View from the extracellular side. (B) Cavities C1, (C), C2, and (D), C3 viewed from within the membrane. (A–C) Bound lipids are shown as sticks. (E) Structure of polar residues buried in the ND. (F) Closeup of the membrane-inserted parts of TM1 and 3 displaying the position of conserved polar and charged residues. (G) Sequence alignment of the regions displayed in (F) in rXKR9 and selected human paralogs. (H) Structure of polar residues buried in the CD. (I) Closeup of the membrane inserted region encompassing TM5, TM7 and IH2 displaying the position of polar and charged residues. (J) Sequence alignment of the regions displayed in (H) in rXKR9 and selected human paralogs. (G, J) Alignment of selected regions of rXKR9 (NCBI: NP_001012229.1) with hXKR9 (NCBI: NP_001011720.1), hXKR8 (NCBI: NP_060523.2), hXKR4 (NCBI: NP_443130.1), hXKR6 (NCBI: NP_775954.2), and hXKR7 (NCBI: NP_001011718.1). Secondary structure elements are indicated. Identical residues are highlighted in green, similar residues in yellow. (E, H, I) Boundaries of the hydrophobic core of the bilayer are indicated as spheres. (C, E, H, I) The protein is displayed as Cα-trace with selected residues shown as sticks. Secondary structure elements and selected residues are labeled. (A–F, H, I) Coloring of the protein is as in Figure 4D, ND in red and CD in cyan.
Figure 5—figure supplement 1
Lipid density.
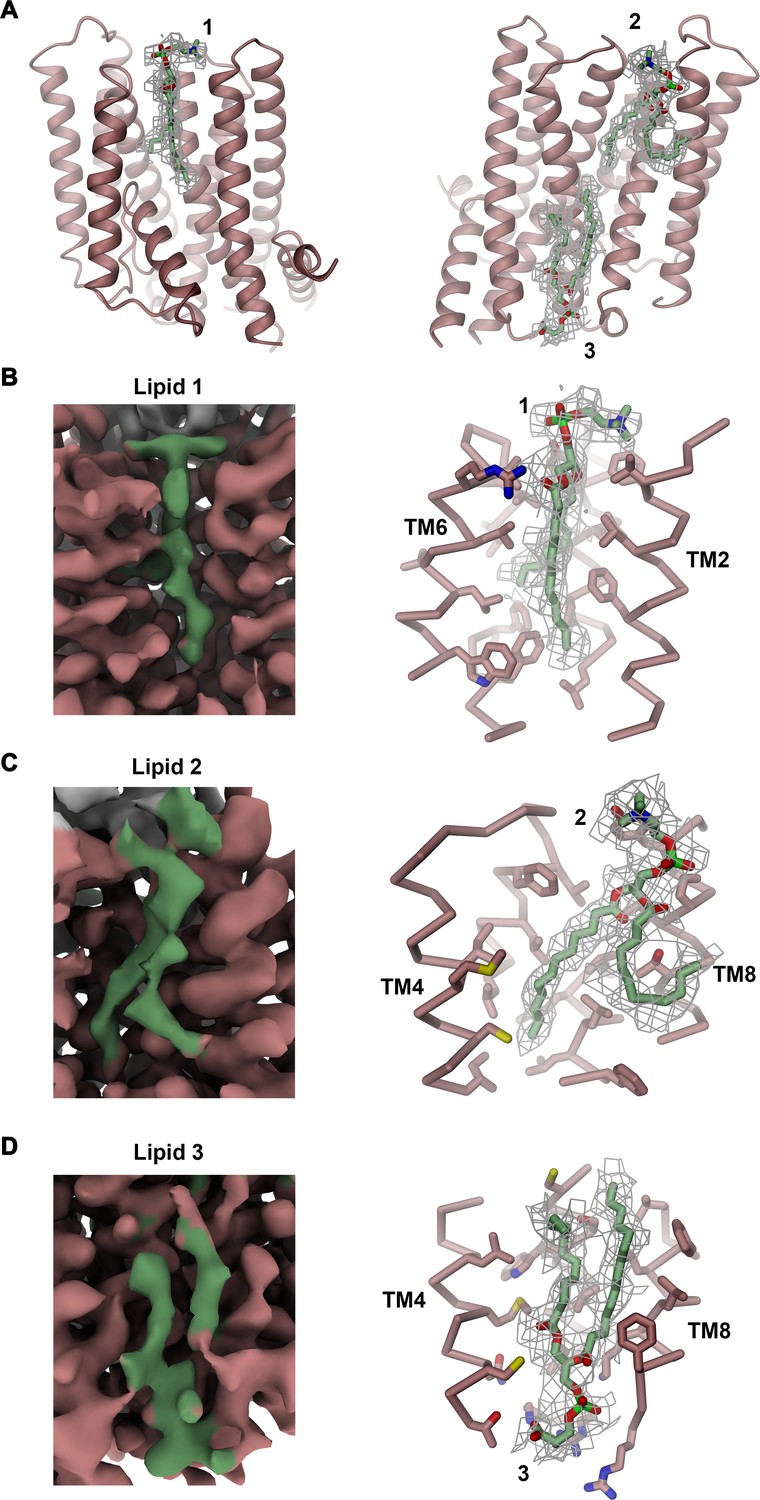
(A) Residual density in the cavities C1 and C2 at the domain interface of rXKR9. Densities in C1 (left, 1) and C2 (right, 2) were interpreted by phosphatidylcholine molecules, another density in C2 (right, 3) by a phosphatidylserine (green). (B–D) Closeup of the region surrounding putative lipid binding sites. Cryo-EM density of the entire region is shown left. The presumable lipid density with the surrounding protein displayed as Cα-trace and interacting residues as sticks are shown right. (A–D) Residual lipid density was contoured at 4.5 σ and displayed as gray mesh. (B–D) Cryo-EM density in left panels is contoured at 4.5 σ. Density attributed to the protein is colored in red, and density of the lipid in green.
Figure 5—figure supplement 2
Surface electrostatics.
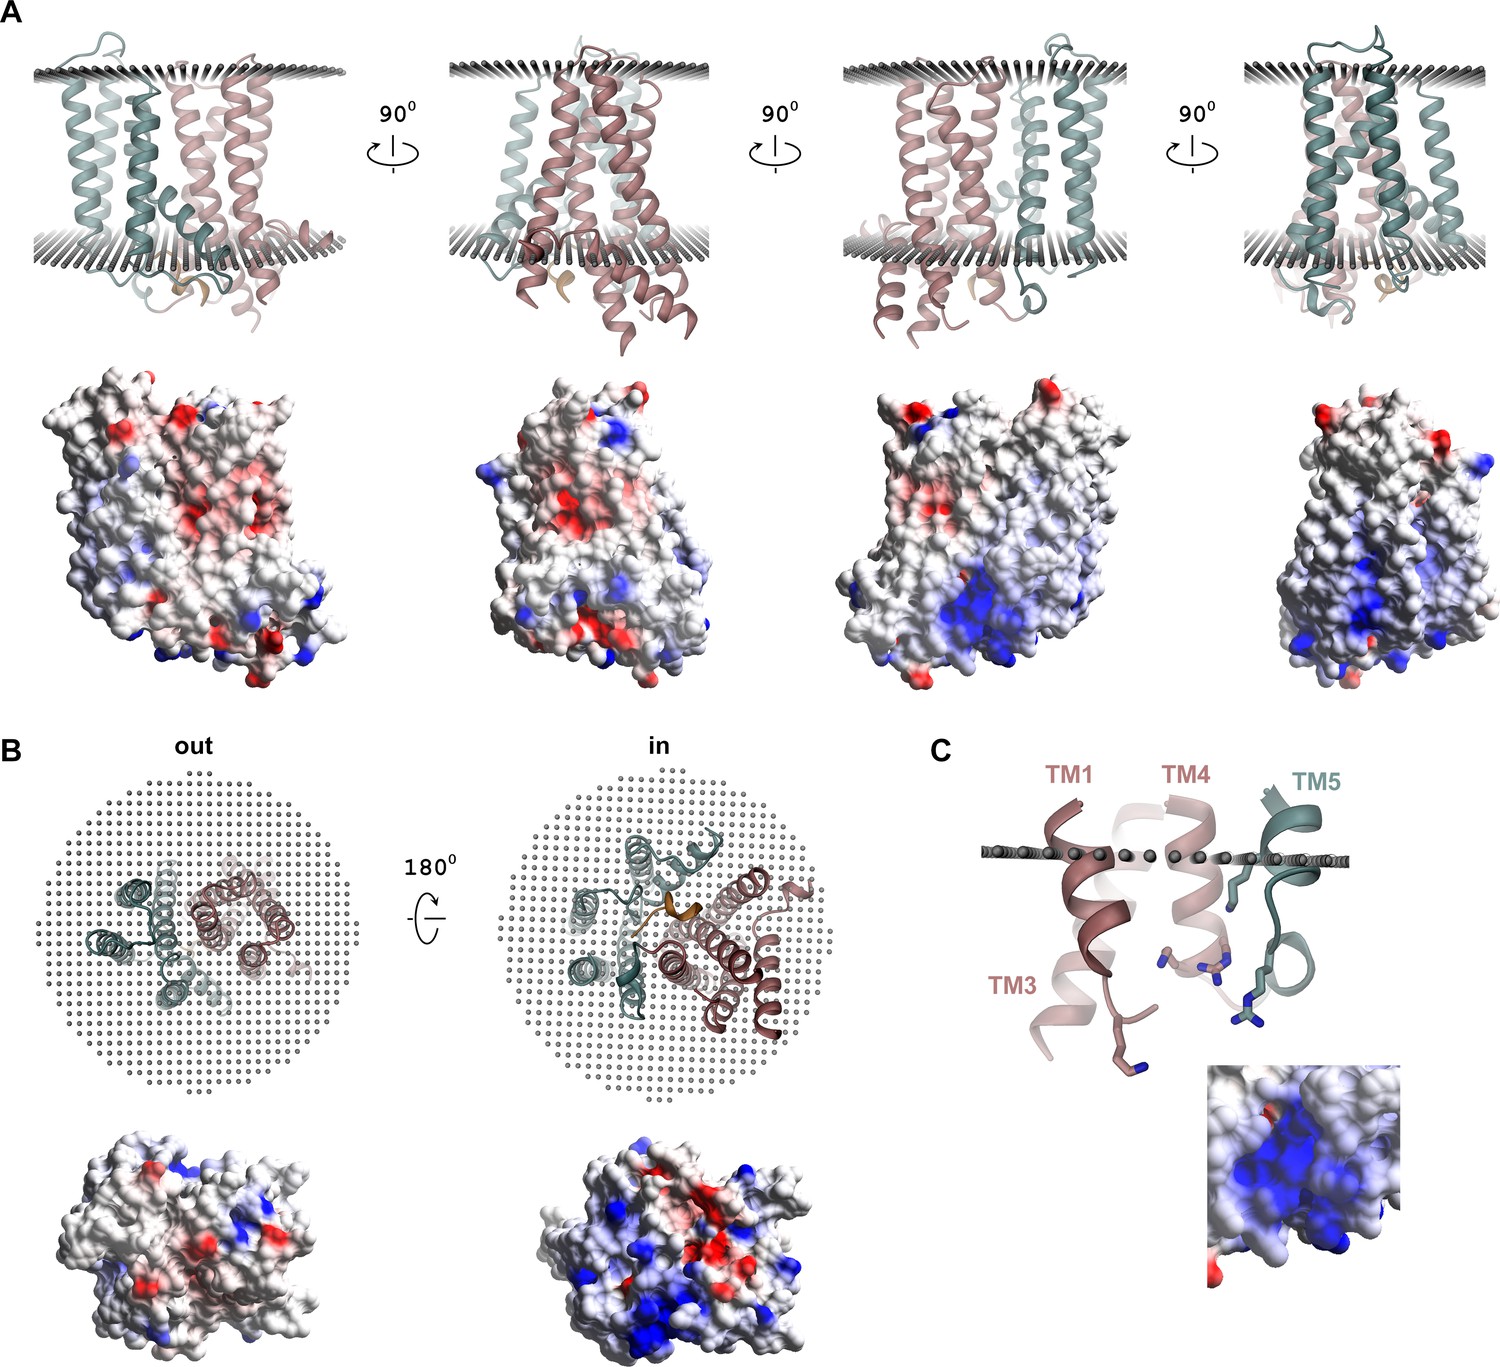
(A) Ribbon representation of different orientations of rXKR9 viewed from within the membrane (top) and electrostatic potential mapped on the molecular surface of rXKR9 (bottom). (B) Ribbon representation of rXKR9 (top) and electrostatic potential mapped on the molecular surface of rXKR9 (bottom) viewed from the extracellular side (out, left) and the cytoplasm (in, right). (C) Section of the intracellular loops containing a cluster of positively charged residues (shown as sticks) that could provide an interaction site with negatively charged lipids with inset showing a blow-up of the electrostatic potential mapped on its surrounding surface. The view is as in (A), third structure form the left. (A–C) Electrostatic potential calculated in Coot (Emsley and Cowtan, 2004) is mapped on the surface with the intensity of colors adjusted to its magnitude (red negative, blue positive).
Figure 6
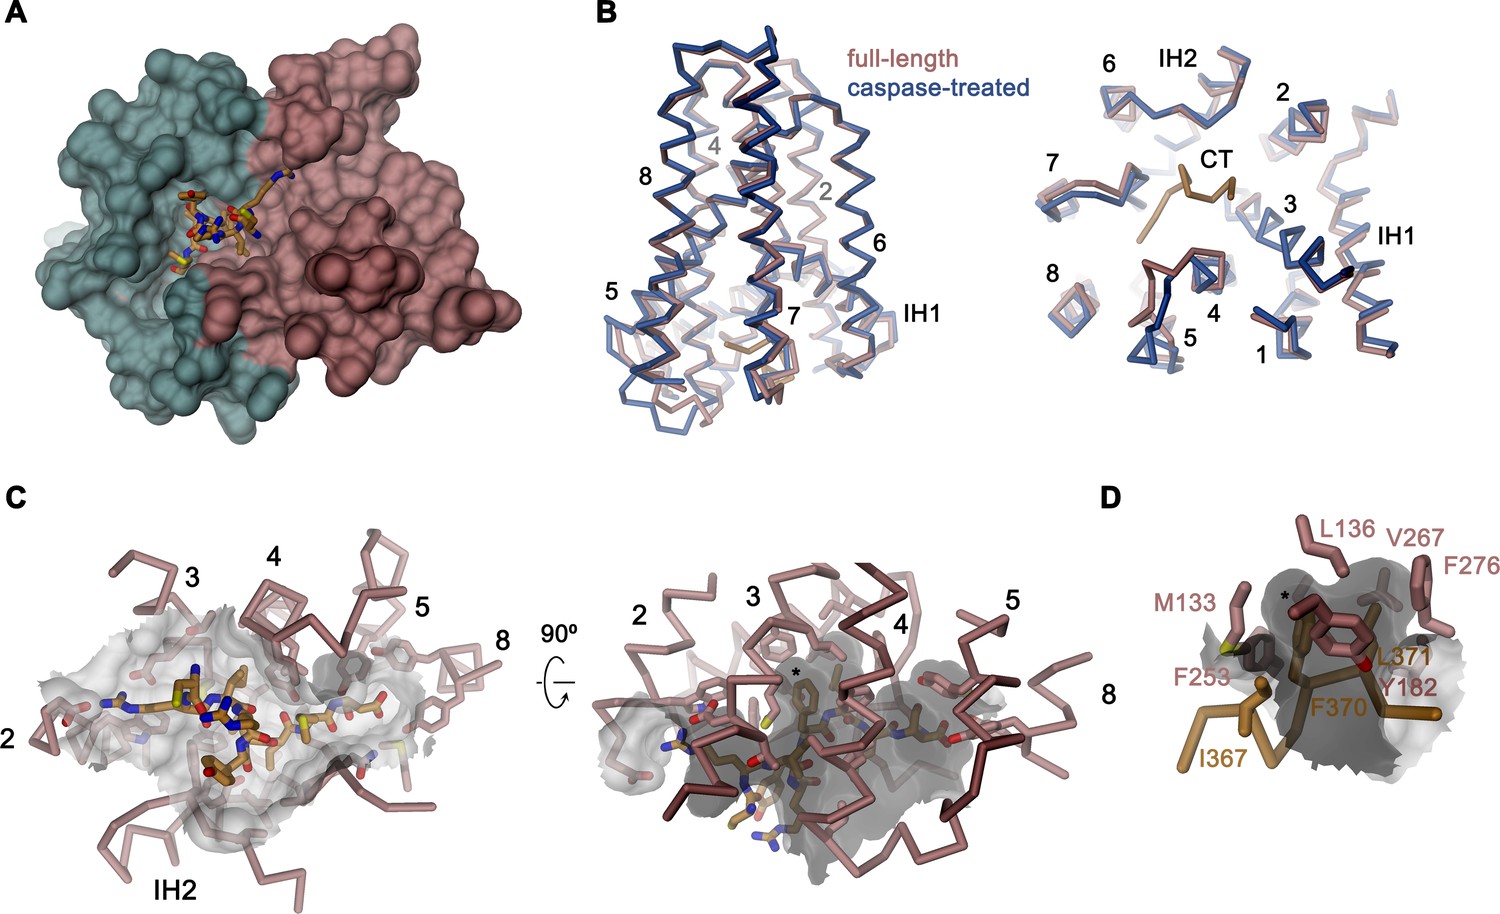
Binding site of the C-terminus.
(A) Binding of the C-terminus of rXKR9 to a cleft of the protein. rXKR9 excluding its C-terminus is shown as surface representation and colored as in Figure 4D. The C-terminal peptide (CT) defined in the structure is shown as stick model. (B) Superposition of the full-length and caspase-cleaved structures of rXKR9. Left, view from within the membrane. Right, view from the cytoplasm. (C) Interactions of the CT with residues lining its binding site in rXKR9. The relationship between views is indicated. (left, view from the cytoplasm, right, view from within the membrane). (D) Blow-up of hydrophobic residues of the CT with its binding site. (C, D) * marks position of F370. (B–D) protein is shown as Cα-trace with selected residues shown as sticks. Sections of the molecular surface are displayed. Membrane-spanning helices are indicated by numbers, IH1 and IH2 and CT and selected residues are labeled explicitly.
Author response image 1
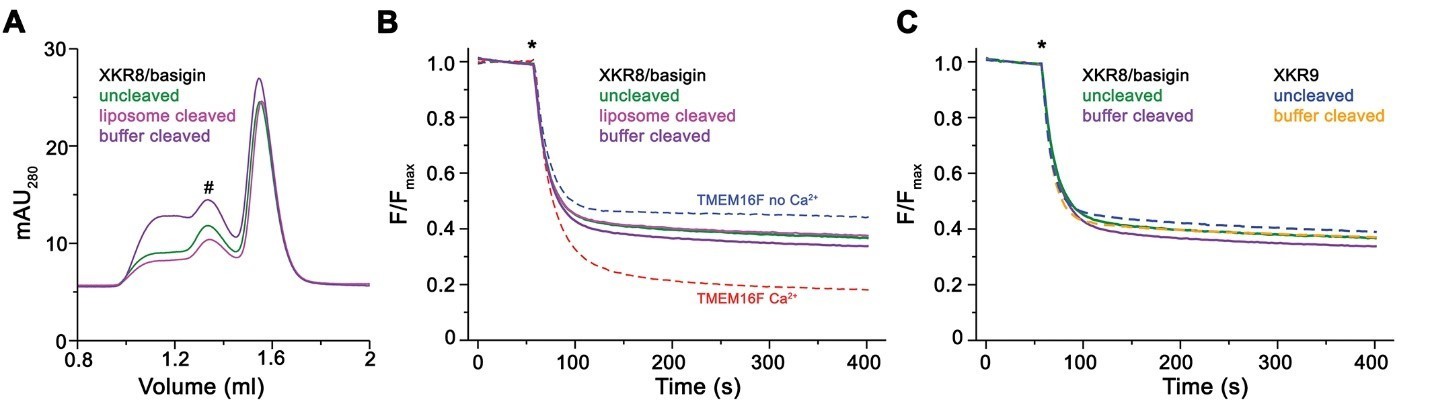
Lipid scrambling assay of the XKR8-basigin complex.
(A) Size exclusion chromatogram of proteins extracted from proteoliposomes containing a full-length reconstituted XKR8-basigin complex (uncleaved), the same proteoliposomes treated with caspase-3 added to the surrounding media (assuming that a fraction of the cleavage sites would be accessible from the outside, liposome cleaved) or protein that was incubated with caspase 3 in solution overnight prior to reconstitution (buffer cleaved). The peaks corresponding to the non-aggregated protein complex is indicated (#). (B) Assay to monitor the protein-catalyzed movement of fluorescent lipids between both leaflets of a bilayer. The addition of the reducing agent dithionite to the solution (*) is indicated. Traces of TMEM16F in absence and presence of 100 µM ca2+ are shown as controls for an inactive and active scramblase, respectively. No pronounced activity is observed in any of the samples with either full-length or caspase-3-treated XKR8-basigin proteoliposomes. (C) Traces of XKR8-basigin proteoliposomes shown in panel B in comparison to scrambling data of XKR9 shown in Figure 1D of the manuscript (dashed lines).
Author response image 2
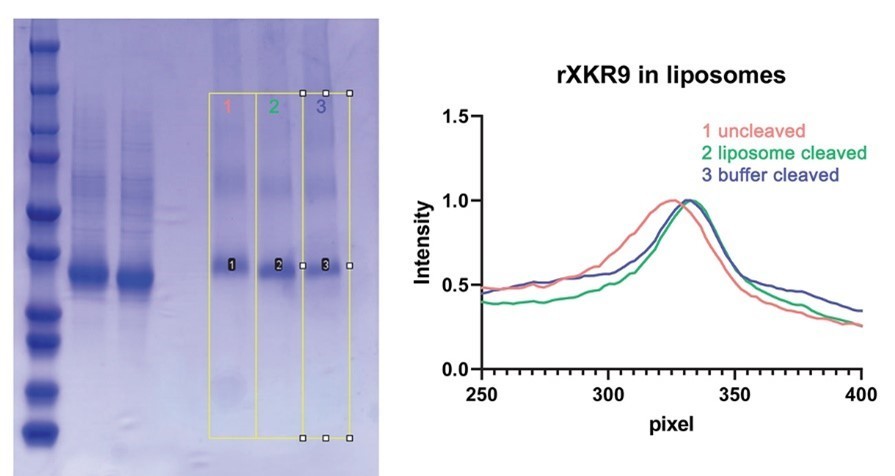
SDS PAGE gel showing mass differences between full-length and caspase-cleaved samples.
Left, SDS PAGE gel of full-length and caspase-3 treated samples with the integrated lanes numbered and indicated by yellow boxes. Right, integrated density of the gel along the direction of migration. These bands are also displayed in Figure 1C of the manuscript. The difference in the migration of uncleaved samples (red) and cleaved samples (blue, green) is apparent.
Tables
Table 1
Cryo-EM data collection, refinement, and validation statistics.
| Dataset 1 rXkr9 (EMDB-13155) (PDB 7P14) | Dataset 2 rXkr9 caspase −3 cleaved (EMDB-13157) (PDB 7P16) | Dataset 3 hXkr8+hBSG | |
|---|---|---|---|
| Data collection and processing | |||
| Microscope | FEI Titan Krios | FEI Titan Krios | Polara |
| Camera | Gatan K3 GIF | Gatan K3 GIF | Gatan K2 |
| Magnification | 130,000 | 130,000 | 130,000 |
| Voltage (kV) | 300 | 300 | 300 |
| Electron exposure (e–/Å2) | 70 | 70 | 35 |
| Defocus range (μm) | −1.0 to −2.4 | −1.0 to −2.4 | −0.8 to −2.5 |
| Pixel size * (Å) | 0.651 (0.3255) | 0.651 (0.3255) | 1.34 |
| Initial number of micrographs (no.) | 12,396 | 14,929 | 2212 |
| Initial particle images (no.) | 6,252,082 | 8,302,932 | 465,373 |
| Final particle images (no.) | 866,439 | 444,358 | 54,519 |
| Symmetry imposed | C1 | C1 | C1 |
| Map resolution (Å) FSC threshold | 3.66 0.143 | 4.3 0.143 | 15.3 0.143 |
| Map resolution range (Å) | 3.0–6.0 | 3.7–7.0 | |
| Refinement | |||
| Model resolution (Å) FSC threshold | 3.7 0.5 | 4.3 0.5 | |
| Map sharpening b-factor (Å2) | −199.6 | −229.9 | |
| Model vs Map CC (mask) | 0.76 | 0.74 | |
| Model composition Non-hydrogen atoms Protein residues Ligand | 3796 456 PLC, P5S | 3621 445 PLC | |
| B factors (Å2) Protein Ligand | 53.43 47.62 | 68.75 49.33 | |
| R.m.s. deviations Bond lengths (Å) Bond angles (°) | 0.003 0.533 | 0.002 0.453 | |
| Validation MolProbity score Clashscore Poor rotamers (%) | 1.54 7.45 0.00 | 1.51 7.29 0.00 | |
| Ramachandran plot Favored (%) Allowed (%) Disallowed (%) | 97.3 2.7 0.00 | 97.48 2.52 0.00 |
-
*Values in parentheses indicate the pixel size in super-resolution.
Key resources table
| Reagent type (species) or resource | Designation | Source or reference | Identifiers | Additional information |
|---|---|---|---|---|
| Cell line (human) | HEK239T | ATCC | CRL-3216 | RRID:CVCL_0063 |
| Cell line (human) | HEK293S GnTI- | ATCC | CRL-3022 | RRID:CVCL_A785 |
| Cell line (human) | mTMEM16F HEK293T | Alvadia et al., 2019 | NA | |
| Chemical compound, drug | 18:1 06:0 NBD-PE | Avanti Polar Lipids | 810155C | |
| Chemical compound, drug | 18:1 06:0 NBD-PS | Avanti Polar Lipids | 810194C | |
| Chemical compound, drug | 1-palmitoyl-2-oleoyl-sn-glycero-3-phospho-(1'rac-glycerol) (18:1 06:0 POPG) | Avanti Polar Lipids | 840457C | |
| Chemical compound, drug | 1-palmitoyl-2-oleoyl-sn-glycero-3-phosphocholine (18:1 06:0 POPC) | Avanti Polar Lipids | 850457C | |
| Chemical compound, drug | 1-palmitoyl-2-oleoyl-sn-glycero-3-phosphoethanolamine (18:1 06:0 POPE) | Avanti Polar Lipids | 850757C | |
| Chemical compound, drug | Benzamidine | Sigma | B6506 | |
| Chemical compound, drug | Biotin | Sigma | B4501 | |
| Chemical compound, drug | Calcium nitrate tetrahydrate | Sigma | C4955 | |
| Chemical compound, drug | CHAPS | Sigma | C3023 | |
| Chemical compound, drug | Chloramphenicol | Sigma | C1919 | |
| Chemical compound, drug | Chloroform | Fluka | 25690 | |
| Chemical compound, drug | Cholesterol | Sigma | C3045 | |
| Chemical compound, drug | cOmplete, EDTA-free Protease Inhibitor Cocktail | Roche | 5056489001 | |
| Chemical compound, drug | D-Desthiobiotin | Sigma | D1411 | |
| Chemical compound, drug | DDM | Anatrace | D310S | |
| Chemical compound, drug | Diethyl ether | Sigma | 296082 | |
| Chemical compound, drug | Digitonin High Purity | Merck Millipore | 300410 | |
| Chemical compound, drug | DNase I | AppliChem | A3778 | |
| Chemical compound, drug | DTT | ThermoFisher Scientific | R0861 | |
| Chemical compound, drug | Dulbecco's modified Eagle's medium - high glucose | Gibco, ThermoFisher Scientific | 41966029 | |
| Chemical compound, drug | Etyleneglycol - bis (2 - aminoethylether) - N,N,N′,N′- tetraacetic acid | Sigma | E3889 | |
| Chemical compound, drug | Fetal bovine serum | Sigma | F7524 | |
| Chemical compound, drug | GDN | Anatrace | GDN101 | |
| Chemical compound, drug | Glycerol 99% | Sigma | G7757 | |
| Chemical compound, drug | HCl | Merck Millipore | 1.00319.1000 | |
| Chemical compound, drug | HEPES | Sigma | H3375 | |
| Chemical compound, drug | HyClone HyCell TransFx-H medium | Cytiva | SH30939.02 | |
| Chemical compound, drug | Imidazole | Roth | X998.4 | |
| Chemical compound, drug | Kolliphor P188 | Sigma | K4894 | |
| Chemical compound, drug | L-(+)-arabinose | Sigma | A3256 | |
| Chemical compound, drug | Lauryl-maltose-neopentyl glycol (LMNG) | Anatrace | NG310 | |
| Chemical compound, drug | Leupeptin | AppliChem | A2183 | |
| Chemical compound, drug | L-glutamine | Sigma | G7513 | |
| Chemical compound, drug | Penicillin–streptomycin | Sigma | P0781 | |
| Chemical compound, drug | Pepstatin | AppliChem | A2205 | |
| Chemical compound, drug | Phosphate buffered saline | Sigma | D8537 | |
| Chemical compound, drug | PMSF | Sigma | P7626 | |
| Chemical compound, drug | Polyethyleneimine MAX 40 kDa | PolySciences Inc | 24765–1 | |
| Chemical compound, drug | Potassium chloride | Sigma | 746346 | |
| Chemical compound, drug | Sodium chloride | Sigma | 71380 | |
| Chemical compound, drug | Sodium dithionite (Sodium hydrosulfite) | Sigma | 157953 | |
| Chemical compound, drug | Soybean Polar Lipids | Avanti Polar Lipids | 541602C | |
| Chemical compound, drug | TCEP | Hampton | HR2-651 | |
| Chemical compound, drug | Terrific broth | Sigma | T9179 | |
| Chemical compound, drug | Tetracycline hydrochloride | Sigma | T7660 | |
| Chemical compound, drug | Tris | AppliChem | A1379 | |
| Chemical compound, drug | Valproic acid | Sigma | P4543 | |
| Commercial assay or kit | 4–20% Mini-PROTEAN TGX Precast Protein Gels, 15-well, 15 µl | BioRad Laboratories | 4561096DC | |
| Commercial assay or kit | Amicon Ultra-4 Centrifugal Filters Ultracel 10K, 4 ml | Merck Millipore | UFC801096 | |
| Commercial assay or kit | Amicon Ultra-4 Centrifugal Filters Ultracel 50K, 4 ml | Merck Millipore | UFC805096 | |
| Commercial assay or kit | Amicon Ultra-4 Centrifugal Filters Ultracel 100K, 4 ml | Merck Millipore | UFC810024 | |
| Commercial assay or kit | Biobeads SM-2 adsorbents | BioRad Laboratories | 152–3920 | |
| Commercial assay or kit | EZ-link NHS-PEG4-biotin | ThermoFisher Scientific | A39259 | |
| Commercial assay or kit | MiniExtruder | Avanti Polar Lipids | 610023 | |
| Commercial assay or kit | Ni-NTA resin | ABT Agarose Bead Technologies | 6BCL-NTANi-X | |
| Commercial assay or kit | Nunc 384-well plate MaxiSorp | ThermoFisher Scientific | 460372 | |
| Commercial assay or kit | PC membrane 0.2 μm | Avanti Polar Lipids | 610006 | |
| Commercial assay or kit | PD-10 desalting column | Sigma | GE17-0851-01 | |
| Commercial assay or kit | Pierce Streptavidin Plus UltraLink Resin | ThermoFisher Scientific | 53117 | |
| Commercial assay or kit | QuantiFoil R1.2/1.3 Au 200 mesh | Electron Microscopy Sciences | Q2100AR1.3 | |
| Commercial assay or kit | Silver Stain Plus | BioRad Laboratories | 161–0449 | |
| Commercial assay or kit | SRT-10C SEC 100 | Sepax Technologies | 239100–10030 | |
| Commercial assay or kit | Strep-Tactin Superflow high capacity 50% suspension | IBA LifeSciences | 2-1208-010 | |
| Commercial assay or kit | Superdex 200 10/300 GL | Cytiva | 17517501 | |
| Commercial assay or kit | Superdex 200 Increase 3.2/300 | Cytiva | 28990946 | |
| Commercial assay or kit | Superdex 200 Increase 5/150 GL | Cytiva | 28990945 | |
| Commercial assay or kit | Superdex 75 10/300 GL | Cytiva | 17517401 | |
| Commercial assay or kit | Superose 6 10/300 GL | Cytiva | 17517201 | |
| Commercial assay or kit | Superose 6 Increase 5/150 | Cytiva | 29091597 | |
| Commercial assay or kit | Ultrafree MC GV 0.22 μm centrifugal filter | Merck Millipore | UFC30GVNB | |
| Commercial assay or kit | Ultrafree - MC -HV, DURAPORE PVDF 0.1 μm | Merck Millipore | UFC30VV00 | |
| Other | BioQuantum Energy Filter | Gatan | NA | |
| Other | Fluoromax spectrometer | Horiba | NA | |
| Other | HPL6 | Maximator | NA | |
| Other | K2 Summit Direct Detector | Gatan | NA | |
| Other | K3 Summit Direct Detector | Gatan | NA | |
| Other | qPCR machine Mx3005p | Agilent | NA | |
| Other | Sybody library | Generous gift from the Seeger laboratory | NA | |
| Other | Tecnai G2 Polara | ThermoFisher Scientific | NA | |
| Other | Titan Krios G3i | ThermoFisher Scientific | NA | |
| Other | UT-rEX Refractometer | Wyatt Technology | NA | |
| Other | Viber Fusion FX7 imaging system | Witec | NA | |
| Other | Vitrobot Mark IV | ThermoFisher Scientific | NA | |
| Other | μDAWN MALS Detector | Wyatt Technology | NA | |
| Recombinant DNA reagent | human Basigin open reading frame | GenScript | HUMBSG | |
| Recombinant DNA reagent | human Xkr8 open reading frame | GenScript | NM_018053 | |
| Recombinant DNA reagent | Mammalian expression vector with C-terminal 3C cleavage site, GFP-tag and myc-tag | Dutzler laboratory | NA | |
| Recombinant DNA reagent | Mammalian expression vector with N-terminal streptavidin binding peptide, myc-tag and 3C cleavage site | Dutzler laboratory | NA | |
| Recombinant DNA reagent | Mammalian expression vector with N-terminal streptavidin binding peptide, myc-tag, Venus-tag and 3C cleavage site | Dutzler laboratory | NA | |
| Recombinant DNA reagent | Mouse mTMEM16F open reading frame | Dharmacon - Horizon Discovery | GenBank#BC060732 | |
| Recombinant DNA reagent | pSb_init | Generous gift from the Seeger laboratory | RRID:addgene_110100 | |
| Recombinant DNA reagent | rat basigin open reading frame | GenScript | NM_012783 | |
| Recombinant DNA reagent | rat XKR9 open reading frame | GenScript | NM_001012229 | |
| Peptide, recombinant protein | HRV 3C protease | Expressed (pET_3C) and purified in Dutzler laboratory | NA | |
| Peptide, recombinant protein | Human Caspase-3, recombinant | BioVision | 1083 | |
| Peptide, recombinant protein | Streptavidin | Expressed and purified in Dutzler laboratory | NA | |
| Software, algorithm | 3DFSC | Tan et al., 2017 | https://3dfsc.salk.edu/ | |
| Software, algorithm | ASTRA7.2 | Wyatt Technology | https://www.wyatt.com/products/software/astra.html | RRID:SCR_016255 |
| Software, algorithm | Chimera v.1.15 | Pettersen et al., 2004 | https://www.cgl.ucsf.edu/chimera/ | RRID:SCR_004097 |
| Software, algorithm | ChimeraX v.1.1.1 | Pettersen et al., 2021 | https://www.rbvi.ucsf.edu/chimerax/ | RRID:SCR_015872 |
| Software, algorithm | Coot v.0.9.4 | Emsley and Cowtan, 2004 | https://www2.mrc-lmb.cam.ac.uk/personal/pemsley/coot/ | RRID:SCR_014222 |
| Software, algorithm | cryoSPARC v.3.0.1/v.3.2.0 | Structura Biotechnology Inc | https://cryosparc.com/ | RRID:SCR_016501 |
| Software, algorithm | DINO | http://www.dino3d.org | RRID:SCR_013497 | |
| Software, algorithm | EPU2.9 | ThermoFisher Scientific | NA | |
| Software, algorithm | Codon optimization tool | Integrated DNA technologies | https://eu.idtdna.com/pages/tools/codon-optimization-tool | |
| Software, algorithm | Phenix | Liebschner et al., 2019 | https://www.phenix-online.org/ | RRID:SCR_014224 |
| Software, algorithm | RELION 3.0.7 | Zivanov et al., 2018 | https://www3.mrc-lmb.cam.ac.uk/relion/ | RRID:SCR_016274 |
| Software, algorithm | SerialEM3.7 | Mastronarde, 2005 | https://bio3d.colorado.edu/SerialEM/ | |
| Software, algorithm | WEBMAXC calculator | Bers et al., 2010 | https://somapp.ucdmc.ucdavis.edu/pharmacology/bers/ maxchelator/webmaxc/webmaxcS.htm | RRID:SCR_018807 |
| Strain | E. coli MC1061 | ThermoFisher Scientific | C66303 |
Additional files
-
Source data 1
Cumulated source data.
- https://cdn.elifesciences.org/articles/69800/elife-69800-data1-v2.xlsx
-
Transparent reporting form
- https://cdn.elifesciences.org/articles/69800/elife-69800-transrepform-v2.docx
Download links
A two-part list of links to download the article, or parts of the article, in various formats.
Downloads (link to download the article as PDF)
Open citations (links to open the citations from this article in various online reference manager services)
Cite this article (links to download the citations from this article in formats compatible with various reference manager tools)
Cryo-EM structures of the caspase-activated protein XKR9 involved in apoptotic lipid scrambling
eLife 10:e69800.
https://doi.org/10.7554/eLife.69800


